data quality evaluation methods - · pdf filedata quality evaluation methods . international...
TRANSCRIPT
Data Quality Evaluation Methods
International SEMATECH Manufacturing Initiative Technology Transfer #08074943A-ENG
© 2008 International SEMATECH Manufacturing Initiative, Inc.
Advanced Materials Research Center, AMRC, International SEMATECH Manufacturing Initiative, and ISMI are servicemarks of SEMATECH, Inc. SEMATECH and the SEMATECH logo are registered servicemarks
of SEMATECH, Inc. All other servicemarks and trademarks are the property of their respective owners.
Data Quality Evaluation Methods Technology Transfer #08074943A-ENG
International SEMATECH Manufacturing Initiative July 24, 2008
Abstract: This report from the MFGM031M project defines a method for addressing potential equipment data quality issues. It includes steps for both qualitative and quantitative evaluations of data provided by manufacturing equipment. This methodology can be applied by the original equipment manufacturer (OEM) and/or the IC maker.
Keywords: Data Quality, Data Management Standards, Procedures
Authors: Gino Crispieri
Approvals: Gino Crispieri, Author Harvey Wohlwend, Project Manager Olaf Rothe, Program Manager Joe Draina, Director Laurie Modrey, Technology Transfer Team Leader

iii
ISMI Technology Transfer #08074943A-ENG
Table of Contents
1 EXECUTIVE SUMMARY .....................................................................................................1 2 BACKGROUND.....................................................................................................................1 3 DATA QUALITY COMMUNICATION AND EVALUATION APPROACH .......................2 4 REFERENCE DOCUMENTS ................................................................................................3
4.1 SEMI Standards ..............................................................................................................3 4.2 Other References.............................................................................................................3
5 TERMINOLOGY....................................................................................................................4 5.1 Acronyms and Abbreviations..........................................................................................4
6 EVALUATION METHODOLOGY........................................................................................4 6.1 Qualitative Evaluation.....................................................................................................4
6.1.1 Documentation ....................................................................................................5 6.1.2 SEMI Standards Conformance............................................................................5 6.1.3 Interface Software Defects..................................................................................5 6.1.4 Data Reporting ....................................................................................................6 6.1.5 Timestamps .........................................................................................................6 6.1.6 Qualitative Evaluation Process Flow ..................................................................6 6.1.7 Example of Qualitative Defect Data ...................................................................8 6.1.8 Qualitative Evaluation Results............................................................................9
6.2 Quantitative Evaluation.................................................................................................10 6.2.1 Data Collection Interface ..................................................................................11 6.2.2 Data Collection Mechanism..............................................................................11 6.2.3 Data Protocol.....................................................................................................12 6.2.4 Data Format.......................................................................................................12 6.2.5 Data Units .........................................................................................................12 6.2.6 Data Order.........................................................................................................13 6.2.7 Data Accuracy...................................................................................................13 6.2.8 Data Precision ...................................................................................................13 6.2.9 Data Frequency .................................................................................................14 6.2.10 Data Latency .....................................................................................................14 6.2.11 Quantitative Evaluation Process Flow ..............................................................16 6.2.12 Example of a Parameter Specification ..............................................................17 6.2.13 Quantitative Evaluation Results........................................................................18
7 CONCLUSION .....................................................................................................................19

iv
Technology Transfer #08074943A-ENG ISMI
List of Figures
Figure 1 Qualitative Evaluation Process Flow .........................................................................7 Figure 2 Equipment Metadata from a Tool Supplier ..............................................................10 Figure 3 Data Usability Attributes and Elements ...................................................................11 Figure 4 Quantitative Data Evaluation Process Flow.............................................................16
List of Tables
Table 1 Qualitative Data Evaluation Defects Table ................................................................8 Table 2 Qualitative Data Evaluation Result Table ..................................................................9 Table 3 Data Quality Parameter Specification Table ............................................................15 Table 4 Example of a Parameter Specification Table............................................................17 Table 5 Example of a Data Quality Evaluation Results Table ..............................................18
1
ISMI Technology Transfer #08074943A-ENG
1 EXECUTIVE SUMMARY As the industry moves toward e-Manufacturing, the data each piece of equipment generates is critical to improving equipment productivity. As more data become available for applications like advanced process control (APC), fault detection and classification (FDC), e-Diagnostics, and others, data quality must be assured. Incomplete or inaccurate data will lead to poor decisions that may affect the factory’s operations. Equipment data must be provided with sufficient accuracy, precision, sampling frequency, and other data quality characteristics to ensure high fidelity extraction of relevant data features for process/equipment characterization, fault detection, failure diagnosis, or process control. Event data and context information must be complete and consistent; it must reflect the actual time of and conditions pertaining to the occurrence of the indicated event. This document defines a methodology that can be applied by the original equipment manufacturer (OEM) and/or the IC maker to identify or evaluate data quality issues based on the International SEMATECH Manufacturing Initiative (ISMI) Data Quality Guidelines and the terms and definitions proposed by the new SEMI 4613, Guide for Communicating Data Quality Requirements.
2 BACKGROUND An ISMI-led Data Quality Working Group developed a set of guidelines and gathered a list of common data quality problems encountered today in semiconductor equipment. This effort grew out of an industry need to specify requirements for the quality of data produced by tools to support applications such as process control systems and e-Diagnostics. Users reported many problems with the availability, accuracy, timeliness, reliability, and other aspects of data quality from manufacturing equipment.
The lack of common reference points and definitions of what constitutes data quality has been an obstacle to progress in this area. Data quality is not just the result of the accuracy and handling of sensor or derived data. The quality of data is subject to degradation from a wide variety of outside sources. Environmental factors, for example, ranging from climate and temperature, to transient factory network traffic loading can have a profound impact on the apparent quality of data. Furthermore, these outside factors are essentially difficult to pinpoint and evaluate. Their contribution to the degradation of data quality can be hard to quantify. Determining if the right data are being requested and used or determining what data should be available from the equipment and at what level are outside the scope of this document.
This document defines a method for addressing potential equipment data quality issues. It includes steps for both qualitative and quantitative evaluations of data provided by manufacturing equipment. ISMI believes that with a standardized evaluation methodology the industry will be able to address any data quality issues the equipment may have. ISMI expects to use this methodology to further improve equipment reliability, availability, and efficiency.
2
Technology Transfer #08074943A-ENG ISMI
3 DATA QUALITY COMMUNICATION AND EVALUATION APPROACH The approach to data quality evaluation begins with a qualitative followed by the quantitative evaluation using the concepts defined in ISMI Technology Transfer #07024843C-ENG (Data Quality Guidelines) and SEMI 4613 (Guide for Communicating Data Quality Requirements).1 The evaluation method(s) are associated with all data used for controlling (control variables/signals sensor values, control variables/signals, events) and monitoring (tool health) reported or available from the equipment through the SECS/GEM and/or equipment data acquisition (EDA) interface. The data quality items addressed in this document include, but are not limited to, other aspects and attributes of data quality as defined in SEMI 4613.
The data forms are related to
• Commands/Responses/Event/Alarm data
• Measured, reported, or context data
The data quality aspects include
• Availability
• Interpretability
• Usability
The data quality attributes include
• Interface
• Mechanism
• Protocol
• Format
• Units
• Order
• Accuracy
• Precision
• Frequency
• Latency
1 It is recommended that the user of this document be familiar with both documents. See Section 4 for additional detail about
them.

3
ISMI Technology Transfer #08074943A-ENG
4 REFERENCE DOCUMENTS
4.1 SEMI Standards The following standards are applicable to this document.
SEMI E5 – SEMI Equipment Communications Standard (SECS-II)
SEMI E30 – Generic Model for Communications and Control of SEMI Equipment (GEM)
SEMI E40 – Standard for Processing Management (PM)
SEMI E79 – Definition and Measurement of Equipment Productivity
SEMI E87 – Provisional Specification for Carrier Management (CMS)
SEMI E90 – Substrate Tracking (STS)
SEMI E89 – Guide for Measurement System Analysis (MSA)
SEMI E116 – Equipment Performance Tracking (EPT)
SEMI E120 – Specification for the Common Equipment Model (CEM)
SEMI E125 – Specification for Equipment Self Description (EqSD)
SEMI E128 – XML Messaging Standard (XMS)
SEMI E132 – Specification for Equipment Client Authentication and Authorization
SEMI E134 – Specification for Data Collection Management (DCM)
SEMI E145 – Classification for Measurement Unit Symbols in XML
SEMI E147 – Guide for Equipment Data Acquisition (EDA)
SEMI E148 – Specification for Time Synchronization and Definition of the Clock Object
SEMI 4613 – Guide for Communicating Data Quality Requirements
4.2 Other References
[1] SEMATECH, Technology Transfer #07024843C-ENG, Data Quality Guidelines.
[2] Guide to the Expression of Uncertainty in Measurement, International Organization for Standardization (ISO), Switzerland, 1993
[3] SEMATECH, Technology Transfer #06094781B-ENG, Factory and Equipment Clock Synchronization and Time-Stamping Guidelines.
4
Technology Transfer #08074943A-ENG ISMI
5 TERMINOLOGY ISMI’s Data Quality Guidelines and SEMI 4613 include all terms and definitions related to data quality as presented in this document. Refer to these two documents for definitions and detailed information.
5.1 Acronyms and Abbreviations
ADC – Automatic Data Collection
ALID – Alarm Event Identifier
AMHS – Automated Material Handling System
APC – Advanced Process Control
CEID – Collection Event Identifier
ECCE – Equipment Client Connection Emulator
EIEU – Equipment Interface Emulator Utility
EPT – Equipment Performance Tracking
GEM – Generic Equipment Model
MES – Manufacturing Execution Systems
OEE – Overall Equipment Efficiency (SEMI E79)
SEMI – Semiconductor Equipment and Materials International
SECS-II – Semiconductor Equipment Communications Standards (SEMI E5)
SVID – System Variable Identifier
6 EVALUATION METHODOLOGY
The data quality evaluation methodology is designed to evaluate the equipment’s specified data by collecting and analyzing the requested data using a standard interface (i.e., SECS-II or EDA) using the proper evaluation tool. For this document, the focus will be limited to evaluating the native equipment data within the confines of the equipment boundaries or the information the supplier made available to the user. It concentrates on those areas of data quality that are qualitative and quantitative. These two areas are key to the measurement and evaluation of the data quality that the equipment provides. Failure to pass either of these two areas indicates poor data quality and immediate corrective action by the user and the supplier.
6.1 Qualitative Evaluation
The first step in the evaluation is to ensure that the equipment interface provides data (i.e., events, alarms, timestamps, and context) at a level of quality that will ensure accurate and successful evaluation of the quantitative portion of the data. Documentation, proper implementation of SEMI standards, equipment without software defects, robust data reporting, and proper time-stamping are key to the success of a complete data quality evaluation. The user

5
ISMI Technology Transfer #08074943A-ENG
and supplier must work together to correct any problems that are uncovered before proceeding with the quantitative evaluation.
6.1.1 Documentation If the equipment interface documentation, the manuals, or the software version in the equipment under evaluation does not match, knowing what data are available for collection or what the equipment is capable of executing and/or reporting will be difficult. The user will not be able to determine what data and which features are available to use. In some cases, if collection limits cannot be determined, trace reports cannot be executed. This happens when data are not updated in time or data are generated faster than the tool can report it.
Compared with EDA, the SECS-II interface depends more on the equipment interface documentation to discover the equipment capabilities because the EDA interface is self-descriptive according to the SEMI E125 metadata requirements. However, reporting limitations may still be encountered in both interfaces as a result of the equipment’s computer load or the actual software integration.
6.1.2 SEMI Standards Conformance During acceptance tests of the equipment into the factory, significant effort goes into verifying the equipment’s conformance with standards and its automation and equipment control behavior. Partially implemented standards can reduce the operational effectiveness of the factory by forcing the user to include manual steps or workaround steps to fill in the missing functionality. This issue can cause missing context information that may be critical. User-defined operational scenario testing is critical to the effective use of the equipment capabilities in daily factory operations and enhances factory efficiency.
Partially implemented standards affect the host view of the equipment. Often, the user must write special software to maintain the automation software at the same level of functionality as all the equipment installed in the factory. If the interface cannot report process or functional data with events as defined by GEM or other SEMI state machines, it becomes less effective and the user must expend extra effort to find context information elsewhere in the database or assume that the equipment actually used what the factory commanded to execute. This is typical with equipment that is unable to report recipe information, in particular the name of the recipe or the step being executed.
6.1.3 Interface Software Defects When the equipment has software defects, the equipment affects factory normal operations and forces the user to place additional tools to ensure that the equipment is functional and continues to report data normally. Some equipment processing can be affected by the user’s data collection request; e.g., data collection requests with a high collection rate cause the equipment to go down. Equipment in an idle or standby state can cause data values to zero or become invalid, affecting the collection of data for continuous monitoring and control. Data can be accurate through the graphic user interface (GUI), but not reported properly through the host interface. Data types may change (e.g., first reported as a string, next as a float). Software defects affect the execution of commands to retrieve or collect data, raising issues that affect the user’s effectiveness and efficiency to track processing and control product yields.
6
Technology Transfer #08074943A-ENG ISMI
6.1.4 Data Reporting Data reporting is sometimes viewed as a software defect but in actuality it is a lack of data availability in the interface implementation. When data reports cannot be used to correlate events, alarms, or process issues, the user must find a way to correct this by making a special request to the equipment supplier to include that type of information with the data reports. Reporting inaccurate data because identifiers are not updated in time for wafer level tracking, or making data available with the incorrect association is very common. This issue is mostly related to the linkage of the data from the internal equipment data base or internal memory. Associated with this type of defect are: data reported in wrong format (e.g., reported as strings when it should be float), missing data values, missing context data, data out of order (wafer complete before wafer start), lack of synchronization (particularly between subsystems that make the data available), and event latency. These types of problems usually caused by improper integration of the interface and the equipment detract the user from using the equipment efficiently.
6.1.5 Timestamps Timestamps and time-stamping are two areas that are easy to address and verify using common manufacturing or business practices. Equipment that complies with SEMI E30 and E5 provide mechanisms for setting the clock through the operating system or the S2F31,32 stream functions when using the SECS-II interface. Not setting the date and time can result in incorrect timestamps being reported. In addition to incorporating time-stamping practices in the factory and equipment, the user and supplier must verify that the data is time-stamped correctly and consistently. Timestamps should be placed at the time the data are sent, not when the request message is received. When possible, the equipment should time-stamp the data as closely as possible to the time the data are collected. For additional information, see Technology Transfer #06094781B-ENG (Factory and Equipment Clock Synchronization and Time-Stamping Guidelines).
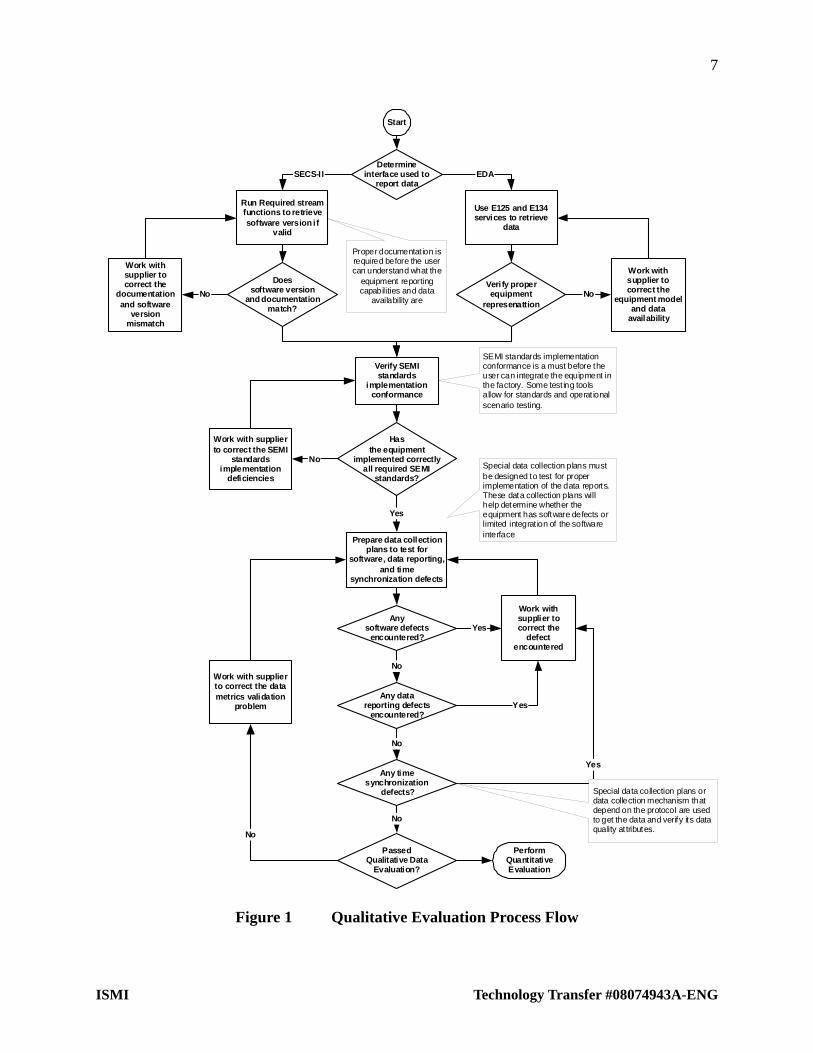
6.1.6 Qualitative Evaluation Process Flow When accepting a new piece of equipment into the factory or qualifying the equipment after a major software update, the user must determine the quality of the software interface and the data available for use. Figure 1 describes a simple process to ensure the equipment is ready for integration and quantitative data evaluation, as described in Figure 4.
7
Determineinterface used to
report data
Doessoftware version
and documentationmatch?
Verify properequipment
represenattion
Hasthe equipment
implemented correctlyall required SEMI
standards?
Work with supplierto correct the SEMI
standardsimplementation
deficiencies
Start
EDASECS-II
No
No
Anysoftware defects
encountered?
Prepare data collectionplans to test for
software, data reporting,and time
synchronization defects
No
Run Required streamfunctions to retrievesoftware version if
valid
Use E125 and E134services to retrieve
data
Yes
PassedQualitative Data
Evaluation?
NoWork with supplierto correct the datametrics validation
problem
No
Yes
Work withsupplier tocorrect the
defectencountered
Yes
PerformQuantitativeEvaluation
Proper documentat ion isrequired before the usercan understand what the
equipment reportingcapabilities and data
availability are
SEMI standards implementationconformance is a must before theuser can integrate the equipment inthe factory. Some test ing toolsallow for standards and operat ionalscenario testing.
Special data collection plans ordata collection mechanism thatdepend on the protocol are usedto get the data and verify its dataquality at tributes.
Work withsupplier tocorrect the
documentationand software
versionmismatch
No
Work withsupplier tocorrect the
equipment modeland data
availability
Verify SEMIstandards
implementationconformance
Special data collection plans mustbe designed to test for properimplementation of the data reports.These data collection plans willhelp determine whether theequipment has software defects orlimited integrat ion of the softwareinterface
Any datareporting defects
encountered?Yes
Any timesynchronization
defects?
No
Figure 1 Qualitative Evaluation Process Flow
ISMI Technology Transfer #08074943A-ENG
8
Technology Transfer #08074943A-ENG ISMI
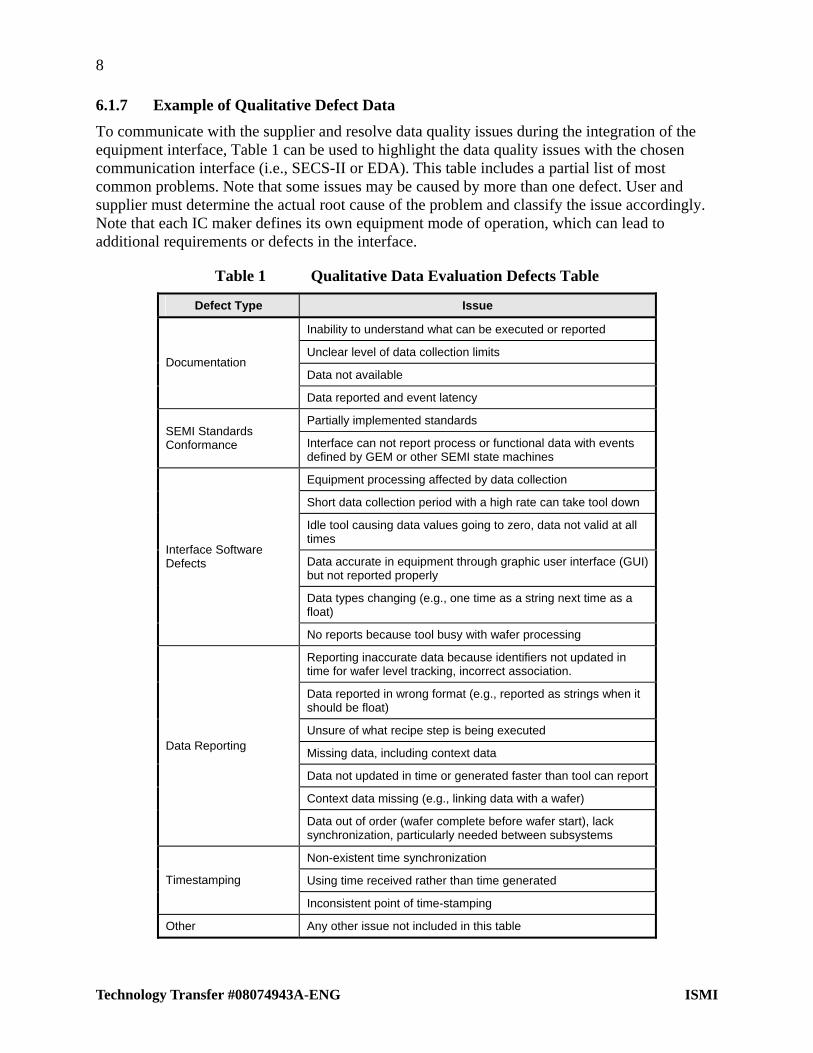
6.1.7 Example of Qualitative Defect Data To communicate with the supplier and resolve data quality issues during the integration of the equipment interface, Table 1 can be used to highlight the data quality issues with the chosen communication interface (i.e., SECS-II or EDA). This table includes a partial list of most common problems. Note that some issues may be caused by more than one defect. User and supplier must determine the actual root cause of the problem and classify the issue accordingly. Note that each IC maker defines its own equipment mode of operation, which can lead to additional requirements or defects in the interface.
Table 1 Qualitative Data Evaluation Defects Table
Defect Type Issue
Inability to understand what can be executed or reported
Unclear level of data collection limits
Data not available Documentation
Data reported and event latency
Partially implemented standards SEMI Standards Conformance Interface can not report process or functional data with events
defined by GEM or other SEMI state machines
Equipment processing affected by data collection
Short data collection period with a high rate can take tool down
Idle tool causing data values going to zero, data not valid at all times
Data accurate in equipment through graphic user interface (GUI) but not reported properly
Data types changing (e.g., one time as a string next time as a float)
Interface Software Defects
No reports because tool busy with wafer processing
Reporting inaccurate data because identifiers not updated in time for wafer level tracking, incorrect association.
Data reported in wrong format (e.g., reported as strings when it should be float)
Unsure of what recipe step is being executed
Missing data, including context data
Data not updated in time or generated faster than tool can report
Context data missing (e.g., linking data with a wafer)
Data Reporting
Data out of order (wafer complete before wafer start), lack synchronization, particularly needed between subsystems
Non-existent time synchronization
Using time received rather than time generated Timestamping
Inconsistent point of time-stamping
Other Any other issue not included in this table
9
ISMI Technology Transfer #08074943A-ENG
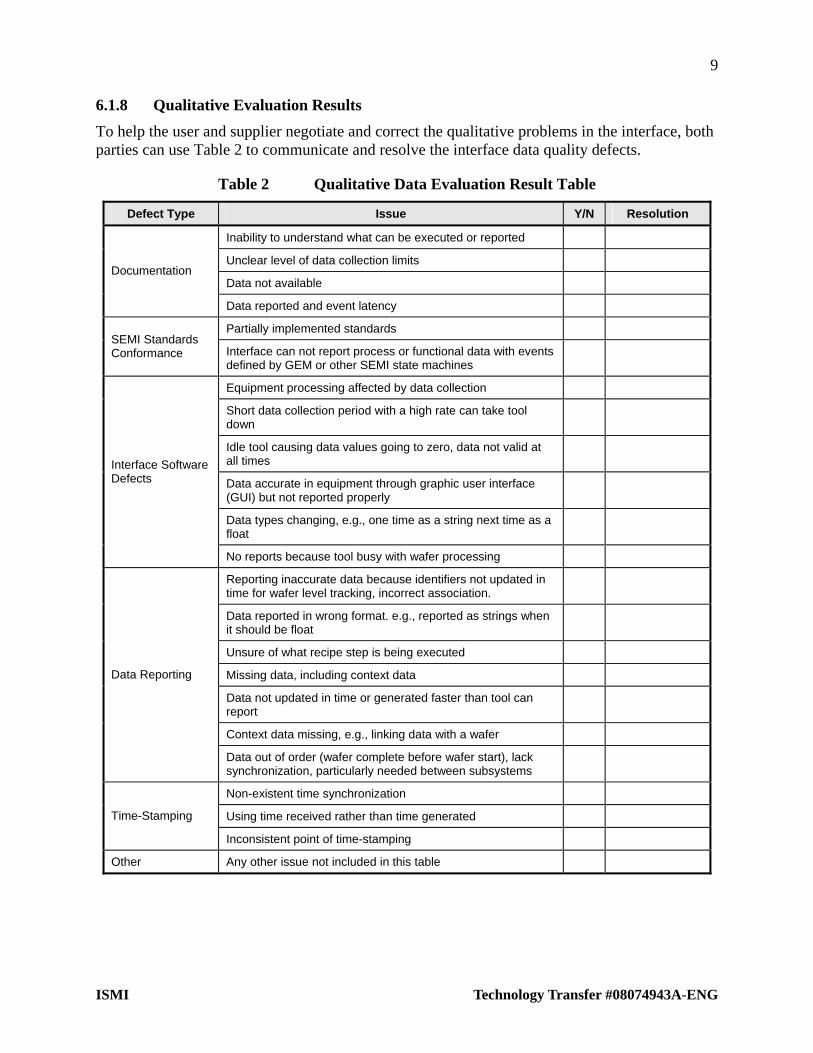
6.1.8 Qualitative Evaluation Results To help the user and supplier negotiate and correct the qualitative problems in the interface, both parties can use Table 2 to communicate and resolve the interface data quality defects.
Table 2 Qualitative Data Evaluation Result Table
Defect Type Issue Y/N Resolution
Inability to understand what can be executed or reported
Unclear level of data collection limits
Data not available Documentation
Data reported and event latency
Partially implemented standards SEMI Standards Conformance Interface can not report process or functional data with events
defined by GEM or other SEMI state machines
Equipment processing affected by data collection
Short data collection period with a high rate can take tool down
Idle tool causing data values going to zero, data not valid at all times
Data accurate in equipment through graphic user interface (GUI) but not reported properly
Data types changing, e.g., one time as a string next time as a float
Interface Software Defects
No reports because tool busy with wafer processing
Reporting inaccurate data because identifiers not updated in time for wafer level tracking, incorrect association.
Data reported in wrong format. e.g., reported as strings when it should be float
Unsure of what recipe step is being executed
Missing data, including context data
Data not updated in time or generated faster than tool can report
Context data missing, e.g., linking data with a wafer
Data Reporting
Data out of order (wafer complete before wafer start), lack synchronization, particularly needed between subsystems
Non-existent time synchronization
Using time received rather than time generated Time-Stamping
Inconsistent point of time-stamping
Other Any other issue not included in this table
10
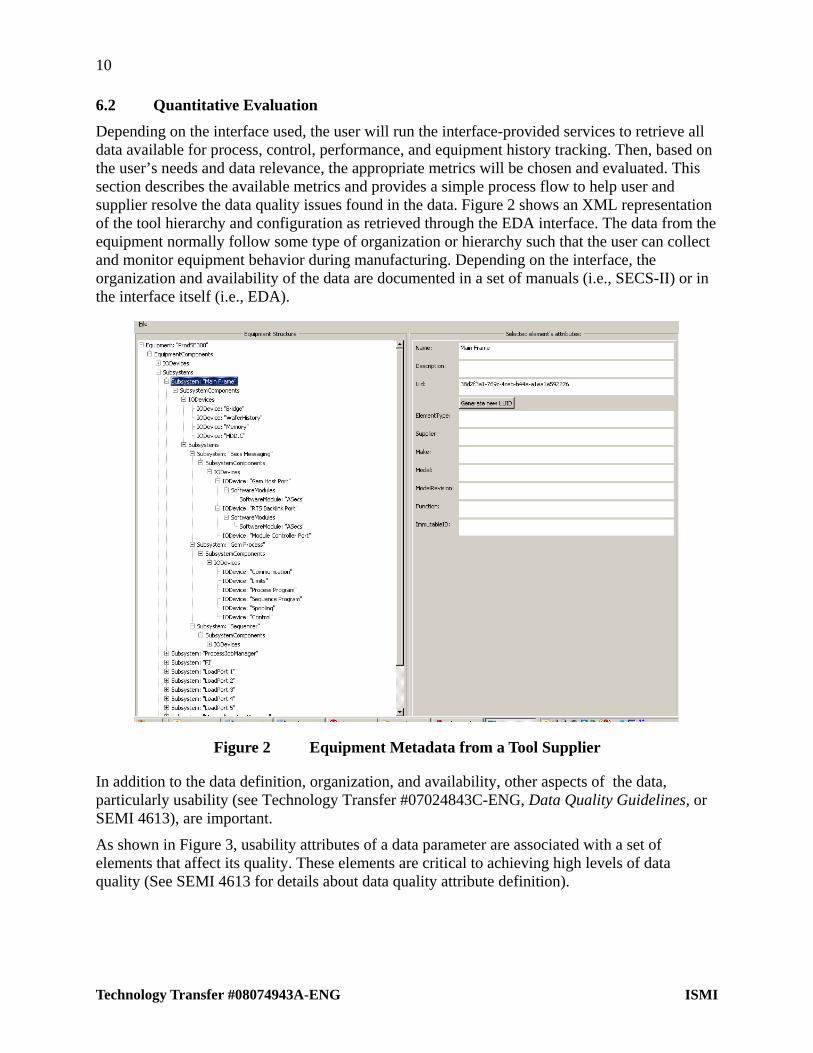
6.2 Quantitative Evaluation Depending on the interface used, the user will run the interface-provided services to retrieve all data available for process, control, performance, and equipment history tracking. Then, based on the user’s needs and data relevance, the appropriate metrics will be chosen and evaluated. This section describes the available metrics and provides a simple process flow to help user and supplier resolve the data quality issues found in the data. Figure 2 shows an XML representation of the tool hierarchy and configuration as retrieved through the EDA interface. The data from the equipment normally follow some type of organization or hierarchy such that the user can collect and monitor equipment behavior during manufacturing. Depending on the interface, the organization and availability of the data are documented in a set of manuals (i.e., SECS-II) or in the interface itself (i.e., EDA).
Figure 2 Equipment Metadata from a Tool Supplier
In addition to the data definition, organization, and availability, other aspects of the data, particularly usability (see Technology Transfer #07024843C-ENG, Data Quality Guidelines, or SEMI 4613), are important.
As shown in Figure 3, usability attributes of a data parameter are associated with a set of elements that affect its quality. These elements are critical to achieving high levels of data quality (See SEMI 4613 for details about data quality attribute definition).
Technology Transfer #08074943A-ENG ISMI

11
Accuracy Precision
Usabil ity
Repeatability ReproducibilityBias DriftMaxMin TransientResponse
Frequency Latency
ToolLatency
NetworkLatency
ApplicationLatency
SamplingRateResolution
Figure 3 Data Usability Attributes and Elements
6.2.1 Data Collection Interface The user must first be able to identify whether the needed data are available, the user has authorization access to the data, and the data are provided by the equipment. Some data may need to be available through a particular interface or method. For this purpose, a specific method or evaluation mechanism will need to be selected or used to assess the data quality. The evaluation artifact must be able to transmit commands/data, receive responses, and analyze its contents from the tool under evaluation. The interface capability of the data quality test tool (future) must support connection to SECS/GEM and/or EDA (Interface A).
6.2.2 Data Collection Mechanism For each parameter to be evaluated, the data collection mechanism must be specified as described below.
6.2.2.1 Using the SECS-II Interface If the interface is specified as SECS-II, then all SECS message stream/function code sets that can be used to access that parameter must be specified by providing the S#F# and the name of that request as specified in SEMI E5.
For example, the equipment supplier must provide the following set of messages:
• S1F3 – Equipment status
• S1F11 – Status variable name list request
• S2F23 – Trace data request
• S6F11 – Data collection report
• S7F5 – Process program upload (unformatted)
• S7F25 – Process program upload (formatted)
• S14F1 – Request object information
• S14F1 – Set object
6.2.2.2 Using the EDA Interface If the EDA interface is used, the equipment provides a metadata file which is requested by the user through SEMI E125 services. These services retrieve all data available in the equipment. The result of the query results in information that includes the equipment structure as shown in
ISMI Technology Transfer #08074943A-ENG

12
Technology Transfer #08074943A-ENG ISMI
Figure 2 as well as the state models, parameters, and exceptions available in the equipment. For additional information about the available services available from the EDA interface see SEMI E147, E134, or E125. The EDA interface provides additional services to access and retrieve data through collection reports or through ad hoc messages. There are no command services available from the interface to start, stop, or abort a process. Equipment commands are done through SECS-II or the actual user interface.
6.2.3 Data Protocol The data protocol provides the rules by which the data needs to be interpreted. It pertains to the formal structure/patterns in which something is expressed. To interpret the data it needs to have the correct syntax based on the protocol used to retrieve the data. In the case of SECS-II, the stream and function commands define the correct syntax to be sent and the structure expected with the response. In the same manner, EDA defines a set of elements which have to be included and exchanged when services and requests are issued by the evaluation artifact. Each message and service in SECS-II and EDA defines its syntax and these rules must be maintained in order for applications to interoperate. See the corresponding SEMI specifications to understand the message structure and its response to the requested data. Without interoperatibility it is not possible to proceed to the formal analysis of data quality. Sending and receiving messages and verifying their syntax can be done by using evaluation scripting tools like CCS Envoy, ECCE, EIEU, ConFy, etc. Once the requested service and its response are exchanged without a problem, the evaluation of the data can proceed by checking the data format provided by the supplier.
6.2.4 Data Format Semantics is the meaning or interpretation of a parameter when it is properly defined or when it includes information regarding its use and application. There is a great difference in getting a parameter value in string, integer, or floating point. The relevance of the data will drive the requirements for the appropriate data semantics needed. For process control purpose you will need a float value but for history storage purpose a string format may be sufficient. Data semantics can be verified by sending an ad-hoc data request to the equipment for the data of interest and check its value in terms of its semantics. In some cases data semantics can be discovered by studying the metadata provided by the equipment using the EDA interface or by searching the equipment communication information manual. To verify message semantics the data quality test tool (future) must send each message and verify its intended function as is the case of most command related services. For example, if a request to STOP is issued but a PAUSE is executed the semantics of the message would have been misinterpreted by the software.
6.2.5 Data Units To be quantifiable means to be able to determine, express, or differentiate data from one tool to another. Units are used to quantify data. If a data value has no defined units, it can not be benchmarked or compared with another tool with confidence. Units can only be retrieved from the equipment if these are part of its metadata as in the case of the EDA interface. In SECS-II, the units are usually defined in the equipment communication interface manual or in the equipment operations manual.
13
ISMI Technology Transfer #08074943A-ENG
6.2.6 Data Order In many cases to properly identify a problem or analyze a set of data it has to be received in the order it was requested. In many cases order is defined when the data follows a specified pattern or sequence. It may refer to the actual request of the data whether it was an ordered array, an ordered sequence of values, or an ordered message request. Tools to verify order are usually based on scripts and need to be programmed specifically for a particular scenario being evaluated. Data order must be satisfied before an application can reliably store and analyze the data.
6.2.7 Data Accuracy Accuracy is the closeness of the agreement between the result of a measurement and a true value of the measurand. Since the true value cannot be determined exactly, the measured or calculated value of highest available accuracy is typically taken to be the true value [1]. If a value of higher accuracy than the value in question is not available, then the accuracy cannot be assigned a meaningful quantitative value. To compare data accuracy to a higher accuracy reference, a comparison device is necessary as is the case of a calibration instrument or standard reference. Measurements can be made by using statistical uncertainty or by following some systematic method by which case a confidence interval is applied to the measurement. Data range is the total permissible variation of a quantity from a designated value [2]. In many cases it is represented by the max or min permissible values required to assess the capacity or capability of a system. In many cases, assessing this capability is not possible because the software in the equipment prevents the user from selecting these values. Data range is checked by driving the system to extreme situations. In many cases, the user can verify that the equipment provides some safety mechanism to errors or inputs that use invalid process settings. Data range is also related to the amount of control ability a system provides. For example, a measurement or control value is only acceptable if it has a needed range with respect to what the system or measurement is trying to achieve.
Another factor that affects accuracy is bias. If the system has inherent bias, each time a command is issued to drive the equipment to a new value the equipment functional accuracy will be affected by it. Note that repeatability and bias are not the same. Bias is a constant offset while repeatability is not. Finally, when verifying data accuracy consideration must be given to the drift inherent in the system or device that generates or uses the data. Drift can cause measurements to become inaccurate or uncertain. The system drift, whether it is cyclic, random, or linear, affects the accuracy of the desired process control or measurement result.
6.2.8 Data Precision The quality of coherence or repeatability of data measurement is customarily expressed in terms of standard deviation [2]. Precision is the closeness of agreement between indications obtained by replicate measurements on the same or similar objects under specified conditions. Precision is used to define measurement repeatability, measurement resolution, and measurement reproducibility. Repeatability (Rep) is the variability of a measurement due to keeping all controllable and uncontrollable factors constant. It is typically measured by taking data very close together in time, under as close to the same conditions as possible. On the other hand, Reproducibility (Repr) is the variability due to specific controllable or uncontrollable factors. For example, due to operators, software revisions, time, environmental conditions, etc. it is typically measured by estimating the variance from each reproducibility component. Normally a study is
14
Technology Transfer #08074943A-ENG ISMI
designed to estimate both Rep and Repr at the same time. This study will contain controllable and uncontrollable factors as well as repeated measurements. See SEMI E89 (Guide for Measurement System Analysis). The analysis consists of partitioning the total variability into components due to the Rep and Repr. The statistical techniques used are analysis of variance, analysis of covariance, and variance components analysis. This study can also be used to determine the appropriate sampling plan.
For example, data result repeatability due to system hysteresis can affect the precision needed to achieve the same results over time. Consecutive requests for a setting and the reported reading over time provides the measurement of system or device precision. In some cases, using separate interfaces to command the equipment also provides a good comparison of the precision of the command system. Repetitive actions and sequential measurements are required to measure the system or device precision. For the purpose of understanding accuracy of data, the user must request the parameter of interest from the equipment and check first for its resolution. Resolution will provide the number of digits that can be analyzed. Sensitivity can be critical when collecting data and can affect a measurement or the data under assessment. The balance between number of digits and sensitivity of the system is critical to achieve accurate readings. If the system is too sensitive having too many digits of resolution will not help. Providing additional resolution will not change the control ability, the system is limited by its control sensitivity.
6.2.9 Data Frequency Sampling error is that portion of the difference between the value derived from observations and the value it is supposed to be estimated; attributed to the fact that samples represent only a portion of the population [3]. Sampling error is directly related to the sampling plan and the frequency the data is reported. A proper design of a data collection plan will result in the correct amount of data needed to determine the desired result. Too many samples will lead to duplicate values if the system is unable to report new values at that rate. If the process varies over time not sampling at the appropriate rate can also lead to data that changes too often leaving little room to make a valid statistical estimation. Sampling has direct relationship to the length of the process step under evaluation and the data being collected during that process step in such a way that it is meaningful, complete, and can be used to drive and determine process results.
Sampling rate is the time interval between samples in a periodic sampling control system. Sampling rate is determined by the equipment application collecting and reporting the data and is physically limited by the equipment design and the sensor type used. In many cases, sampling rates that are too fast can lead to unchanged data values or data jitter. Jitter due to time slices specified in the data collection plan that result in uneven number of data reports can affect equipment reported data quality. Based upon the documented maximum sampling rate, the evaluator should provide the ability to issue commands at a rate that allows the evaluator to verify them. Sampling can also affect the quality of decisions when the amount of data is not enough to create a significant population.
6.2.10 Data Latency In many cases, response time is critical to successful interdiction and control of the process. The time lag between sending a request and receiving the data or sense the desired action can be critical. Response time is directly related to the system latency. Latency is an accumulation of time delays from multiple sources. Many applications convert the request into an internal command or a procedure call that results in an action to retrieve a value or parameter from
15
ISMI Technology Transfer #08074943A-ENG
memory or from a sensor. Latency should always be measured from the time the requested message leaves the application to the first indication that the desired response has been completed in the equipment. For example, command latency from a request to the equipment to Start Processing will be measured from the moment the request is sent to when the Start event is received by the requestor. Latency of a command is not when the requestor receives the acknowledge notification that the message has been accepted but when the command has been executed. The same way, when making an ad-hoc request for a data value the latency is measured when the desired value arrives at the requestor.
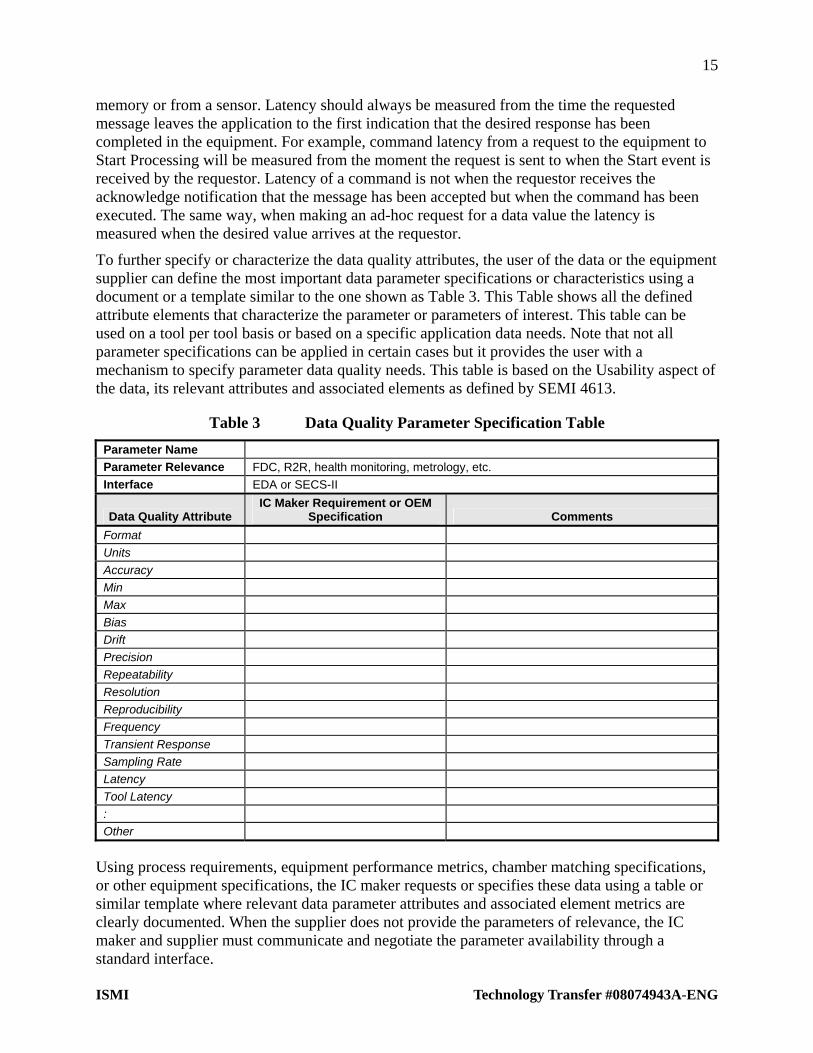
To further specify or characterize the data quality attributes, the user of the data or the equipment supplier can define the most important data parameter specifications or characteristics using a document or a template similar to the one shown as Table 3. This Table shows all the defined attribute elements that characterize the parameter or parameters of interest. This table can be used on a tool per tool basis or based on a specific application data needs. Note that not all parameter specifications can be applied in certain cases but it provides the user with a mechanism to specify parameter data quality needs. This table is based on the Usability aspect of the data, its relevant attributes and associated elements as defined by SEMI 4613.
Table 3 Data Quality Parameter Specification Table Parameter Name Parameter Relevance FDC, R2R, health monitoring, metrology, etc. Interface EDA or SECS-II
Data Quality Attribute IC Maker Requirement or OEM
Specification Comments Format Units Accuracy Min Max Bias Drift Precision Repeatability Resolution Reproducibility Frequency Transient Response Sampling Rate Latency Tool Latency : Other
Using process requirements, equipment performance metrics, chamber matching specifications, or other equipment specifications, the IC maker requests or specifies these data using a table or similar template where relevant data parameter attributes and associated element metrics are clearly documented. When the supplier does not provide the parameters of relevance, the IC maker and supplier must communicate and negotiate the parameter availability through a standard interface.
16
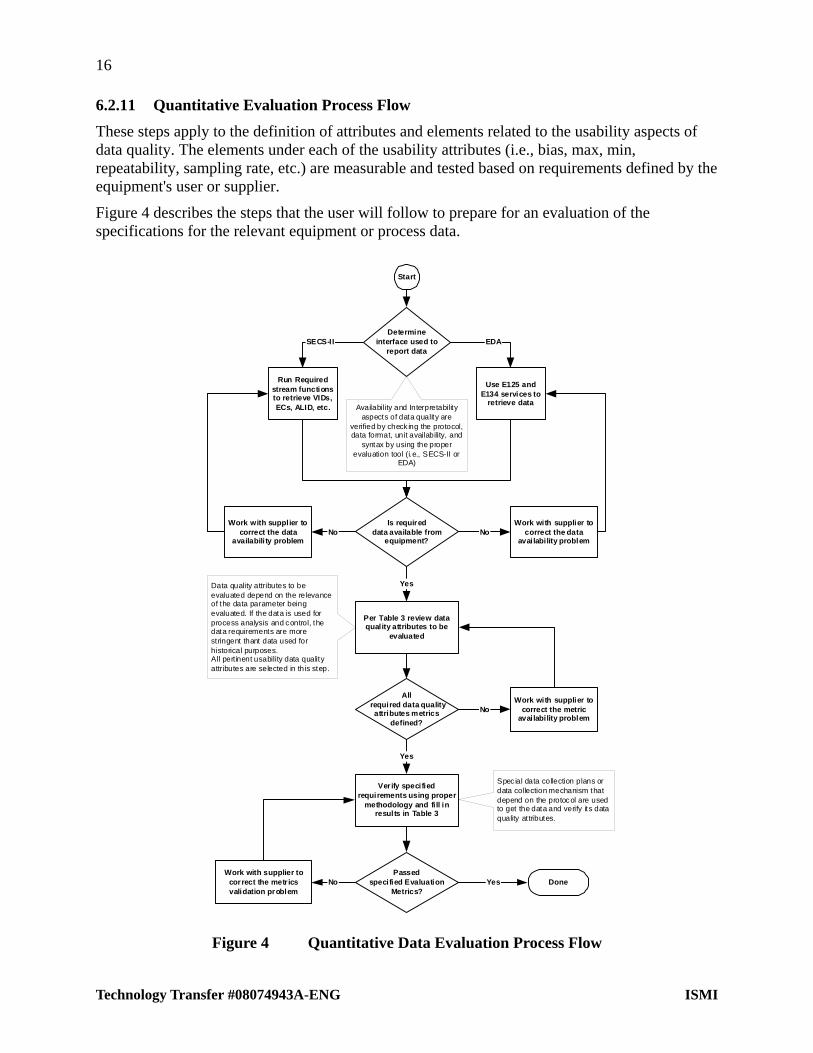
6.2.11 Quantitative Evaluation Process Flow These steps apply to the definition of attributes and elements related to the usability aspects of data quality. The elements under each of the usability attributes (i.e., bias, max, min, repeatability, sampling rate, etc.) are measurable and tested based on requirements defined by the equipment's user or supplier.
Figure 4 describes the steps that the user will follow to prepare for an evaluation of the specifications for the relevant equipment or process data.
Determineinterface used to
report data
Is requireddata available from
equipment?
Work with supplier tocorrect the data
availabili ty problem
Start
EDASECS-II
No
All required data quality
attributes metricsdefined?
Per Table 3 review dataquality attributes to be
evaluated
Run Requiredstream functionsto retrieve VIDs,ECs, ALID, etc.
Use E125 andE134 services to
retrieve data
Yes
Verify specifiedrequirements using proper
methodology and fill inresults in Table 3
Passedspecified Evaluation
Metrics?
Yes
Work with supplier tocorrect the metricsvalidation problem
No Yes
Work with supplier tocorrect the metric
availability problemNo
Done
Availability and Interpretabilityaspects of data quality are
verified by check ing the protocol,data format, unit availability, and
syntax by using the properevaluation tool (i.e., SECS-II or
EDA)
Data quality attributes to beevaluated depend on the relevanceof the data parameter beingevaluated. If the data is used forprocess analysis and control, thedata requirements are morestringent thant data used forhistorical purposes.All pert inent usability data qualityattributes are selected in this step.
Spec ial data collection plans ordata collection mechanism thatdepend on the protocol are usedto get the data and verify its dataquality attributes.
Work with supplier tocorrect the data
availability problemNo
Figure 4 Quantitative Data Evaluation Process Flow
Technology Transfer #08074943A-ENG ISMI
17
ISMI Technology Transfer #08074943A-ENG
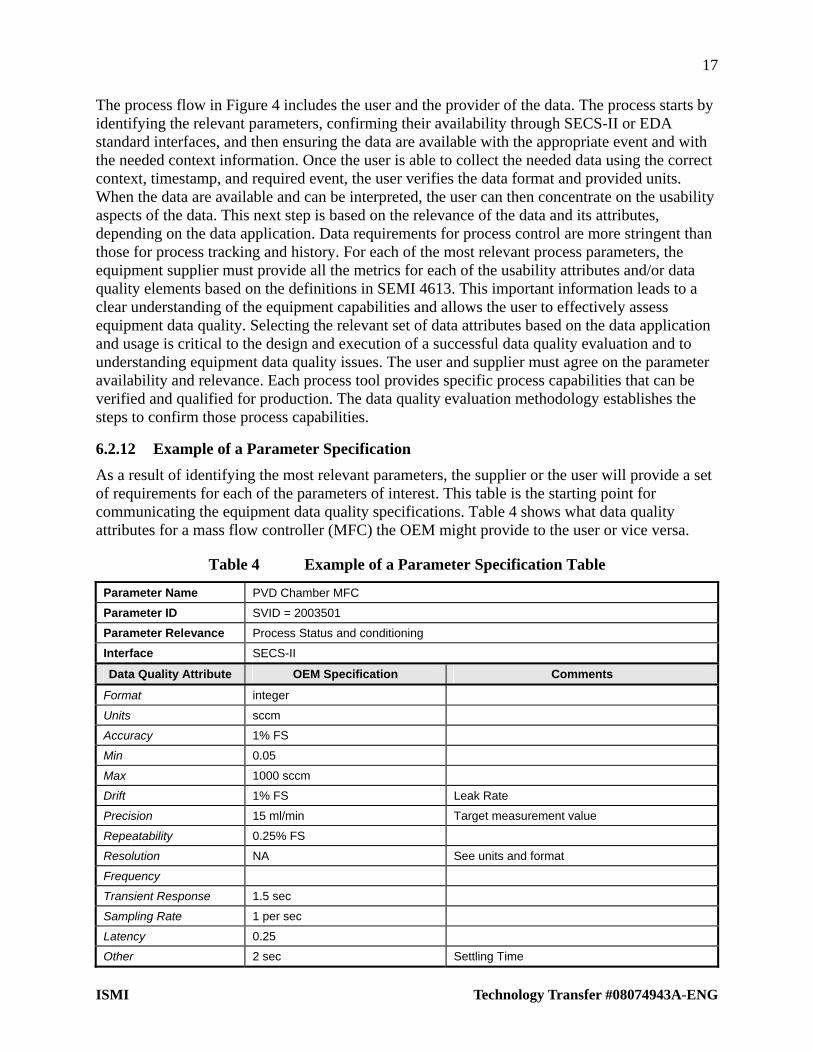
The process flow in Figure 4 includes the user and the provider of the data. The process starts by identifying the relevant parameters, confirming their availability through SECS-II or EDA standard interfaces, and then ensuring the data are available with the appropriate event and with the needed context information. Once the user is able to collect the needed data using the correct context, timestamp, and required event, the user verifies the data format and provided units. When the data are available and can be interpreted, the user can then concentrate on the usability aspects of the data. This next step is based on the relevance of the data and its attributes, depending on the data application. Data requirements for process control are more stringent than those for process tracking and history. For each of the most relevant process parameters, the equipment supplier must provide all the metrics for each of the usability attributes and/or data quality elements based on the definitions in SEMI 4613. This important information leads to a clear understanding of the equipment capabilities and allows the user to effectively assess equipment data quality. Selecting the relevant set of data attributes based on the data application and usage is critical to the design and execution of a successful data quality evaluation and to understanding equipment data quality issues. The user and supplier must agree on the parameter availability and relevance. Each process tool provides specific process capabilities that can be verified and qualified for production. The data quality evaluation methodology establishes the steps to confirm those process capabilities.
6.2.12 Example of a Parameter Specification As a result of identifying the most relevant parameters, the supplier or the user will provide a set of requirements for each of the parameters of interest. This table is the starting point for communicating the equipment data quality specifications. Table 4 shows what data quality attributes for a mass flow controller (MFC) the OEM might provide to the user or vice versa.
Table 4 Example of a Parameter Specification Table
Parameter Name PVD Chamber MFC
Parameter ID SVID = 2003501
Parameter Relevance Process Status and conditioning
Interface SECS-II
Data Quality Attribute OEM Specification Comments
Format integer
Units sccm
Accuracy 1% FS
Min 0.05
Max 1000 sccm
Drift 1% FS Leak Rate
Precision 15 ml/min Target measurement value
Repeatability 0.25% FS
Resolution NA See units and format
Frequency
Transient Response 1.5 sec
Sampling Rate 1 per sec
Latency 0.25
Other 2 sec Settling Time
18
Technology Transfer #08074943A-ENG ISMI
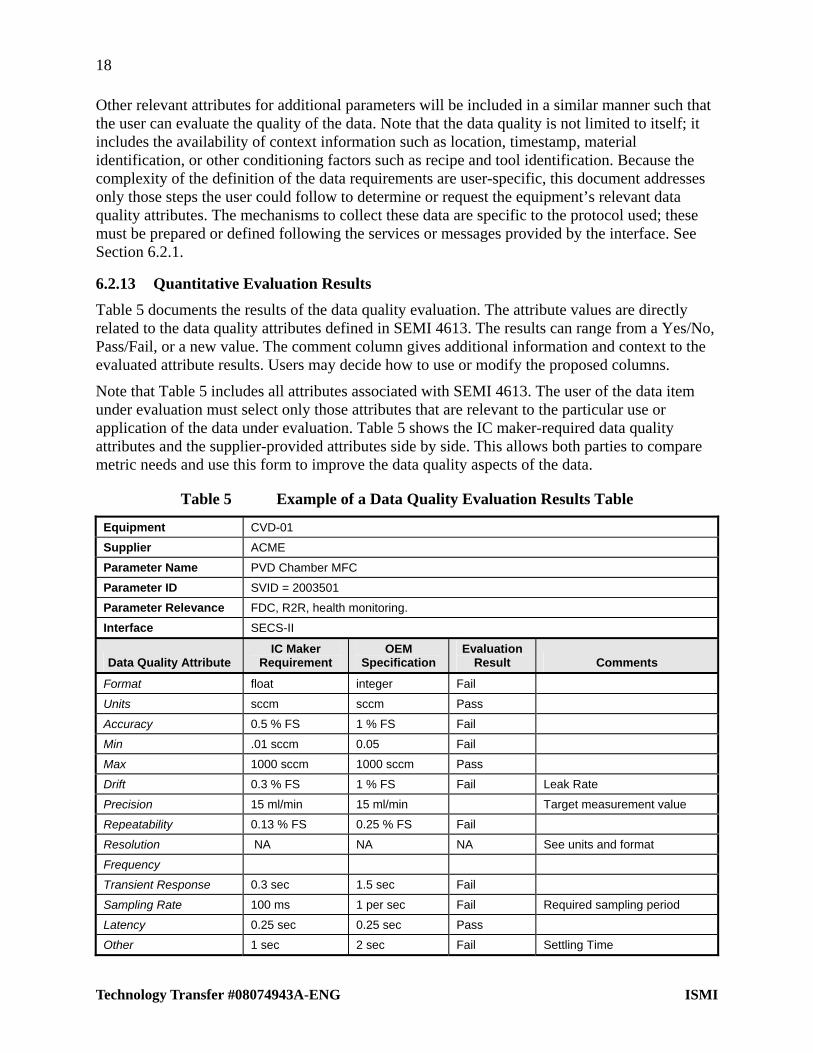
Other relevant attributes for additional parameters will be included in a similar manner such that the user can evaluate the quality of the data. Note that the data quality is not limited to itself; it includes the availability of context information such as location, timestamp, material identification, or other conditioning factors such as recipe and tool identification. Because the complexity of the definition of the data requirements are user-specific, this document addresses only those steps the user could follow to determine or request the equipment’s relevant data quality attributes. The mechanisms to collect these data are specific to the protocol used; these must be prepared or defined following the services or messages provided by the interface. See Section 6.2.1.
6.2.13 Quantitative Evaluation Results Table 5 documents the results of the data quality evaluation. The attribute values are directly related to the data quality attributes defined in SEMI 4613. The results can range from a Yes/No, Pass/Fail, or a new value. The comment column gives additional information and context to the evaluated attribute results. Users may decide how to use or modify the proposed columns.
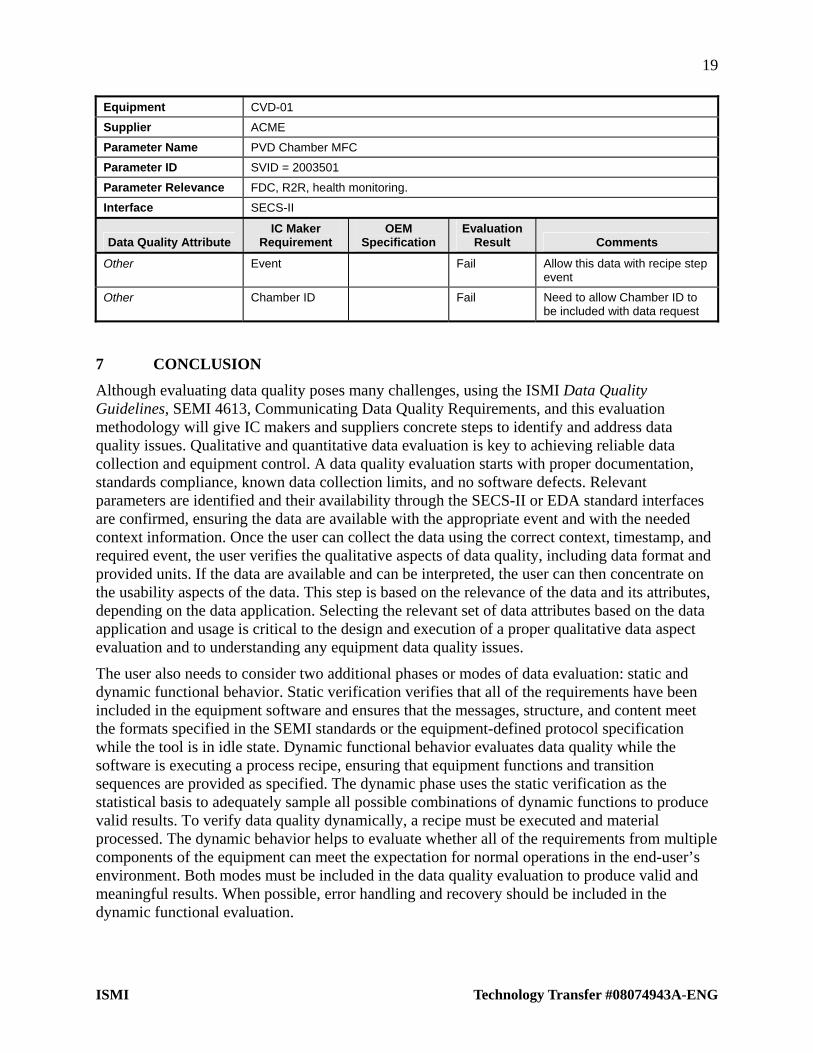
Note that Table 5 includes all attributes associated with SEMI 4613. The user of the data item under evaluation must select only those attributes that are relevant to the particular use or application of the data under evaluation. Table 5 shows the IC maker-required data quality attributes and the supplier-provided attributes side by side. This allows both parties to compare metric needs and use this form to improve the data quality aspects of the data.
Table 5 Example of a Data Quality Evaluation Results Table
Equipment CVD-01
Supplier ACME
Parameter Name PVD Chamber MFC
Parameter ID SVID = 2003501
Parameter Relevance FDC, R2R, health monitoring.
Interface SECS-II
Data Quality Attribute IC Maker
Requirement OEM
Specification Evaluation
Result Comments
Format float integer Fail
Units sccm sccm Pass
Accuracy 0.5 % FS 1 % FS Fail
Min .01 sccm 0.05 Fail
Max 1000 sccm 1000 sccm Pass
Drift 0.3 % FS 1 % FS Fail Leak Rate
Precision 15 ml/min 15 ml/min Target measurement value
Repeatability 0.13 % FS 0.25 % FS Fail
Resolution NA NA NA See units and format
Frequency
Transient Response 0.3 sec 1.5 sec Fail
Sampling Rate 100 ms 1 per sec Fail Required sampling period
Latency 0.25 sec 0.25 sec Pass
Other 1 sec 2 sec Fail Settling Time
19
ISMI Technology Transfer #08074943A-ENG
Equipment CVD-01
Supplier ACME
Parameter Name PVD Chamber MFC
Parameter ID SVID = 2003501
Parameter Relevance FDC, R2R, health monitoring.
Interface SECS-II
Data Quality Attribute IC Maker
Requirement OEM
Specification Evaluation
Result Comments
Other Event Fail Allow this data with recipe step event
Other Chamber ID Fail Need to allow Chamber ID to be included with data request
7 CONCLUSION Although evaluating data quality poses many challenges, using the ISMI Data Quality Guidelines, SEMI 4613, Communicating Data Quality Requirements, and this evaluation methodology will give IC makers and suppliers concrete steps to identify and address data quality issues. Qualitative and quantitative data evaluation is key to achieving reliable data collection and equipment control. A data quality evaluation starts with proper documentation, standards compliance, known data collection limits, and no software defects. Relevant parameters are identified and their availability through the SECS-II or EDA standard interfaces are confirmed, ensuring the data are available with the appropriate event and with the needed context information. Once the user can collect the data using the correct context, timestamp, and required event, the user verifies the qualitative aspects of data quality, including data format and provided units. If the data are available and can be interpreted, the user can then concentrate on the usability aspects of the data. This step is based on the relevance of the data and its attributes, depending on the data application. Selecting the relevant set of data attributes based on the data application and usage is critical to the design and execution of a proper qualitative data aspect evaluation and to understanding any equipment data quality issues.
The user also needs to consider two additional phases or modes of data evaluation: static and dynamic functional behavior. Static verification verifies that all of the requirements have been included in the equipment software and ensures that the messages, structure, and content meet the formats specified in the SEMI standards or the equipment-defined protocol specification while the tool is in idle state. Dynamic functional behavior evaluates data quality while the software is executing a process recipe, ensuring that equipment functions and transition sequences are provided as specified. The dynamic phase uses the static verification as the statistical basis to adequately sample all possible combinations of dynamic functions to produce valid results. To verify data quality dynamically, a recipe must be executed and material processed. The dynamic behavior helps to evaluate whether all of the requirements from multiple components of the equipment can meet the expectation for normal operations in the end-user’s environment. Both modes must be included in the data quality evaluation to produce valid and meaningful results. When possible, error handling and recovery should be included in the dynamic functional evaluation.


International SEMATECH Manufacturing Initiative Technology Transfer
2706 Montopolis Drive Austin, TX 78741
http://ismi.sematech.org e-mail: [email protected]