data quality job and analysis examples
TRANSCRIPT

Data Quality Job andAnalysis Examples
7.1.1

Contents
Copyleft...........................................................................................................................3
Profiling customer data................................................................................................4Identifying data anomalies............................................................................................................................................. 4
Copyleft
3
Copyleft
Adapted for 7.1.1. Supersedes previous releases.
Publication date: October 15, 2019
The content of this document is correct at the time of publication.
However, more recent updates may be available in the online version that can be found on TalendHelp Center.
This documentation is provided under the terms of the Creative Commons Public License (CCPL).
For more information about what you can and cannot do with this documentation in accordance withthe CCPL, please read: http://creativecommons.org/licenses/by-nc-sa/2.0/.
Notices
Talend is a trademark of Talend, Inc.
All brands, product names, company names, trademarks and service marks are the properties of theirrespective owners.
License Agreement
The software described in this documentation is licensed under the Apache License, Version 2.0 (the"License"); you may not use this software except in compliance with the License. You may obtaina copy of the License at http://www.apache.org/licenses/LICENSE-2.0.html. Unless required byapplicable law or agreed to in writing, software distributed under the License is distributed on an "ASIS" BASIS, WITHOUT WARRANTIES OR CONDITIONS OF ANY KIND, either express or implied. See theLicense for the specific language governing permissions and limitations under the License.
This product includes software developed at ASM, AntlR, Apache ActiveMQ, Apache Ant, ApacheAxiom, Apache Axis, Apache Axis 2, Apache Chemistry, Apache Common Http Client, Apache CommonHttp Core, Apache Commons, Apache Commons Bcel, Apache Commons Lang, Apache Datafu, ApacheDerby Database Engine and Embedded JDBC Driver, Apache Geronimo, Apache HCatalog, ApacheHadoop, Apache Hbase, Apache Hive, Apache HttpClient, Apache HttpComponents Client, ApacheJAMES, Apache Log4j, Apache Neethi, Apache POI, Apache Pig, Apache Thrift, Apache Tomcat, ApacheXml-RPC, Apache Zookeeper, CSV Tools, DataNucleus, Doug Lea, Ezmorph, Google's phone numberhandling library, Guava: Google Core Libraries for Java, H2 Embedded Database and JDBC Driver,HighScale Lib, HsqlDB, JSON, JUnit, Jackson Java JSON-processor, Java API for RESTful Services, JavaUniversal Network Graph, Jaxb, Jaxen, Jetty, Joda-Time, Json Simple, MapDB, MetaStuff, Paraccel JDBCDriver, PostgreSQL JDBC Driver, Protocol Buffers - Google's data interchange format, Resty: A simpleHTTP REST client for Java, SL4J: Simple Logging Facade for Java, SQLite JDBC Driver, The CastorProject, The Legion of the Bouncy Castle, Woden, Xalan-J, Xerces2, XmlBeans, XmlSchema Core,atinject. Licensed under their respective license.
Profiling customer data
4
Profiling customer data
Incorporating appropriate data quality tools in your business processes is vital at the beginning of anyproject and through the project plan in order to see what type of data quality you have and decidehow and what data to resolve.
Suppose, for example, that you want to start a campaign for your sales and marketing groups, oryou need to contact customers for billing and payment and your main source to contact appropriatepeople is email and postal addresses. Having consistent and correct address data is vital in suchcampaign to be able to reach all people.
This section provides an example of profiling US customer email and postal addresses.
Identifying data anomaliesThe first step in this example is to profile the customer contact information in a MySQL database. Theprofiling results provides you with statistics about the values within each column.
How to profile address columns
You will use Talend Studio to analyze few customer columns including email and postal.
Using out-of-box indicators and patterns on these columns, you can show in the analysis results thematching and non-matching address data, the number of most frequent records for each distinctpattern and the row, duplicate and blank counts in each column.
Defining the column analysis
Procedure
1. In the DQ Repository tree view, right-click the Analyses folder and select New Analysis.
The Create New Analysis wizard opens.

Profiling customer data
5
2. Start typing Basic column analysis in the search field, select Basic Column Analysis fromthe list and click Next.
3. In the Name field, enter a name for the current column analysis.

Profiling customer data
6
Note:
Avoid using special characters in the item names including:
"~", "!", "`", "#", "^", "&", "*", "\\", "/", "?", ":", ";", "\"", ".", "(", ")", "'", "¥", "'", """, "«", "»", "<", ">".
These characters are all replaced with "_" in the file system and you may end up creatingduplicate items.
4. Set column analysis metadata (purpose, description and author name) in the corresponding fieldsand click Next.
Selecting the address columns and setting sample data
Procedure
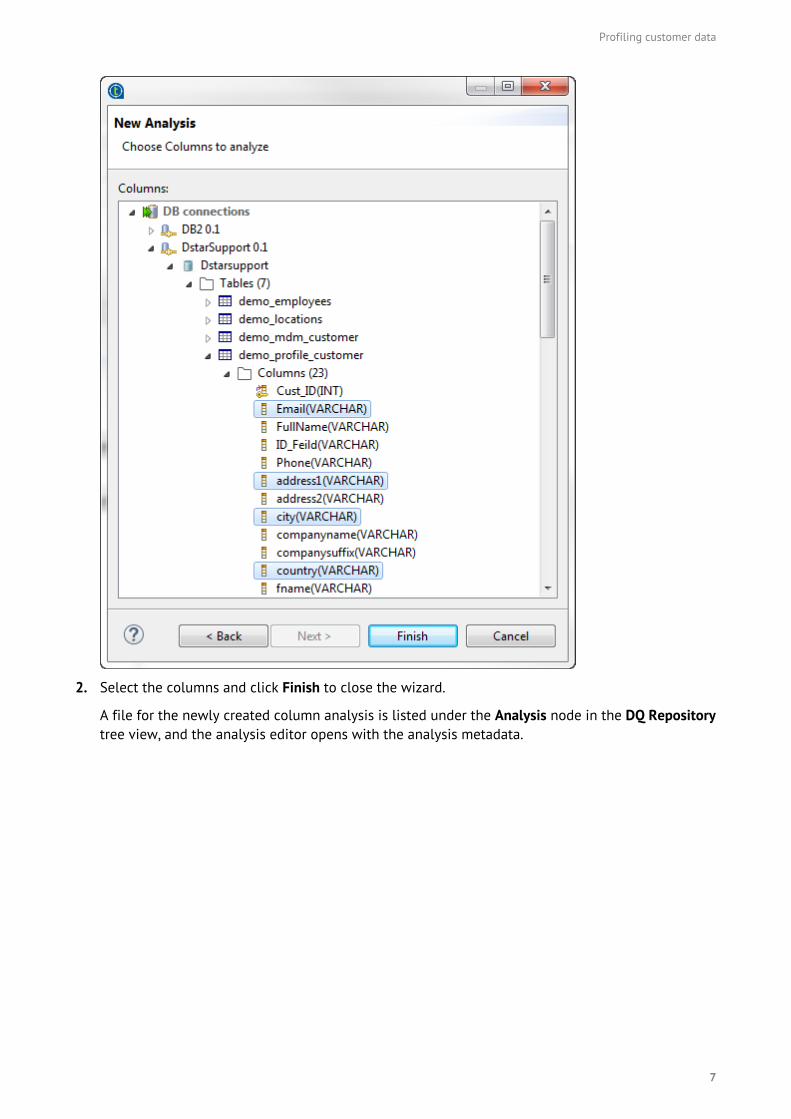
1. Expand DB connections and browse to the address columns you want to analyze.
Profiling customer data
7
2. Select the columns and click Finish to close the wizard.
A file for the newly created column analysis is listed under the Analysis node in the DQ Repositorytree view, and the analysis editor opens with the analysis metadata.

Profiling customer data
8
3. In the Data preview view, click Refresh Data.
The data in the selected columns is displayed in the table.
You can change your data source and your selected columns by using the New Connection andSelect Data buttons respectively.
4. In the Limit field, set to 50 the number for the data records you want to display in the table anduse as sample data.
5. Select n random rows to list 50 random records from the selected columns.
Setting system indicators
Procedure
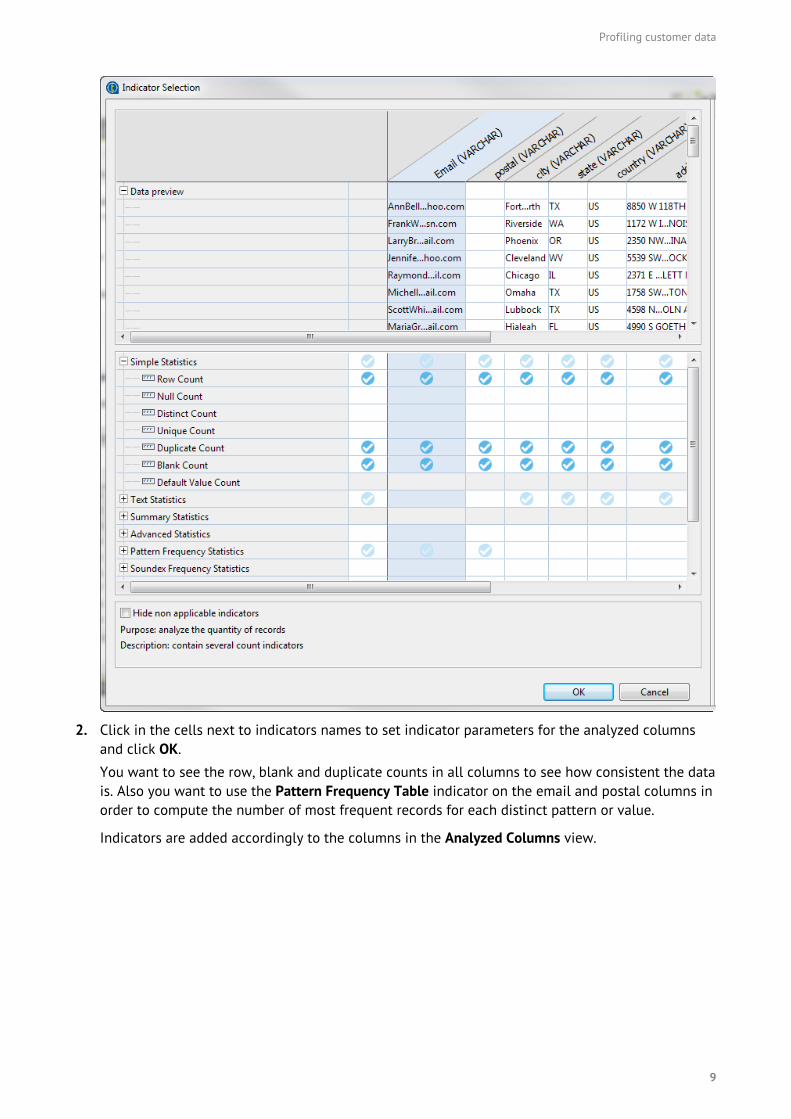
1. From the Data preview view in the analysis editor, click Select indicators to open the IndicatorSelection dialog box.
Profiling customer data
9
2. Click in the cells next to indicators names to set indicator parameters for the analyzed columnsand click OK.
You want to see the row, blank and duplicate counts in all columns to see how consistent the datais. Also you want to use the Pattern Frequency Table indicator on the email and postal columns inorder to compute the number of most frequent records for each distinct pattern or value.
Indicators are added accordingly to the columns in the Analyzed Columns view.

Profiling customer data
10
3. Click the option icon next to the Blank Count indicator and set 0 in the Upper threshold field.
Defining thresholds on indicators is very helpful as it will write in red the count of the null valuesin the analysis results.
Setting patterns
You would want now to match the content of the email column against a standard email format andthe postal column against a standard US zip code format.
This will define the content, structure and quality of emails and zip codes and give a percentage ofthe data that match the standard formats and the data that does not match.

Profiling customer data
11
Procedure
1. In the Analyzed Columns view, click the icon next to email.
2. In the Pattern Selector dialog box, expand Regex and browse to Email Address in the internetfolder, and then click OK.
3. Click the option icon next to the Email Address indicator and set 98.0 in theLower threshold (%) field.
If the number of the records that match the pattern is fewer than 98%, it will be written in red inthe analysis results.
4. Do the same to add to the postal column the US Zipcode Validation pattern from the addressfolder.
For further information on pattern types and their usage when analyzing data, see Talend StudioUser Guide at https://help.talend.com.
Executing the analysis and displaying the profiling results
Procedure
1. Save the column analysis in the analysis editor and then press F6 to execute it.

Profiling customer data
12
A group of graphics is displayed in the Graphics panel to the right of the analysis editor showingthe results of the column analysis including those for pattern matching.
2. Click the Analysis Results tab at the bottom of the analysis editor to access a more detail resultview.
These results show the generated graphics for the analyzed columns accompanied with tablesthat detail the statistic and pattern matching results.
Results
The pattern matching results show that about 10% of the email records do not match the standardemail pattern. The simple statistic results show that about 8% of the email records are blank and thatabout 5% are duplicates. And the pattern frequency results give the number of most frequent recordsfor each distinct pattern. This shows that the data is not consistent and you need to correct and cleansthe email data before starting your campaign.

Profiling customer data
13
The results for the postal column look as the following:
The result sets for the postal column give the count of the records that match and those that do notmatch a standard US zip code format. The results sets also give the blank and duplicate counts andthe number of most frequent records for each distinct pattern. These results show that the data is notvery consistent.
Then some percentage of the customers can not be contacted by either email or US mail service.These results show clearly that your data is not very consistent and that it needs to be corrected.
How to view analyzed data
After running the column analysis using the SQL engine and from the Analysis Results view of theanalysis editor, you can right-click any of the rows/bars in the result tables/charts and access a viewof the actual analyzed data.

Profiling customer data
14
This could be very helpful to see invalid rows for example and start analyzing what needs to be doneto clean such data.
Procedure
1. At the bottom of the analysis editor, click the Analysis Results tab to open a detailed view of theanalysis results.
2. Right-click the data row in the statistic results of the email column and select View rows forexample.
Results
The Data Explorer perspective opens listing the invalid rows in the email column.