data science for energy outlook 2015 dr. brand niemann director and senior data scientist/data...
TRANSCRIPT

1
Data Science for Energy Outlook 2015
Dr. Brand NiemannDirector and Senior Data Scientist/Data Journalist
Semantic CommunitySemantic Community
Data ScienceData Science for Energy Outlook 2015
July 30, 2015

2
http://www.meetup.com/Data-Community-DC/events/224145888/
My Note: I decided to participate!Pick excellent government energy content.Make it a Data Science Data Publication.
3
Data Mining - Data Science – Data Publication Process
• Data Mining Process:• Business Understanding• Data Understanding• Data Preparation• Modeling• Evaluation• Deployment
• Data Science Process:• Data Preparation• Data Ecosystem• Data Story
• Data Science Questions:• How was the data collected?• Where is the data stored?• What are the data results? and• Why should we believe the data results?
• Data Science Data Publication:• Knowledge Base• Spreadsheet Index• Web & PDF Tables to Spreadsheet• Data Browser• Dynamically Linked Adjacent
Visualizations

4
http://www.eia.gov/forecasts/aeo/index.cfm
Overview

5
Data: All Tables
http://www.eia.gov/forecasts/aeo/tables_ref.cfm
My Note: See Executive Summary: Table ES-1 in Next Slide

6
http://www.eia.gov/forecasts/aeo/executive_summary.cfm
My Note: Web Table to Spreadsheet.Also PDF Tables in Appendix

7
http://www.eia.gov/oiaf/aeo/tablebrowser/
Interactive Table Viewer (Beta testing):Provides custom data views of the AEO2015 Reference case and previous Reference cases. All available cases can be charted and the data for them downloaded.

8
http://www.eia.gov/beta/aeo/
My Note: Click Path1. Data2. Reference or Side Cases3. Summary Case Tables4. Table 1
My Note: This could be Filtered Tables in A Data Viewer Like Spotfire
My Note: Lots of Options

9
Semantic Community Data Science Data Science for Energy Outlook 2015
Data Science Data Publication:Knowledge Base

10
Data Science Data Publication:Spreadsheet Index
AEO2015.xlsx

11
Data Science Data Publication:Web & PDF Tables to Spreadsheet
AEO2015.xlsx

12
Data Science Data Publication:Data Browser

13
AEO2015 Figure ES-1 Spreadsheet
My Note: Copied Data Here for Spotfire
fig-es1_data.xls

14
AEO2015 Figure ES-1 Spreadsheet in Spotfire
15
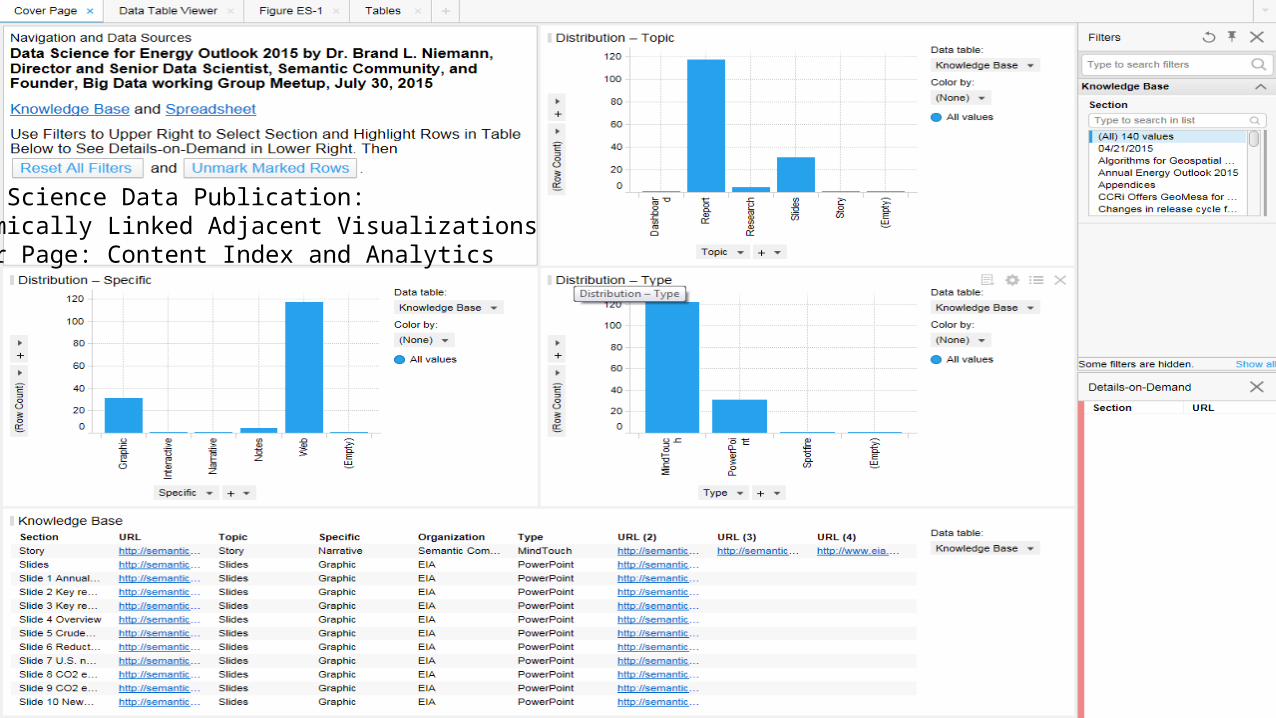
Data Science Data Publication:Dynamically Linked Adjacent VisualizationsCover Page: Content Index and Analytics

16
Conclusions and Recommendations
• The Annual Energy Outlook 2015 is both a Web and PDF document with PDF and Excel figure tables which uses an Interactive Table Viewer in Beta testing.• I decided to participate in the Data Owls Meetup and selected the
excellent Annual Energy Outlook 2015 and made it a Data Science Data Publication.• I followed the Federal Big Data Working Group Meetup’s Data Mining -
Data Science – Data Publication Process.• A Data Science Data Publication has been created with a Knowledge Base
in MindTouch, the Knowledge Base Index and Report Tables in Excel, and a Data Viewer in Spotfire.

17
Data Science DC: Algorithms for Geospatial Data Analysis
Meetup Description• For the July Data Science DC Meetup we're having a themed evening
where we'll look at the intersection of data science with mapping and spatial analysis. We will feature two presentations - the first by Anthony Fox from CCRI, who will discuss GeoMesa and how they analyze high-velocity streaming spatio-temporal data. The second speaker is Jason Dalton of Azimuth1, who will discuss using spatial graph analysis to model the US fuel energy infrastructure for the Department of Energy.
http://www.meetup.com/Data-Science-DC/events/223875087/
18
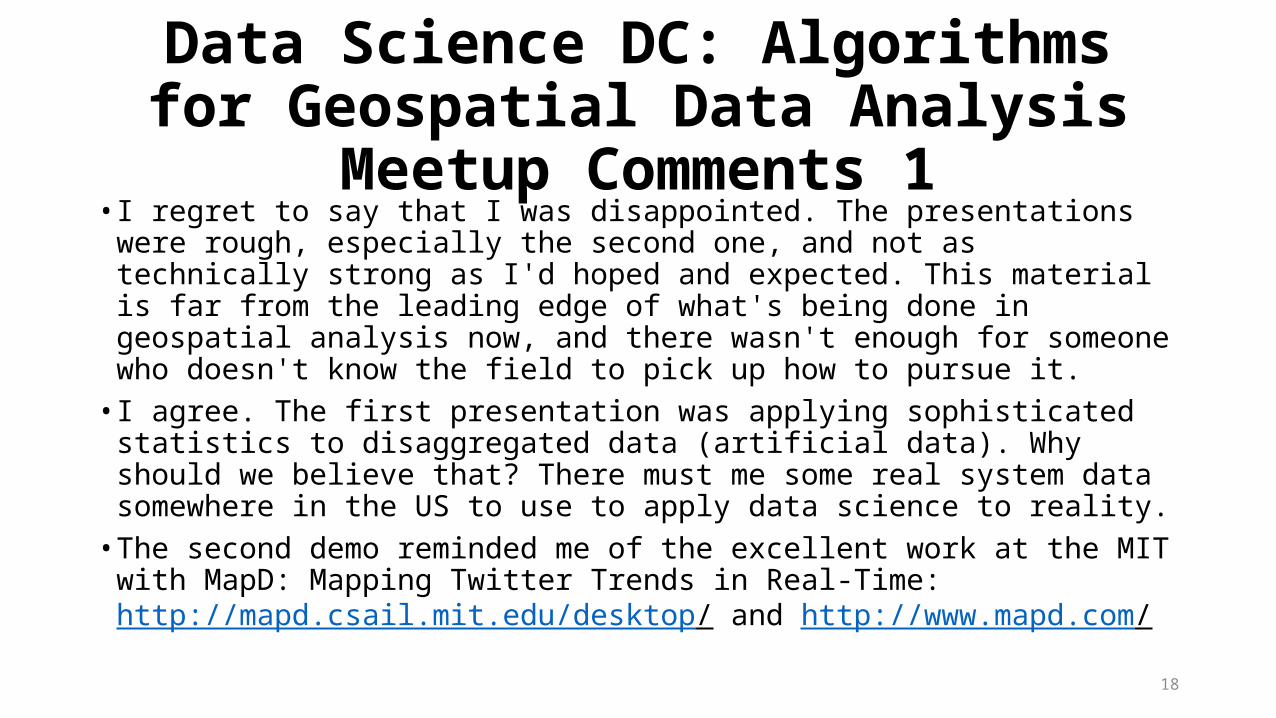
Data Science DC: Algorithms for Geospatial Data Analysis
Meetup Comments 1• I regret to say that I was disappointed. The presentations were rough,
especially the second one, and not as technically strong as I'd hoped and expected. This material is far from the leading edge of what's being done in geospatial analysis now, and there wasn't enough for someone who doesn't know the field to pick up how to pursue it.• I agree. The first presentation was applying sophisticated statistics to
disaggregated data (artificial data). Why should we believe that? There must me some real system data somewhere in the US to use to apply data science to reality.• The second demo reminded me of the excellent work at the MIT with MapD:
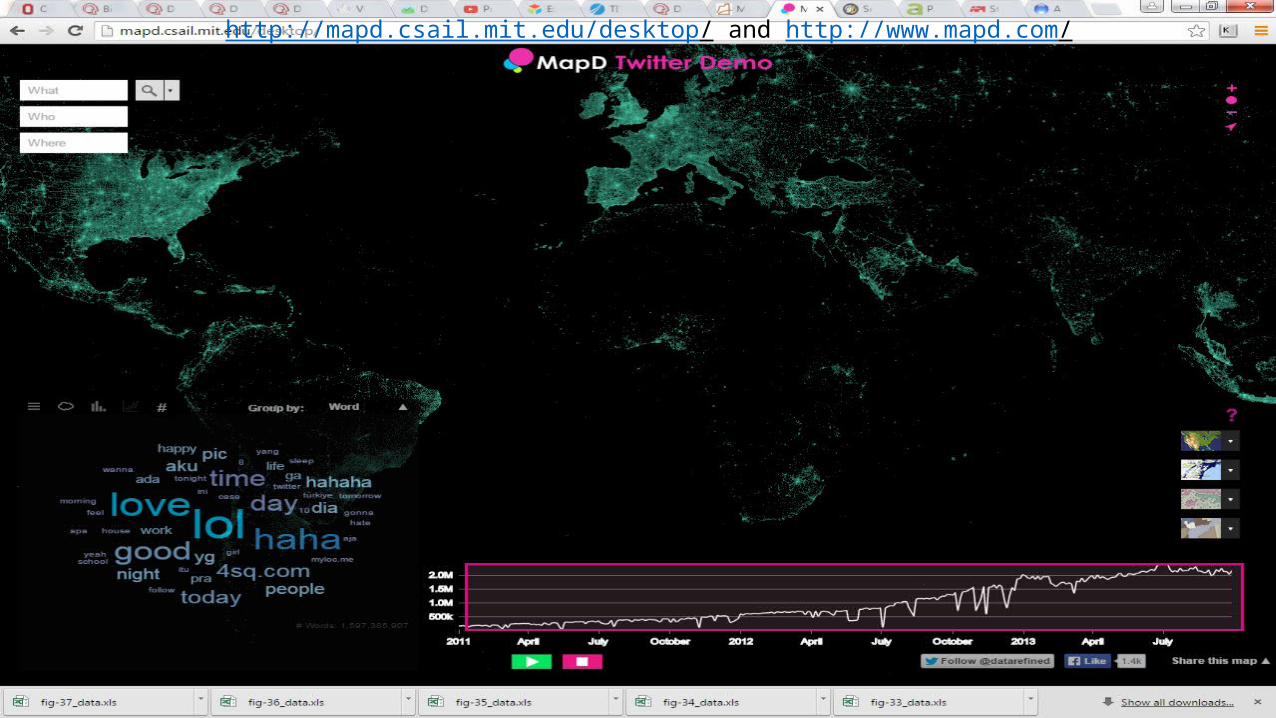
Mapping Twitter Trends in Real-Time: http://mapd.csail.mit.edu/desktop/ and http://www.mapd.com/
19
http://mapd.csail.mit.edu/desktop/ and http://www.mapd.com/
20
Data Science DC: Algorithms for Geospatial Data Analysis
Meetup Comments 2• Aggregated data can be real data systematically summarized by some
process. These datasets look interesting, let's explore them at Data Owls tonight!• I am. Please see: Data Science for Energy Outlook 2015• Good content, well presented. Why look at the numbers when the graphs
are so pretty?• Maybe to get some idea of where the stuff depicted in the graphs came
from?• Google Search for PADD (Petroleum Administration for Defense Districts)
and API (Application Programming Interface or American Petroleum Institute?)

21
https://global.ihs.com/api_statistical_data.cfm?rid=API1
My Note: Print Publication Only!

22
Petroleum Administration for Defense District (PADD)
• A geographic aggregation of the 50 States and the District of Columbia into five Districts, with PADD 1 further split into three subdistricts. The PADDs include the States listed below:
• PADD 1 (East Coast):• PADD 1A (New England): Connecticut, Maine, Massachusetts, New Hampshire, Rhode Island, and
Vermont.• PADD 1B (Central Atlantic): Delaware, District of Columbia, Maryland, New Jersey, New York, and
Pennsylvania.• PADD 1C (Lower Atlantic): Florida, Georgia, North Carolina, South Carolina, Virginia, and West Virginia.
• PADD 2 (Midwest): Illinois, Indiana, Iowa, Kansas, Kentucky, Michigan, Minnesota, Missouri, Nebraska, North Dakota, Ohio, Oklahoma, South Dakota, Tennessee, and Wisconsin.
• PADD 3 (Gulf Coast): Alabama, Arkansas, Louisiana, Mississippi, New Mexico, and Texas.• PADD 4 (Rocky Mountain): Colorado, Idaho, Montana, Utah, and Wyoming.• PADD 5 (West Coast): Alaska, Arizona, California, Hawaii, Nevada, Oregon, and Washington.• Map of the PADD districts http://www.eia.gov/tools/glossary/index.cfm

23
http://www.eia.gov/petroleum/gasdiesel/diesel_map.cfm
GlossaryMap of the PADD districts

24
http://www.eia.gov/petroleum/
Overview, and see below for Interactive Visualizations, Data, & Multimedia

25
http://www.eia.gov/state/maps.cfm?v=Petroleum
Interactive Visualizations, Data, & Multimedia: One of Multiple Examples

26
http://www.eia.gov/petroleum/weekly/archive/2015/150715/includes/analysis_print.cfm
Analysis and Projections: One of Many Examples

27
http://www.eia.gov/petroleum/data.cfm
Data

28
http://www.eia.gov/petroleum/data.cfm
My Note: Monthly and Annual City Average from Average of Individual Cities!?
Data: Prices

29
http://www.eia.gov/totalenergy/data/browser/xls.cfm?tbl=T09.04&freq=m
30
4. Provisions Regarding Disclosure of Information
• All PSRS survey forms, with the exception of the Form EIA-814, “Monthly Imports Report,” have the same general disclosure information statement. The information reported on Form EIA-814 will be considered “public information” and may be publicly released in company or individually identifiable form, and will not be protected from disclosure in identifiable form.
• Disclosure limitation procedures are not applied to the statistical data published from this survey’s information. Thus, there may be some statistics that are based on data from fewer than three respondents, or that are dominated by data from one or two large respondents. In these cases, it may be possible for a knowledgeable person to estimate the information reported by a specific respondent.
• In addition to the use of the information by EIA for statistical purposes, the information may be made available, upon request, to other Federal agencies authorized by law to receive such information for any nonstatistical purposes such as administrative, regulatory, law enforcement, or adjudicatory purposes.
• Company specific data are also provided to other DOE offices for the purpose of examining specific petroleum operations in the context of emergency response planning and actual emergencies.
• My Note: So one can use real raw data for Geospatial Data Analysis. My client will be very interested in that! http://www.eia.gov/petroleum/supply/monthly/pdf/psmnotes.pdf