usda data science mooc dr. brand niemann director and senior data scientist/data journalist semantic...
TRANSCRIPT
1
USDA Data Science MOOC
Dr. Brand NiemannDirector and Senior Data Scientist/Data Journalist
Semantic Communityhttp://semanticommunity.info/
http://www.meetup.com/Federal-Big-Data-Working-Group/http://www.meetup.com/Virginia-Big-Data-Meetup
http://www.meetup.com/Northern-Virginia-Semantic-Web-Meetup/ http://semanticommunity.info/Data_Science/Federal_Big_Data_Working_Group_Meetup
May 18, 2015
2
Introduction• ”Gatherings like the Open Data Roundtable are essential to building bridges with
the private sector, gaining input and feedback, improving our data infrastructure, and developing a system that will outlast any single Administration,” wrote Krysta Harden, Deputy Secretary of USDA in a foreword to the report. “Our goal is to unleash even more government data to help business leaders make the best possible decisions, while creating fertile ground for new business development, especially for new and beginning farmers. The best way to do that was to listen to suggestions from those already using our data – and to get the private sector’s guidance on where USDA can unlock the greatest value in our data sets."
• The purpose is to use the recent report: Using Open Data to Protect the Food Supply: A Report on the Roundtable with USDA, and the associated: Open Data Communications Plan, as the basis for a USDA Data Science MOOC (Massive Open Online Course) for the Federal Big Data Working Group Meetup, and others who want free data science training using the excellent USDA data sources. The purpose is to also provide feedback to the USDA OCIO on our experience with using their data.Introduction
3
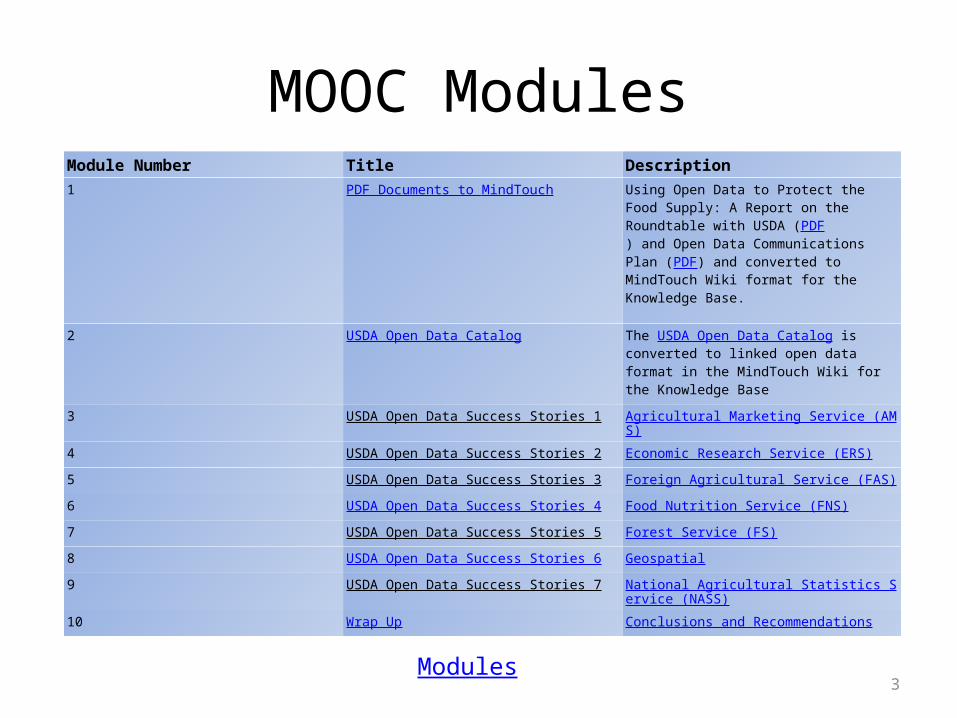
MOOC ModulesModule Number Title Description1 PDF Documents to MindTouch Using Open Data to Protect the Food
Supply: A Report on the Roundtable with USDA (PDF) and Open Data Communications Plan (PDF) and converted to MindTouch Wiki format for the Knowledge Base.
2 USDA Open Data Catalog The USDA Open Data Catalog is converted to linked open data format in the MindTouch Wiki for the Knowledge Base
3 USDA Open Data Success Stories 1 Agricultural Marketing Service (AMS)
4 USDA Open Data Success Stories 2 Economic Research Service (ERS)
5 USDA Open Data Success Stories 3 Foreign Agricultural Service (FAS)
6 USDA Open Data Success Stories 4 Food Nutrition Service (FNS)
7 USDA Open Data Success Stories 5 Forest Service (FS)
8 USDA Open Data Success Stories 6 Geospatial
9 USDA Open Data Success Stories 7 National Agricultural Statistics Service (NASS)
10 Wrap Up Conclusions and Recommendations
Modules
4
Module 1 PDF Documents to MindTouch
• How was the data collected?– Open Data Roundtable and Open Data
Communications Plan• Where is the data stored?– PDF
• What are the results?– MindTouch
• Why should we believe the results?– They are faithful conversions of the original PDF files
PDF Documents to MindTouch
5
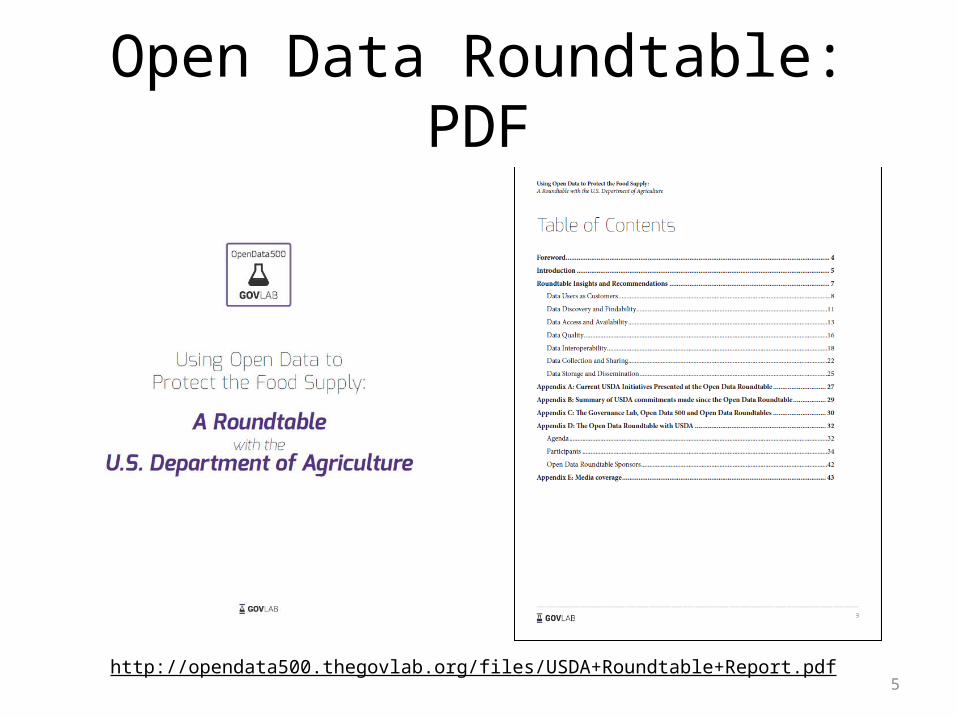
Open Data Roundtable: PDF
http://opendata500.thegovlab.org/files/USDA+Roundtable+Report.pdf
6
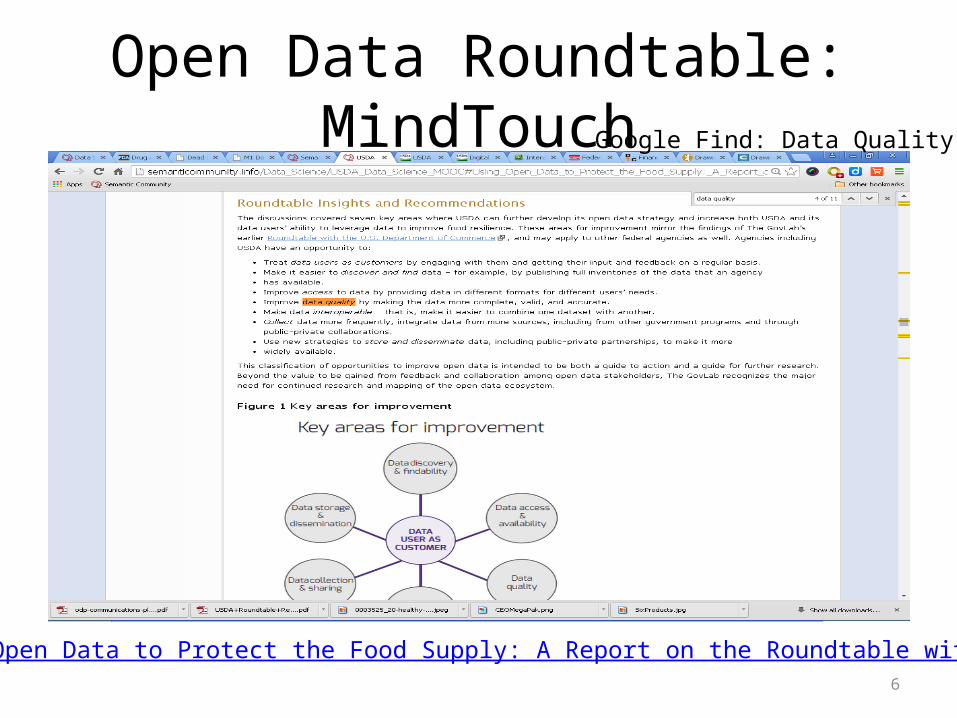
Open Data Roundtable: MindTouch
Using Open Data to Protect the Food Supply: A Report on the Roundtable with USDA
Google Find: Data Quality
7
Module 2 USDA Open Data Catalog
• How was the data collected?– Enterprise Data Catalog.
• Where is the data stored?– Web Page, MindTouch, Spreadsheet, and Spotfire.
• What are the results?– Find by word, phrase, topic, subtopic, etc.
• Why should we believe the results?– Based on careful repurposing of original source.
USDA Open Data Catalog
8
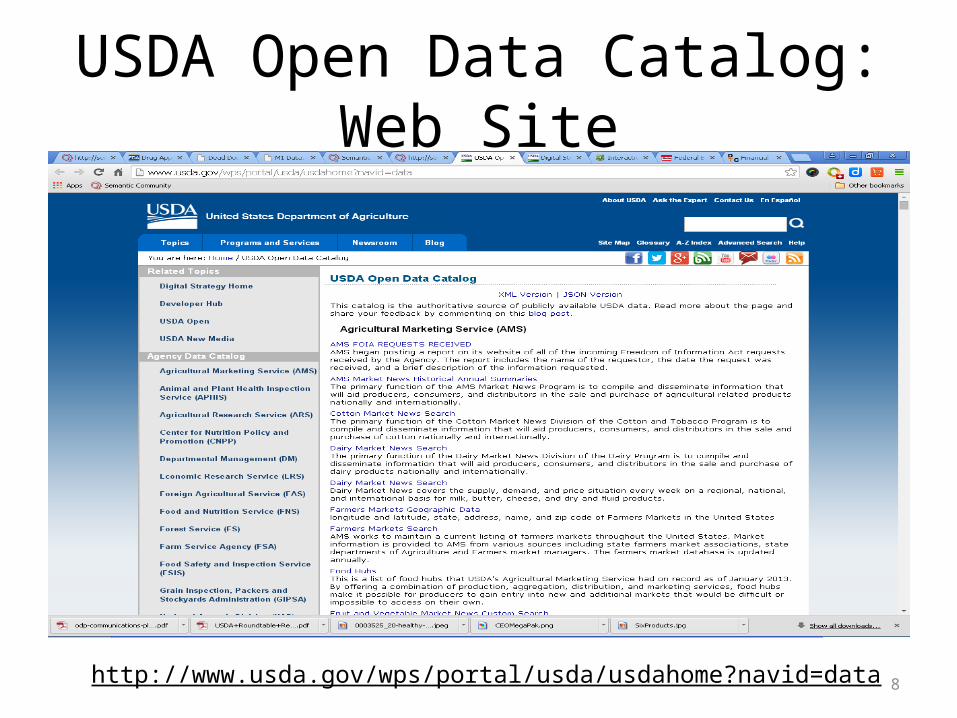
USDA Open Data Catalog: Web Site
http://www.usda.gov/wps/portal/usda/usdahome?navid=data
9
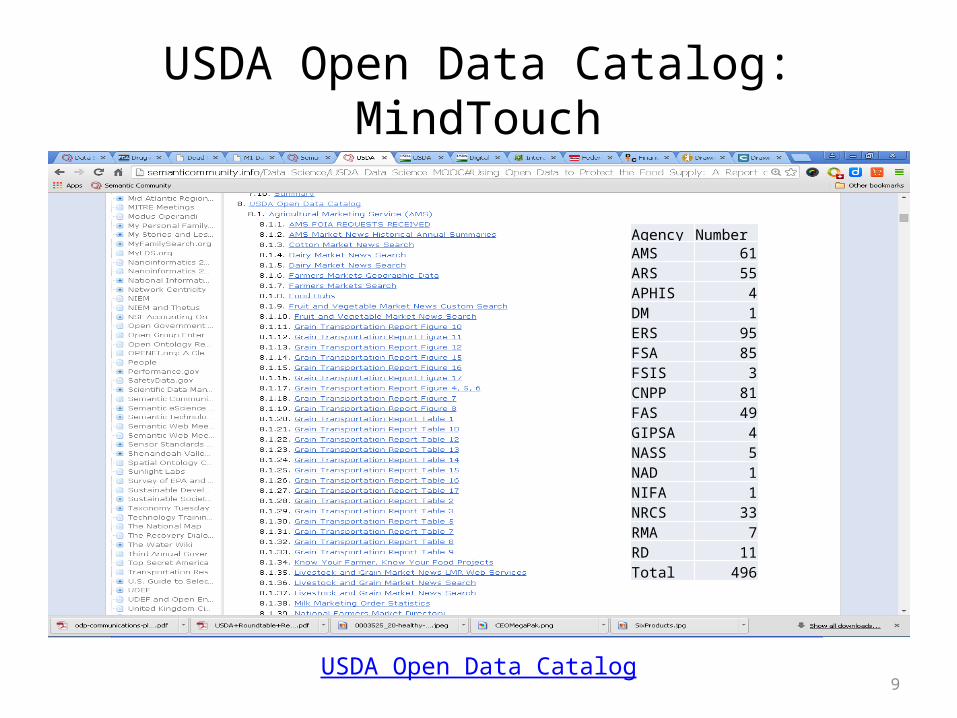
USDA Open Data Catalog: MindTouch
USDA Open Data Catalog
Agency NumberAMS 61ARS 55APHIS 4DM 1ERS 95FSA 85FSIS 3CNPP 81FAS 49GIPSA 4NASS 5NAD 1NIFA 1NRCS 33RMA 7RD 11Total 496
10
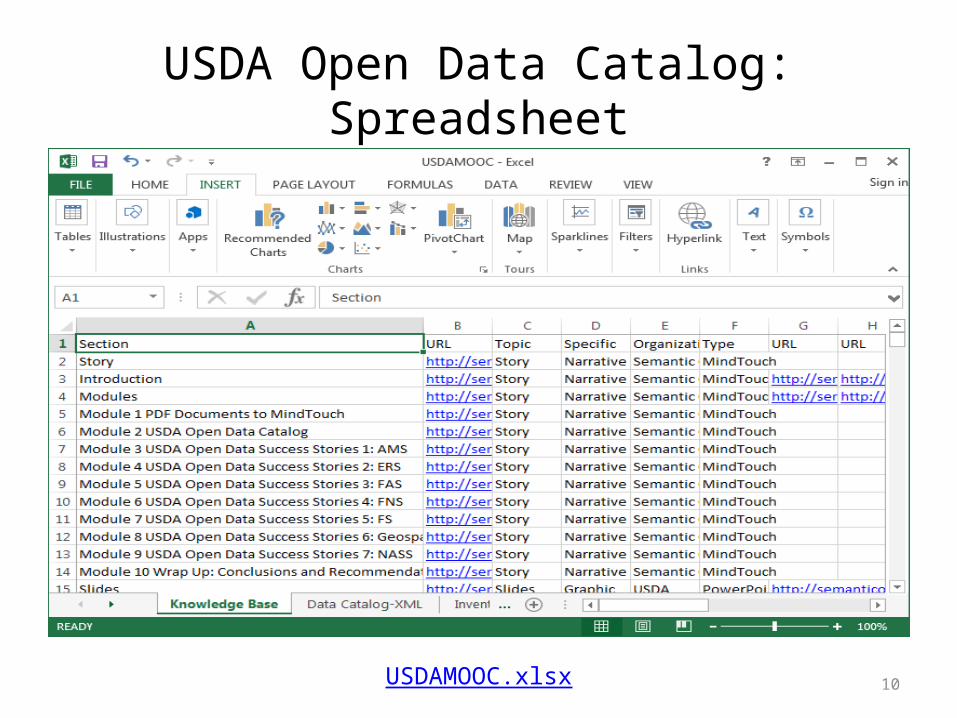
USDA Open Data Catalog: Spreadsheet
USDAMOOC.xlsx
11
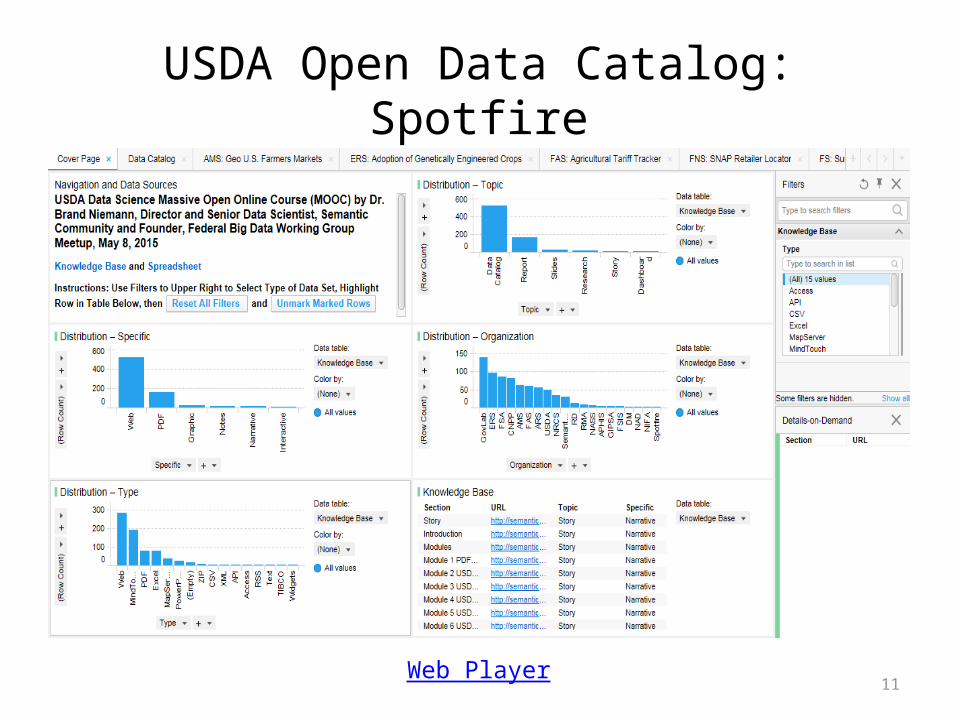
USDA Open Data Catalog: Spotfire
Web Player
12
Module 3 USDA Open Data Success Stories 1: AMS
• The Farmers Market Directory receives nearly 2 million user page views per year and has been one of USDA’s most popular data sets. On May 15, 2013, the Farmers Market Directory API (Application Programming Interface) was released giving app developers and designers direct access to the wealth of farmer’s market information housed in the online database. With over 7,800 farmers market listings available for all 50 states, apps and Web sites that previously relied on a download or export of the data set are now able to make direct calls to the directory. During the month of March 2014, the Farmers Market Directory API had about 2,700 hits from third-party applications Apps developed using the new API are now delivering foodies and farmers market lovers more accurate and up-to-date information. This release also supported the Department’s Digital Government Strategy work as one of USDA’s API deliverables.
Agricultural Marketing Service (AMS)
13
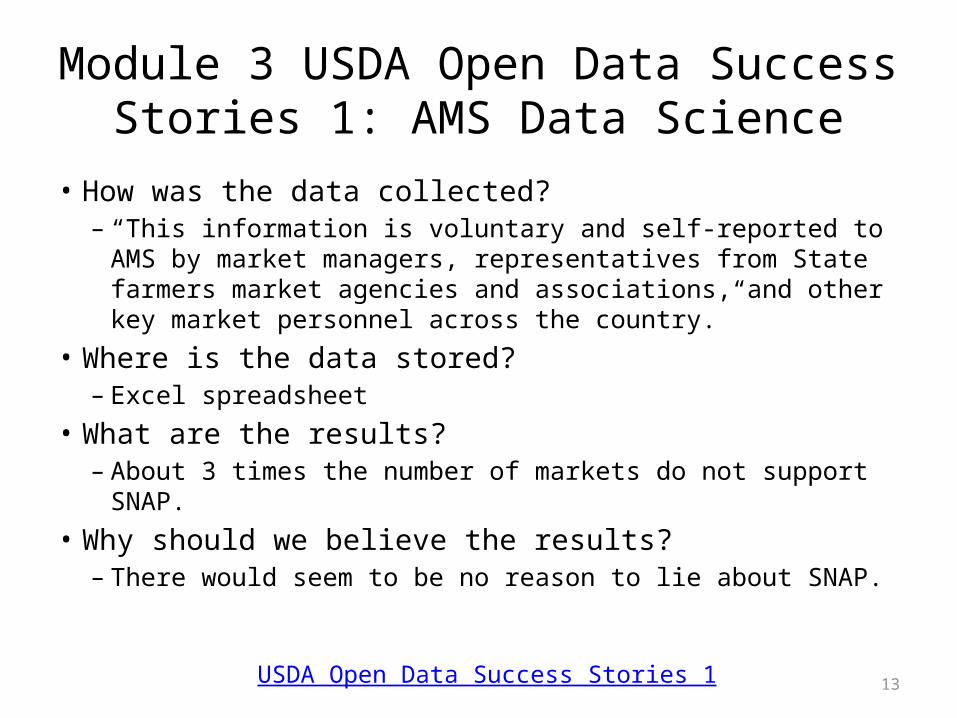
Module 3 USDA Open Data Success Stories 1: AMS Data Science
• How was the data collected?– “This information is voluntary and self-reported to AMS by
market managers, representatives from State farmers market agencies and associations, and other key market personnel across the country.”
• Where is the data stored?– Excel spreadsheet
• What are the results?– About 3 times the number of markets do not support SNAP.
• Why should we believe the results?– There would seem to be no reason to lie about SNAP.
USDA Open Data Success Stories 1
14
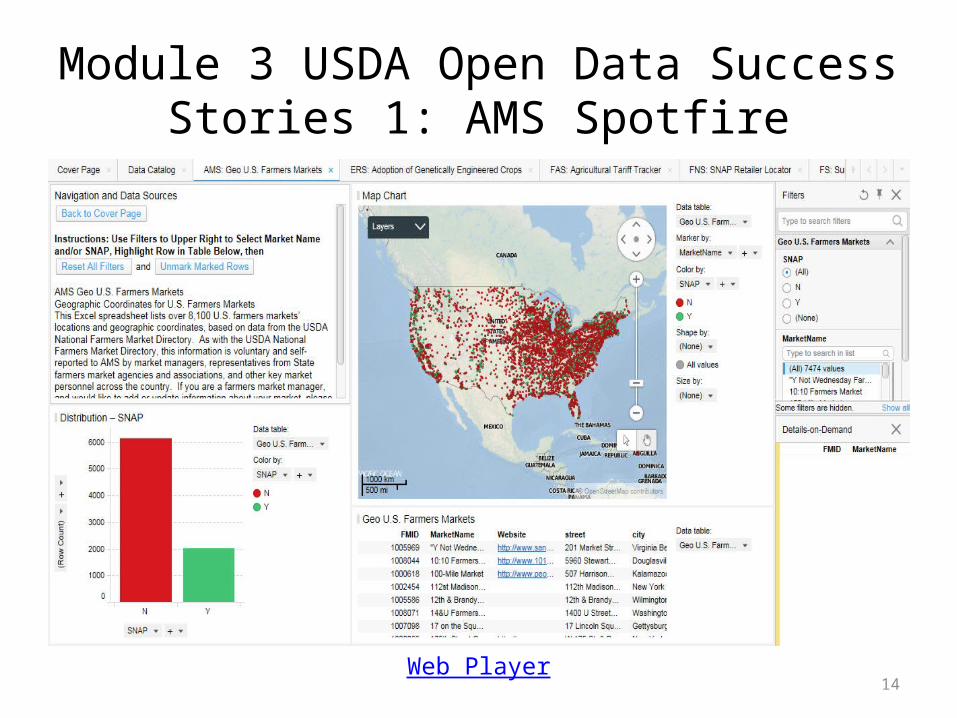
Module 3 USDA Open Data Success Stories 1: AMS Spotfire
Web Player
15
Module 4 USDA Open Data Success Stories 2: ERS
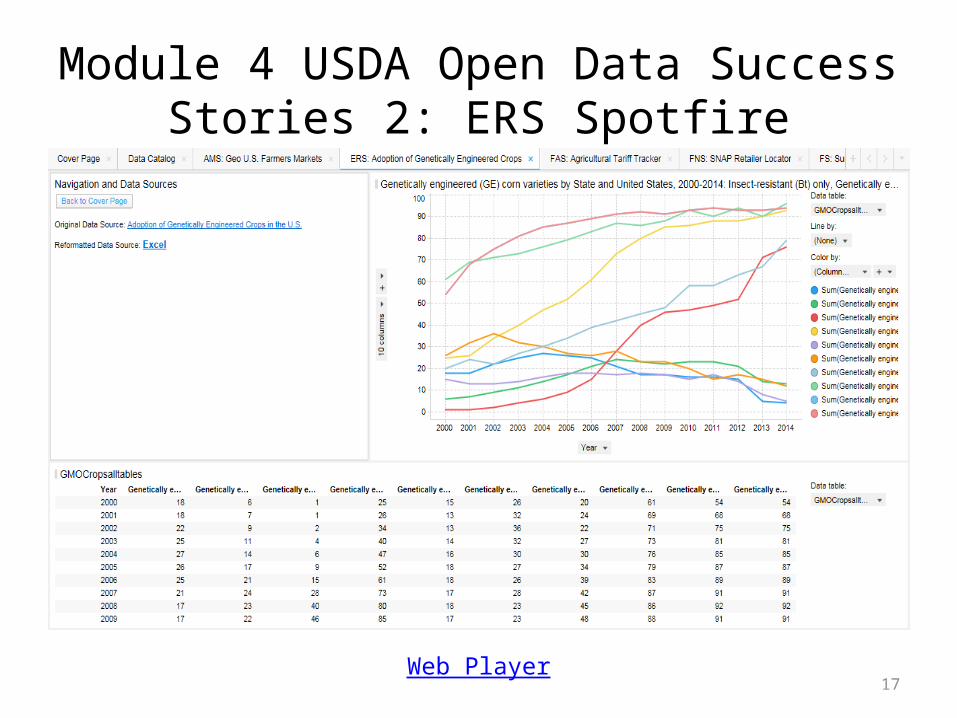
• ERS recently launched new services that enable developers, bloggers, and other digital professionals to more easily use and repurpose ERS material. These services include APIs (Application Programming Interfaces) for web content and select data (including geospatial data). A widely used example expands the reach of ERS' daily Charts of Note via a "widget," that bloggers, online publishers, and others use to embed code snippets that leverage ERS content/APIs on their sites. Customers choose whether to display a specific daily chart, or an automatic display of the most recently published chart. Agri-Pulse (an on-line comprehensive weekly report of the latest in agricultural information) embedded the Charts of Note widget beneath the Event Calendar on their home page. Other customers have shared their intention to use the widget on blogs, policy and association websites, and e-newsletters; and our APIs to create apps and educational materials.
Economic Research Service (ERS)
16
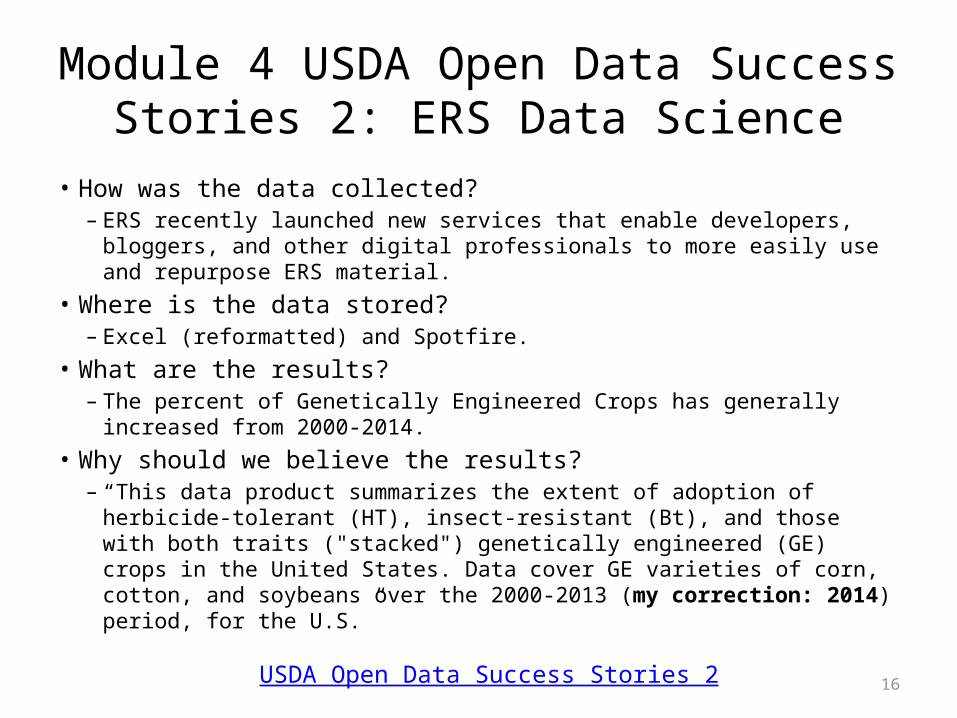
Module 4 USDA Open Data Success Stories 2: ERS Data Science
• How was the data collected?– ERS recently launched new services that enable developers, bloggers, and
other digital professionals to more easily use and repurpose ERS material.• Where is the data stored?
– Excel (reformatted) and Spotfire.• What are the results?
– The percent of Genetically Engineered Crops has generally increased from 2000-2014.
• Why should we believe the results?– “This data product summarizes the extent of adoption of herbicide-tolerant
(HT), insect-resistant (Bt), and those with both traits ("stacked") genetically engineered (GE) crops in the United States. Data cover GE varieties of corn, cotton, and soybeans over the 2000-2013 (my correction: 2014) period, for the U.S.”
USDA Open Data Success Stories 2
17
Module 4 USDA Open Data Success Stories 2: ERS Spotfire
Web Player
18
Module 5 USDA Open Data Success Stories 3: FAS
• The Agricultural Tariff Tracker (http://apps.fas.usda.gov/agtarifftracker/Home/Search) is used by exporters/importers, FAS staff, and other government agencies to assess how competitive a product will be in a market as a result of applied import tariffs. The Agricultural Tariff Tracker is an online searchable database that enables internal and external users to easily locate publicly available data on tariff schedules/rate information resulting from Federal Trade Agreements.
Foreign Agricultural Service (FAS)
19
Module 5 USDA Open Data Success Stories 3: FAS Data Science
• How was the data collected?– The Agricultural Tariff Tracker is used by exporters/importers, FAS
staff, and other government agencies to assess how competitive a product will be in a market as a result of applied import tariffs.
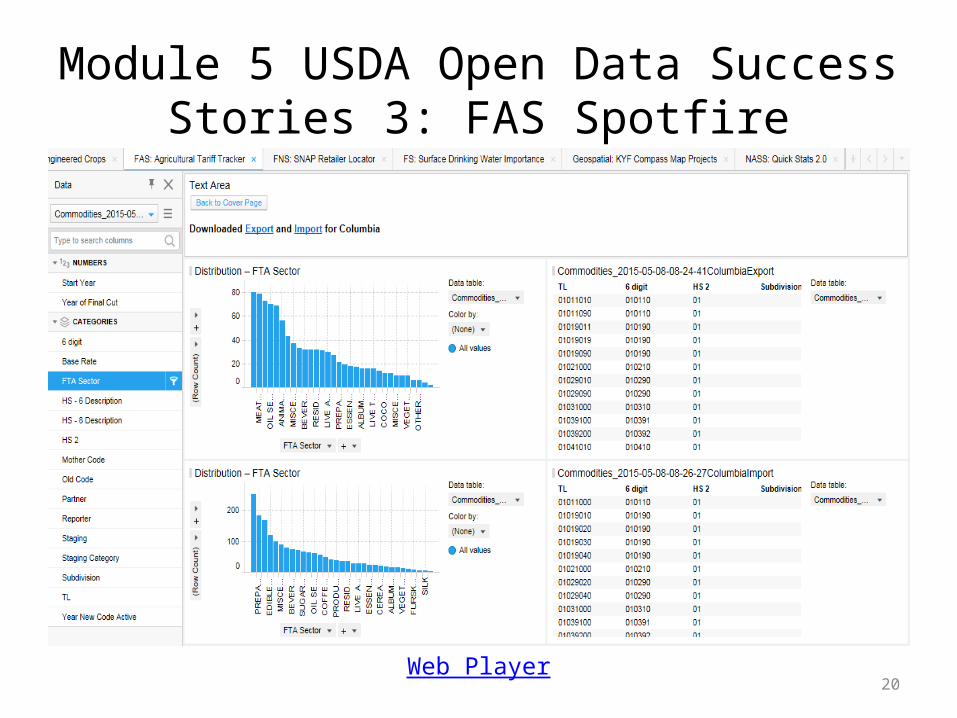
• Where is the data stored?– Excel and Spotfire.
• What are the results?– There is a difference in the FTA Sector Distribution for Export and
Import for Columbia• Why should we believe the results?
– “The information displayed is not official and should only be used as a general reference. Each importing countries customs office maintains the right for final determination of tariff treatment.”
USDA Open Data Success Stories 3
20
Module 5 USDA Open Data Success Stories 3: FAS Spotfire
Web Player
21
Module 6 USDA Open Data Success Stories 4: FNS
• The SNAP Retailer Locator (SRL) published data (http://catalog.data.gov/dataset/snap...-locator-e7cd4) and API (http://www.fns.usda.gov/snap/retailerlocator) that FNS built and updates bi-weekly is being used in a number of applications. . Most of the source code for these apps is available in GitHub.com. Developers are continually leveraging the data and creating new applications that are locally focused or finding new uses. Below are several examples of the Federal government developing tools once and the power of frequently updated and available open source data, creativity, and consumer demand combined.
Food Nutrition Service (FNS)
22
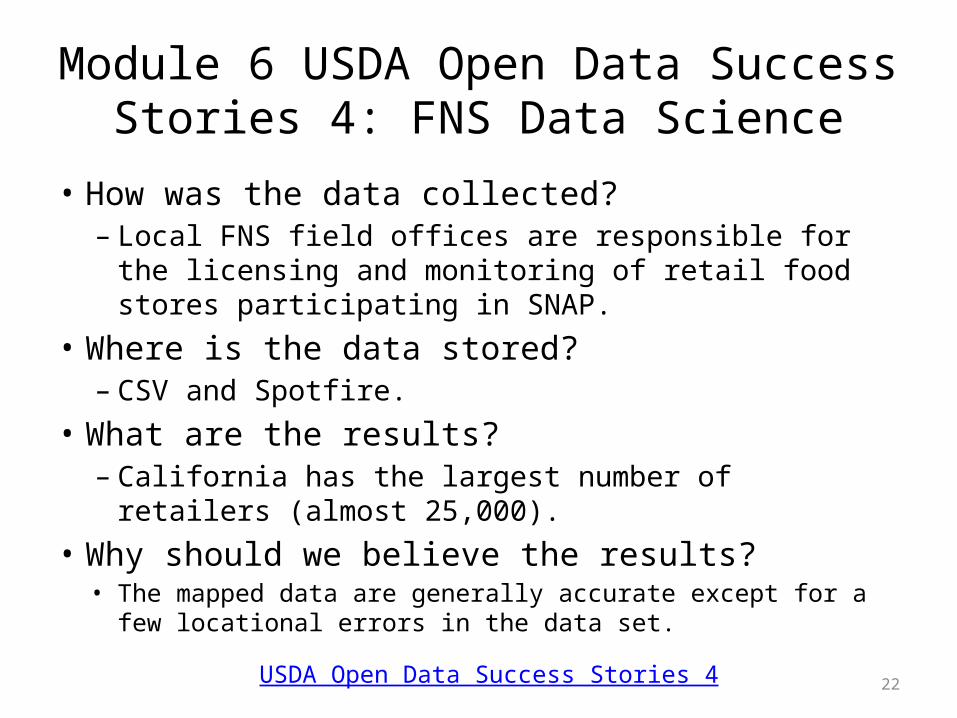
Module 6 USDA Open Data Success Stories 4: FNS Data Science
• How was the data collected?– Local FNS field offices are responsible for the licensing and
monitoring of retail food stores participating in SNAP.• Where is the data stored?
– CSV and Spotfire.• What are the results?
– California has the largest number of retailers (almost 25,000).
• Why should we believe the results?• The mapped data are generally accurate except for a few locational
errors in the data set.USDA Open Data Success Stories 4
23
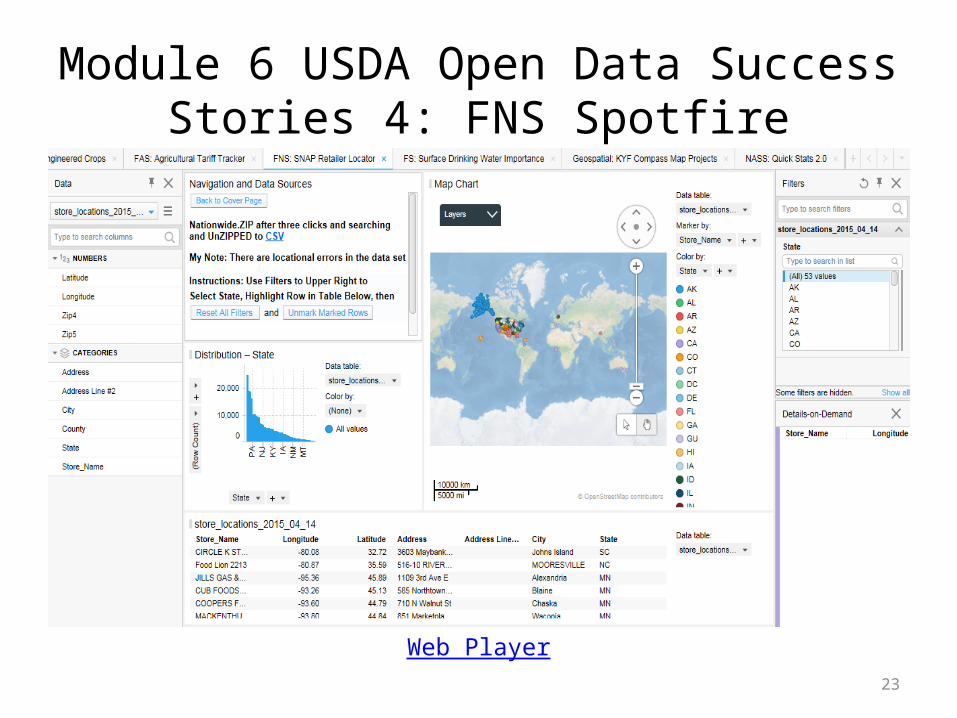
Module 6 USDA Open Data Success Stories 4: FNS Spotfire
Web Player
24
Module 7 USDA Open Data Success Stories 5: FS
• A huge advantage of using “map services” is that they allow the public to directly access the most current Forest Service data, while at the same time reducing the Agency logistics workload via a simple registration process. Forest Service map services are registered with ArcGIS Online, an internationally-recognized source for geospatial data hosted by Esri (founded as the Environmental Systems Research Institute). Two examples are described below:
• The Forest Service Interactive Visitor Map (beta version) provides prospective visitors to national forests and grasslands with access to information about Agency roads, trails, and recreation sites through a simple online interface.
• The Forest Atlas of the United States will be published this year and has an external-customer emphasis, telling the story of Forest Service lands to the public, in understandable terms, using a variety of graphics and GIS maps.
Forest Service (FS)
25
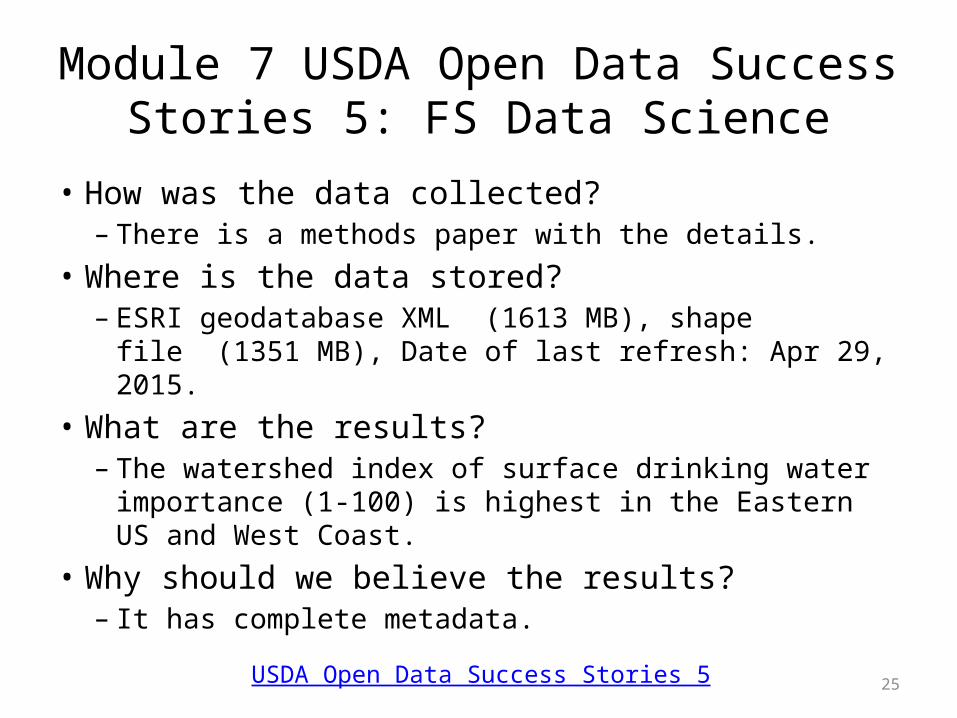
Module 7 USDA Open Data Success Stories 5: FS Data Science
• How was the data collected?– There is a methods paper with the details.
• Where is the data stored?– ESRI geodatabase XML (1613 MB), shape file (1351 MB),
Date of last refresh: Apr 29, 2015.• What are the results?– The watershed index of surface drinking water importance
(1-100) is highest in the Eastern US and West Coast.• Why should we believe the results?– It has complete metadata.
USDA Open Data Success Stories 5
26
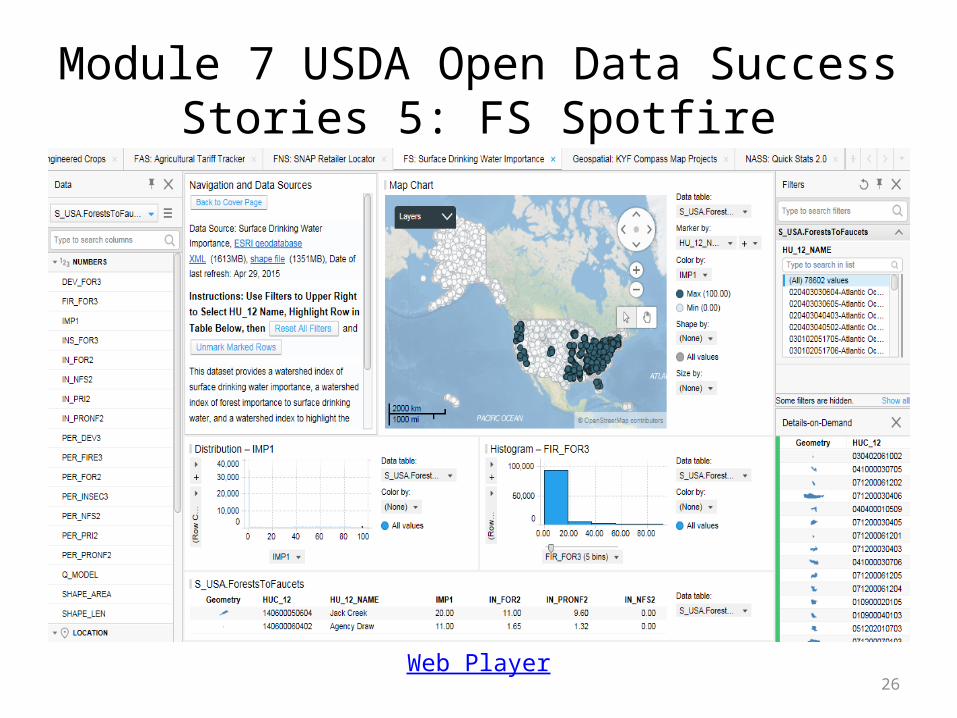
Module 7 USDA Open Data Success Stories 5: FS Spotfire
Web Player
27
Module 8 USDA Open Data Success Stories 6: Geospatial
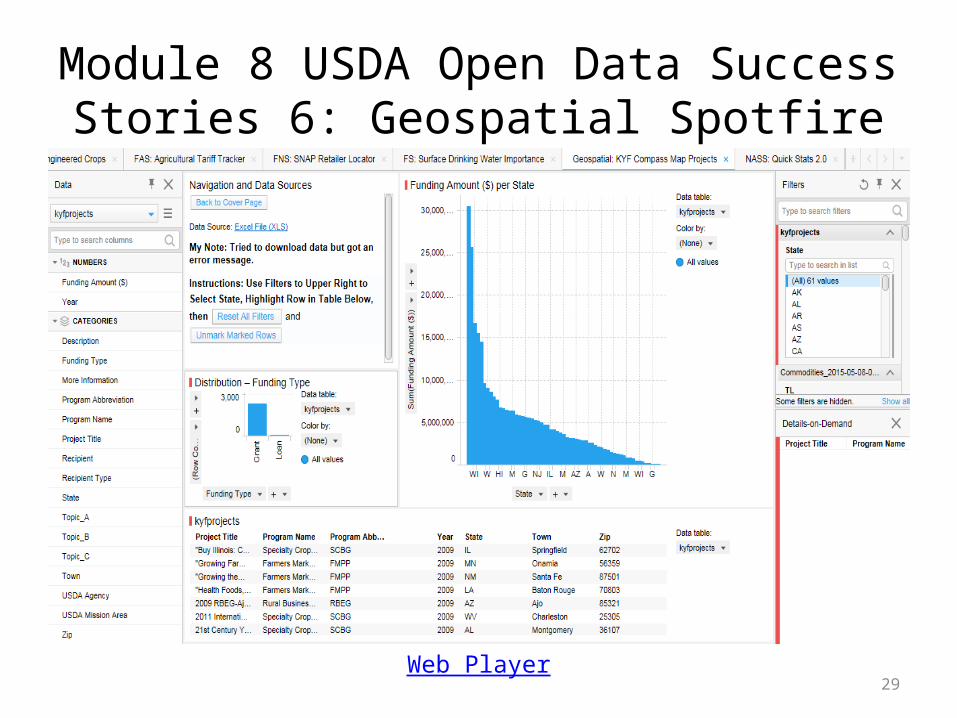
• The “Know Your Farmer, Know Your Food” Compass Map (http://www.usda.gov/wps/portal/usda/...KNOWYOURFARMER) is a data dissemination innovation. The enterprise scale Web map application was launched in Fiscal Year (FY) 2012, and continues to evolve and expand as a core Department data storefront. The solution presents a detailed visual story consolidated in a single interactive map view which thematically organizes and simplifies access to complex local and regional food systems and program delivery data. Data consists of USDA and other federal agency benefits delivery by location, refreshed each year with currently four current years of trend information. Funding awards for business start-ups, infrastructure, diversification, education, food subsidy access, community development, and numerous other programs, are searchable to street level views.Geospatial
28
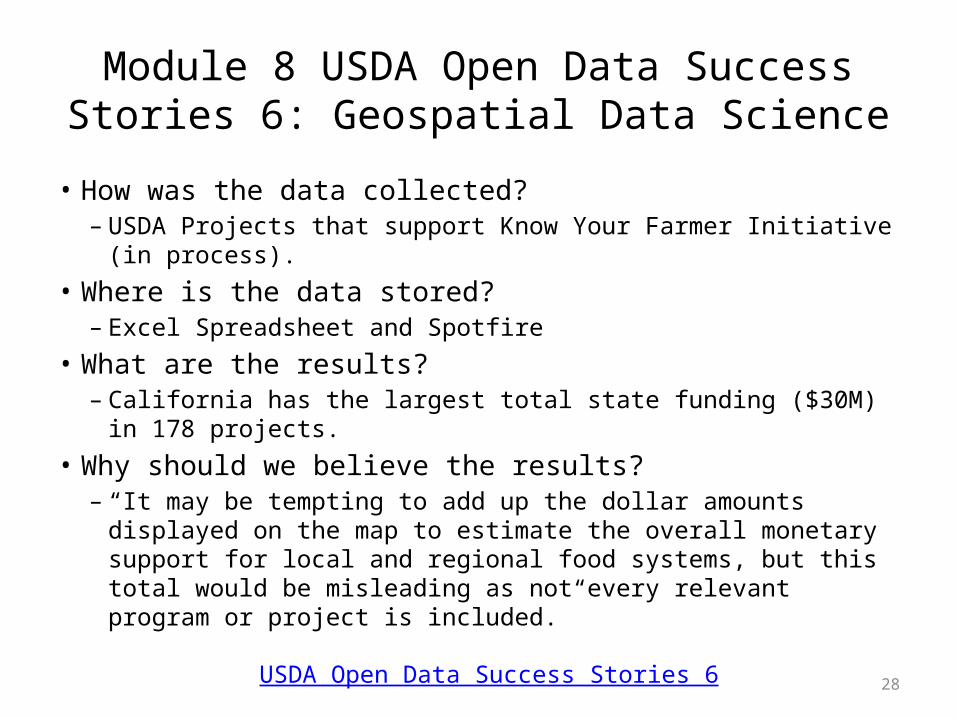
Module 8 USDA Open Data Success Stories 6: Geospatial Data Science
• How was the data collected?– USDA Projects that support Know Your Farmer Initiative (in process).
• Where is the data stored?– Excel Spreadsheet and Spotfire
• What are the results?– California has the largest total state funding ($30M) in 178 projects.
• Why should we believe the results?– “It may be tempting to add up the dollar amounts displayed on the
map to estimate the overall monetary support for local and regional food systems, but this total would be misleading as not every relevant program or project is included.”
USDA Open Data Success Stories 6
29
Module 8 USDA Open Data Success Stories 6: Geospatial Spotfire
Web Player
30
Module 9 USDA Open Data Success Stories 7: NASS
• The National Agricultural Statistics Service (NASS) publishes over 500 surveys each year, focused on United States agricultural statistics. NASS also conducts and publishes the Census of Agriculture every five years. When NASS statistics are published, they are loaded into the Quick Stats database for access by the entire user community through the internet, by using the Quick Stats tool http://www.nass.usda.gov/Quick_Stats/ that NASS developed. Quick Stats was one of the original tools available on Data.gov and now is part of the Open Data initiative.
• NASS statistics are widely used by academia, research, governments, manufacturing, and farmers and ranchers. The Quick Stats tool allows access to all of NASS’ published statistics.
National Agricultural Statistics Service (NASS)
31
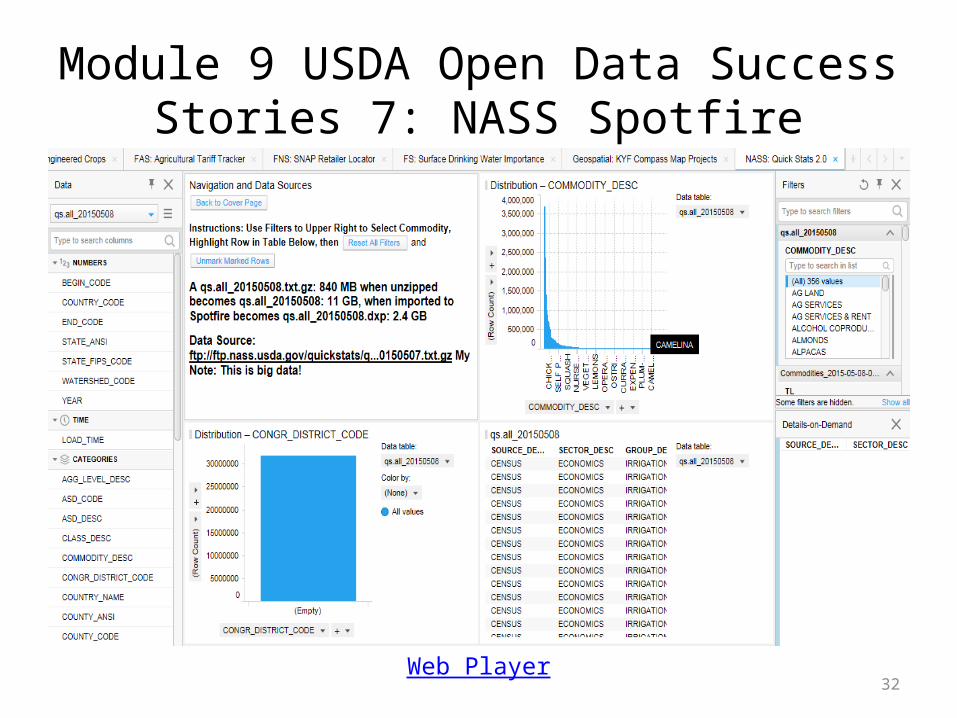
Module 9 USDA Open Data Success Stories 7: NASS Data Science
• How was the data collected?– National Agricultural Statistics Service (NASS) surveys each year (over
500), focused on United States agricultural statistics.• Where is the data stored?
– A qs.all_20150508.txt.gz: 840 MB when unzipped becomes qs.all_20150508: 11 GB, when imported into Spotfire becomes USDAMOOC-Spotfire.dxp: 2.4 GB.
• What are the results?– What has the largest number of Commodity Descriptions and
Congressional District Codes are missing in the data set.• Why should we believe the results?
– They are based on authoritative data and analyzed by a data scientist/statistician.
USDA Open Data Success Stories 7
32
Module 9 USDA Open Data Success Stories 7: NASS Spotfire
Web Player
33
Module 10 Wrap Up: Conclusions and Recommendations
• Key USDA data documents should not be in PDF.
• The USDA Data Catalog should also include a spreadsheet format.
• The USDA Open Data Success Stories should answer the four basic data science questions.
• A Meetup should be organized to provide feedback to the USDA OCIO and Chief Data Officer.
Wrap Up
34
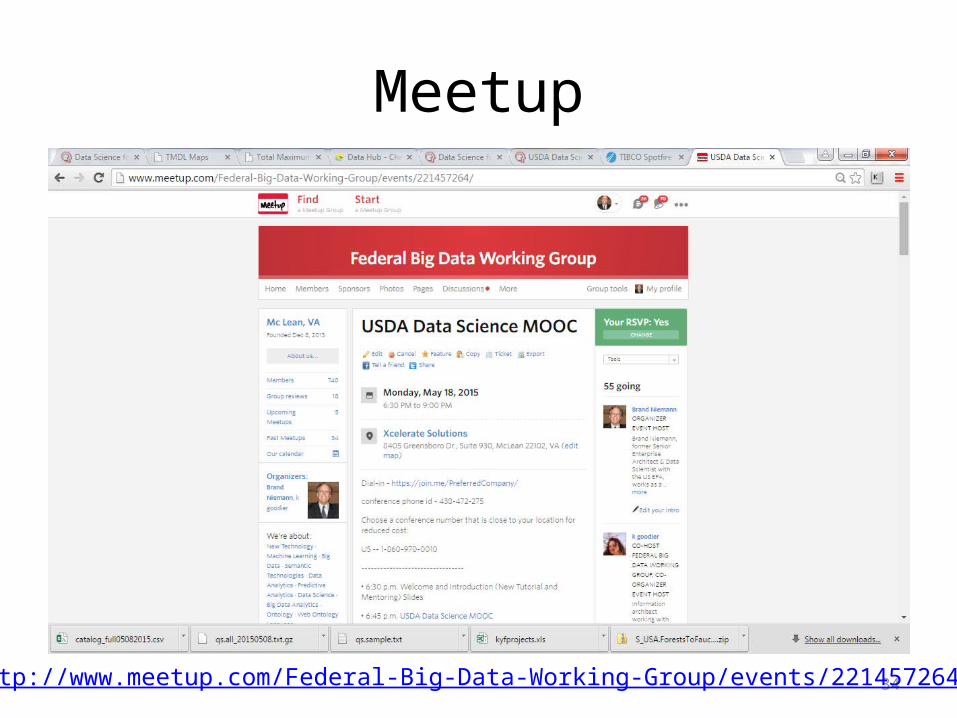
Meetup
http://www.meetup.com/Federal-Big-Data-Working-Group/events/221457264/
35
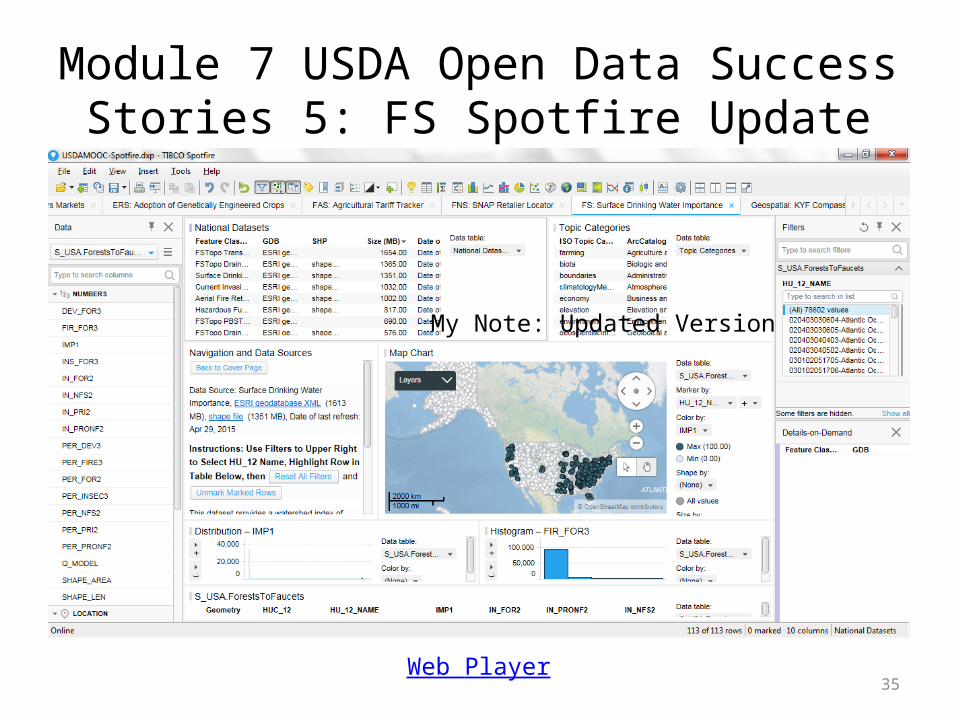
Module 7 USDA Open Data Success Stories 5: FS Spotfire Update
Web Player
My Note: Updated Version
36
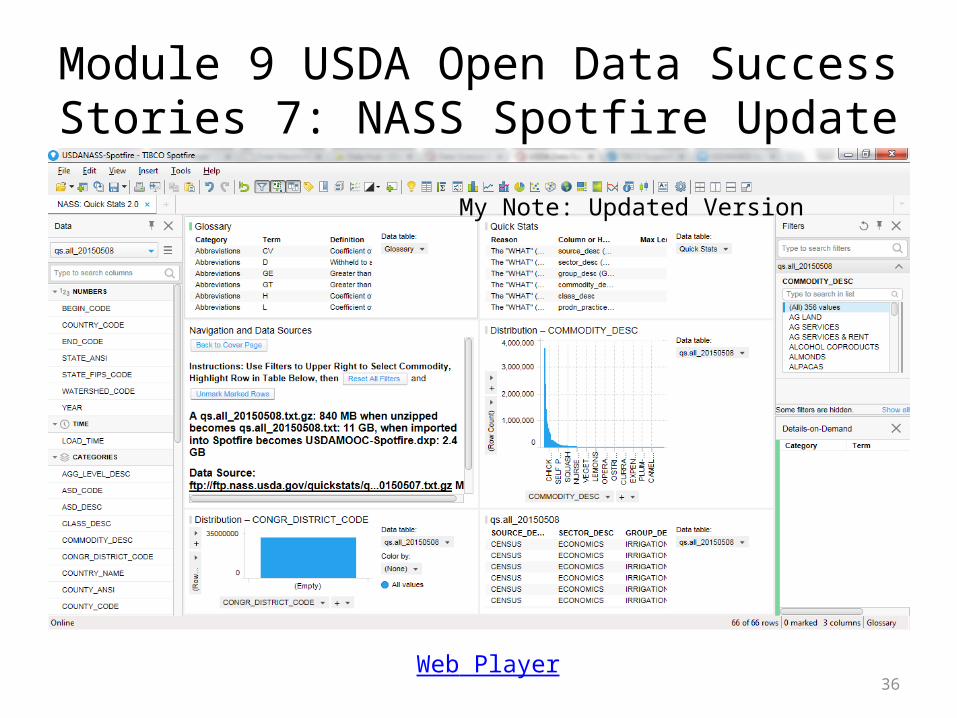
Module 9 USDA Open Data Success Stories 7: NASS Spotfire Update
Web Player
My Note: Updated Version