data visualization for non-programmers
TRANSCRIPT

1 | Data Visualization for Journalists
Data Visualization for Non-Programmers
Jenny Karn | @JennyKarnBeutler Ink
1 2 3 4 5
%
2 | Data Visualization for Journalists @JennyKarn
What you’ll know at the end…
The best practices for data visualization
The best platforms for presentation
The best free tools to visualize data
%

3 | Data Visualization for Journalists @JennyKarn
Why Visualize?

4 | Data Visualization for Journalists @JennyKarn
Why Visualize Data?
AggressivenessSize 13,000 lbs
Speed 25 mph
MAMMOTH SABER-TOOTHED CAT
Size 400 lbs
Aggressiveness
Speed 30 mph

5 | Data Visualization for Journalists
From Numbers to Narrative
1 2 3 4 5
%
6 | Data Visualization for Journalists @JennyKarn
GRAPHIC BY BEUTLER INK FOR KINVEY
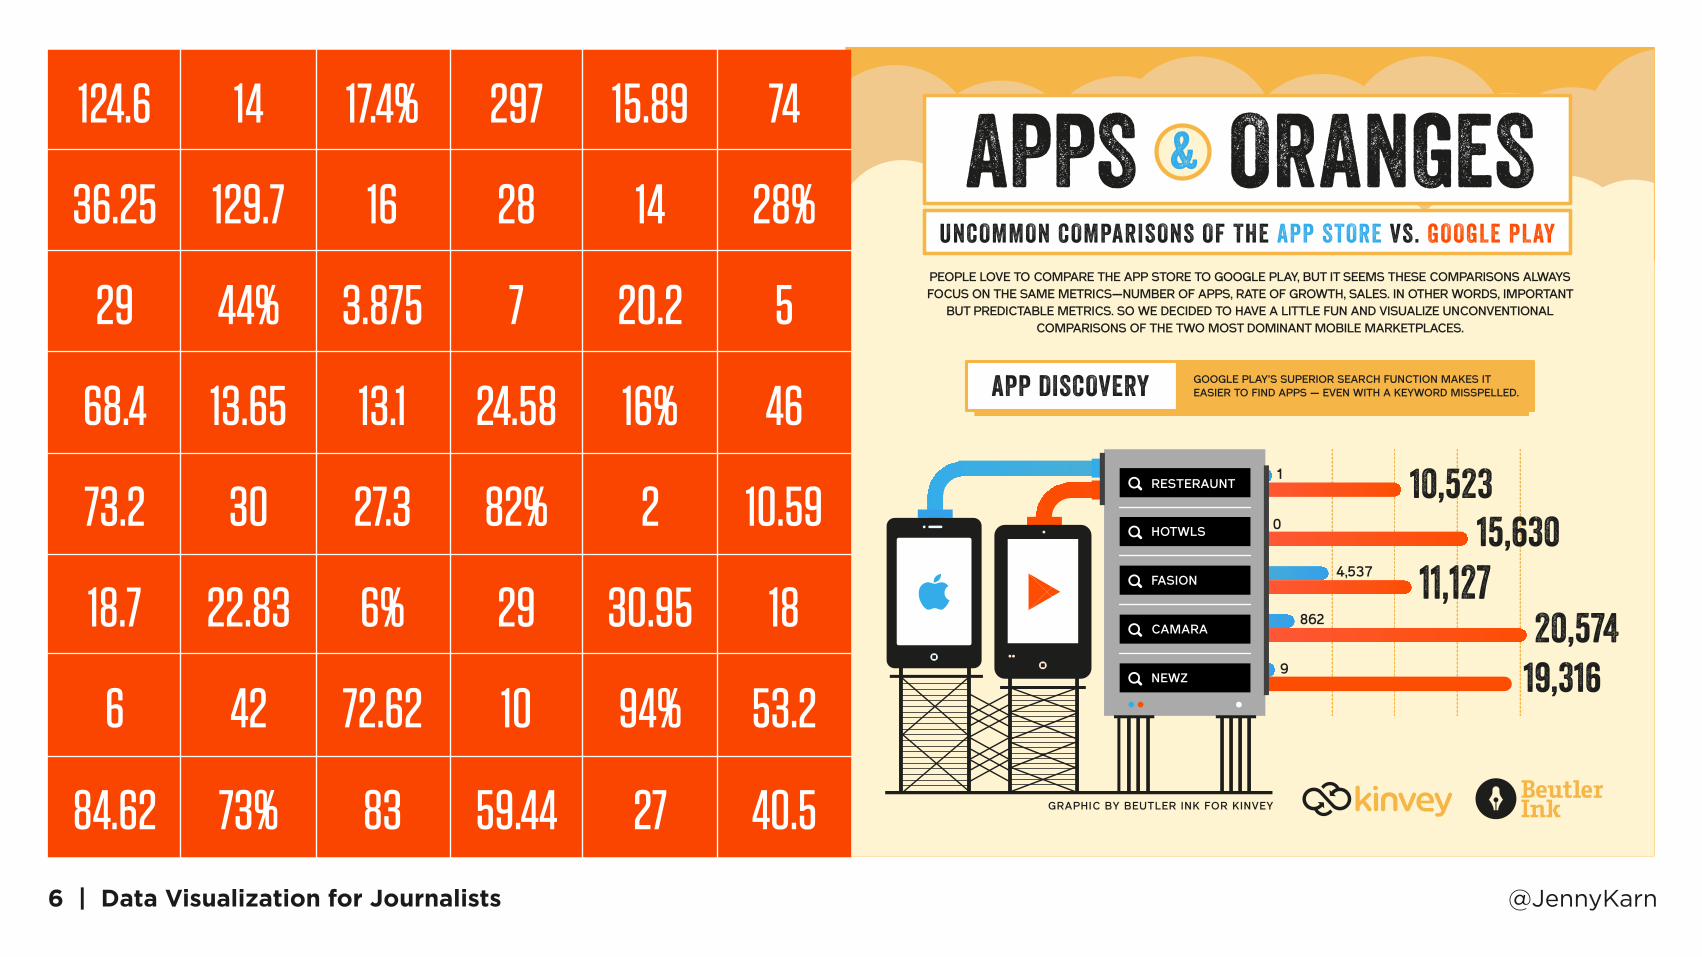
4,537 11,127
1
0
862 20,5749 19,316
10,52315,630
RESTERAUNT
FASION
CAMARA
NEWZ
HOTWLS
APP DISCOVERY GOOGLE PLAY'S SUPERIOR SEARCH FUNCTION MAKES IT EASIER TO FIND APPS — EVEN WITH A KEYWORD MISSPELLED.
PEOPLE LOVE TO COMPARE THE APP STORE TO GOOGLE PLAY, BUT IT SEEMS THESE COMPARISONS ALWAYS FOCUS ON THE SAME METRICS—NUMBER OF APPS, RATE OF GROWTH, SALES. IN OTHER WORDS, IMPORTANT
BUT PREDICTABLE METRICS. SO WE DECIDED TO HAVE A LITTLE FUN AND VISUALIZE UNCONVENTIONAL COMPARISONS OF THE TWO MOST DOMINANT MOBILE MARKETPLACES.
&UNCOMMON COMPARISONS OF THE APP STORE VS. GOOGLE PLAY
124.6
36.25
29
68.4
73.2
18.7
6
84.62
14
129.7
44%
13.65
30
22.83
42
73%
17.4%
16
3.875
13.1
27.3
6%
72.62
83
297
28
7
24.58
82%
29
10
59.44
15.89
14
20.2
16%
2
30.95
94%
27
74
28%
5
46
10.59
18
53.2
40.5

7 | Data Visualization for Journalists @JennyKarn

8 | Data Visualization for Journalists @JennyKarn

Data Sources & Types
1 2 3 4 5
%

10 | Data Visualization for Journalists @JennyKarn
Data You’ve Collected
Data Somebody Else Collected that You’d Like to Highlight
Search & Social Data
Other
Data Sources

11 | Data Visualization for Journalists @JennyKarn
Data Sources
Data You’ve Collected
Data Somebody Else Collected that You’d Like to Highlight
Search & Social Data
Other

12 | Data Visualization for Journalists @JennyKarn
Data Sources
Data You’ve Collected
Data Somebody Else Collected that You’d Like to Highlight
Search & Social Data
Other
13 | Data Visualization for Journalists @JennyKarn
Data Sources
Data You’ve Collected
Data Somebody Else Collected that You’d Like to Highlight
Search & Social Data
Other ? ??

14 | Data Visualization for Journalists @JennyKarn
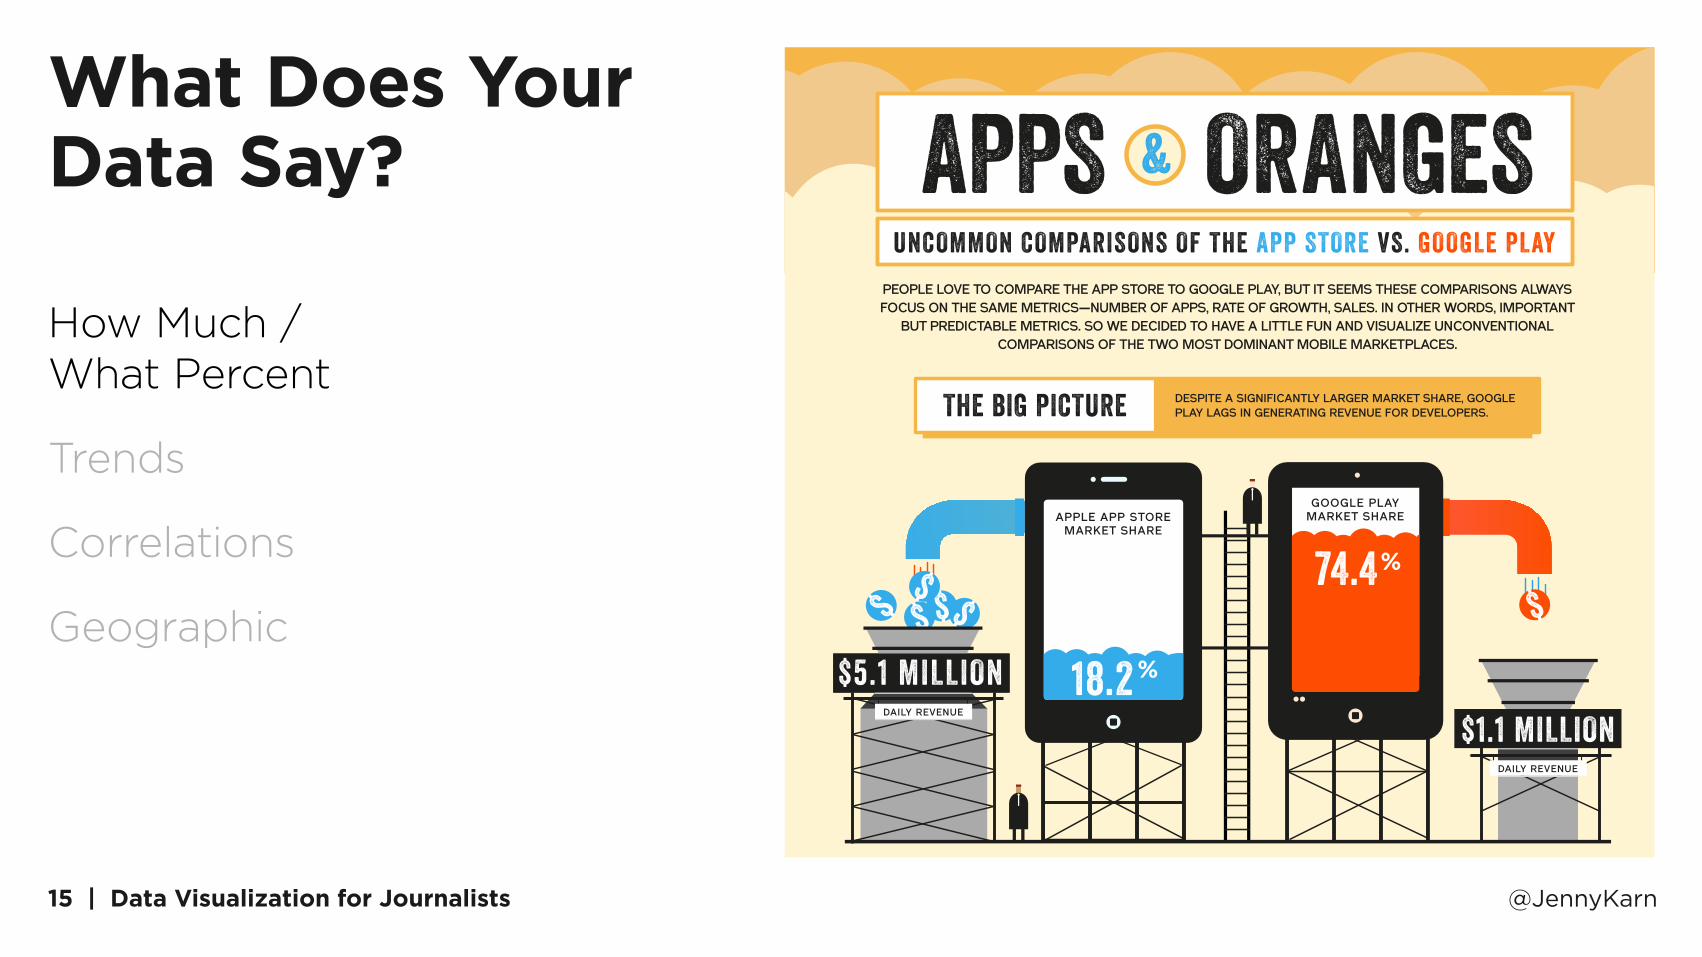
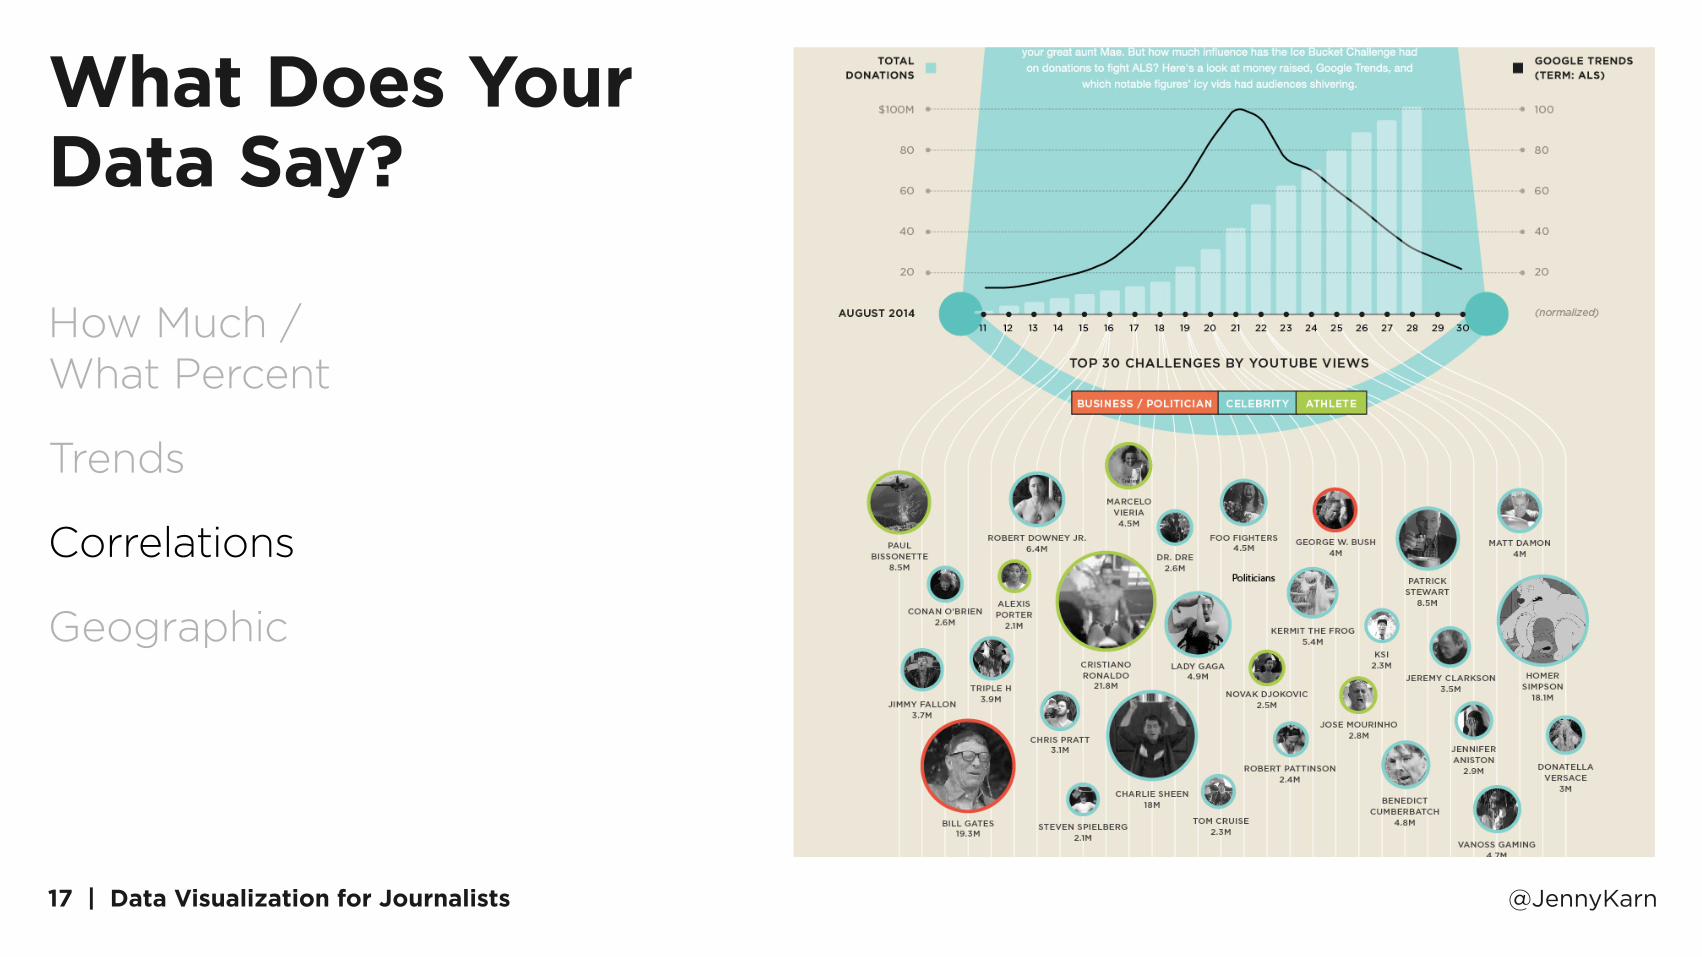
What Does Your Data Say?
How Much / What Percent
Trends
Correlations
Geographic
15 | Data Visualization for Journalists @JennyKarn
SOURCES: AppBrain, Appthority “App Reputation Report”, Distimo “2012 Year in Review” report, Distimo ”May 2013 A Granular App Level Look at Revenues: Google Play vs. Apple App Store” report, Gartner, Impiger Mobile Inc “Amazing Android App Market Stats” Slideshare, MakeUseOf, Mashable, Searchman SEO “App Store SEO” Slideshare, Statista, TechCrunch, The Richest
GRAPHIC BY BEUTLER INK FOR KINVEY
SENDS/RECEIVES DATAWITHOUT ENCRYPTION
AD NETWORKS AND/OR ANALYTICS
LOCATION TRACKING
SINGLE SIGN-ONSUPPORT
CONTACTS ANDADDRESSES
CALENDAR
60
92100
20
14
54
5250
4260
50
0
RISKY BUSINESS ALTHOUGH ALL iOS APPS SOMETIMES SEND UNENCRYPTED DATA, 84% OF USERS CONSIDER iOS TO BE MORE SECURE THAN ANDROID.
NEWCOMERS AND REVENUETHE PERCENTAGE OF REVENUE GENERATED BY NEW ANDROID APPS SUGGESTS GOOGLE PLAY MAY SOON CLOSE THE REVENUE GAP WITH THE APP STORE.
PROPORTIONOF REVENUE:
NEW APPS OF THE TOP 300 U.S. APPS
PROPORTIONOF REVENUE:
NEW PUBLISHERS OF THE TOP 250 U.S. PUBLISHERS
10%5% 15% 20%
iPHONE
iPAD
iPHONE
iPAD
10%5% 15% 20%
$999
$799
$499
$399
$799
A $999.99 PRICE CAP IS IMPOSED BY APPLE
$200
$200
$200
A $200 PRICE CAP IS IMPOSED BY GOOGLE
$199
$159
VIP BLACK
ALPHA TRADER
PREEBS
MIGHTY BRACE PRO
TAP MENU
MOST EXPENSIVEPLAY APP
GOT CASH?
MBE PREPARATION
NURSING CENTRALVUVUZELA
WORLD CUPHORN PLUS
MOST EXPENSIVE APPSFEW APPS APPROACH THE MAX PRICE POINT SET BY EACH MARKETPLACE (AND EVEN IF YOU PAY $999 FOR VIP BLACK ON iOS, YOU CAN'T ACTIVATE THE SERVICE UNTIL YOU VERIFY THAT YOU HAVE "ASSETS AND/OR INCOME IN EXCESS OF £1 MILLION.")
PRICE POINT DISTRIBUTION GOOGLE PLAY'S PRICING MODEL ALLOWS FOR A LARGER NUMBER OF PRICE POINTS (FROM TOP 100 APPS AS OF 7/9/2013).
DIFFERENTPRICE POINTS7
DIFFERENTPRICE POINTS29
APP DISCOVERY GOOGLE PLAY'S SUPERIOR SEARCH FUNCTION MAKES IT EASIER TO FIND APPS — EVEN WITH A KEYWORD MISSPELLED.
4,537 11,127
1
0
862 20,5749 19,316
10,52315,630
RESTERAUNT
FASION
CAMARA
NEWZ
HOTWLS
+ 112 iPad
+ 138 iPh
on
e
+ 46 + 110 iPad
+ 118
iPh
on
e
+ 37
+ 143+ 96
iPh
on
e
RUSSIA
CHINA
+ 94KOREA
+ 74TAIWAN
+ 60
JAPAN
FRANCE
+ 40UK
+ 111iPad
FINLAND
SWEDEN
iPad
iPh
on
e
+ 64
DENMARK
+ 111
iPad
iPh
on
e
TOP 5 COUNTRIES:GROWTH IN REVENUE, 2012
COUNTRY BY COUNTRY ALTHOUGH BOTH STORES ARE SEEING INCREASES IN REVENUE, THE APP STORE CONTINUES TO OUTPACE GOOGLE PLAY OUTSIDE THE U.S.
WHEN IT COMES TO THE TOP PUBLISHERS FOR EACH PLATFORM, THERE'S LITTLE CORRELATION BETWEEN THE NUMBER OF APPS PUBLISHED AND THE NUMBER OF DOWNLOADS GENERATED.(ORDERED BY NUMBER OF DOWNLOADS).
266APPS
2APPS
23APPS 13
APPS
144APPS 135
APPS 126APPS
31APPS
7APPS
60APPS
1 2 3 4 5APPLE GOOGLE GAMELOFT FACEBOOK GOOGLE ROVIO DISNEY GO DEV
TEAM EA ADOBE
TOP PUBLISHERS
CATEGORY BY CATEGORY ANDROID'S OPEN AND CUSTOMIZABLE PLATFORM HAS TRIGGERED A SIZEABLE CATEGORY OF PERSONALIZATION APPS.
GAMES & ENTERTAINMENT
EDUCATION
BOOKS & REFERENCE
26
11
10
14
12
8
GAMES & ENTERTAINMENT
PERSONALIZATION
BOOKS & REFERENCE
THE BIG PICTURE DESPITE A SIGNIFICANTLY LARGER MARKET SHARE, GOOGLE PLAY LAGS IN GENERATING REVENUE FOR DEVELOPERS.
$5.1 MILLION
GOOGLE PLAYMARKET SHAREAPPLE APP STORE
MARKET SHARE
74.4
18.2$1.1 MILLION
DAILY REVENUE
$5.1 MILLIONDAILY REVENUE
PEOPLE LOVE TO COMPARE THE APP STORE TO GOOGLE PLAY, BUT IT SEEMS THESE COMPARISONS ALWAYS FOCUS ON THE SAME METRICS—NUMBER OF APPS, RATE OF GROWTH, SALES. IN OTHER WORDS, IMPORTANT
BUT PREDICTABLE METRICS. SO WE DECIDED TO HAVE A LITTLE FUN AND VISUALIZE UNCONVENTIONAL COMPARISONS OF THE TWO MOST DOMINANT MOBILE MARKETPLACES.
&UNCOMMON COMPARISONS OF THE APP STORE VS. GOOGLE PLAY
What Does Your Data Say?
How Much / What Percent
Trends
Correlations
Geographic

16 | Data Visualization for Journalists @JennyKarn
What Does Your Data Say?
How Much / What Percent
Trends
Correlations
Geographic
17 | Data Visualization for Journalists @JennyKarn
What Does Your Data Say?
How Much / What Percent
Trends
Correlations
Geographic

18 | Data Visualization for Journalists @JennyKarn
What Does Your Data Say?
How Much / What Percent
Trends
Correlations
Geographic

19 | Data Visualization for Journalists @JennyKarn
What Does Your Data Say?
How Much / What Percent
Trends
Correlations
Geographic

Getting Started with Data Viz
1 2 3 4 5
%

21 | Data Visualization for Journalists @JennyKarn
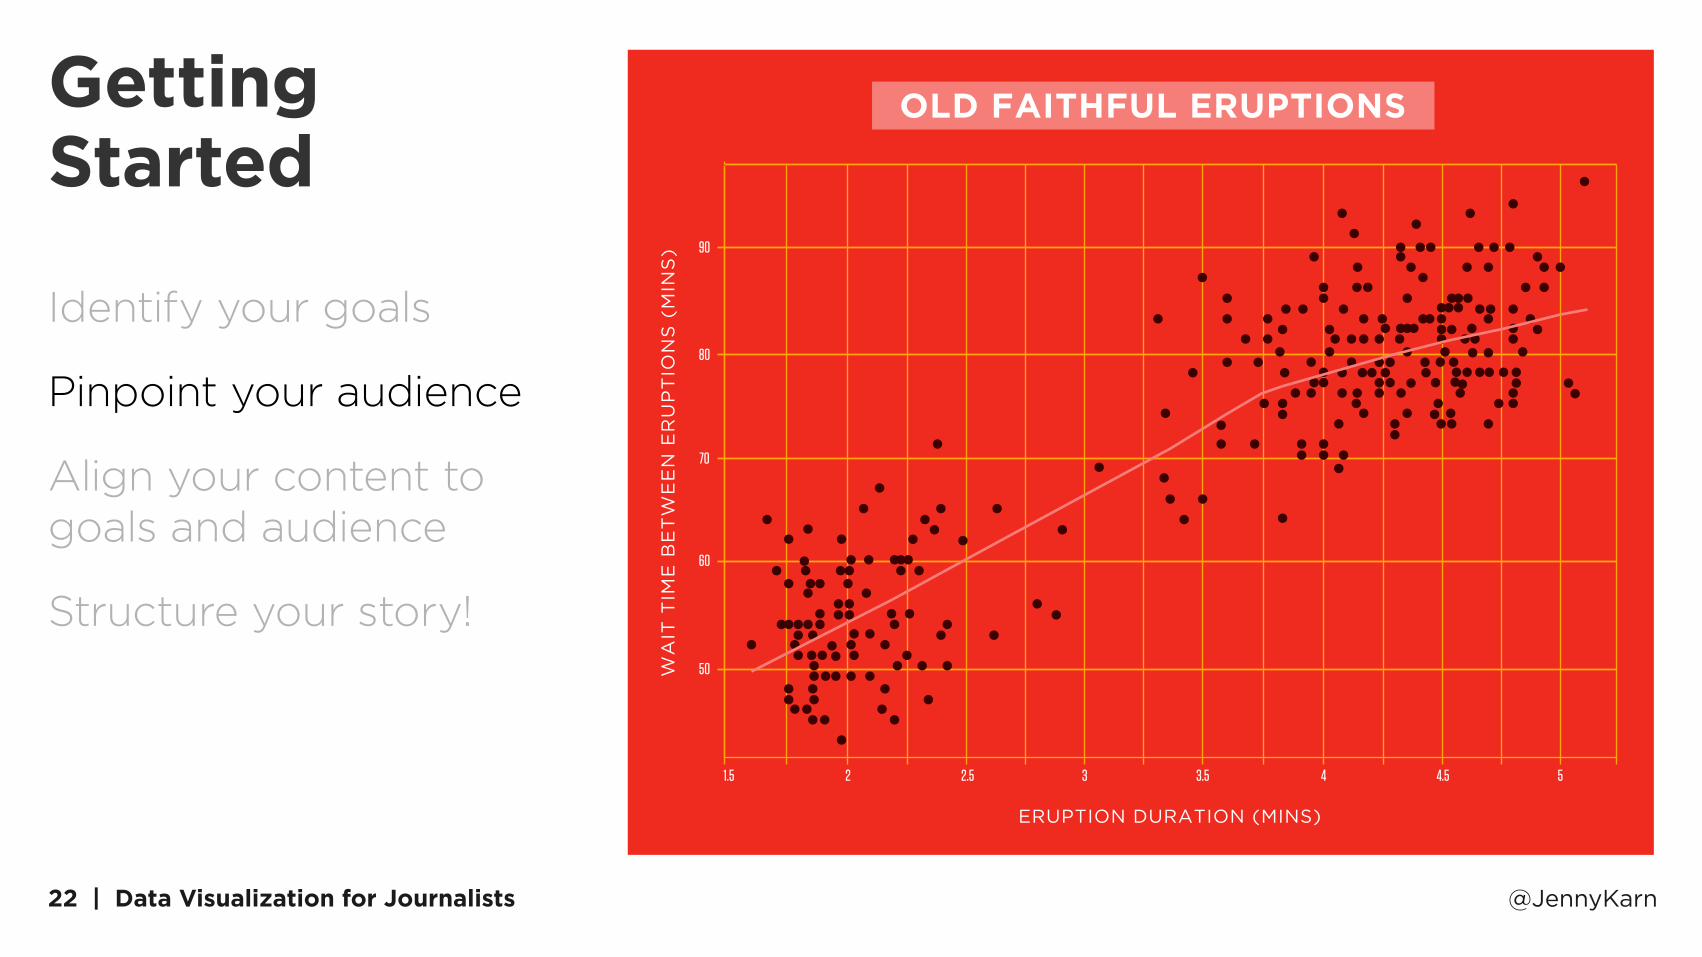
Getting Started
Identify your goals
Pinpoint your audience
Align your content to goals and audience
Structure your story!
TWEETS
PRESENTATIONS
FACEBOOK SHARES
DOWNLOADS
VIEWS
EMBEDS
COMMENTSCLICK
THROUGHS
EMAILS
22 | Data Visualization for Journalists @JennyKarn
Getting Started
Identify your goals
Pinpoint your audience
Align your content to goals and audience
Structure your story!
OLD FAITHFUL ERUPTIONS
ERUPTION DURATION (MINS)
WA
IT T
IME
BE
TW
EE
N E
RU
PT
ION
S (
MIN
S)
1.5 2 2.5 3 3.5 4 4.5 5
50
60
70
80
90

23 | Data Visualization for Journalists @JennyKarn
Getting Started
Identify your goals
Pinpoint your audience
Align your content to goals and audience
Structure your story!
PRESENTATION
INFOGRAPHIC
SOCIAL GRAPHIC
EBOOK/WHITE PAPER
SNAPSHOT
%

24 | Data Visualization for Journalists @JennyKarn
Getting Started
Identify your goals
Pinpoint your audience
Align your content to goals and audience
Structure your story!
25 | Data Visualization for Journalists @JennyKarn
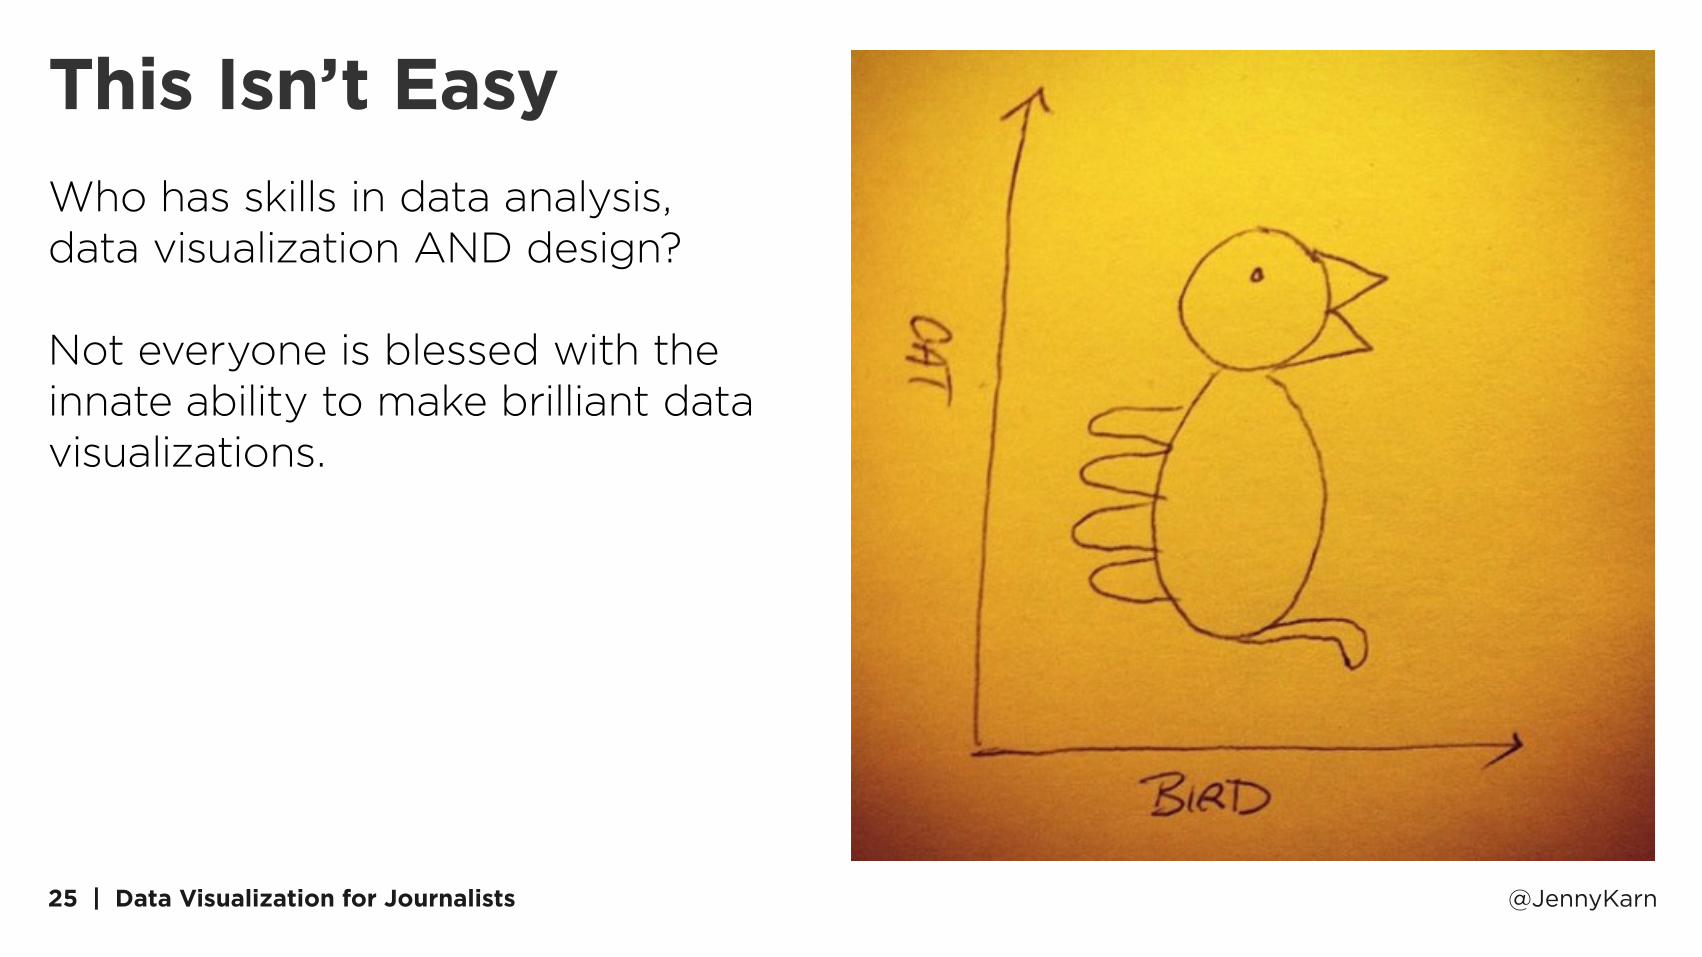
This Isn’t Easy
Who has skills in data analysis, data visualization AND design?
Not everyone is blessed with the innate ability to make brilliant data visualizations.

These Tools Can Help
1 2 3 4 5
%

27 | Data Visualization for Journalists @JennyKarn
URLwww.infoactive.co
Descriptioninfographic builder that can create interactive visualizations
Pricestarts at $12 per month
Interface Usability
Results Customization

28 | Data Visualization for Journalists @JennyKarn
Allows you to create interactive infographics, not just static images
Allows raw data uploads
Limited, though high quality options in the free trial

29 | Data Visualization for Journalists @JennyKarn
URLwww.infogr.am
DescriptionInfographic creation tool
PriceFree with options to upgrade
Interface Usability
Results Customization

30 | Data Visualization for Journalists @JennyKarn
Allows data (live or static) uploads
Templates are very easy to customize and update
Does not allow downloads of finished projects or photo additions without upgrading to paid version

31 | Data Visualization for Journalists @JennyKarn
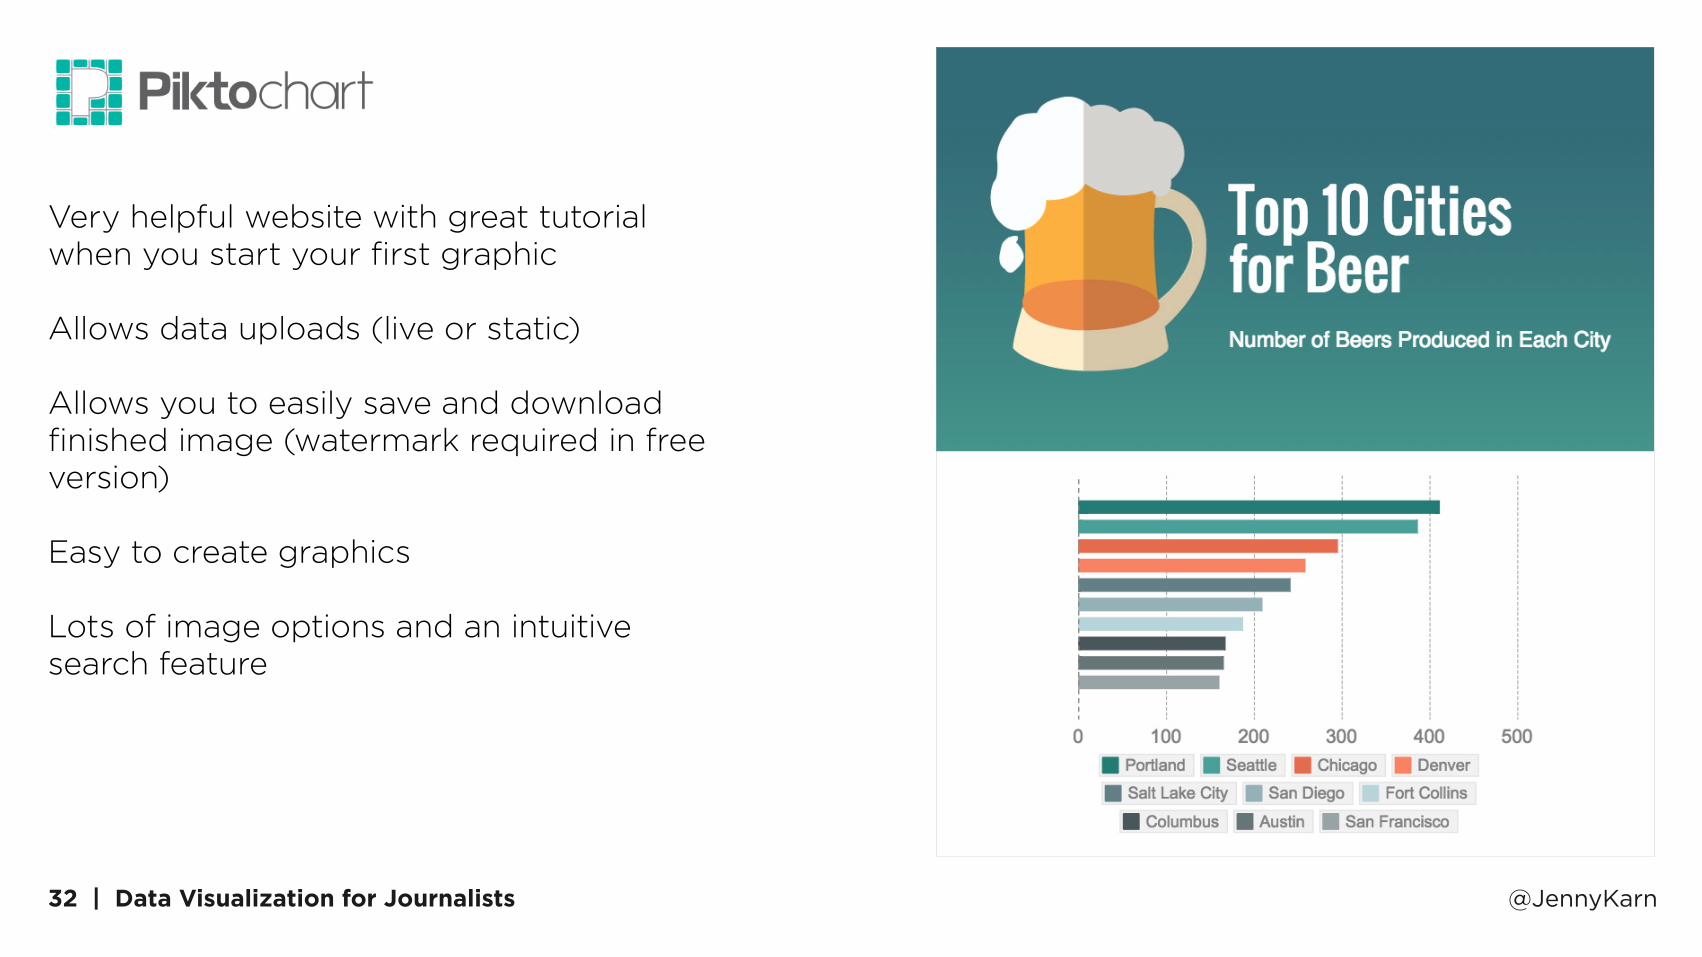
URLwww.piktochart.com
DescriptionFree infographic creation tool
PriceFree with option to upgrade
Interface Usability
Results Customization
32 | Data Visualization for Journalists @JennyKarn
Very helpful website with great tutorial when you start your first graphic
Allows data uploads (live or static)
Allows you to easily save and download finished image (watermark required in free version)
Easy to create graphics
Lots of image options and an intuitive search feature

33 | Data Visualization for Journalists @JennyKarn
URLwww.emaze.com
DescriptionA presentation tool with some chart functionality
PriceFree with options to upgrade
Interface Usability
Results Customization

34 | Data Visualization for Journalists @JennyKarn
Lots of templates to choose from
Easy to add charts to slide formats
Does not allow data uploads or even pasting data into interface

35 | Data Visualization for Journalists @JennyKarn
URLwww.haikudeck.com
DescriptionA free presentation tool that includes some chart functionality
PriceFree with options to upgrade
Interface Usability
Results Customization

36 | Data Visualization for Journalists @JennyKarn
A free presentation tool
Impressive results but time- consuming
No templates
37 | Data Visualization for Journalists @JennyKarn
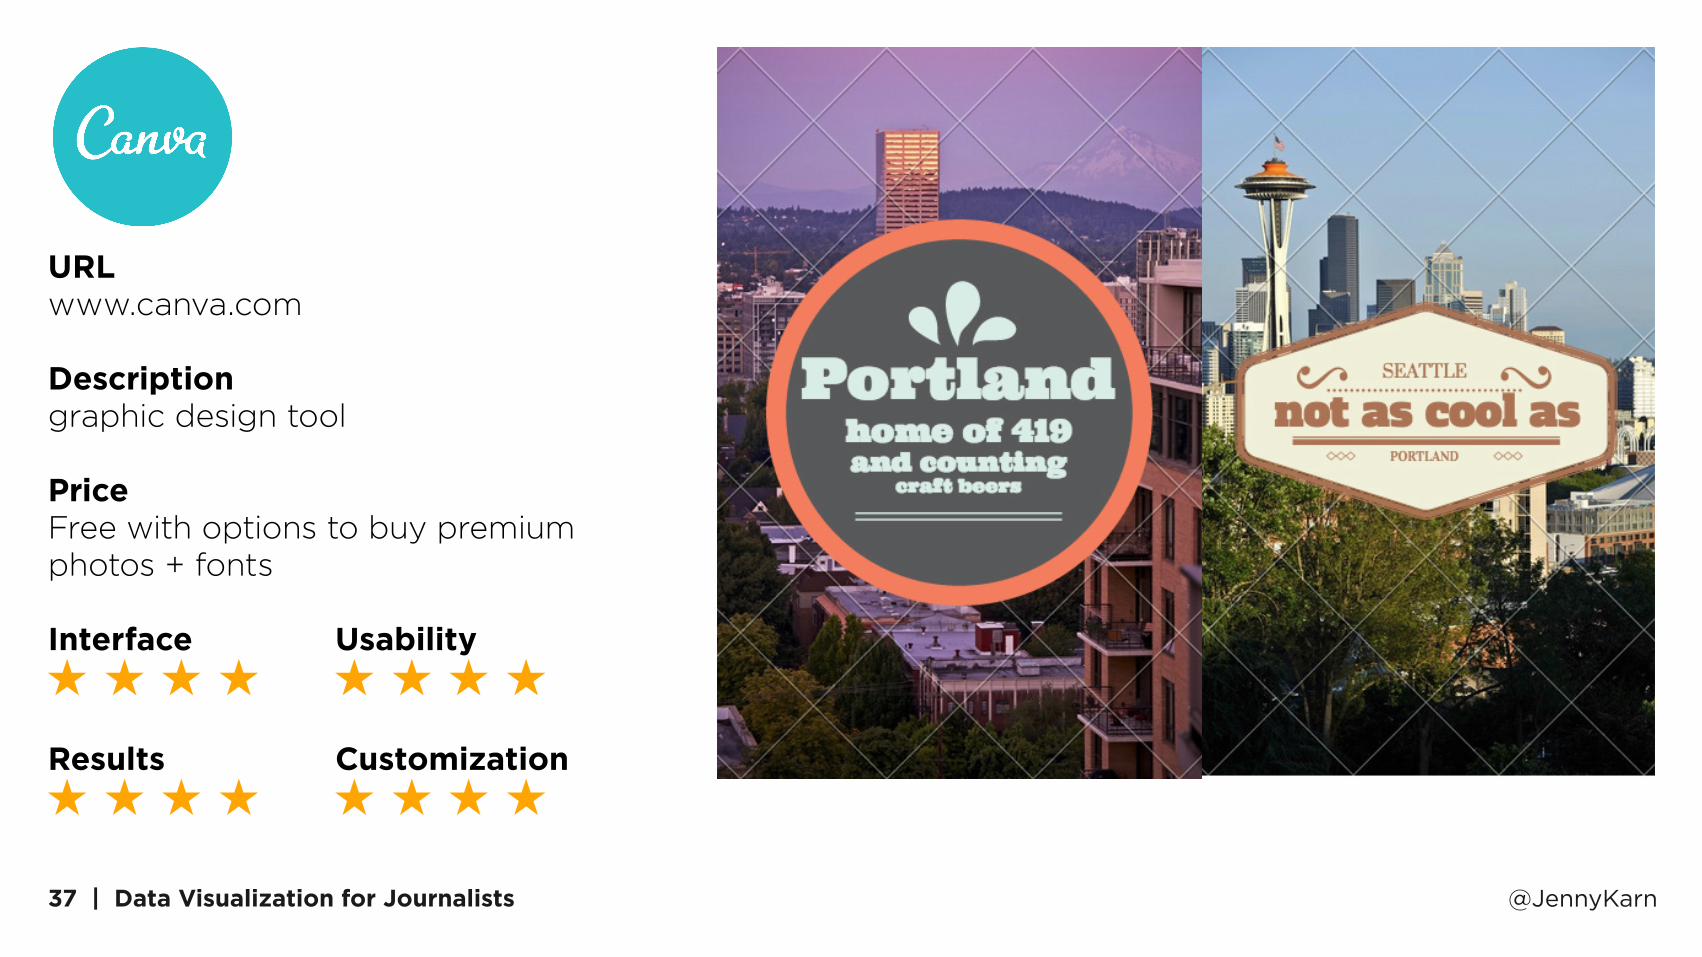
URL www.canva.com
Description graphic design tool
Price Free with options to buy premium photos + fonts
Interface Usability
Results Customization

38 | Data Visualization for Journalists @JennyKarn
Although this site does not offer any chart functionality, it’s such a powerful graphic design tool that it’s worth mentioning
The site offers hundreds of templates for social, presentations, posters, and more
You can easily upload and integrate your own content
39 | Data Visualization for Journalists @JennyKarn
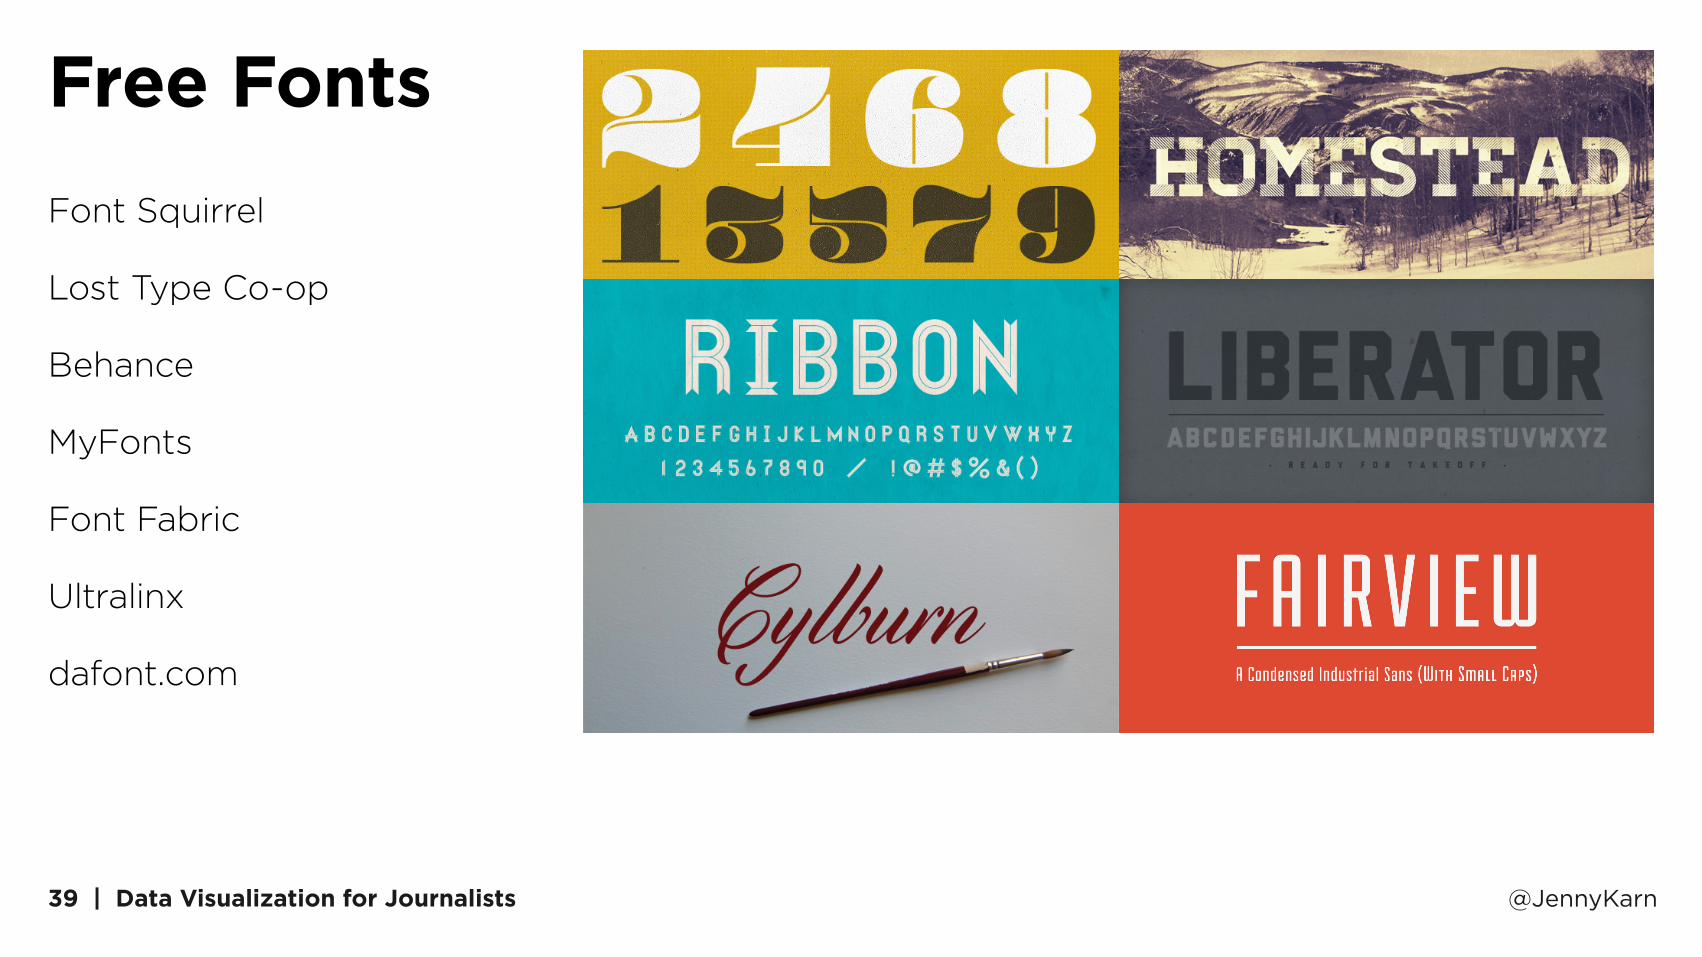
Free Fonts
Font Squirrel
Lost Type Co-op
Behance
MyFonts
Font Fabric
Ultralinx
dafont.com
40 | Data Visualization for Journalists @JennyKarn
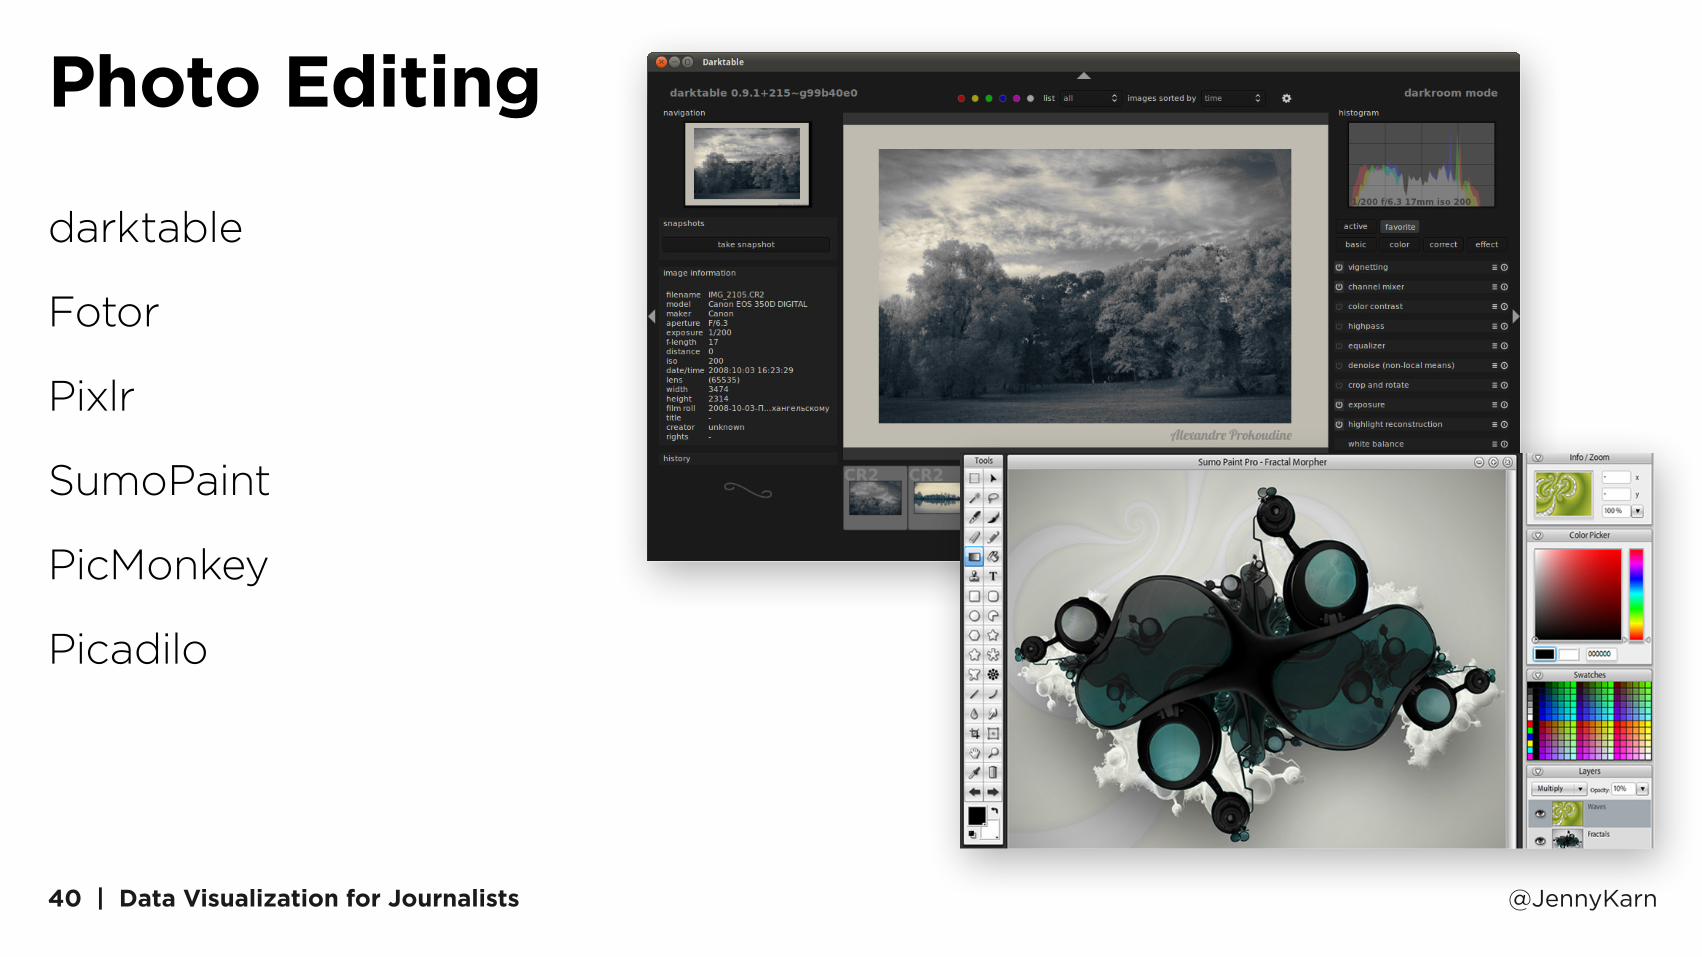
Photo Editing
darktable
Fotor
Pixlr
SumoPaint
PicMonkey
Picadilo
41 | Data Visualization for Journalists
Let’s keep in [email protected]
Twitter@jennykarn
Co-Founder & VP of Content @BeutlerInk
1 2 3 4 5
%