data wrangling in the tidyverse (pdf) - data science for ... · pdf filedata wrangling in the...
TRANSCRIPT

Data Wrangling in the Tidyverse
21st Century R
DS Portugal Meetup, at Farfetch, Porto, Portugal
April 19, 2017
Jim Porzak
Data Science for Customer Insights
4/27/2017 1
Outline
1. A very quick introduction to R
2. The tidyverse
3. A real world example
4. Wrap up, questions, & learning more
Appendix has links to learn more.
4/27/2017 2

Brief history of R
● First there was S by John Chambers, et al
– 1976: first internal production use at Bell Labs
– 1980: first distribution outside of Bell Labs
● Then R by Ross Ihaka & Robert Gentleman at
University of Auckland
– 1995: the initial release,
– 2000: the V1.0 “production” release
● RStudio & Hadley Wickham
– 2011: the initial V0.92 release of RStudio IDE
– 2017: R for Data Science published
4/27/2017 3

Growth of R
4/27/2017 4
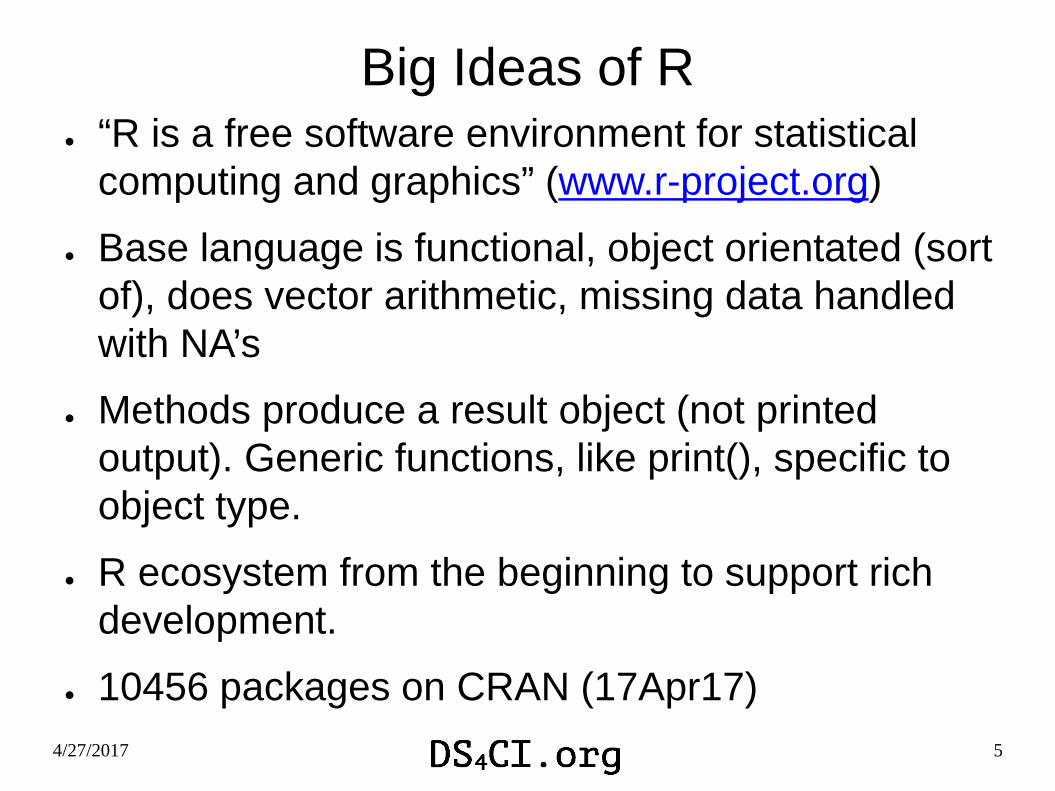
Big Ideas of R● “R is a free software environment for statistical
computing and graphics” (www.r-project.org)
● Base language is functional, object orientated (sort
of), does vector arithmetic, missing data handled
with NA’s
● Methods produce a result object (not printed
output). Generic functions, like print(), specific to
object type.
● R ecosystem from the beginning to support rich
development.
● 10456 packages on CRAN (17Apr17)
4/27/2017 5

The dataframe in R
● Columns of same data type:
– Character, integer, real, logical, Date, POSIX
(timestamp with optional time zone)
– But mix data types in dataframe
● Rows across columns
● Same idea as a SQL table, Excel sheet (with
typed columns), CSV or tab delimited text files,
etc.
● RAM resident (but with good workarounds for
big data)
4/27/2017 6

The tidyverse - Outline
● Hadley’s data science workflow
● Packages in the tidyverse
– Packages that are friends of the tidyverse
● dplyr package – the data wrangling workhorse
● Tidy & untidy data
● tidyr package – getting tidy
● Quick look at other packages & functions
4/27/2017 7

Hadley’s Data Science Workflow
This and most figures in this section are from
R for Data Science by Garrett Grolemund and
Hadley Wickham at r4ds.had.co.nz
4/27/2017 8

install.packages("tidyverse")
core:
● ggplot2, for data visualisation.
● dplyr, for data manipulation.
● tidyr, for data tidying.
● readr, for data import.
● purrr, for functional programming.
● tibble, for tibbles, a modern re-
imagining of data frames.
friends for data manipulation:
● hms, for times.
● stringr, for strings.
● lubridate, for date/times.
● forcats, for factors.
friends for data import:
● DBI, for databases.
● haven, for SPSS, SAS and Stata files.
● httr, for web apis.
● jsonlite for JSON.
● readxl, for .xls and .xlsx files.
● rvest, for web scraping.
● xml2, for XML.
friends for modeling:
● modelr, for simple modelling within a
pipeline
● broom, for turning models into tidy
data
4/27/2017 9

Loading tidyverse Packages
library(tidyverse)
– loads the core packages
The friends must be loaded independently, eg
– library(stringr)
– library(lubridate)
– Etc.
4/27/2017 10

dplyr Data Wrangling Verbs● filter( ) – rows by their values
● arrange( ) – reorder rows
● select( ) – pick and/or exclude columns
● mutate( ) – create new columns
● summarize( ) – collapse rows with summaries
And any of above may scoped over a group of rows with:
● group_by( ) – define groups based on categorical variables
When working with data in RDMS’ (eg Redshift):
● collect( ) – build SQL for the prior verbs, send to RDBMS,
and pull down result set while maintaining data types.
4/27/2017 11
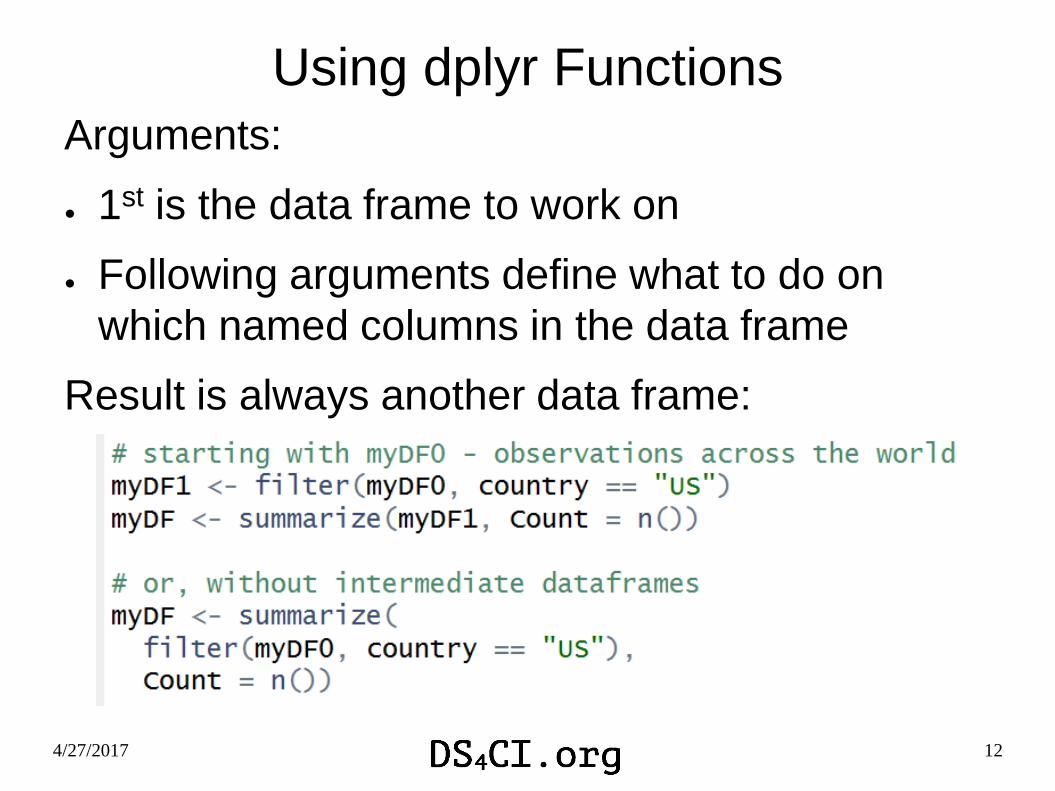
Using dplyr Functions
Arguments:
● 1st is the data frame to work on
● Following arguments define what to do on
which named columns in the data frame
Result is always another data frame:
4/27/2017 12

Pipes to the Rescue!
Takes the result of the LHS and pushes into the
first argument of the RHS:
4/27/2017 13
%>%
This is a pipe.
dplyr Example (1 of 2)
4/27/2017 14
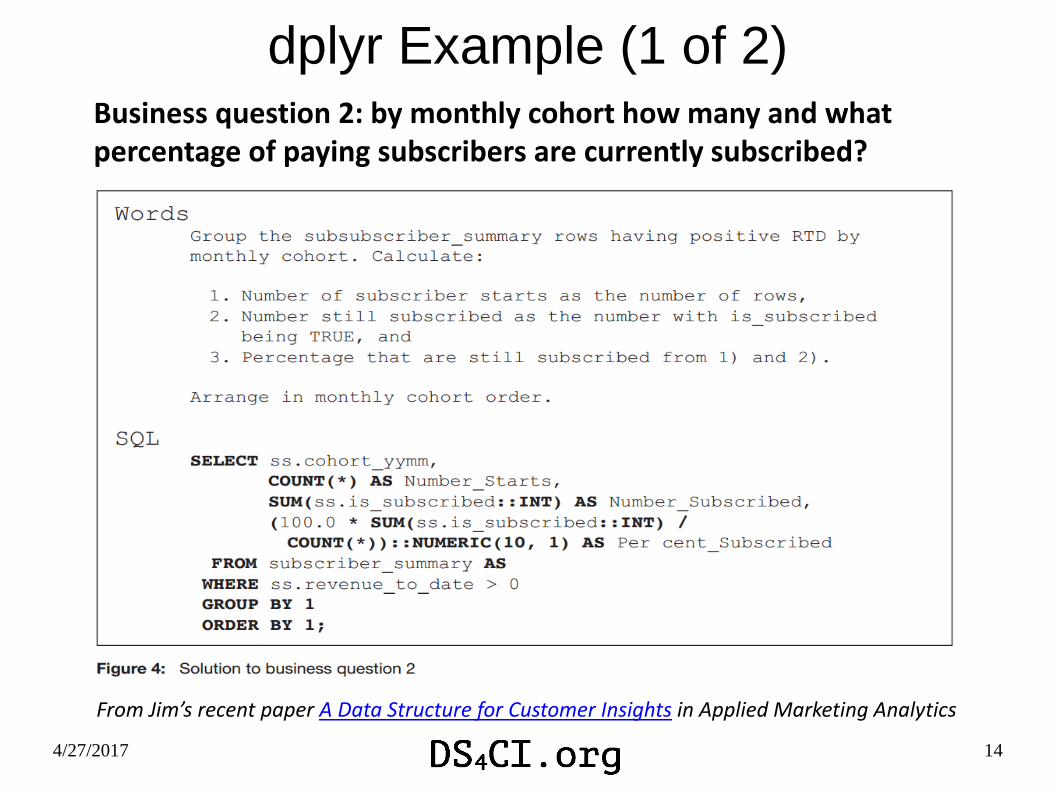
From Jim’s recent paper A Data Structure for Customer Insights in Applied Marketing Analytics
Business question 2: by monthly cohort how many and what percentage of paying subscribers are currently subscribed?

dplyr Example (2 of 2)
4/27/2017 15
Observations:• Fewer lines than SQL (by 1)• A more natural sequence: start with data source, end with order• Reference prior calculations by name!

Hadley’s 3 Rules for Being Tidy
Note that any two conditions imply the third.
If values are not in cells, where are they?
4/27/2017 16

Tidy Case Study
The widest,
un-tidyist,
worst data file,
ever!
Which came in as
an ___________ file,
of course.
4/27/2017 17

Tidy Case Study
The first ~50 rows (out of 3400) & 775 columns:
4/27/2017 18
A process flow survey broken down into Stages, Process Groups,
and individual Tasks coded as <stage>. <process group>. <task>
For each we have # cycles to pass QC and time per cycle.
The last few data columns:
The first few data columns:
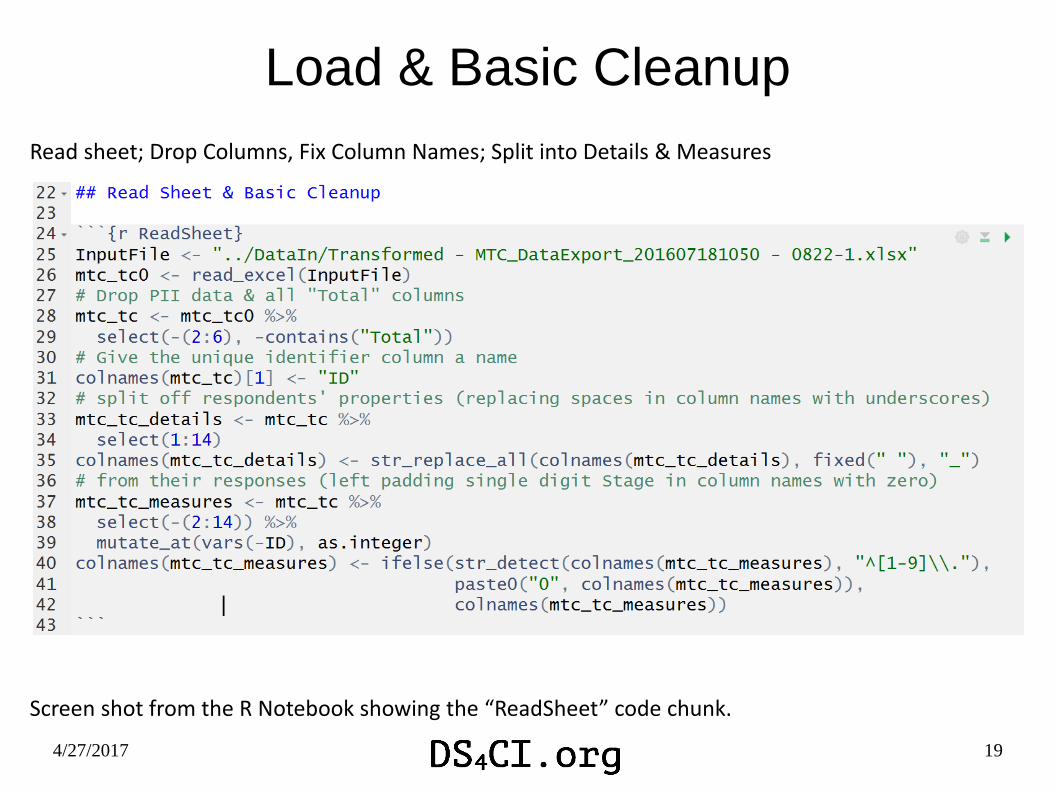
Load & Basic Cleanup
4/27/2017 19
Screen shot from the R Notebook showing the “ReadSheet” code chunk.
Read sheet; Drop Columns, Fix Column Names; Split into Details & Measures

Gather our Columns to be Tidy
In this example, from R4DS, the observations for the
years are in individual columns. We want a column for
the year and a second column for the number of cases.
“year” and “cases” are the key/value pair.
4/27/2017 20

Tidying up (1 of 4)Prior step left us with:
4/27/2017 21
Now: 1) gather data columns into key/value pairs called TaskMetric &
Value; 2) separate TaskMetric into keys Task & Metric
Column name becomes key: “TaskMetric”
Data becomes value: “Value”

4/27/2017 22
Tidying up (2 of 4)
Include “Tot Task Time” which is just product:
Cycle * Time
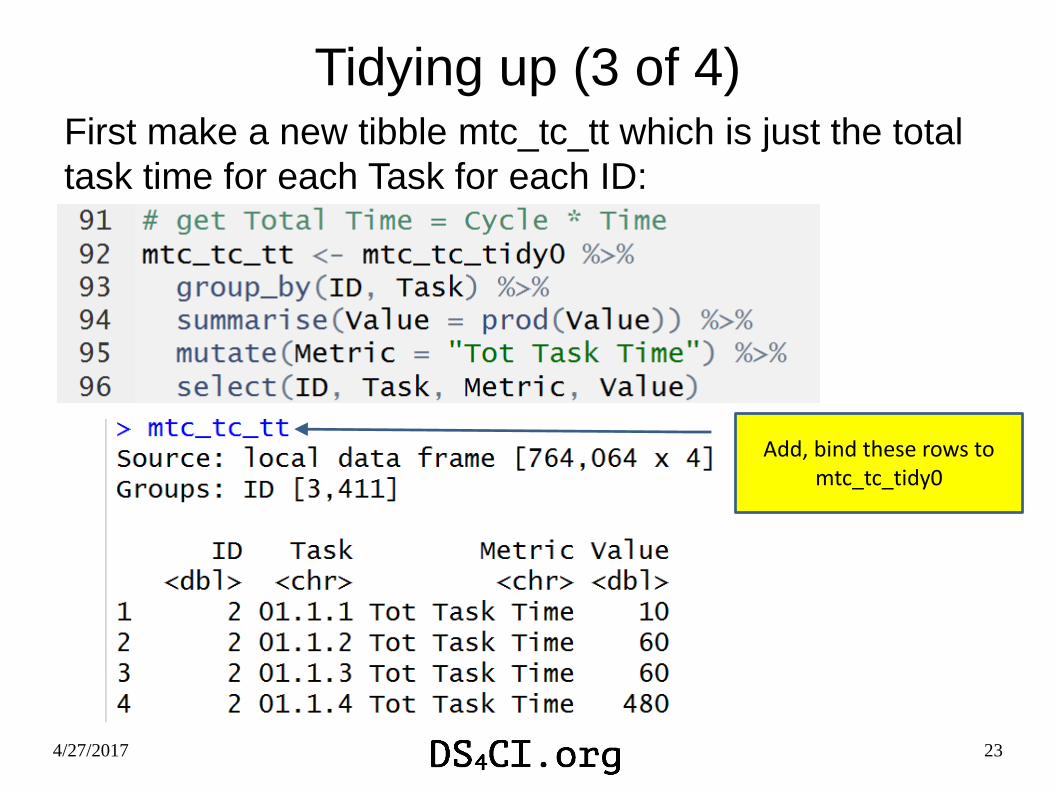
Tidying up (3 of 4)First make a new tibble mtc_tc_tt which is just the total
task time for each Task for each ID:
4/27/2017 23
Add, bind these rows to mtc_tc_tidy0

Tidying up (4 of 4)Finally: 1) bind in Total Task Time rows; 2) Split out Stage &
Process Group from Task; 3) Sort; & 4) Select columns for
resulting data set.
4/27/2017 24

Now that we are tidy…
It is trivial to do rollups like:
4/27/2017 25

Much More to tidyverse!
● 522 pages in print edition of R for Data Science
● Including workflow suggestions (RStudio):
– Projects, R Markdown, R Notebooks, Git/Github
● Visualization for exploring & communication
– ggplot2, forcats, …
● Data in RDMS’
– RPostgreSQL, DB, using dplyr against Redshift, …
● Modeling in the tidyverse
– modelr & broom
● Friends of tidyverse
– stringr, lubridate, & from other contributors like: tidytext, …
4/27/2017 26

What We Covered
● A quick introduction to R
● Tidyverse overview and some examples
● Tidying up a really messy Excel data set.
● Wrap up, questions, & learning more
4/27/2017 27
Questions? Comments?Now is the time!

4/27/2017 28
Learning More
● Jim’s Learning R and RStudio
– With many links to learn more
● Three dplyr examples from Berkeley R Beginners Meetup
– US Bureau of Labor Statistics – Wide to Tidy
– Sessionization of Web Events
– Waiting for BART – A Simulation
● All of Jim’s prior talks www.ds4ci.org/archives
– Mostly about or using R
● Contact: [email protected]