datatec group · technology distribution integration & managed services consulting &...
TRANSCRIPT

Technology Distribution Integration & Managed Services Consulting & Research
DATATEC GROUP UNAUDITED INTERIM RESULTS FOR THE
SIX MONTHS ENDED 31 AUGUST 2017

© Datatec 2017 2
DATATEC GROUP AGENDA
Results summary, overview & strategic update Jens Montanana, Datatec Group CEO
Financial results Ivan Dittrich, Datatec Group CFO
Operational review Jens Montanana, Datatec Group CEO
Current trading & prospects Jens Montanana, Datatec Group CEO

© Datatec 2017
Technology Distribution Integration & Managed Services Consulting & Research
RESULTS SUMMARY, OVERVIEW &
STRATEGIC UPDATE
© Datatec 2017 4 OVERVIEW
WESTCON-
COMSTOR
LOGICALIS
GROUP DATATEC
GROUP OUTLOOK
STRATEGIC
UPDATE
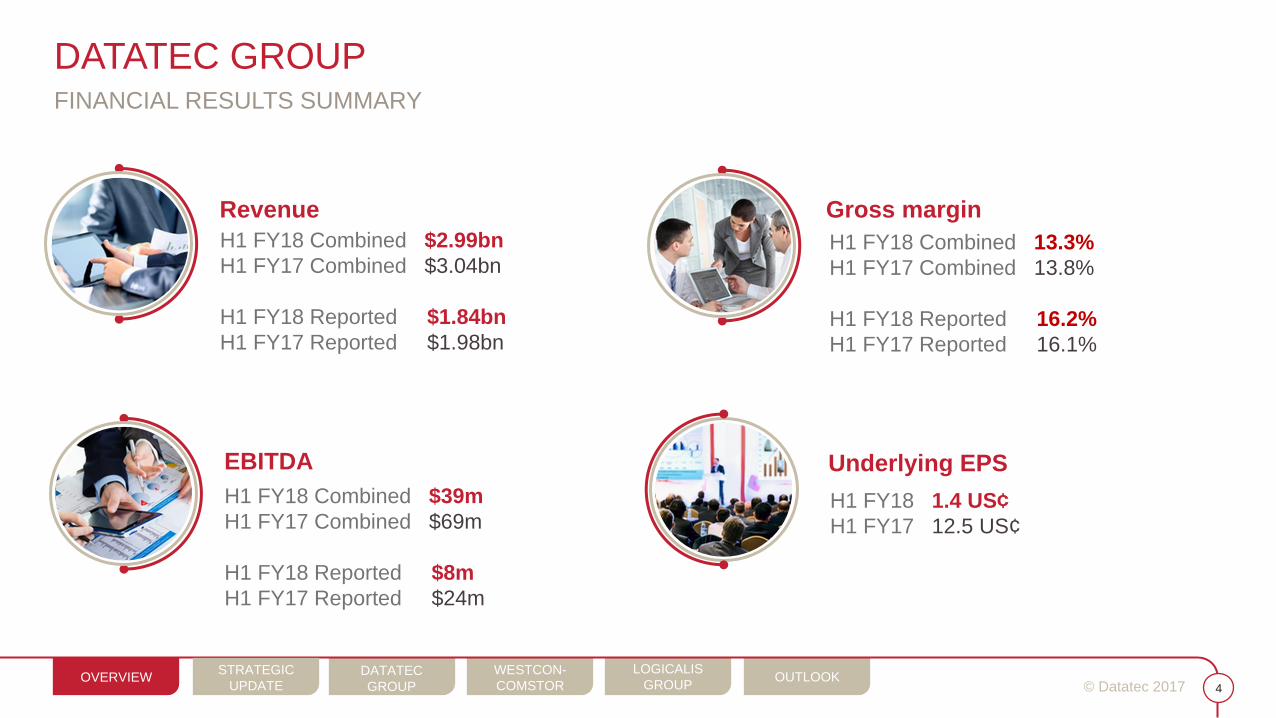
DATATEC GROUP FINANCIAL RESULTS SUMMARY
Revenue
H1 FY18 Combined $2.99bn
H1 FY17 Combined $3.04bn
H1 FY18 Reported $1.84bn
H1 FY17 Reported $1.98bn
Underlying EPS
H1 FY18 Combined $39m
H1 FY17 Combined $69m
H1 FY18 Reported $8m
H1 FY17 Reported $24m
Gross margin
H1 FY18 Combined 13.3%
H1 FY17 Combined 13.8%
H1 FY18 Reported 16.2%
H1 FY17 Reported 16.1%
EBITDA
H1 FY18 1.4 US¢
H1 FY17 12.5 US¢

© Datatec 2017 5 OVERVIEW
WESTCON-
COMSTOR
LOGICALIS
GROUP DATATEC
GROUP OUTLOOK
STRATEGIC
UPDATE
DATATEC GROUP OVERVIEW
Challenging first half
Plan to return at least $350 million to shareholders as we are
committed to returning any of the earn-out monies
Westcon International to be streamlined
Value unlocked through Westcon Americas & Logicalis SMC
disposals

© Datatec 2017
LOGICALIS
GROUP
WESTCON-
COMSTOR
DATATEC
GROUP 6 OUTLOOK OVERVIEW
STRATEGIC
UPDATE
DATATEC GROUP STRATEGIC UPDATE
Sale of Westcon Americas to Synnex
Sale of Logicalis SMC
Cancellation of AIM listing
Combining Datatec & Westcon International Group functions
© Datatec 2017
Technology Distribution Integration & Managed Services Consulting & Research
FINANCIAL RESULTS

© Datatec 2017 8 OVERVIEW
DATATEC
GROUP
WESTCON-
COMSTOR OUTLOOK
LOGICALIS
GROUP STRATEGIC
UPDATE
DATATEC GROUP FINANCIAL PERFORMANCE
US$m
H1 FY18
Reported
Westcon
Americas
Logicalis
SMC
H1 FY18
Combined H1 FY17 Growth %
Revenue 1,844.8 1,130.6 16.1 2,991.5 3,036.9 (1%)
Gross profit 299.4 95.4 3.3 398.1 419.8 (5%)
Gross margin % 16.2% 8.4% 20.5% 13.3% 13.8%
Operating costs (291.7) (64.4) (2.7) (358.8) (350.9) 2%
Operating cost margin % 15.8% 5.7% 16.8% 12.0% 11.6%
EBITDA 7.7 31.0 0.6 39.3 68.9 (43%)
EBITDA% 0.4% 2.7% 3.7% 1.3% 2.3%
Depreciation & amortisation (26.7) (2.5) (0.1) (29.3) (28.2) 4%
Operating (loss)/profit (19.0) 28.5* 0.5 10.0 40.7 (75%)
Operating (loss)/profit % (1.0%) 2.5% 3.1% 0.3% 1.3%
IFRS 5 disposal groups and
disclosure
Financial performance impacted by
weaker Westcon-Comstor
performance
Depreciation & amortisation high due
to high historic capex
* Includes Datatec consolidation adjustments

© Datatec 2017 9 OVERVIEW
DATATEC
GROUP
WESTCON-
COMSTOR OUTLOOK
LOGICALIS
GROUP STRATEGIC
UPDATE
DATATEC GROUP FINANCIAL PERFORMANCE – CONTINUED
US$m H1 FY18
Reported
H1 FY18
Combined H1 FY17 Growth %
Operating (loss)/profit (19.0) 10.0 40.7 (75%)
Net finance costs (9.9) (17.0) (10.3) 65%
Loss before tax (28.5) (6.6) 34.3 (119%)
Underlying EPS (US cents) 1.4 1.4 12.5 (89%)
HEPS (US cents) (5.8) (5.8) 9.1 (164%)
Increased finance costs due to higher
average debt, mainly in
Westcon-Comstor
Underlying EPS excludes
restructuring costs & Synnex
transaction costs
No interim dividend declared

© Datatec 2017 10 OVERVIEW
DATATEC
GROUP
WESTCON-
COMSTOR OUTLOOK
LOGICALIS
GROUP STRATEGIC
UPDATE
DATATEC GROUP ADJUSTED EBITDA BRIDGE
39 53
79
7 4 3
Combined EBITDA Restructuring costs Unrealised FX Synnex deal-relatedexpenses
Adjusted** EBITDA H1 FY17 adjusted**EBITDA
7
** Adjusted for uEPS adjustments
US$m

© Datatec 2017 11 OVERVIEW
DATATEC
GROUP
WESTCON-
COMSTOR OUTLOOK
LOGICALIS
GROUP STRATEGIC
UPDATE
DATATEC GROUP CONTRIBUTION PER DIVISION (COMBINED RESULTS INCLUDING DISPOSAL GROUP)
* Contribution to EBITDA is calculated before Corporate costs
76%
23%
1%
H1 FY18
74%
25%
1%
H1 FY17
REVENUE GROSS PROFIT
Westcon-Comstor Logicalis Consulting & Financial Services
54%
44%
2%
H1 FY18
56%
42%
2%
H1 FY17
EBITDA*
39%
59%
2%
H1 FY18
56%
43%
1%
H1 FY17
Larger EBITDA
contribution from
Logicalis

© Datatec 2017 12 OVERVIEW
DATATEC
GROUP
WESTCON-
COMSTOR OUTLOOK
LOGICALIS
GROUP STRATEGIC
UPDATE
DATATEC GROUP REVENUE & GROSS PROFIT % CONTRIBUTION BY GEOGRAPHY
(COMBINED RESULTS INCLUDING DISPOSAL GROUP)
34%
17%
32%
11%
6%
H1 FY18
35%
14% 33%
11% 7%
H1 FY17
REVENUE GROSS PROFIT
27%
22%
33%
14%
4%
H1 FY18
30%
19% 33%
13%
5%
H1 FY17
North America Latin America Europe Asia-Pacific MEA
Geographic mix affected
margins
Increased contribution from
Latin America
© Datatec 2017 13 OVERVIEW
DATATEC
GROUP
WESTCON-
COMSTOR OUTLOOK
LOGICALIS
GROUP STRATEGIC
UPDATE
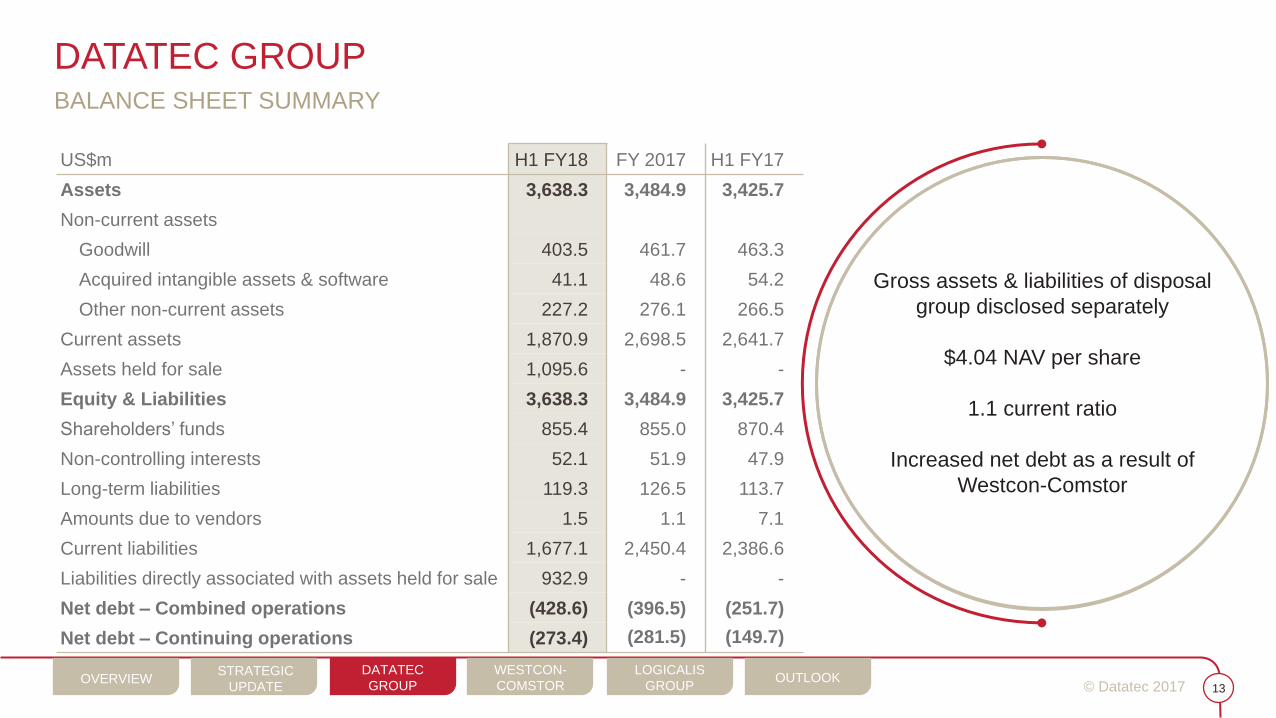
DATATEC GROUP BALANCE SHEET SUMMARY
US$m H1 FY18 FY 2017 H1 FY17
Assets 3,638.3 3,484.9 3,425.7
Non-current assets
Goodwill 403.5 461.7 463.3
Acquired intangible assets & software 41.1 48.6 54.2
Other non-current assets 227.2 276.1 266.5
Current assets 1,870.9 2,698.5 2,641.7
Assets held for sale 1,095.6 - -
Equity & Liabilities 3,638.3 3,484.9 3,425.7
Shareholders’ funds 855.4 855.0 870.4
Non-controlling interests 52.1 51.9 47.9
Long-term liabilities 119.3 126.5 113.7
Amounts due to vendors 1.5 1.1 7.1
Current liabilities 1,677.1 2,450.4 2,386.6
Liabilities directly associated with assets held for sale 932.9 - -
Net debt – Combined operations (428.6) (396.5) (251.7)
Net debt – Continuing operations (273.4) (281.5) (149.7)
Gross assets & liabilities of disposal
group disclosed separately
$4.04 NAV per share
1.1 current ratio
Increased net debt as a result of
Westcon-Comstor

© Datatec 2017 14 OVERVIEW
DATATEC
GROUP
WESTCON-
COMSTOR OUTLOOK
LOGICALIS
GROUP STRATEGIC
UPDATE
DATATEC GROUP CASH FLOW (COMBINED RESULTS INCLUDING DISPOSAL GROUP)
US$m H1 FY18 H1 FY17
EBITDA 39.3 68.9
Working capital changes (11.8) (41.1)
Other working capital changes (1.2) (4.7)
Other movements 3.0 1.1
Cash generated from operations 29.3 24.2
Net finance costs paid (13.1) (9.6)
Taxation paid (14.9) (21.3)
Net cash inflow/(outflow) from operating activities 1.3 (6.7)
Net cash outflow for acquisitions (5.3) (1.9)
Net cash outflow from other investing activities (27.6) (39.4)
Dividends to shareholders - (14.7)
Net cash inflow from financing activities 27.1 18.7
Decrease in cash & cash equivalents (4.5) (44.0)
Cash & cash equivalents at beginning of year (299.9) (132.7)
Translation difference on cash & cash equivalents (0.2) 11.2
Cash & cash equivalents at end of period – Combined (304.6) (165.5)
Improved cash generated from
operations
Reduced capex spend
Large cash outflows from receivables
due to increased prepaid exposures
in Logicalis

© Datatec 2017 15 OVERVIEW
DATATEC
GROUP
WESTCON-
COMSTOR OUTLOOK
LOGICALIS
GROUP STRATEGIC
UPDATE
DATATEC GROUP CASH FLOW FROM OPERATING ACTIVITIES (COMBINED RESULTS INCLUDING DISPOSAL GROUP)
US$m
(32.9)
12.3
39
(125) 3
110
(1) 3 (13) (15) 1
EBITDA Increase inreceivables
Decrease ininventories
Increase inpayables
Other workingcapital
changes
Othermovements
Net financecosts
Taxation paid Net cashinflow fromoperatingactivities

© Datatec 2017 16 OVERVIEW
WESTCON-
COMSTOR
LOGICALIS
GROUP DATATEC
GROUP OUTLOOK
STRATEGIC
UPDATE
DATATEC GROUP USE OF SYNNEX PROCEEDS
$630 million cash received on closing
Pay transaction-related costs, fund working capital & reduce debt
Up to $200 million cash earn-out (to be returned to shareholders)
Return $350 million cash to shareholders
• Special dividend with scrip alternative
• General share buy-back
© Datatec 2017
Technology Distribution Integration & Managed Services Consulting & Research
OPERATIONAL REVIEW

© Datatec 2017
Technology Distribution Integration & Managed Services Consulting & Research
WESTCON-COMSTOR

© Datatec 2017 19 OVERVIEW
DATATEC
GROUP
WESTCON-
COMSTOR OUTLOOK LOGICALIS
GROUP STRATEGIC
UPDATE
WESTCON-COMSTOR FINANCIAL PERFORMANCE – COMBINED OPERATIONS
US$m H1 FY18 H1 FY17 Growth %
Revenue 2,278.6 2,256.1 1%
Gross profit 216.3 236.5 (9%)
Gross margin % 9.5% 10.5%
Operating costs (197.3) (193.6) 2%
Operating cost margin % 8.7% 8.6%
EBITDA 19.0 42.9 (56%)
EBITDA% 0.8% 1.9%
Operating profit 2.4 27.6 (91%)
Operating profit % 0.1% 1.2%
Revenue growth in North America
and Latin America
Competitive pricing pressure drives
down gross margin % across all
regions except Asia-Pacific
EBITDA declines across all operating
regions; lower central costs

© Datatec 2017 20 OVERVIEW
DATATEC
GROUP
WESTCON-
COMSTOR OUTLOOK LOGICALIS
GROUP STRATEGIC
UPDATE
WESTCON-COMSTOR
37%
13%
32%
10%
8%
H1 FY18
36%
10% 34%
11%
9%
H1 FY17
REVENUE GROSS PROFIT
26%
18% 34%
14%
8%
H1 FY18
26%
15% 37%
13%
9%
H1 FY17
North America
Latin America
Europe
Asia-Pacific
MEA
REVENUE & GROSS PROFIT % CONTRIBUTION BY GEOGRAPHY – COMBINED OPERATIONS

© Datatec 2017 21 OVERVIEW
DATATEC
GROUP
WESTCON-
COMSTOR OUTLOOK LOGICALIS
GROUP STRATEGIC
UPDATE
WESTCON-COMSTOR
REVENUE % BY BUSINESS UNIT, CUSTOMER & TECHNOLOGY CATEGORY
– COMBINED OPERATIONS
41%
59%
H1 FY18
42%
58%
H1 FY17
BUSINESS UNIT CUSTOMER
Comstor Westcon
66%
20%
14%
H1 FY18
70%
20%
10%
H1 FY17
TECHNOLOGY
38%
22%
25%
15%
H1 FY18
38%
22%
26%
14%
H1 FY17
Reseller System
integrator
Service
provider
Security Unified communications
Networking Data centre & other

© Datatec 2017 22 OVERVIEW
DATATEC
GROUP
WESTCON-
COMSTOR OUTLOOK LOGICALIS
GROUP STRATEGIC
UPDATE
WESTCON-COMSTOR HISTORICAL QUARTERLY SALES – COMBINED OPERATIONS
US$m
Qtr 1 Qtr 2 Qtr 3 Qtr 4 Qtr 1 Qtr 2 Qtr 3 Qtr 4 Qtr 1 Qtr 2
FY 2016
1 254
1 068 1 086
1 257 1 188 1 193 1 190
1 141 1 169 1 135
FY 2017 H1 FY18

© Datatec 2017 23 OVERVIEW
DATATEC
GROUP
WESTCON-
COMSTOR OUTLOOK LOGICALIS
GROUP STRATEGIC
UPDATE
WESTCON-COMSTOR GROSS PROFIT & EBITDA BY GEOGRAPHY – COMBINED OPERATIONS
3.3%
GROSS PROFIT EBITDA
US$m US$m
62 36
87
30 22
237
56 39
73
31 17
216
-
50
100
150
200
250
300
350
400
450
500
550
NorthAmerica
Latin America Europe Asia-Pacific MEA Total
H1 FY17 H1 FY18
34
10
23
6 3
(33)
43
24
7 15 3 1
(31)
19
(80)
(60)
(40)
(20)
-
20
40
60
80
100
120
NorthAmerica
LatinAmerica
Europe Asia-Pacific MEA Centralcosts
Total
H1 FY17 H1 FY18

© Datatec 2017 24 OVERVIEW
DATATEC
GROUP
WESTCON-
COMSTOR OUTLOOK LOGICALIS
GROUP STRATEGIC
UPDATE
US$m H1 FY18 FY 2017 H1 FY17
Accounts receivable 1,300.7 1,245.2 1,281.4
DSO (days) 70 71 69
Inventory 358.0 400.0 359.2
Inventory turns 11.4x 9.4x 11.6x
Accounts payable (1,107.7) (1,060.9) (1,161.4)
DPO (days) 70 72 73
Net working capital 551.0 584.3 479.2
NWC (days) 32 39 27
Current ratio 1.1 1.1 1.1
Net debt (371.3) (403.4) (248.6)
Net debt – continuing operations (207.5) (288.4) (146.6)
Net debt – discontinued operations
(163.8) (115.0) (102.0)
WESTCON-COMSTOR WORKING CAPITAL – COMBINED OPERATIONS
DSO steady; continued challenges in
emerging markets
Significant improvement in inventory
turns vs. FY17
$163.8m net debt for disposal group
© Datatec 2017 25 OVERVIEW
DATATEC
GROUP
WESTCON-
COMSTOR OUTLOOK LOGICALIS
GROUP STRATEGIC
UPDATE
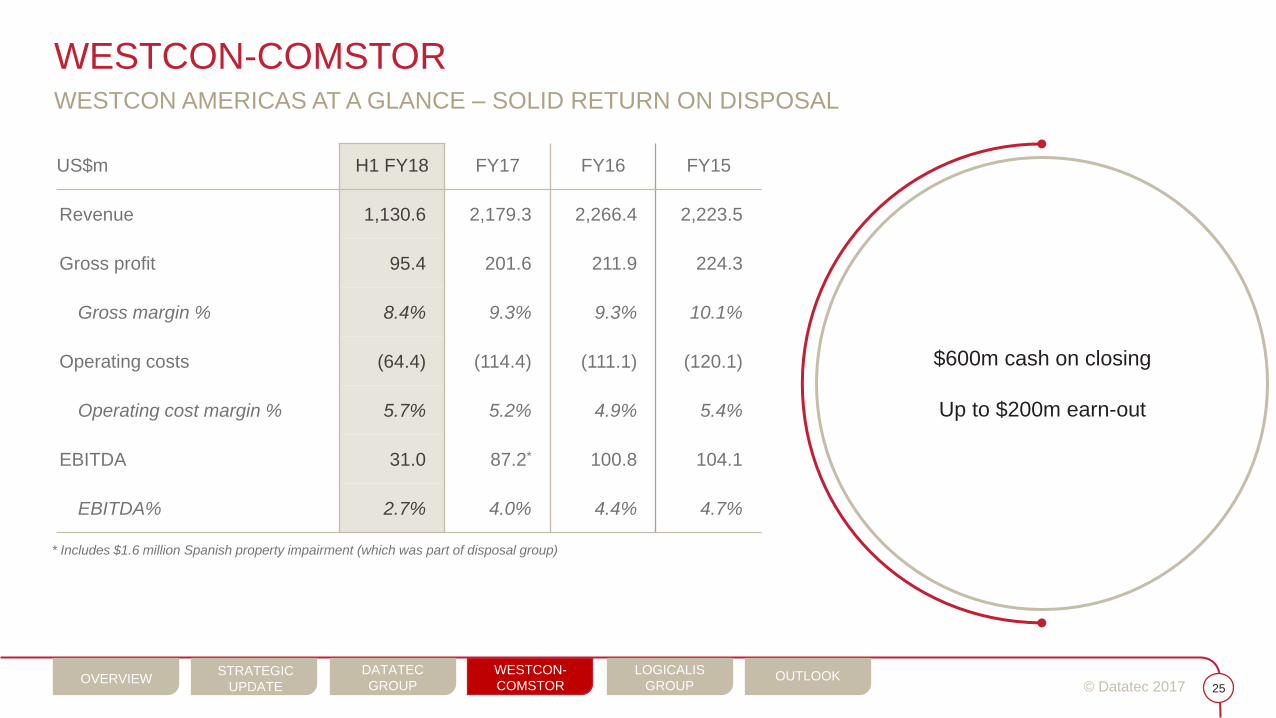
WESTCON-COMSTOR WESTCON AMERICAS AT A GLANCE – SOLID RETURN ON DISPOSAL
US$m H1 FY18 FY17 FY16 FY15
Revenue 1,130.6 2,179.3 2,266.4 2,223.5
Gross profit 95.4 201.6 211.9 224.3
Gross margin % 8.4% 9.3% 9.3% 10.1%
Operating costs (64.4) (114.4) (111.1) (120.1)
Operating cost margin % 5.7% 5.2% 4.9% 5.4%
EBITDA 31.0 87.2* 100.8 104.1
EBITDA% 2.7% 4.0% 4.4% 4.7%
$600m cash on closing
Up to $200m earn-out
* Includes $1.6 million Spanish property impairment (which was part of disposal group)
© Datatec 2017 26 OVERVIEW
DATATEC
GROUP
WESTCON-
COMSTOR STRATEGIC
UPDATE OUTLOOK
LOGICALIS
GROUP
WESTCON-COMSTOR OUTLOOK
Continuing to stabilise platform post completion of SAP transition
Collapse Datatec & Westcon head office functions
Focus on improving working capital & cash generation
Reduce costs
Return to revenue growth & better profitability

© Datatec 2017
Technology Distribution Integration & Managed Services Consulting & Research
LOGICALIS GROUP

© Datatec 2017 28 OVERVIEW
DATATEC
GROUP
WESTCON-
COMSTOR
STRATEGIC
UPDATE LOGICALIS
GROUP OUTLOOK
LOGICALIS GROUP FINANCIAL PERFORMANCE – COMBINED OPERATIONS
US$m H1 FY18 H1 FY17 Growth %
Revenue 693.7 757.2 (8%)
Gross profit 174.7 175.4 0%
Gross margin % 25.2% 23.2%
Operating costs (145.9) (142.4) 2%
Operating cost margin % 21.0% 18.8%
EBITDA 28.8 33.0 (13%)
EBITDA% 4.2% 4.4%
Operating profit 16.5 20.3 (19%)
Operating profit % 2.4% 2.7%
Total revenue down 8% mainly in US
Services revenue up 7%
Gross margin increased to 25.2%
EBITDA down 13%
Restructuring costs incurred of $2.4m
and included within operating costs

© Datatec 2017 29 OVERVIEW
DATATEC
GROUP
WESTCON-
COMSTOR
STRATEGIC
UPDATE LOGICALIS
GROUP OUTLOOK
LOGICALIS GROUP
26%
30%
32%
12%
H1 FY18
31%
26%
32%
11%
H1 FY17
REVENUE GROSS PROFIT
28%
28%
31%
13%
H1 FY18
36%
25%
27%
12%
H1 FY17
North America
Latin America
Europe
Asia-Pacific
REVENUE & GROSS PROFIT % CONTRIBUTION BY GEOGRAPHY – COMBINED OPERATIONS

© Datatec 2017 30 OVERVIEW
DATATEC
GROUP
WESTCON-
COMSTOR
STRATEGIC
UPDATE LOGICALIS
GROUP OUTLOOK
LOGICALIS GROUP REVENUE BY SEGMENT & PRODUCT REVENUE BY VENDOR – COMBINED OPERATIONS
SEGMENT
61% 14%
25%
H1 FY18
66%
12%
22%
H1 FY17
Product
Professional services
Maintenance &
managed services
VENDOR
53%
10%
6%
31%
H1 FY18
50%
11% 6%
33%
H1 FY17
Cisco
IBM
HPE
Other

© Datatec 2017 31 OVERVIEW
DATATEC
GROUP
WESTCON-
COMSTOR
STRATEGIC
UPDATE LOGICALIS
GROUP OUTLOOK
LOGICALIS GROUP
GROSS PROFIT EBITDA
US$m US$m
62
44 47
22
175
50 48 54
23
175
-
20
40
60
80
100
120
140
160
180
200
North America Latin America Europe Asia-Pacific Total
H1 FY17 H1 FY18
16 15
1
4
-
(3)
33
5
15
7 6
(1) (3)
29
(5)
-
5
10
15
20
25
30
35
NorthAmerica
LatinAmerica
Europe Asia-Pacific MEA Centralcosts
Total
H1 FY17 H1 FY18
GROSS PROFIT & EBITDA BY GEOGRAPHY – COMBINED OPERATIONS
© Datatec 2017 32 OVERVIEW
DATATEC
GROUP
WESTCON-
COMSTOR
STRATEGIC
UPDATE LOGICALIS
GROUP OUTLOOK
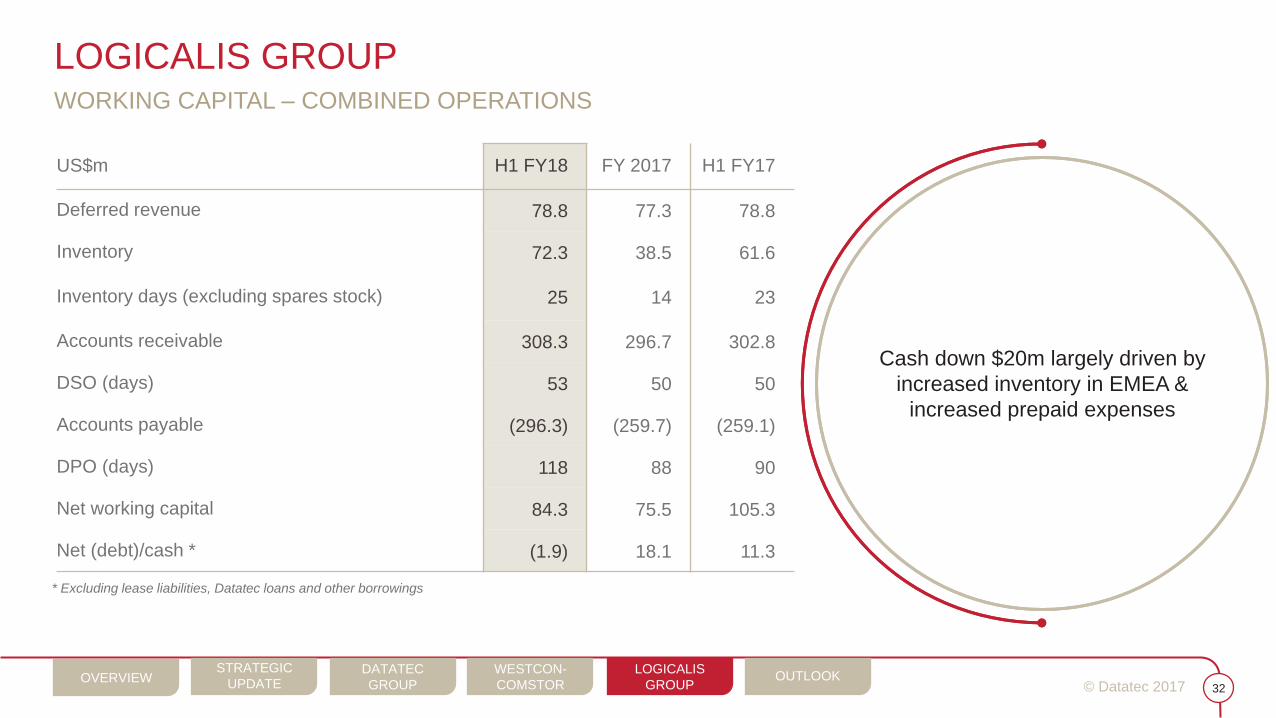
LOGICALIS GROUP WORKING CAPITAL – COMBINED OPERATIONS
US$m H1 FY18 FY 2017 H1 FY17
Deferred revenue 78.8 77.3 78.8
Inventory 72.3 38.5 61.6
Inventory days (excluding spares stock) 25 14 23
Accounts receivable 308.3 296.7 302.8
DSO (days) 53 50 50
Accounts payable (296.3) (259.7) (259.1)
DPO (days) 118 88 90
Net working capital 84.3 75.5 105.3
Net (debt)/cash * (1.9) 18.1 11.3
* Excluding lease liabilities, Datatec loans and other borrowings
Cash down $20m largely driven by
increased inventory in EMEA &
increased prepaid expenses

© Datatec 2017 33 OVERVIEW
DATATEC
GROUP
WESTCON-
COMSTOR
STRATEGIC
UPDATE LOGICALIS
GROUP OUTLOOK
LOGICALIS GROUP SMC AT A GLANCE
US$m H1 FY18 FY17 FY16 FY15
Revenue 16.1 42.1 30.9 38.7
Gross profit 3.3 9.3 8.9 10.2
Gross margin % 20.5% 22.1% 28.8% 26.4%
Operating costs (2.7) (6.6) (6.2) (7.2)
Operating cost margin % 16.8% 15.7% 20.1% 18.6%
EBITDA 0.6 2.7 2.7 3.0
EBITDA% 3.7% 6.4% 8.7% 7.8%
Proceeds received on sale: $42m
Purchase price: $4.7m

© Datatec 2017 34 OVERVIEW
DATATEC
GROUP
WESTCON-
COMSTOR
STRATEGIC
UPDATE LOGICALIS
GROUP OUTLOOK
LOGICALIS GROUP OUTLOOK
General market for IT product and services is expected to remain stable
albeit with continued shift from pure product to cloud based solutions
M&A activity will add net incremental benefit in FY18
Recent large contract win in LATAM should result in improved
near-term performance despite continuing economic uncertainty
in Brazil
FX rate volatility expected to continue

© Datatec 2017
Technology Distribution Integration & Managed Services Consulting & Research
CURRENT TRADING & PROSPECTS
© Datatec 2017 36 OVERVIEW
DATATEC
GROUP WESTCON-
COMSTOR
STRATEGIC
UPDATE
LOGICALIS
GROUP OUTLOOK
DATATEC GROUP CURRENT TRADING & PROSPECTS
Logicalis well positioned to improve services mix
Stronger Logicalis H2 expected
Westcon International to be streamlined
Continual adjustment to cloud-based infrastructure solutions
Technology Distribution Integration & Managed Services Consulting & Research
© Datatec 2017
QUESTIONS

© Datatec 2017 38
DATATEC GROUP DEFINITIONS
UNDERLYING EARNINGS
Excluding impairments of goodwill and intangible assets, profit or loss on sale of investments and assets, amortisation of acquired intangible assets, unrealised
foreign exchange movements, acquisition-related adjustments, fair value movements on acquisition-related financial instruments, restructuring costs relating to
fundamental reorganisations, SYNNEX deal-related expenses and the taxation effect on all of the aforementioned.
© Datatec 2017 39
DATATEC GROUP
This presentation may contain statements regarding the future financial performance of the Group which may be considered to be forward-looking statements. By their nature,
forward-looking statements involve risk and uncertainty, and although the Group has taken reasonable care to ensure the accuracy of the information presented, no assurance
can be given that such expectations will prove to have been correct.
The Group has attempted to identify important factors that could cause actual actions, events or results to differ materially from those described in forward-looking statements,
there may be other factors that cause actions, events or results not to be as anticipated, estimated or intended. It is important to note, that:
unless otherwise indicated, forward-looking statements indicate the Group’s expectations and have not been reviewed or reported on by the Group’s external auditors;
actual results may differ materially from the Group`s expectations if known and unknown risks or uncertainties affect its business, or if estimates or assumptions prove
inaccurate;
the Group cannot guarantee that any forward-looking statement will materialise and, accordingly, readers are cautioned not to place undue reliance on these forward-looking
statements; and
the Group disclaims any intention and assumes no obligation to update or revise any forward-looking statement even if new information becomes available, as a result of future
events or for any other reason, other than as required by the JSE Limited Listings Requirements.
DISCLAIMER