vertu motors plc (“vertu”, “group”) unaudited interim results for … · 2016-10-11 · 12...
TRANSCRIPT

12 October 2016
Vertu Motors plc (“Vertu”, “Group”) Unaudited interim results for the six months ended 31 August 2016
Growth strategy delivers record half year revenues and profits Full year results anticipated to be in line with market expectations
Vertu Motors plc, the automotive retailer with a network of 129 sales and aftersales outlets across the UK, announces its interim results for the six months ended 31 August 2016. Financial Highlights • Revenues increased by 17.7% to £1,454.6m (2015 H1 : £1,236.1m) • Record profit before tax up 14.0% to £18.7m (2015 H1 : £16.4m) • Adjusted1 profit before tax up 14.7% to £19.5m (2015 H1: £17.0m) • Period end net cash of £12.9m (2015 H1 : £32.1m) • Cash generated from operations of £26.4m (2015 H1 : £37.6m) • Earnings per share of 3.87p (2015 H1 : 3.82p) • Raised £35m in March 2016 to finance further acquisitions, with the majority of funds deployed • Interim dividend up 11.1% to 0.50p per share (2015 H1 : 0.45p per share) to be paid in January
2017 Operational Highlights • Record Group trading performance driven by improvement in recently acquired businesses, a
strong used car performance and growth in higher margin service area • Growth strategy progressed with greater premium mix, including additions of Mercedes-Benz
and Toyota franchises to Group • Group gross profit margins increased from 10.6% to 11.1% • Like-for-like service revenues up 6.6%: long-term growth trend continues • Group service gross profit margins strengthened from 76.9% to 77.9% • Like-for-like used vehicle volumes increased 8.5%: the 10th consecutive half year period of
growth • Like-for-like used car margins strengthened from 10.0% to 10.7% • Total car and van volumes sold up 10.7% • Softening of new private retail market: Group like-for-like new car retail volumes down 4.2% • Strong performance in new commercial van sales with strengthening fleet and commercial
margins
Outlook Highlights • Robust September trading performance ahead of last year on a like-for-like basis • Like-for-like new car retail volumes in line with SMMT data: broadly flat year on year • Recent acquisitions contributing to profit growth
1 adjusted for amortisation of intangible assets and share based payments charge

6 months ended 31 August 2016 Growth Rates Total Like-for-Like SMMT UK
Registrations Group Revenues 17.7% 4.7% Service Revenues 26.6% 6.6% Volumes : Used retail vehicles 17.5% 8.5% New retail vehicles 8.3% (4.2%) (0.8%) Motability vehicles 1.3% (3.0%) (0.9%) Fleet new cars (4.5%) (10.6%) 6.1% Commercial new vehicles 13.4% 11.6% 3.9%
Commenting on the results, Robert Forrester, Chief Executive, said: “In the first six months of trading, our proven growth strategy has delivered a record set of results with increased revenues, gross margins and profits. We have continued to successfully grow the business, through both organic growth and the acquisition and integration of premium franchises, as we seek to build a balanced portfolio. Consistent delivery of an outstanding customer experience continues to be a strong driver of the growth of dealership performances across the Group. This is demonstrated by the growing number of customers retained into the Group’s aftersales businesses. “The outlook for the remainder of the year remains positive, underpinned by low interest rates and record high levels of employment in the UK economy. The Group’s trading performance in the key September plate change month was strong. The Board anticipates that the Group’s full year results will be in line with market expectations.”
For further information please contact: Vertu Motors plc Robert Forrester, CEO Tel: 0191 491 2111 Michael Sherwin, CFO Tel: 0191 491 2112
Liberum
Peter Tracey Richard Crawley Jamie Richards
Tel: 020 3100 2000
Zeus Capital Limited
Adam Pollock Tel: 020 7533 7727
Camarco
Billy Clegg Georgia Mann
Tel: 020 3757 4980
This announcement contains inside information as defined in Article 7 of the Market Abuse Regulation No. 596/2014 and is disclosed in accordance with the Company’s obligations under Article 17 of those Regulations.

INTRODUCTION
During the six months ended 31 August 2016 (“the Period”) the Group has continued to grow revenues, gross margins and profits. Used vehicle sales and vehicle servicing channels have seen excellent growth and this has underpinned the delivery of record revenues and profits for the Group. Used vehicles and aftersales together represent 71.8% of Group gross profit (2015 H1: 70.8%).
The new car market stands at, or near to, record levels. After four years of sustained growth, the UK private new retail market softened during the Period recording slight declines in registrations from April 2016 onwards. There was a reduction of 0.8%2 for the Period.
The Group has performed strongly by pursuing the three elements of its strategy to deliver earnings growth:
• acquiring further businesses, both currently profitable and turnaround opportunities representing both existing manufacturer partners and those which are new to the Group including Mercedes-Benz and Toyota;
• improving the profit contribution from the significant number of businesses acquired or opened in recent years; and
• continued review of the Group’s portfolio in terms of franchise representation and appropriate allocation of capital to identify future opportunities to make changes to maximise return on investment.
The Group undertook a £35m (gross) equity placing in March 2016 to finance further acquisitions and the majority of these funds were deployed during the Period. The Group has a very strong balance sheet with net cash.
The Group has maintained strict disciplines over working capital, resulting in a strong conversion of profits into cash. £26.4m of cash generated from operations compared to operating profits of £19.9m, leading to £12.9m of net cash in the Group’s balance sheet as at 31 August 2016. In addition to new acquisitions, the Group has continued to invest heavily in new dealership development projects, expansion of the capacity of existing dealerships and other dealership refurbishment projects to reflect latest manufacturer standards. The Group spent £7.3m on these projects during the Period and will continue to invest at a similar rate over the next 18 months. Once this period is over the Board expects a substantial reduction in ongoing capital expenditure and a consequent increase in free cashflow.
An interim dividend of 0.50 pence per share, representing an increase of 11.1%, (2015 : 0.45p) will be paid on 20 January 2017. The ex-dividend date will be 22 December 2016 and the associated record date 23 December 2016.
2 source-SMMT

FINANCIAL REVIEW
Revenues in the Period grew by 17.7% (£218.5m) to £1,454.6m (2015 H1 : £1,236.1m). Acquisitions in the Period accounted for £67.3m of growth and those businesses acquired in the previous year contributed further revenue growth of £101.0m. Core Group revenues grew by 4.6% (£55.2m), reflecting growth in every major vehicle sales and aftersales channel. Closed or sold businesses accounted for a decline in revenue of £5.0m. Overall gross margins increased to 11.1% (2015 H1 : 10.6%) driven by stronger margins in vehicle servicing and used vehicle sales. Operating profit grew by 17.8% to £19.9m, with adjusted operating margins stable at 1.4% (2015 H1 : 1.4%).
The Group’s finance charges have increased by £0.7m to £1.2m (2015 H1 : £0.5m) due to higher vehicle stocking interest. This reflected higher pipeline stocks during the Period as new vehicle sales slowed, coupled with the increase in the number of premium franchise operations in the Group which operate structurally with higher vehicle stocking costs.
Following the further reduction in the UK Corporation Tax rate to 20%, the Group’s effective tax rate for the Period was 20% (2015 H1 : 20.5%).
Earnings per share was 3.87p (2015 H1: 3.82p) taking account of the higher number of shares in issue following the equity raise effective on 31 March 2016.
During the Period, the Group has maintained its focus on the tight control of working capital which has resulted in a working capital inflow of £2.1m during the Period, driven mainly by the growth in the sales of service plans and in-house warranty products.
The Group, in common with all sector participants, is in the process of a major programme of capital investment; developing new dealerships, increasing capacity in existing dealerships and responding to Manufacturer Partner led refurbishments of the existing dealership portfolio. In particular, substantial sums are being invested in increasing capacity and enhancing the retail environment of the Jaguar Land Rover dealerships with the implementation of the “Arch” concept.
The spend on this programme during the Period, along with the anticipated spend in future periods, is set out below:
The Board is confident that the significant decline in future capital spend anticipated in FY2019 will drive enhanced free cash flow from the business from that point in time.
Actual Estimate
Capital Expenditure Trends FY 2016
£m
H1 FY2017
£m
FY 2017
£m
FY 2018
£m
FY 2019
£m
New dealership development projects
- Purchase of property 6.3 0.7 2.1 - -
- New dealership build 1.8 4.5 10.6 7.1 4.5
Existing dealership capacity increases 4.5 1.6 7.6 16.7 5.1
Manufacturer-led refurbishment projects 3.2 1.2 3.9 3.2 1.9
IT and other recruitment 4.9 2.2 3.8 4.0 4.0
20.7 10.2 28.0 31.0 15.5

The Group operates two defined benefit pension schemes, both of which are closed to new entrants and to future accrual. The reduction in bond yields in the UK over the second quarter of the Period has caused an increase in the assessment of the scheme liabilities and a consequent reduction in the net pension scheme surplus for the two schemes combined to £1.4m (February 2016 : £6.1m). There is no current expectation that these fluctuations will impact upon the Group’s cash contributions to the schemes, which currently amount to £0.4m per annum.
CURRENT TRADING AND OUTLOOK
On 23 June 2016, the UK voted to exit the EU. The result of the referendum has not materially impacted consumer confidence and the Group has not experienced any significant change in consumer behaviour. We remain in a low interest rate environment with record high levels of employment, both of which are providing a robust foundation for our market.
The market for aftersales, the Group’s highest margin activity, remains strong as the vehicle parc has continued to grow following several years of strong new vehicle markets. This, in conjunction with the Group’s successful customer retention strategies, provides the Board with confidence regarding the continuation of a strong aftersales performance.
The used vehicle market remains buoyant, underpinned by stable residual values. The Group continues to perform strongly in used vehicles, and the focus on the continuous development of the Group’s used vehicle marketing provides the Board with confidence regarding the sustainability of performance in this channel.
The latest SMMT forecast for 2016 UK new vehicle registrations stands at 2.64 million (2015 : 2.63 million) and the Board sees no reason to disagree with the underlying market stability implied by this forecast. The market is starting to see vehicle price increases reflecting the manufacturers’ reaction to declining Sterling exchange rates against all major currencies. Lower margin channels for manufacturers and retailers alike, such as Fleet car supply and Motability, are likely to see more impact than higher margin retail channels. There are diverging economic forecasts with regards to Sterling’s currency outlook and this leads to uncertainty over future manufacturer volume strategies and pricing. The Board shares the outlook on the new car market given by the SMMT which anticipates a fall in 2017 registrations of around 6%. This would equate to a historically robust new car market of around 2.5 million units.
September is a key month for the Group’s profitability in the second half of the financial year, being a registration plate change month. Profit in the month was ahead of prior year levels on a like-for-like basis and recent acquisitions further bolstered the Group result. The Group’s service and used car performance continued to demonstrate strong underlying growth trends in September. Like-for-like new car private volumes for the Group were down 1.7% year on year, in line with the SMMT registration data.
The Board continues to examine further acquisition and development opportunities. The Board anticipates that the Group’s full year results will be in line with market expectations.

OPERATING REVIEW
Colleague and Customer Satisfaction
The Mission Statement of the Group is to deliver an outstanding customer motoring experience through honesty and trust.
The Board believe that in a retail environment, it is vital to have a thriving and engaged workforce to deliver this objective, together with the consequent financial success that goes alongside it. Repeat vehicle sales and successive aftersales visits are a major driver of financial success in operating automotive retail dealerships and these derive from loyal customers. It is the Group’s colleagues on the ground who deliver this.
In order to assess the engagement levels of colleagues, in July 2016 the Group undertook its fifth annual colleague satisfaction survey across the Group. 75% of colleagues in the Core Group completed the voluntary survey and the results reflect the strong Group culture that has been developed around the Mission Statement, the Group Vision and Values. 97% of colleagues knew the Group Vision and Values and over 90% believed management acted in accordance with those Values. This strong values-based approach underpins the delivery of outstanding customer experience with 91% of colleagues feeling they could recommend the Group to their friends and 87% were confident the Group serves customers better than its rivals. These are strong scores, despite the Group’s fast growth rate since incorporation in 2006, and point to the Group’s successful execution of its buy and build strategy.
The Group’s customer experience indicators continue to show that the Group delivers above industry average experience. Used car customer experience is measured by JudgeService and in the Period, 95% of customers responded that they would recommend their friends and family to the Group.
Based on the measures of customer experience applied by the Group’s manufacturer partners, 65% of sales outlets and 56% of service outlets performed in the Period above national average levels. This area continues to be a major focus of Group strategies, including investment in dealership environments, colleague training and development and ensuring on-line channels are designed to maximise customer experience.
Growth Strategy and Portfolio Development
The Group has continued to grow and strengthen the business, with the addition of nine sales outlets during the Period. The Group now operates 129 sales outlets at 107 locations across the United Kingdom.
The Group has continued to acquire new outlets and to develop both existing and new property assets to enhance and expand the capacity of the ongoing business. The growth has been primarily in Premium franchises as the Group seeks to build a balanced portfolio on the foundation of a scaled volume franchise portfolio.
On 1 March 2016, the Group purchased Greenoaks (Maidenhead) Limited which operates three Mercedes-Benz dealerships, for £21.7m (alongside the settlement of £9m of shareholder loans). These dealerships in Ascot, Reading and Slough have historically underperformed. The Board is pleased with the progress made to date to integrate and improve the performance of the businesses and they have traded in line with the performance targets the Board put in place at the time of the

acquisition. For the year ended 31 December 2015 the business achieved revenues of £88m and adjusted3 profit before tax of £1.2m
In the Period the Group has completed three further transactions totalling £22.6m which were anticipated when the Group undertook the £35m Placing (gross) in March 2016. These transactions represent a swift deployment of a substantial portion of the capital raised.
On 3 May 2016, the Group acquired the business and assets of Leeds Jaguar from Inchcape for a consideration of £0.6m, including £0.5m of goodwill. For the year ended 31 December 2015, this business was at breakeven. The Jaguar franchise is currently witnessing a significant turnaround in profitability on the back of new products such as the excellent Jaguar F-PACE. This business, together with the existing Leeds Land Rover business, will shortly be relocated to a state-of-the-art freehold dealership in the centre of Leeds. This property has undergone major redevelopment to house these two businesses and to meet the latest manufacturer standards.
On 1 June 2016, the Group acquired the entire issued share capital of Gordon Lamb Group Limited, a group which operated five sales outlets in Derbyshire. This freehold rich acquisition introduced the Toyota franchise to the Group and added a sixth Land Rover dealership, together with two Skoda and a single Nissan sales outlet to the portfolio. Estimated consideration amounted to £18.8m, including a £8.3m payment for goodwill. For the year ended 31 December 2015, Gordon Lamb Limited had consolidated revenue of £85.8m4 and adjusted3 profit before tax of £2.7m. The integration of these businesses has gone well. Derby Skoda is currently in a short-term leasehold property outside of the city and it is planned to relocate this outlet to an existing Group location in the centre of Derby in the first quarter of 2017. This will significantly enhance the trading potential of the business and reduce ongoing operating costs.
On 23 June 2016, the Group acquired the freehold and long leasehold interests from Honda in two Honda dealerships operated by the Group in Nottingham and Derby. Consideration amounted to £3.2m.
In August 2016 the Group opened the Morpeth Honda outlet alongside an existing Ford outlet. This is the Group’s 13th Honda outlet consolidating the Group’s position as Honda’s largest partner in Europe, and completing full coverage of the North East market area from Tweed to the Tees.
A further landmark freehold development is nearing completion, the building of a new Nissan dealership in the centre of Glasgow. The Group was awarded the whole of Glasgow as a market area for Nissan from 1 April 2015 and the completion of this dealership will see the relocation of the business from a north Glasgow temporary site. The Group will then have excellent dealership representation both north and south of the Clyde.
The Group’s largest franchise partner is Ford with 22 outlets. Investment continues to be made in the “Ford Store” concept which sell the full range of Ford product. The Group is now reaping the rewards of the investment made in its Birmingham Ford Store and Orpington Ford Store operations. The Group’s Gloucester Ford dealership is currently undergoing redevelopment into a Ford Store and work will shortly commence on a significant Ford Store development at Bolton. Further investment has been made in expanding the aftersales capacity of the Ford division with new offsite aftersales facilities now in place at West Bromwich, Shirley and Orpington so the Group can maximise the growing higher margin aftersales opportunity.
3 adjusted for non-recurring and non-corporate items.
4 adjusted to restate revenue to the same basis as that adopted in the Group’s financial reporting.

The Group operates six Volkswagen dealerships and the final investment in new franchise standards is close to completion with the redevelopment of Nottingham North. Furthermore, Hereford Audi has been undergoing substantial redevelopment and the business has been operating from a temporary location throughout the Period. The new facility will commence operations by Christmas and is expected to augment operational.
The Group continues to review the portfolio of businesses operated to ensure that long term returns are maximised and capital allocation disciplines maintained. On 1 October 2016, the Group disposed of its Fiat Group dealership in Newcastle which comprised three sales outlets (Fiat, Jeep and Alfa Romeo). The disposal to Richard Hardie Limited, is part of their creation of a Fiat Group market area in the North East. Additionally, Fiat sales will cease at the Group’s sales outlets in Cheltenham and Derby at the end of December 2016. This will leave the Group with a single Fiat and Alfa Romeo sales outlet in Worcester and no Jeep representation.
OPERATIONAL PERFORMANCE
Revenue and Margins
Six Months ended 31 August 2016 Revenue
£'m Revenue
Mix %
Gross Margin
£'m
Gross Margin Mix
%
Gross Margin
% Aftersales5 113.4 7.8 63.4 39.4 45.7 Used Consolidated 525.6 36.1 52.3 32.4 9.9 New 483.9 33.3 35.0 21.7 7.2 Fleet & Commercial 331.7 22.8 10.4 6.5 3.1 Total Department 1,454.6 100.0 161.1 100.0 11.1
Six Months ended 31 August 2015 Revenue
£’m Revenue
Mix %
Gross Margin
£’m
Gross Margin Mix
%
Gross Margin
% Aftersales5 93.8 7.6 50.7 38.8 44.4 Used Consolidated 426.5 34.5 42.0 32.1 9.8 New 413.1 33.4 30.3 23.1 7.3 Fleet & Commercial 302.7 24.5 7.9 6.0 2.6 Total Department 1,236.1 100.0 130.9 100.0 10.6
Aftersales
The Group’s higher margin aftersales operations, which account for an increasing proportion of the Group’s revenues (7.8% of revenues (2015 H1 : 7.6%)) earned 39.4% of the Group’s gross profit in the Period (2015 H1 : 38.8%).
Total aftersales gross profit grew by 25.0% in the Period, an increase of 6.8% on a like-for-like basis. A growing UK vehicle parc and the Group’s retention initiatives and capabilities, particularly the sale of service plans to both new and used car customers, have continued to contribute to these favourable profitability trends. The Group now has 97,427 customers paying monthly for their service and MOT through the Group’s own service plan products (2015 H1 : 80,902). In the vital area of vehicle servicing, total service revenues grew by 26.6% and like-for-like service revenues grew by 6.6%. Like-for-like service margins also increased from 77.1% to 78.3% as the Group achieved higher 5 margin aftersales expressed on internal and external turnover

levels of workshop efficiency as volumes increased. This continued progress demonstrates the success of the Group’s constant focus on customer retention, loyalty and experience thus improving the performance of this key engine of the Group’s profit delivery.
Vehicle Sales
Vehicle unit sales analysis
2016 Core
2016 Acquired6
2016 Total
2015 Total7
Total % Variance
Like-for-Like %
Variance Used Retail 38,096 3,876 41,972 35,708 17.5% 8.5% New Retail 19,922 2,903 22,825 21,079 8.3% (4.2%) New Motability 5,786 303 6,089 6,010 1.3% (3.0%) Total New Retail & Motability 25,708 3,206 28,914 27,089 6.7% (4.0%) Fleet Car 9,145 645 9,790 10,249 (4.5%) (10.6%) Commercial 8,819 212 9,031 7,961 13.4% 11.6% Fleet and Commercial 17,964 857 18,821 18,210 3.4% (0.9%) Total Fleet & New Retail 43,672 4,063 47,735 45,299 5.4% (2.7%) Total Units Sold 81,768 7,939 89,707 81,007 10.7% 2.2%
Used Vehicles
The Group has continued to grow volumes, market share and profitability in its key used vehicle operations, delivering total volume growth of 17.5% and like-for-like volume growth of 8.5% in the Period. This is the Group’s 10th consecutive half year of like-for-like volume growth in used vehicles, demonstrating the consistency of performance in this vital channel, which is considered a core strength of the Group. The used vehicle volume growth was driven in part by the Group’s increasing focus on innovative and effective marketing, particularly via the promotion of the Group’s Bristolstreet.co.uk and Macklinmotors.co.uk websites, through increasing marketing spend directly on-line and through TV advertising campaigns. Continued innovation in marketing is a particular focus following the appointment of Liz Cope as Chief Marketing Officer in the Period.
In addition to substantial volume growth, the Group delivered further used vehicle margin improvements. Like-for-like gross profit per unit grew by 6.3%, helping drive an increase of 15.1% in like-for-like used vehicle gross profits. Used vehicles are delivering an increasing proportion of Group revenues and gross profits. Like-for-like gross margins strengthened from 10.0% to 10.7% in the Period. This improvement reflected strong pricing disciplines, a structured sales process underpinned by training and underlying balance of supply and demand in the wider used vehicle wholesale markets. Total used vehicle gross margins were up from 9.8% to 9.9% with the lower rate of growth reflecting the lower inherent gross profit margin percentages in Premium franchises. These businesses are an increasingly important component of the Group’s portfolio following the last few years of acquisition growth.
New Cars
Total new car revenues grew by 17.1% and new car gross profit grew by 15.8%. This growth was driven by the acquisitions in the Period and last year with like-for-like revenues stable. Strong disciplines ensured that gross margins were stable in the Period. UK private new vehicle registrations during the Period fell by 0.8% and the Group’s like-for-like new vehicle volumes
6 Relates to businesses acquired or developed subsequent to 1 March 2015 with businesses migrating into core once they have been in the Group for over 12 months
7 2015 volumes include businesses acquired in the year ended 28 February 2015

declined by 4.2%. Increasingly over the Period it became evident that, as a result of the softening in the new car market, the market was becoming characterised by higher levels of self-registration by retailers with these vehicles registered as “retail” as measured by the SMMT. Retailers are financially motivated to self-register new vehicles in order to either achieve volume targets set by Manufacturers or to take advantage of bulk purchasing deals on offer. These cars are then sold into the retail market as used cars. In such a Period, UK private registrations tend to grow faster than the Group’s new retail sales volumes.
Fleet & Commercial
The Group grew like-for-like gross profit from its combined fleet and commercial operations by 13.2% in the Period. Like-for-like gross profit per unit rose from £423 to £491. Consequently, overall profitability in the Fleet and Commercial channel rose £1m in the Period, which is clearly an excellent result.
Overall UK registrations in the Fleet car channel rose 6.1% whilst Group like-for-like registrations fell 10.6%. This market share decline reflected fewer deliveries in the low margin supply of vehicles to daily rental companies. This trend reflected the increasing management of used vehicle residual values by the Group’s manufacturer partners through reducing overall supply volumes in this low margin channel including seeking to extend daily rental replacement cycles. These measures aid the balancing of used car supply and demand in the UK market. Overall these trends augmented Group margins in the Fleet car channel.
The Group’s total commercial vehicle (light van) sales volumes have grown by 13.4% and by 11.6% on a like-for-like basis. This strength reflects the Group’s strong market position in new van supply and the excellent economic conditions in the UK in the Period for business. During the Period, the UK light commercial vehicle registrations grew by 3.9% hence the Group’s market share has once again risen. The Group has now seen seven half year periods of like-for-like volume growth in the new van channel.
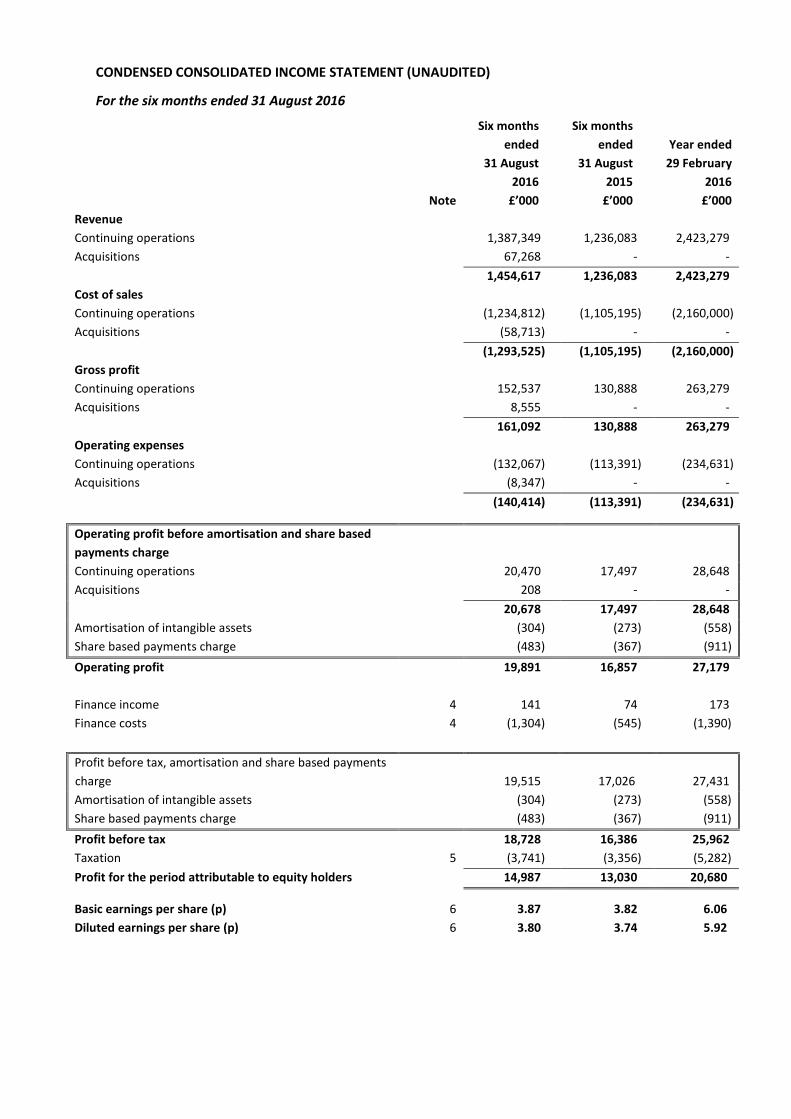
CONDENSED CONSOLIDATED INCOME STATEMENT (UNAUDITED)
For the six months ended 31 August 2016
Six months ended
Six months ended
Year ended
31 August 2016
31 August 2015
29 February 2016
Note £’000 £’000 £’000 Revenue Continuing operations 1,387,349 1,236,083 2,423,279 Acquisitions 67,268 - - 1,454,617 1,236,083 2,423,279 Cost of sales Continuing operations (1,234,812) (1,105,195) (2,160,000) Acquisitions (58,713) - - (1,293,525) (1,105,195) (2,160,000) Gross profit Continuing operations 152,537 130,888 263,279 Acquisitions 8,555 - - 161,092 130,888 263,279 Operating expenses Continuing operations (132,067) (113,391) (234,631) Acquisitions (8,347) - - (140,414) (113,391) (234,631)
Operating profit before amortisation and share based payments charge
Continuing operations 20,470 17,497 28,648 Acquisitions 208 - - 20,678 17,497 28,648 Amortisation of intangible assets (304) (273) (558) Share based payments charge (483) (367) (911) Operating profit 19,891 16,857 27,179 Finance income 4 141 74 173 Finance costs 4 (1,304) (545) (1,390) Profit before tax, amortisation and share based payments charge 19,515 17,026 27,431 Amortisation of intangible assets (304) (273) (558) Share based payments charge (483) (367) (911) Profit before tax 18,728 16,386 25,962 Taxation 5 (3,741) (3,356) (5,282) Profit for the period attributable to equity holders 14,987 13,030 20,680
Basic earnings per share (p) 6 3.87 3.82 6.06 Diluted earnings per share (p) 6 3.80 3.74 5.92

CONDENSED CONSOLIDATED STATEMENT OF COMPREHENSIVE INCOME (UNAUDITED)
For the six months ended 31 August 2016
Six months ended
Six months ended
Year ended
31 August 2016
31 August 2015
29 February 2016
Note £’000 £’000 £’000 Profit for the period 14,987 13,030 20,680 Other comprehensive (expense)/income Items that will not be reclassified to profit or loss:
Actuarial (loss)/gain on retirement benefit obligations 9 (4,990) 642 680 Deferred tax relating to actuarial (loss)/gain on retirement benefit obligations 849 (128) (137)
Items that may be reclassified subsequently to profit or loss: Cash flow hedges - 19 23 Deferred tax relating to cash flow hedges - (4) (6)
Other comprehensive (expense)/income for the period, net of tax (4,141) 529 560 Total comprehensive income for the period attributable to equity holders 10,846 13,559 21,240

CONDENSED CONSOLIDATED BALANCE SHEET (UNAUDITED)
As at 31 August 2016
31 August
2016 31 August
2015 29 February
2016 Note £’000 £’000 £’000 Non-current assets Goodwill and other indefinite life assets 8, 11 94,680 59,392 69,209 Other intangible assets 1,699 1,797 1,672 Retirement benefit asset 9 1,375 3,771 6,097 Property, plant and equipment 187,855 138,037 150,361 285,609 202,997 227,339 Current assets Inventories 512,076 395,519 530,406 Trade and other receivables 49,223 51,005 63,416 Property assets held for sale - 1,144 537 Cash and cash equivalents 32,120 39,012 43,915 Total current assets 593,419 486,680 638,274 Total assets 879,028 689,677 865,613 Current liabilities Trade and other payables (598,264) (473,178) (630,912) Deferred consideration (3,651) (1,809) (241) Current tax liabilities (5,022) (7,194) (3,647) Derivative financial instruments - (5) - Borrowings (19,048) (6,759) (6,756) Total current liabilities (625,985) (488,945) (641,556) Non-current liabilities Borrowings (166) (166) (14,011) Deferred consideration (1,680) (291) (1,659) Deferred income tax liabilities (5,636) (3,446) (4,450) Deferred income (7,122) (5,610) (6,078) (14,604) (9,513) (26,198) Total liabilities (640,589) (498,458) (667,754) Net assets 238,439 191,219 197,859 Capital and reserves attributable to equity holders of the Group
Ordinary shares 39,727 34,109 34,127 Share premium 124,932 96,848 96,901 Other reserve 10,645 10,645 10,645 Hedging reserve - (2) - Treasury share reserve (1,000) - - Retained earnings 64,135 49,619 56,186 Shareholders’ equity 238,439 191,219 197,859

CONDENSED CONSOLIDATED CASH FLOW STATEMENT (UNAUDITED)
For the six months ended 31 August 2016
Six months ended
31 August
Six months ended
31 August
Year ended
29 February 2016 2015 2016 Note £’000 £’000 £’000 Operating profit 19,891 16,857 27,179 Profit on sale of property, plant and equipment (394) (29) (26) Amortisation of intangible assets 304 273 558 Depreciation of property, plant and equipment 4,079 3,166 6,803 Movement in working capital 10 2,082 16,994 30,515 Share based payments charge 483 357 781 Cash generated from operations 26,445 37,618 65,810 Tax received 226 3 4 Tax paid (2,826) (2,680) (7,704) Finance income received 29 29 36 Finance costs paid (1,292) (678) (1,451) Net cash generated from operating activities 22,582 34,292 56,695 Cash flows from investing activities Acquisition of businesses, net of cash, overdrafts and borrowings acquired (46,208) (8,837) (24,565) Acquisition of freehold land and buildings (4,106) (150) (6,475) Proceeds from disposal of business (net of cash, overdrafts and borrowings) - 782 2,137 Purchases of intangible assets (299) (164) (325) Purchases of property, plant and equipment (11,346) (7,308) (13,977) Proceeds from disposal of property, plant and equipment 950 - 1,120 Net cash outflow from investing activities (61,009) (15,677) (42,085) Cash flows from financing activities Proceeds from issuance of ordinary shares 33,631 56 127 Proceeds from borrowings 7 13,846 4,474 18,288 Repayment of borrowings 7 (16,468) (1,000) (4,441) Purchase of treasury shares (1,000) - - Dividends paid to equity shareholders (3,377) (2,387) (3,923) Net cash inflow/(outflow) from financing activities 26,632 1,143 10,051 Net (decrease)/increase in cash and cash equivalents 7 (11,795) 19,758 24,661 Cash and cash equivalents at beginning of period 43,915 19,254 19,254 Cash and cash equivalents at end of period 32,120 39,012 43,915

CONDENSED CONSOLIDATED CHANGES IN EQUITY (UNAUDITED)
For the six months ended 31 August 2016
Ordinary
share capital
Share
premium
Other
reserve
Treasury share
reserve
Retained earnings
Total Equity
£’000 £’000 £’000 £’000 £’000 £’000 As at 1 March 2016 34,127 96,901 10,645 - 56,186 197,859 Profit for the period - - - - 14,987 14,987 Actuarial loss on retirement benefit obligations - - - - (4,990) (4,990) Tax on items taken directly to equity - - - - 849 849 Total comprehensive income for the period - - - - 10,846 10,846 New ordinary shares issued 5,600 29,400 - - - 35,000 Costs on issuance of shares - (1,369) - - - (1,369) Purchase of treasury shares - - - (1,000) - (1,000) Dividend paid - - - - (3,377) (3,377) Share based payments charge - - - - 480 480 As at 31 August 2016 39,727 124,932 10,645 (1,000) 64,135 238,439
The purchase of treasury shares in the period relates to the acquisition of 2,635,687 shares by Estera Trust (Jersey) Limited, the Trustee of Vertu Motors plc’s Employee Benefit Trust. The shares were purchased by the Trustee to be held for the purposes of the Employee Benefit Trust, and may be used to transfer shares to individuals when options are exercised. This could include the Company's Long Term Incentive Plan, under which each of the executive directors of the Company and the Company's other PDMRs is a potential participant, and is therefore regarded as having a notional interest in these shares.
The other reserve is a merger reserve, arising from shares issued for shares as consideration, to the former shareholders of acquired companies.
For the six months ended 31 August 2015
Ordinary
share capital
Share
premium
Other
reserve
Hedging reserve
Retained earnings
Total Equity
£’000 £’000 £’000 £’000 £’000 £’000 As at 1 March 2015 34,091 96,810 10,645 (17) 38,105 179,634 Profit for the period - - - - 13,030 13,030 Actuarial losses on retirement benefit obligations - - - - 642 642 Tax on items taken directly to equity - - - (4) (128) (132) Fair value gains - - - 19 - 19 Total comprehensive income for the period - - - 15 13,544 13,559 New ordinary shares issued 18 38 - - - 56 Dividend paid - - - - (2,387) (2,387) Share based payments charge - - - - 357 357 As at 31 August 2015 34,109 96,848 10,645 (2) 49,619 191,219

For the year ended 29 February 2016
Ordinary
share capital
Share
premium
Other
reserve
Hedging reserve
Retained earnings
Total Equity
£’000 £’000 £’000 £’000 £’000 £’000 As at 1 March 2015 34,091 96,810 10,645 (17) 38,105 179,634 Profit for the period - - - - 20,680 20,680 Actuarial gains on retirement benefit obligations - - - - 680 680 Tax on items taken directly to equity - - - (6) (137) (143) Fair value gains - - - 23 - 23 Total comprehensive income for the year - - - 17 21,223 21,240 New ordinary shares issued 36 91 - - - 127 Dividend paid - - - - (3,923) (3,923) Share based payments charge - - - - 781 781 As at 29 February 2016 34,127 96,901 10,645 - 56,186 197,859
NOTES
For the six months ended 31 August 2016
1. Basis of Preparation
Vertu Motors plc is a Public Limited Company which is quoted on the AiM Market and is incorporated and domiciled in the United Kingdom. The address of the registered office is Vertu House, Fifth Avenue Business Park, Team Valley, Gateshead, Tyne and Wear, NE11 0XA. The registered number of the Company is 05984855.
The financial information for the period ended 31 August 2016 and similarly the period ended 31 August 2015 has neither been audited nor reviewed by the auditors. The financial information for the year ended 29 February 2016 has been based on information in the audited financial statements for that period.
The information for the year ended 29 February 2016 does not constitute statutory accounts as defined in section 434 of the Companies Act 2006. A copy of the statutory accounts for that period has been delivered to the Registrar of Companies. The Auditors’ Report on those accounts was not qualified and did not contain an emphasis of matter statement under section 498 of the Companies Act 2006.
2. Accounting policies
The annual consolidated financial statements of Vertu Motors plc are prepared in accordance with IFRSs as adopted by the European Union. The annual report has been prepared under the historical cost convention, as modified by the revaluation of available-for-sale financial assets, share based payments and financial assets and liabilities (including derivative financial instruments) at fair value through profit or loss.
The accounting policies adopted in this interim financial report are consistent with those of the Group’s financial statements for the year ended 29 February 2016 and can be found on the Group’s website, www.vertumotors.com.
In addition, this unaudited interim financial report does not comply with IAS 34 Interim Financial Reporting, which is not required to be applied under the AiM Rules.
3. Segmental information
The Group complies with IFRS 8 “Operating Segments”, which determines and presents operating segments based on information provided to the Group’s Chief Operating Decision Maker (“CODM”), Robert Forrester, Chief Executive. As such, the Group has only one reportable business segment, since the Group is operated

and is managed on a dealership by dealership basis. Dealerships operate a number of different business streams such as new vehicle sales, used vehicle sales and aftersales operations. Management is organised based on the dealership operations as a whole rather than the specific business streams.
These dealerships are considered to have similar economic characteristics and offer similar products and services which appeal to a similar customer base. As such, the results of each dealership have been aggregated to form one reportable business segment.
The CODM assesses the performance of the operating segment based on a measure of both revenue and gross profit. Therefore, to increase transparency, the Group has decided to include additional voluntary disclosure analysing revenue and gross profit within the reportable segment.
Six Months ended 31 August 2016
Revenue £'m
Revenue Mix %
Gross Margin £'m
Gross Margin Mix %
Gross Margin %
Aftersales5 113.4 7.8 63.4 39.4 45.7 Used Consolidated 525.6 36.1 52.3 32.4 9.9 New 483.9 33.3 35.0 21.7 7.2 Fleet & Commercial 331.7 22.8 10.4 6.5 3.1 Total Department 1,454.6 100.0 161.1 100.0 11.1 Six Months ended 31 August 2015
Revenue £’m
Revenue Mix %
Gross Margin £’m
Gross Margin Mix %
Gross Margin %
Aftersales5 93.8 7.6 50.7 38.8 44.4 Used Consolidated 426.5 34.5 42.0 32.1 9.8 New 413.1 33.4 30.3 23.1 7.3 Fleet & Commercial 302.7 24.5 7.9 6.0 2.6 Total Department 1,236.1 100.0 130.9 100.0 10.6
Year ended 29 February 2016 Revenue £’m
Revenue Mix %
Gross Margin £’m
Gross Margin Mix %
Gross Margin %
Aftersales5 189.0 7.8 102.9 39.1 44.8 Used Consolidated 850.2 35.1 83.5 31.7 9.8 New 796.5 32.9 59.3 22.5 7.4 Fleet & Commercial 587.6 24.2 17.6 6.7 3.0 Total Department 2,423.3 100.0 263.3 100.0 10.9
5 margin in aftersales expressed on internal and external turnover
4. Finance income and costs
Six months ended
31 August
Six months ended
31 August
Year ended 29 February
2016 2015 2016 £’000 £’000 £’000 Interest on short term bank deposits 29 23 36 Net finance income relating to Group pension scheme 112 51 137 Finance income 141 74 173 Bank loans and overdrafts (393) (290) (619) Other finance costs (28) (44) (199) Vehicle stocking interest (883) (211) (572) Finance costs (1,304) (545) (1,390)

5. Taxation
The tax charge for the six months ended 31 August 2016 has been provided at the effective rate of 20% (Six months ended 31 August 2015: 20.5%).
6. Earnings per share
Basic and diluted earnings per share are calculated by dividing the earnings attributable to equity shareholders by the weighted average number of ordinary shares during the period or the diluted weighted average number of ordinary shares in issue in the period.
The Group only has one category of potentially dilutive ordinary shares, which are share options. A calculation has been undertaken to determine the number of shares that could have been acquired at fair value (determined as the average annual market price of the Group’s shares) based on the monetary value of the subscription rights attached to the outstanding share options. The number of shares calculated as above is compared with the number of shares that would have been issued assuming the exercise of the share options.
Adjusted earnings per share is calculated by dividing the adjusted earnings attributable to equity shareholders by the weighted average number of ordinary shares in issue during the period.
Six months ended
31 August
Six months ended
31 August
Year ended
28 February 2016 2015 2016 £’000 £’000 £’000 Profit attributable to equity shareholders 14,987 13,030 20,680 Amortisation of intangible assets 304 273 558 Share based payments charge 483 367 911 Tax effect of adjustments (61) (55) (112) Adjusted earnings attributable to equity shareholders 15,713 13,615 22,037 Weighted average number of shares in issue (‘000s) 387,047 340,968 341,080 Potentially dilutive shares (‘000s) 7,783 7,107 8,388 Diluted weighted average number of shares in issue (‘000s) 394,830 348,075 349,468 Basic earnings per share 3.87p 3.82p 6.06p Diluted earnings per share 3.80p 3.74p 5.92p Adjusted earnings per share 4.06p 3.99p 6.46p Diluted adjusted earnings per share 3.98p 3.91p 6.31p

7. Reconciliation of net cash flow to movement in net cash
31 August 2016
31 August 2015
29 February 2016
£’000 £’000 £’000 Net (decrease) / increase in cash and cash equivalents (11,795) 19,758 24,661 Cash inflow from increase in borrowings (13,846) (4,474) (18,288) Cash outflow from repayment of borrowings 16,468 1,000 4,441 Cash movement in net cash (9,173) 16,284 10,814 Borrowing acquired (1,085) - (3,409) Capitalisation of loan arrangement fees 107 201 201 Amortisation of loan arrangement fee (91) (68) (128) Non cash movement in net cash (1,069) 133 (3,336) Movement in net cash (10,242) 16,417 7,478 Opening net cash 23,148 15,670 15,670 Closing net cash 12,906 32,087 23,148
8. Acquisitions
On 1 March 2016, the Group acquired the entire issued share capital of Sigma Holdings Limited and its subsidiary Greenoaks (Maidenhead) Limited (together “Greenoaks”) which operates three Mercedes-Benz outlets in Reading, Ascot and Slough. Total consideration amounted to £21,743,000 including initial consideration of approximately £8,243,000 settled from the Group’s existing cash resources and a £10,000,000 bank facility repayable in November 2016, with a further £3,500,000 deferred over 12 months. In addition, vendor shareholders loans of £9,000,000 were settled in cash on completion. The excess of consideration over the provisional fair value of the net assets acquired was £15,740,000 of which £3,771,000 has been allocated to franchise relationships. The financial statements for Greenoaks for the year ended 31 December 2015 showed revenues of £87,998,000 and adjusted3 profit before taxation of £1,200,000.
On 2 May 2016, the Group acquired the business and certain assets of Leeds Jaguar from a subsidiary of Inchcape Plc. The estimated consideration for this leasehold acquisition was £592,000 and was settled in cash from the Group’s existing resources. The excess of consideration over the provisional fair value of the net assets acquired was £500,000.
On 1 June 2016, the Group acquired the entire issued share capital of Gordon Lamb Group Limited and its subsidiaries, including Gordon Lamb Limited (together “Gordon Lamb”) which operates the Toyota, Land Rover, Skoda, and Nissan outlets in Chesterfield and the Skoda outlet in Derby. The estimated consideration amounted to £18,819,000 including retention payable of £500,000. The remaining balance was settled in cash from the Group’s existing resources. The excess of consideration over the provisional fair value of net assets acquired was £8,959,000 of which £3,207,000 has been allocated to franchise relationships. The financial statements of Gordon Lamb for the year ended 31 December 2015 showed revenues of £85,800,0004 and adjusted3 profit before taxation of £2,700,000.
3 adjusted for non-recurring and non-corporate items. 4 adjusted to restate revenue to the same basis as that adopted in the Group’s financial reporting.

9. Retirement benefits
The retirement benefit asset at 31 August 2016 reflects both the Bristol Street Pension Scheme and the SHG Pension Scheme, which was acquired as part of the acquisition of SHG Holdings Limited in the year ended 29 February 2016. 31 August
2016 31 August
2015 29 February
2016 £’000 £’000 £’000 Bristol Street Pension Scheme surplus 2,673 3,771 4,424 SHG Pension Scheme (deficit)/surplus (1,298) - 1,673 Net retirement benefit asset 1,375 3,771 6,097
The trustees of the Bristol Street Pension Scheme and the SHG Pension Scheme have agreed to merge the two schemes, and the merger is expected to be completed by the end of the financial year ending 28 February 2017. As a result of this, the schemes surplus and deficit shown above have been presented on the balance sheet based on the net position at 31 August 2016.
During the six month period ended 31 August 2016, there was a gain on assets of £7,642,000 in the Bristol Street Pension Scheme and £468,000 in the SHG Pension Scheme. There have also been changes in the financial assumptions underlying the calculation of the liabilities in the same period. In particular, the discount rate has decreased in line with a fall in corporate bond yields over the six month period. The effect of these changes in financial assumptions was an increase in liabilities of £9,629,000 in the Bristol Street Pension Scheme and £3,471,000 in the SHG Pension Scheme. In total, there was an actuarial loss of £4,990,000 recognised in the Consolidated Statement of Comprehensive Income in the period, £1,987,000 in respect of the Bristol Street Pension Scheme and £3,003,000 in respect of the SHG Pension Scheme, before deferred taxation.
10. Cash flow from movement in working capital
The following adjustments have been made to reconcile from the movement in working capital balance sheet headings to the amount presented in the cash flow from the movement in working capital. This is in order to more appropriately reflect the cash impact of the underlying transactions.
For the six months ended 31 August 2016
Inventories
Trade and other
receivables
Trade and other
payables
Total working capital
movement
£’000 £’000 £’000 £’000
Trade and other payables (598,264) Deferred consideration (5,331) Deferred income (7,122) At 31 August 2016 512,076 49,223 (610,717) At 29 February 2016 530,406 63,416 (638,890) Balance sheet movement 18,330 14,193 (28,173) Acquisitions 17,342 4,678 (22,403) Disposals - - (3,500) Movement excluding business combinations 35,672 18,871 (54,076) 467 Pension related balances (156) Decrease in capital creditor 1,800 Increase in interest accrual (29) Movement in working capital 2,082

For the six months ended 31 August 2015
Inventories
Trade and other
receivables
Trade and other
payables
Total working capital
movement
£’000 £’000 £’000 £’000
Trade and other payables
(473,178) Deferred consideration
(2,100)
Deferred income
(5,610) At 31 August 2015 395,519 51,005 (480,888) At 28 February 2015 394,287 53,500 (466,865) Balance sheet movement (1,232) 2,495 14,023
Acquisitions 1,080 99 (1,223) Disposals (116) (23) 88 Movement excluding business combinations (268) 2,571 12,888 15,191 Pension related balances (75) Decrease in capital creditor 828 Increase in fixed asset disposal debtor 1,057 Increase in interest accrual (7) Movement in working capital 16,994
For the year ended 29 February 2016
Inventories
Trade and other
receivables
Trade and other
payables
Total working capital
movement
£’000 £’000 £’000 £’000
Trade and other payables
(630,912) Deferred consideration
(1,900)
Deferred income
(6,078) At 29 February 2016 530,406 63,416 (638,890) At 28 February 2015 394,287 53,500 (466,865) Balance sheet movement (136,119) (9,916) 172,025
Acquisitions 16,030 2,739 (11,433) Disposals (164) (15) 88 Deferred consideration for acquisition - - (1,500) Movement excluding business combinations (120,253) (7,192) 159,180 31,735 Pension related balances (756) Increase in capital creditor (447) Increase in interest accrual (17) Movement in working capital 30,515
11. Goodwill and other indefinite life assets
31 August 31 August 29 February 2016 2015 2016 £’000 £’000 £’000 Goodwill 74,488 47,675 55,995 Other indefinite life assets – Franchise relationships 20,192 11,717 13,214 At end of period 94,680 59,392 69,209
12. Risks and uncertainties
There are certain risk factors which could result in the actual results of the Group differing materially from expected results. These factors include: failure to deliver on the strategic goal of the Group to acquire and consolidate UK motor retail businesses, failure to meet competitive challenges to our business model or sector, inability to maintain current high quality relationships with manufacturer partners, economic conditions impacting trading, market driven fluctuations in used vehicle values, litigation and regulatory risk,

failure to comply with health and safety policy, failure to attract, develop and retain talent, failure of Group information and telecommunication systems, malicious cyber-attack, availability of credit and vehicle financing, use of estimates, currency risk and the potential impact of the UK having voted to leave the EU. The Board believes that the main risks associated with the decision to leave the EU are significant changes in consumer behaviour and the impact of exchange rates on manufacturer volume strategies and vehicle pricing. All other principal risks are consistent with those detailed in the Annual Report for the year ended 29 February 2016.
The Board continually review the risk factors which could impact on the Group achieving its expected results and confirm that the above principal factors will remain relevant for the final six months of the financial year ending 28 February 2017.
13. Post balance sheet events
On 1 October 2016, the Group disposed of the Fiat Group dealership in Newcastle which comprised three sales outlets (Fiat, Jeep and Alfa Romeo). The disposal to Richard Hardie Limited is part of their creation of a Fiat Group market area in the North East. In addition, Fiat sales will cease at the Group’s sales outlets in Cheltenham and Derby at the end of December 2016. This will leave the Group with a single Fiat and Alfa Romeo sales outlet in Worcester and no Jeep representation.