date: 12/04/2019 investment highlights
TRANSCRIPT

1
Food and Beverages Sector, Food Processing Industry
Ho Chi Minh Stock Exchange (HOSE)
NAM VIET CORPORATION Date: 12/04/2019
Ticker: ANV USD/VND = 23,636 Investment Highlights
Key Figures
Closing price 26,600 VND (1.13 USD)
Target price 30,599 (1.29 USD)
Upside/downgrade 15.03% Recommendation BUY
Share outstanding 127,144,875 Market capitalization 3,382.05
Billion VND P/E 5.64x EV/EBITDA 5.90x Source: Thomson Reuters, Team estimates
Valuation Worst Case Base Case Best Case
DCF (75%) 28,598 30,933 33,763
EV/Revenue (15%)
28,826 28,826 28,826
P/E (5%) 24,400 24,400 24,400
EV/EBITDA (10%)
16,595 16,595 16,595
Target Price
28,847 30,599 32,721
Upside 8.45% 15.03% 23.01%
Recommen-dation
Hold Buy Outweight
Source: Team estimates
One-year Price Movement
Source: Thomson Reuters
We issue a BUY recommendation on Nam Viet Joint Stock Company with a one – year target
price of VND 30,599 using the Discounted Free Cash Flow to Firm Method and Multiple
Valuation Method. This offers a 15,03% upside from its closing price of VND 26,600 on April
12th, 2019. Navico is able to further maximize their firm value by capitalizing on the future
favorable demographic and economic conditions through its proper core business strategy,
thoroughly integrated value chain and potential business growth. Our recommendations are
based on the following key catalysts:
Thriving Prospects of the Pangasius Exporting Business
According to a FAO’s report, by 2030, the fish consumption has progressed from 17.2
kg/person/year in 2010 to 18.2 kg/person/year in 2030. The production of pangasius is
estimated to be one of fastest growing industries, maintaining roughly a 5% share of the
global production until 2030 while the aquaculture production around the world will grow at
a CAGR of 1.76% from 2020 to 2030. The Vietnamese pangasius output achieved a CAGR of
5.25% in 2014 - 2018 and is expected to continuously grow by 10% in 2019. Apart from that,
Vietnam is ideally located in a favorable the geographical region and ecological conditions –
the Mekong delta - to produce the fish at relatively low cost, mild flavor and delicate texture,
which are the ultimate competitive advantages compared to other countries around the
world. We strongly believe that the pangasius industry could accomplish a better revenue
momentum in the medium term.
Core Business with Pioneering Strategy Enhances Costs Efficiency and Quality
The preparations of a closed integrated production value chain acts as a precursor to reduce
the production costs from 5% - 10%, compared to the market, combining the initiative of
fingerlings, feed manufacturing, quality control and sustain the farming to compress the
production costs with massive production as well as to eliminate of market’s variation.
Moreover, feasible solutions are being applied to focus on increasing the labor productivity,
reducing administrative cost, and integrating technology to business. All of that grants the
company a huge competitive advantages of production, resulting in a rise in the gross margin
from 17.6% in 2015 to 22.9% in 2018.
The Sustainable Development of International Market
With over 15 year-experience in pangasius industry, Navico has proven their own
competitiveness by consecutively maintaining their position in the Top 5 of the largest
pangasius exporters in Vietnam. A strong growth of core business reporting in a CAGR of
10.42% in 2014 – 2018 is reasonably followed by the continuous development of core
business in diverse, stable markets, including strategic partners with strong distribution
networks to deliver to end users. Futhermore, upon observing of positive signals from the
Middle East, the United States, China, Navico is planning a different strategy to reap the
potential revenue of each market. The Company’s emphasis on the pangasius business is able
to grow successfully in the emerging key markets, especially China – concentrating on a
differentiation strategy on the fish-serving food chains, large fish commercial chains which is
becoming the new development trend.
Key ratios 2018 2019F 2020F 2021F 2022F 2023F
Total revenue 4,117 4,736 5,469 6,340 7,374 8,601
% growth 39.6% 15.0% 15.5% 15.9% 16.3% 16.6%
Gross profit 944 1,169 1,350 1,565 1,821 2,124
Gross margin 22.9% 24.7% 24.7% 24.7% 24.7% 24.7%
NPAT 599 485 694 859, 1,146 1,383
% growth 321.4% -19.0% 42.9% 23.8% 33.4% 20.7%
ROE 37.0% 24.4% 29.3% 29.5% 30.9% 28.9%
Source: Company filings, Team estimates
0
5,000
10,000
15,000
20,000
25,000
30,000
0
200
400
600
800
1,000
1,200
1,400
VNDVND
VNINDEX ANV

2
Figure 1: Revenue breakdown 2018
Source: Annual report
Figure 2: Exporting markets
Source: Annual report
Figure 3: Integrated full value chain
Source: Team’s collection
Business Description Nam Viet Corporation ('NAVICO’ or ‘ANV’) is the second largest pangasius exporting company in Vietnam.
Originally established in 1993 as Nam Viet Co., Ltd., the company initially operated in the field of civil and
industrial construction. Seven years later, in 2000, Doan Toi - the Chairman of Nam Viet decided to shift
their investment direction into the seafood processing industry upon observing potential economic
values of the pangasius. The company was privatized and transformed into Nam Viet Corporation in 2006
before it was officially listed in the Hochiminh Stock Exchange under the ticker symbol ‘ANV’ in December
2007.
Pangasius products are the major revenue contributor
In 2018, 84% of NAVICO total revenue comes from export of fresh and value-added pangasius products
(fillet, butterfly cut, etc.), amounting to 3459.1 billion VND (Figure 1). The Company also provides fish
feed, seafood by-products (fish oil, fish powder, biodiesel and adhesives) and other activities including
paper packaging manufacture and printing, civil and industrial construction as well as fertilizer
production.
Export plays a predominant role
NAVICO is an export-oriented pangasius manufacturer whose revenue from foreign markets added up to
80% (3,305.3 billion VND) at the end of 2018. Their major importers include China (distributed through
Shanghai Fenglei International Trading Co., Ltd), where the company managed to surpass other
Vietnamese competitors in terms of export volume only after 6 months. In addition, Nam Viet export is
equally shared among ASEAN countries (Thailand, Malaysia), North America (Brazil, Colombia), and
Europe (Italy, Belgium, Netherlands) (Figure 2). In 2020, Nam Viet aspires to file their long-awaited
return to the promising US market, which is the largest consumer of the Vietnamese pangasius with a
market share of 24.2% and a growth rate of 54.5%.
Company Strategy
In order to succeed, NAVICO maintains its focus on 3 main factors: a sustainable fully integrated value
chain, a 4-P strategic business plan and their serious commitment to product quality.
A sustainable fully integrated value chain
Nam Viet has successfully set up complete a value chain (Figure 3) which helps the company avoid the
risk of input scarcity and price fluctuation.
Hatchery: Nam Viet hatcheries can supply 14 billion in-house fingerlings using 20,000 brood stocks annually. Their larvae are estimated to survive at a rate of 5-15%, which is 2-5% higher compared to other farmers. In addition, the survival rate of NAVICO fingerlings vary from 70% to 80%, while other companies can only maintain theirs at around 30- 50%. This allows the company to actively control the quantity, the quality and the price of their fingerlings supply.
Feed factory: NAVICO is securing forward supply contracts to ensure the price and quantity of their feed factory input. High-quality raw input materials (soy bean, cassava and fish meal) are imported from foreign countries while rice bran, which makes up around 40-50% of the feeding compound, is obtained locally from the rice export factories. These materials are processed at Navifeed factory with a total capacity of 380,000 tons per annum, 80 percent of which is used to directly supply the farming sites and the rest 20% for sale.
Farming site: With 24 farming areas, NAVICO operates a total farming site of over 300ha, with total volume 120,000 tons per year. Since 2018, the company has constructed Binh Phu high-tech aquaculture 600ha, projected farming area to reach 750 ha and rise hatchery area with 150 ha. Until 2021, NAVICO’s capacity will reach to 250,000 tons annually. Until 2018, the company can raise 30% in fingerling to mature. This rate will be projected 70% in 2019 and 100% in 2020.
Processing plant: NAVICO has 4 factories with a maximum total capacity reaching 1200 tons per day. At the present, total operating capacity achieves 450 tons per day by 2 processing factories, 1 being rented out and 1 under repair. Having increased the farming volume, the firm expects their processing output to increase to 500 tons/day in 2020 and 870 tons/day in 2021.
Distribution: The firm orientates a vertical integrated distribution channel. This allow them to capture of large market share through maintaining the relationship with strategic partners in each market, owning distribution network to delivery products to consumers. Their typical wholesale partners include Markro, Dayseaday, Opergel foods, El Nasser star and Shanghai Fenglei International.
Commitment to products quality
With a team of highly qualified technicians, they can control the quality from their fingerlings to the
farming areas to ensure the quality of every single-product. In addition, the company also sends technical
staff to monitor farmers. Therefore, farmers can reduce the risks in the production process, especially the
quality, while the production of raw pangasius increases in quantity. Their farming sites also meet ASC
84.0%
10.0%
4.5%1.0%
0.5%
Pangasius export Fish feedBy-products Raw pangasiusOther
20%
17%
14%13%
13%
10%
9%
4%
China Brazil ThailandEU Other ColombiaMexico Egyt
Hatchery
DistributionProcess
PlantFarming
Site
Feed Factory
Distribution Distribution

3
Figure 4: 4P strategic plan
Source: Company filing
Figure 5: Shareholder structure
Source: Company filing
and BAP standards, which are among the strictest global criteria. Besides, the factories meet other global
certifications such as ISO, HALAL, IFS, BRC, etc.
4P business strategic plan (Figure 4)
Product: NAVICO continues to improve the quality of their farms as well as output product to match every customer’s demand.
Price: ANV develops massive and high-technology farming sites to reach maximum efficiency to lower our input cost.
Promotion: Company sells the product at a more affordable price to the strategic partners to support their distribution of the final product.
Place: Besides the existing markets, NAVICO keeps exploring more markets with potential customers.
Shareholder Structure
Up to now, there are 127.539.625 shares outstanding. There are three biggest investors in the company
are Doan Toi, Doan Chi Thanh, Doan Chi Thien with ownership of 46.33%, 13.50% and 13.50%,
respectively (Figure 5). Most of shareholders are Board of Director, so there are some positive impacts
on the company, such as guarantees the stability of management decisions (Appendix D).
Corporate Governance
The effectiveness of the concentrated corporate governance (CG) is developed by three main components
with independent and cross check mechanism:
(1) General Shareholders Meeting (GSM): the GSM provide the ultimate decision power with one share
one vote policy including right of inspection, a right to dividend, pre-emptive right, etc.
(2) Board: The Board established governance supervisory comprising of risk, governmance, election
committes, nomination, audit.
(3) Audit and Oversight: the internal auditor oversees the board, compliance regulation annually,
designed by Chief Governance Officer and external audit are employed by contracting with highly reliable
experts (A&C - audit company) to have a better grasp of possible risks the Company may encounter.
Local Eonomic & Social Responsibility
The firm implements energy, water saving policy to mitigate the impact throughout production to
environment. The special concern of company to training about labour safety, hygiene practices, working
safety has improved in recent years. Moreover, Navico actively contribute the local community through
diverse charity funds and granted children of employees those who accomplished high academic
achievement.
Source: Global Seafood Market Conference
Industry Overview and Competitive Positioning Industrial overview The largest player in global market
Vietnam has retained its dominated position in global pangasius market for the last 20 years. Currently,
Vietnam is the world largest pangasius supplier, recording a half of global market. The remainder
provided by India, Bangladesh, Indonesia, Malaysia, and China. The forecast output volume of total
Vietnam pangasius will rise around 1.311 million tons in 2019 which records higher than total amount
of India and Bangledesh (Figure 6).
The pressure of catfish growth from host countries
Pangasius became the native fish of Vietnam, possessing huge economic value, wide-range acceptance
and the demand is high in major markets, including the US and China, the number of countries have seen
the bright prospects that plan to stepped in to produce the fish, placing a considerable competitive
pressure on Vietnam. Moreover, the imported countries, especially, Brazil, start increasingly producing
native fishes to meet their domestic demand, while most of Vietnam’s pangasius targets to export to
those countries. That results in a fierce competition in global market.
Government jumped to spur export and sustain domestic production
Vietnam’s government proactively has signed many Free Trade Agreement (“FTA”) so as to foster
conditions for expanding our export market, putting the effort to remove trade barriers. By
implementing that, the mechanism is create to encourage Vietnamese enterprises to participate in
regional value chains and seek new opportunities in emerging market. In 2018, the aquatic products
export increased 8.4% year on year (“VASEP”) demonstrate the good outlook. On the other hand, with
the plan to enhance the quality of pangasius and stability of the supply, the authorities awared the
Product Price
Place Production
4P
48.54%
13.45%
13.45%
24.56%
Doan Toi Doan Chi Thanh
Doan Chi Thien Other
523
541
625
1311
0
500
1000
1500
2000
2500
3000
3500
2016 2017 2018 2019(Est.)
MT (1000)
Figure 6: Pangasius World Harvest - Whole Fish Weight
Indonesia BangledeshIndia Vietnam

4
Figure 7: Top Vietnamese Exporting Markets
Source: Company filings
bottleneck of industry - the hatchery stage challenges many domestic firms. Government carried out the
3 levels of pangasius farming to support from broodstocks to fingerlings to overcome the shortages of
fingerlings. That stabilizes the domestic production and foster the aquatic export.
Advantages of pangasius production and quality
Almost farming sites of local pangasius enterprises are located in Mekong delta, benefiting advantages
of ecological conditions: plentiful sources of rice bran, fish meal; water supply from downstream river;
cheap labor costs, making the firms save 5-10% lower production costs compared other neighbor
countries. Beside that the Vietnam’s pangasius meat is high appreciated around the world because of
non-containing fishery smell, great color, naturally sweet tastes. Obviously, Vietnam, owns the high
competitive advantages in commerce by offering the reasonable price associated with the premium
fillet.
Global political movements redeem the exporting seafood growth.
Vietnam simultaneously take advantages to import pangasius products into three largest market which
catfish export volume into US, China- Hong Kong and Mexico record around 25%, 21%, 5% of total
pangasius export, respectively (Figure 7). The prospect outlook is still positive when catfish
consumption is increasing rapidly, household final consumption expenditure of United States and
European nations remains high, as well as the demand growth from Middle East, especially, UAE, Egypt
and Saudi Arabia (26.4%). Specially, the largest market with 1.3 billion people are increasing the catfish
demand and expect to grow rapidly in next years
Competitive positioning The key farming efficiency
Since 2014, the preparation of hatching area aimed to solve the bottleneck of production from brood
stocks, fish fries to fingerlings that manages the production quality. This eliminate the shortage of
fingerlings from market which are vulnerable disease, unqualified origin and seasonal price fluctuation.
While other rivals purchase fingerlings from market when signs of demand growth surge.
The prominent element compresses the product costs
The input raw materials to fish feed accounts for around 72% of pangasius’s price with ratio 1:1,55.
With fixed cost contracts and large amount of materials, the feed price declines to average 10,000
VND/kg. That acts as precursor to reduce the manufacturing price compared to other competitors,
relying on feed production outsourcing.
The place emerges the competitive advantage
According to NAVICO, possessing the benefit of self-supply from feed factory and hatchering area
provide Nam Viet reduce production cost 5-10% which price is around 22,000 VND/kg compared to
27,000 VND/kg from market (Figure 8). Beside that 100% initiative of farming helps NAVICO avoid the
risks in terms of diseased fishes, price changes and thus, increase effectiveness.
Source: Team estimates
Source: FAO
Investment Summary We issue a BUY recommendation on Nam Viet Joint Stock Company with a one – year target price of VND
30,599 using the Discounted Free Cash Flow to Firm Method and Multiple Valuation Method. This offers
a 15,03% upside from its closing price of VND 26,600 on April 12th, 2019. Navico is able to further
maximize their firm value by capitalizing on the future favorable demographic and economic conditions
through its proper core business strategy, thoroughly integrated value chain and potential business
growth. Our recommendations are based on the following key catalysts:
Thriving Prospects of the Pangasius Exporting Business According a FAO’s report, by 2030, the fish consumption kg/person/year has progressed from 17.2 in
2010 to 18.2 in 2030 (Figure 9). The pangasius production has recorded as one of fastest species rised
and maintained the share around 5% of total global production until 2030 while global aquaculture
production will grow at 1.76% of CAGR in 2020 -2030. Vietnam pangasius gains 5.25% of CAGR in 2014-
2018. A part from that, Vietnam possesses geographic range, ecological conditions – Mekong delta - to
product the fish's relatively low cost, mild flavor and delicate texture have gains competitive advatages
compared to other countries across the world. We strongly believe that pangasius industry could
accomplish better revenue momentum over medium term.
25%
21%
5%
4%3%3%
3%
36%
USA ChinaMexico BrazilThailand ColumbiaNetherlands Others
15.7519.5
1.7
1.95
1.55
1.86
1.35
1.8
1.3
1.45
0.35
0.44
0
5
10
15
20
25
30
ANV Market
VND
Figure 8: ANV vs Market Cost breakdown
Feed Utility Labor
Fingerlings Chemicals Others
17.2
18
18.26.96
7.88.55
0
2
4
6
8
10
16.6
16.8
17
17.2
17.4
17.6
17.8
18
18.2
18.4
2010 2020F 2030F
Figure 9: Global Fish Consumption per Capita
Population (Billion)
Kg/head/year

5
Source: VASEP
Core Business with Pioneering Strategy Enhances Costs Efficiency and Quality
The preparations of closed integrated production value chain acts as precursor to reduce the production
costs from 5% - 10%, compared to market, combining from initiative of fingerlings, feed manufacturing,
quality control and sustain the farming to compress the production costs with massive production as
well as to eliminate of market’s variation. Moreover, the feasible solutions focused on increasing the
labour productivity, reducing administrative cost, integrating technology to business. All of that bring
the huge competitive advantages of production and result in the rise in gross margin from 17.6% in
2015 to 22.9% in 2018.
The Sustainable Development of International Market With over 15 years-experience in pangasius industry, Navico has proven the their own competitiveness
by consecutive scoring top 5 of the largest pangasius exporter in Vietnam. A strong growth of core
business reporting in a CAGR of 10.42% in 2015 – 2018 is reasonably followed by the continuous
development of core business in diverse, stable market, including strategic partners with the strong
distribution networks to delivery to end users (Figure 10). Futhermore, observation of positive signals
from Middle East, United States, China, Navico plans different strategy to reap the potential revenue of
each market, The Company’s emphasis on pangasius business is able to grow successful in the emerging,
key markets, especially, China – concentrating differentiation strategy on the related fish-serving foold
chains, large fish commercial chains which become new trend development
Figure 11: Valuation Results
Method Value Weight Contribution
DCF 30,933 75% 23,240
EV/Revenue 28,826 15% 4,324
P/E 24,400 8% 1,830
EV/EBITDA 16,595 8% 1,245
Target Price in 2019 30,599
Current Price 26,600
Upside 15.03%
Source: Team estimates
Source: Team estimates
Valuation Valuation Price Target: VND30,599 (USD1.29)
Recommendation: BUY
We evaluate ANV using both Discounted Free Cash Flow to Equity and Relative Valuation methods with 3
multiples EV/Revenue, P/E and EV/EBITDA. ANV’s shareholding structure represents the proxy for the
assigned weights to these valuation methods (Figure 11). 75% of ANV’s current shareholders are BOD’s
member and management team who are able to employ cash-flow-related methods thanks to their
accessibility to ANV’s strategic direction and management. The rest 25% free float belongs to minor
shareholders to whom the Relative Valuation method would be more applicable because of information
asymmetry.
Discounted Free Cash Flow to Equity DCF – The “CF” Part: Cash Flow
Revenue Projection (Figure 12)
ANV’s Revenue is broken down into 2 components: Domestic and Export.
Domestic: 2 key drivers of this component is limited domestic demand due to taste preference and a wide
range of other alternatives. Based on our quantitative method, we assume that domestic revenue remains
the same as 2018 due to its fluctuated growth rate trend from 2015 to 2018.
Export: Our team estimates the revenue growth rate of this segment is 15% compared to industry growth
10% in 2019. The foreign strategic partnership remains an indespensible thanks to the stable demand
and potential benefits which ANV aligns with its wholesale partner in market research for customer
portfolio. ANV’s most apparent partnership is with FengLei Int. who has reliable distribution channel
from warehouse, transportation and retailer system (more than 30 stores). Our team estimates foreign
market demand growth would mostly come from China-Hong Kong, EU, Middle East, especially UAE,
Egypt and Saudi Arabia.
DCF – The “D” Part: Discount Rate
ANV’s cost of equity is calculated based on the popular risk measurement CAPM. Risk-free rate of 4.80%
is the current yield of 10-year Vietnamese government bond (12-April-2019, Asian Development Bank).
According to the estimation of Prof. Aswath Damodaran Vietnam’s equity risk premium of 8.59% is from
the perspective of Prof. Aswath Damodaran. ANV’s Beta of 0.81 is derived from Thomson Reuters financial
record of the company (Figure 13). Comparable’s betas and Debt/Equity ratio are estimated to be 0.92
and 68.2% respectively, from which we achieve the comparables’s unlevered beta of 0.58. This number is
re-levered by using ANV’s current Debt/Equity ratio to arrive at ANV’s levered beta of 0.77. Based on
comparable companies, the WACC is 9.18% while WACC based on historical beta 9.43%.
Gross Margin, Selling, General and Administrative Expenses Gross Margin is forecast to burst down from 22.9% in 2018 to 24.9% in 2023. The proportion of Selling, General and Administrative Expenses over Total Revenue is projected to stabilized in coming years due to our expectation that positive effects of economies of scale will offset the result of larger investment in expanding strategy and product quality enhancement. Moreover, it can also lead to a soar in net income
growth by 20%.
813 813 813 813 813
3,9234,657
5,528
6,562
7,789
0
1,000
2,000
3,000
4,000
5,000
6,000
7,000
8,000
9,000
10,000
VND billion
Figure 12: Revenue Forecast
Domestic Export
1.571.72 1.78
2.262.4
0
0.5
1
1.5
2
2.5
3
2015 2016 2017 2018 2019F
Figure 10: Vietnam Pangasius Export Value
Export Value (USD Billion)
6
Figure 13: Cost of Capital
Variable Value
Risk-free Rate 4.80%
Beta 0.77
Equity Risk Premium 8.59%
Cost of Equity based on Historical Beta
11.75%
Cost of Equity based on Comparables
11.41%
Capital Structure 27% Debt, 72.85%
Equity
WACC 9.18%
Source: Aswath Damodaran, Thomson
Reuters, Team estimates
Figure 14: Summary of DCF Method
DCF Summary (VND bn)
Growth rate 1.0%
WACC 9.30%
PV of Terminal Value 78,675,699
Equity Value 109,545,884
As of % of Equity Value 71.82%
Less: Cash & Cash Equivalents 8,431,275
Plus: Debt 1,625,909
Number of Outstanding Share 127,144,875
Intrinsic Value per Share (VND) VND 30,933
Difference from Current Price 16,29%
Source: Team estimates
Figure 16: Relative Valuation
EV/ Revenue
P/E EV/
EBITDA
Vinh Hoan 1.07x 6.13x 4.95x
Hung Vuong 0.61x 91.87x 7.57x
I.D.I 0.72x 2.07x 11.78x
Cuu Long 0.88x 4.14x 3.90x
NAVICO 1.11x 5.64x 5.90x
Mean 0.80x 5.13x 6.26x Source: Thomson Reuters
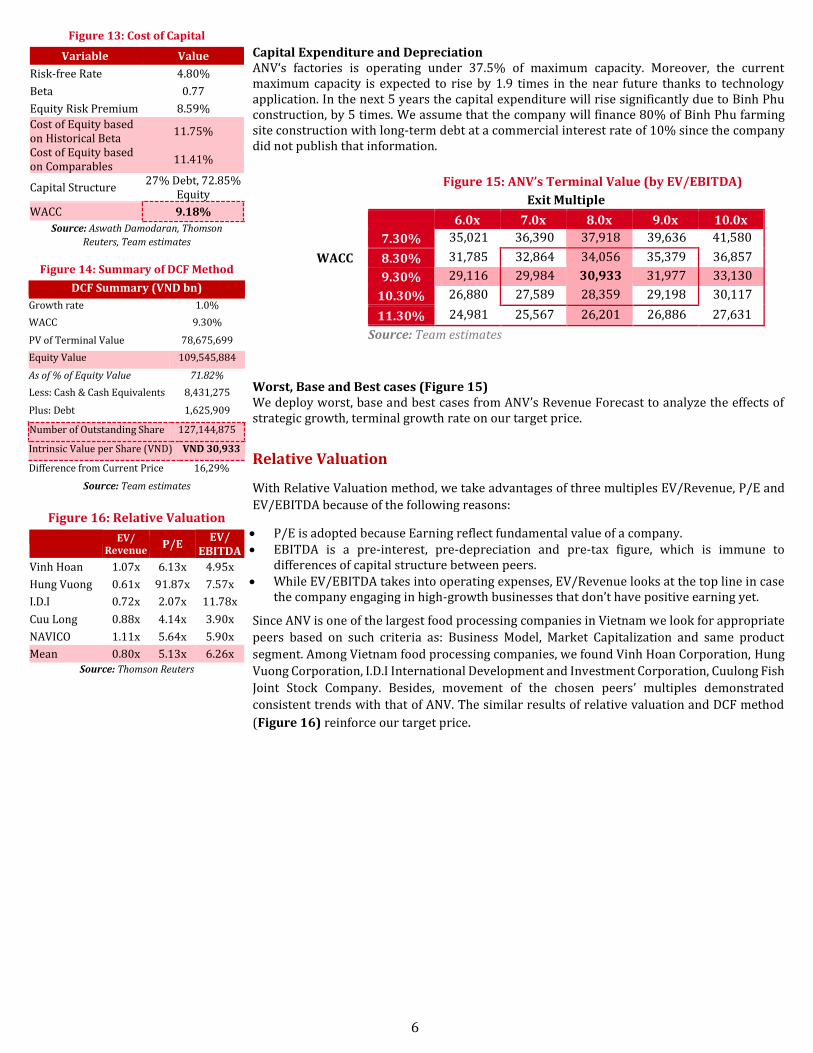
Capital Expenditure and Depreciation ANV‘s factories is operating under 37.5% of maximum capacity. Moreover, the current maximum capacity is expected to rise by 1.9 times in the near future thanks to technology application. In the next 5 years the capital expenditure will rise significantly due to Binh Phu construction, by 5 times. We assume that the company will finance 80% of Binh Phu farming site construction with long-term debt at a commercial interest rate of 10% since the company did not publish that information.
Figure 15: ANV’s Terminal Value (by EV/EBITDA)
WACC
Exit Multiple
6.0x 7.0x 8.0x 9.0x 10.0x
7.30% 35,021 36,390 37,918 39,636 41,580
8.30% 31,785 32,864 34,056 35,379 36,857
9.30% 29,116 29,984 30,933 31,977 33,130
10.30% 26,880 27,589 28,359 29,198 30,117
11.30% 24,981 25,567 26,201 26,886 27,631
Source: Team estimates
Worst, Base and Best cases (Figure 15) We deploy worst, base and best cases from ANV’s Revenue Forecast to analyze the effects of strategic growth, terminal growth rate on our target price.
Relative Valuation
With Relative Valuation method, we take advantages of three multiples EV/Revenue, P/E and
EV/EBITDA because of the following reasons:
P/E is adopted because Earning reflect fundamental value of a company. EBITDA is a pre-interest, pre-depreciation and pre-tax figure, which is immune to
differences of capital structure between peers. While EV/EBITDA takes into operating expenses, EV/Revenue looks at the top line in case
the company engaging in high-growth businesses that don’t have positive earning yet.
Since ANV is one of the largest food processing companies in Vietnam we look for appropriate
peers based on such criteria as: Business Model, Market Capitalization and same product
segment. Among Vietnam food processing companies, we found Vinh Hoan Corporation, Hung
Vuong Corporation, I.D.I International Development and Investment Corporation, Cuulong Fish
Joint Stock Company. Besides, movement of the chosen peers’ multiples demonstrated
consistent trends with that of ANV. The similar results of relative valuation and DCF method
(Figure 16) reinforce our target price.

7
Source: Company filings
Source: Company filings
Figure 19: Total Source of Cash in 2015 - 2018
Source: Company filings
Source: Company filings
Financial Analysis Our financial analysis is based on historical data from 2016 to 2018:
EBITDA Margin Improvements During 2016-2018 Due to Enhancing the Effectiveness Of ANV’s
Cost-Cutting Efforts
ANV’s EBITDA margin experienced an upward trend from 5.4% to 18.8% because of ANV’s ability to lock-
in both supply and demand from a sustainable integrated full value chain. As a result of rising dominance
of exporting activities which grows by 56,9% and accounts for 80,3% of total revenue (Figure 17) a
slightly shrinking revenue from domestic sales did not put much significant adverse effect on ANV’s
EBITDA margin due to its low profitability. (Appendix B2, B3)
Coupled with a higher EBITDA margin back by pangasius consuming property and Vietnam geographic
competitive position for farming, ANV production places ahead it foreign competitors from India,
Indonesia and Bangladesh whose unattractive pangasius quality could not attract favor from global
customers. ANV considerable effort of controlling input and output quality meets global certifications
which can be considered as positive encouragements.
Efficiency Operations Complied with Downstream Partnership in Varied Foreign Markets.
Historically, ANV’s cost-saving efficiency shows a gradually enhancement in cutting back its cash cycle.
Due to cooperation with ANV’s strategic partners, its distribution plan has successfully reached a great
expansion in the most outstanding and potential market – China. ANV’s strength of large production
capacity has eventually matched a local wholesale with large distribution channel. Thus, its downstream
partnership has accelerated the company overall health and efficiently generating cash. This originates
from a combination of lowering accounts receivable days and inventory days despite a moderate
declining of account payable days. As a whole, cash cycle dropped down from 205 days in 2017 to 143
days in 2018.
External Financing Provides Primarily Support for Working Capital Investments
Due to ANV’s arrangement for foreign market expansion, the Company’s working capital was mainly
subjected to short-term borrowings. (Figure 19) As the current ratios is a reliable indicator representing
the company’s liquidity while ANV production which has been boosted mostly for exporting activities
accounts for current ratio to rise from 1.07 in 2017 to 1.33 in 2018. However, in 2018 ANV’s interest
coverage ratio of 17 which was extraordinarily high compared to interest coverage ratio of 4 in 2017. This
shows company ability to meet its interest obligation is significantly sound and in 2018 the company was
excessing in cash.
Immense Rise Capital Expenditure Requirements in the Foreseeable Future
ANV’s high-technology Binh Phu farming site expansion will initially take up to VND4000 billion to meet
up foreign market demand. The farming investment starts in 2018, which explains for more than VND410
billion in land purchase and land management cost. (Appendix C). Our team estimates company’s
financing plan involves more than 80% of long-term debt in the next 5-year period in order to
Ratios 2016A 2017A 2018A 2019E 2020E 2021E 2022E 2023E
Profitability
EBITDA margin 5.4% 11.7% 18.8% 15.8% 15.8% 15.8% 15.8% 15.8%
Operating profit margin 3.2% 8.4% 16.8% 13.8% 13.3% 12.8% 13.4% 13.2%
NPAT margin 0.7% 4.8% 14.6% 5.9% 8.1% 8.6% 10.2% 10.5%
Return on assets 0.4% 5.0% 19.6% 6.1% 7.9% 8.9% 10.2% 10.4%
Return on equity 1.5% 10.5% 37.0% 14.4% 21.1% 22.7% 26.2% 25.7%
Liquidity & Credit
Quick Ratio 0.48 0.35 0.72 6.81 1.29 0.64 0.46 0.39
Current Ratio 1.28 1.07 1.33 9.83 2.51 1.23 0.90 0.76
Interest Coverage Ratio 1 4 17 2 3 4 5 6
Financial Leverage
Debt to assets 0.46 0.41 0.37 0.49 0.52 0.54 0.54 0.52
Debt to equity 1.05 0.79 0.68 1.42 1.30 1.42 1.37 1.25
Equity Multiplier 2.30 1.93 1.85 2.61 2.52 2.65 2.59 2.47
Shareholder Ratios
Earnings per share 273 1,120 4,717 2,060 3,216 3,865 5,197 6,121
Dividend payout ratio 0% 41% 25% 20% 20% 20% 20% 20%
929 29
20
9171 71
80
0%
20%
40%
60%
80%
100%
Figure 17: Revenue Breakdown in 2015 - 2018
Domestic Export
9171 71
80
929 29
20
0%
20%
40%
60%
80%
100%
Figure 18: Gross profit structure
Exports Others
65.20%
24.52%
10.28%
Short-term borrowing CFO Others
1.57 1.67 1.79
2.26
1.5
1.4
1.46
1.59
1.3
1.35
1.4
1.45
1.5
1.55
1.6
1.65
0
0.5
1
1.5
2
2.5
2015 2016 2017 2018
Figure 20: Revenue of Export
Revenue of export(billion USD)Revenue per ton(Thousand USD)

8
Source: Company filings
constructing Binh Phu farming site. ANV’s capital expenditure will eventually cause its financial leverage
to increase considerably.
ROE Decomposition
2018 2019F 2020F 2021F 2022F 2023F
Net Profit Margin 4,117 4,736 5,469 6,340 7,374 8,601
Asset Turnover 39.6% 15.0% 15.5% 15.9% 16.3% 16.6%
Leverage Ratio 944 1,169 1,350 1,565 1,821 2,124
ROE 22.9% 24.7% 24.7% 24.7% 24.7% 24.7%
Adjusted ROE 599 485 694 859 1,146 1,383
In the projection horizon, we expect the ratios of selling expenses/core revenue and G&A expenses/core
revenue to remain stable at 3.9% and 0.2% respectively. This is spurred by the historical ratios even the
ratio of total equity/total debt will increase gradually from 944 in 2018 to approximately 2124 at the
end of 2023. Beside Upward trends in financial leverage, there will be significant increases in the
Company’s ROE largely driven by remarkable improvement in gross margin and consequently high net
profit margin.
Figure 22: Risk Matrix
I
mp
act
L
ow
Me
diu
m
Hig
h
M1
B2 M2 E1
B3 M3 B1
Low Medium High Probability
Source: Team analysis
Source: Thomson Reuters, Team estimates
Investment Risks Impact and likelihood of the following risks are presented in Figure 22. Market Risks [M1] Interest rate increase (High probability, High impact) Despite NAVICO’s reliance on short-term borrowing funds its business while average interest expense accounts for 1-3 of revenue in the past. It is forcasted that this account will rise dramatically under the lending options which has high impact on company under the funding options to Binh Phu Project. [M2] Exchange rate fluctuate (High probability, High impact) NAVICO is holding the number of assets in USD and EUR associated with the currency volatility. In 2018, NAVICO enjoyed the advantage of the strong increase of USD, whilst EUR offseted the part of assets entailed its. With the orientated- export stragegy, net cash flows in USD and EUR are hedged by forward contracts on an 12-month rolling basis to mitigate this risk of currency fluctuation, though unpredictable externatlities can change the exchange rate. [M3] Pangasius price risk (High probability, Medium impact) The fish price has high influence on both demand and supply as the relationship between fish price and NAVICO gross profit, indicated by the correlation at 0.483 (Figure 23). That leads in focusing on pangasius export, recording 80% total revenue. But thanks to close production chain, firm is able to control the production price better than market.
Business and Operational Risks [B1] Substitute and ready-to-cook products (High probability, Medium impact) In the light of imported countries acclerates the output volume of native fishes to meet demand of domestic consumption. The pure pangasius fillet faced the pressure from similar types of products in these nations, although Vietnam’s pangasius positioned with the reasonable price and good quality of product. There is increasing a new trend of using marinated foods due to its usability, time-saving, cost-efficiency fitted their lives.
[B2] Concentrated Ownership (Medium probability, High impact) With 77% of shares is hold by the executive board (Appendix D) that entails the risk of controlling shareholdersn known to abuse their power and extract “private benefits of control” at the expense of the minority shareholders. In the past, NAVICO’s decision to expand out of core-business caused the losses that adversely affected the interest of minor shareholders. [B3] Management risk (Low probability, Moderate impact) NAVICO’s executive team combines veterant managers in fishery industry who worked more than decade in NAVICO. Losing key staff members may impact NAVICO's prospect and prestige. A part from that though, no pulic process and experience gaps among generations is unavoidable, NAVICO is preparing to tranfer the power progressively to next generation. [B3] Quality of Navico’s products (Low probability, high impact)
0
5
10
15
20
25
30
35
050
100150200250300350400450500
Mar
-16
Jun
-16
Sep
-16
Dec
-16
Mar
-17
Jun
-17
Sep
-17
Dec
-17
Mar
-18
Jun
-18
Sep
-18
Dec
-18
Correlation: 0.4831
VND bn VND '000
Figure 23: Correlation between Pangasius Price vs
ANV's Gross Profit
Gross Profit
Pangagsius Price
7.1% 6.8% 6.9%
4.9%3.0%
6.7%
1.8%
0.2%
0.0%
1.0%
2.0%
3.0%
4.0%
5.0%
6.0%
7.0%
0.0%
1.0%
2.0%
3.0%
4.0%
5.0%
6.0%
7.0%
8.0%
2015 2016 2017 2018
Figure 21: Selling, General Administration Expenses in
2014 - 2018
Selling exp./Core Rev
G&A Exp./Core Rev

9
NAVICO success is acclaimed its quality of fillet. Food hygience must be a priority throughout production processingby comprehensive quality control from broodstocks to packaged products. Additionally, inventory and distribution negatively impact on the quality of fresh products.
Enviromental Risk [E1] Specific industry risk (High probability, High impact) Risks of diseases, pollution, climate change, hav influenced sea level rise, has caused polluted, salt water to penetrate deeply into the fields, directly impacting farming areas. With specific activities of production, the environmental degradation profoundly impact on fishery industry, causing the high mortality rate of fingerling,tilapia during farming stage.

PART A: FINANCIAL STATEMENT
APPENDIX A1: FINANCIAL RATIO
2014A 2015A 2016A 2017A 2018A 2019E 2020E 2021E 2022E 2023E
Growth Rates (%)
Revenues -73.9% -9.9% 13.2% 4.4% 39.6% 15.0% 15.5% 15.9% 16.3% 16.6%
COGS -52.1% -34.0% 16.9% 0.8% 31.1% 12.1% 15.5% 15.9% 16.3% 16.6%
Gross profit -108.4% -227.8% -4.1% 25.3% 79.0% 24.9% 15.5% 15.9% 16.3% 16.6%
Selling expenses -84.7% -15.8% -15.4% 7.4% 10.3% 15.0% 15.5% 15.9% 16.3% 16.6%
Administration expenses -61.5% -39.1% 93.5% -71.4% -80.6% 15.0% 15.5% 15.9% 16.3% 16.6%
EBITDA -125.1% -132.5% -27.4% 125.6% 125.7% 27.1% 15.5% 15.9% 16.3% 16.6%
Depreciation and Amortization
-425.2% -107.6% 6.0% 58.1% -14.1% 13.2% 37.3% 35.3% -8.8% 24.2%
EBIT / Operating profit -95.1% 33.4% -40.1% 170.6% 180.3% 28.7% 13.2% 13.5% 20.1% 15.8%
EBT -97.7% -91.6% 460.0% 477.7% 314.2% -18.1% 38.5% 23.8% 26.2% 20.7%
NPAT -97.4% -97.5% 1175.9% 632.2% 321.4% -17.6% 42.4% 23.8% 33.3% 20.7%
EPS
321.2% -17.5% 42.4% 23.8% 33.3% 20.7%
Profitability
Gross profit margin -12.4% 17.6% 14.9% 17.9% 22.9% 24.9% 24.9% 24.9% 24.9% 24.9%
EBITDA margin -23.4% 8.4% 5.4% 11.7% 18.8% 20.8% 20.8% 20.8% 20.8% 20.8%
EBIT margin / Operating profit margin
4.1% 6.1% 3.2% 8.4% 16.8% 18.8% 18.5% 18.1% 18.7% 18.5%
EBT margin 2.2% 0.2% 1.0% 5.6% 16.8% 11.9% 14.3% 15.3% 16.6% 17.2%
NPAT margin 2.2% 0.1% 0.7% 4.8% 14.6% 10.4% 12.9% 13.8% 15.8% 16.3%
Return on Assets (ROA) 1.0% 0.0% 0.4% 5.0% 19.6% 10.9% 12.3% 14.5% 16.9% 17.4%
Return on Equity (ROE) 4.5% 0.1% 1.5% 10.5% 37.0% 24.8% 29.6% 29.6% 31.0% 29.0%
ROIC 8.0% 3.0% 2.7% 14.2% 36.5% 23.4% 19.0% 21.8% 26.8% 28.9%
Financial leverage
Debt Equity Ratio 1.09 1.27 1.05 0.79 0.68 1.25 0.86 0.79 0.64 0.48
Debt to Total Asset ratio 0.44 0.50 0.46 0.41 0.37 0.47 0.39 0.41 0.36 0.30
Equity Multiplier 2.46 2.53 2.30 1.93 1.85 2.65 2.19 1.93 1.76 1.59
Liquidity
Quick Ratio 0.41 0.32 0.48 0.35 0.72 7.90 3.35 1.01 0.75 0.67
Current Ratio 1.03 1.11 1.28 1.07 1.33 10.94 5.56 1.90 1.41 1.26
Coverage ratios
Interest coverage (EBIT/interest)
2 2 1 4 17 3 4 6 8 12
Efficiency
Receivables Turnover 4.7 4.3 4.5 4.8 7.6 7.7 8.1 8.2 8.2 8.2
Accounts receivable Days 77 84 80 76 48 48 45 45 45 45
Inventories Turnover 2.5 1.7 1.9 2.3 3.4 3.5 3.7 3.7 3.7 3.7
Inventories Days 145 218 190 157 107 103 100 99 99 99
Payables Turnover 5.3 8.5 10.7 13.2 29.8 30.2 32.2 32.0 32.0 32.1
Accounts payable Days 68 43 34 28 12 12 11 11 11 11
Cash Cycle 153 259 236 205 143 139 133 133 133 132
Current Asset Turnover 0.8 1.3 1.5 1.8 2.4 1.6 1.6 2.1 2.3 2.3
Fixed Asset Turnover 2.8 7.5 8.5 8.8 8.8 5.8 4.5 4.0 3.7 3.7
Asset Turnover 0.5 0.8 0.9 1.0 1.3 1.0 1.0 1.1 1.1 1.1

APPENDIX A2: BALANCE SHEET (IN VND MILLIONS)
2014A 2015A 2016A 2017A 2018A 2019E 2020E 2021E 2022E 2023E
Current asset 1,909,324 1,824,163 1,907,897 1,317,061 2,090,119 3,503,419 2,515,515 2,840,557 3,218,440 3,657,406
Cash and Cash equivalents
8,913 12,707 21,796 25,902 69,153 1,344,686 87,133 98,392 111,481 126,686
Short term investments
502 - 900 - 451,530 505,756 568,930 642,445 727,910 827,190
Provision for ST investments
(150) - - - - (30,224) (34,000) (38,393) (43,501) (49,434)
Accounts receivable
655,549 495,274 748,878 472,602 611,248 607,007 682,829 771,060 873,635 992,791
Provisions for receivables
(106,768) (31,022) (105,744) (89,167) (42,054) (41,762) (46,979) (53,049) (60,106) (68,304)
Inventories 1,148,753 1,304,064 1,195,358 887,129 969,279 1,083,258 1,218,568 1,376,025 1,559,079 1,771,724
Provisions for Inventory deduction
(1,182) (1,661) (268) (13,310) (7,037) (7,864) (8,847) (9,990) (11,319) (12,863)
Other current assets
203,707 44,801 46,977 33,905 38,000 42,564 47,880 54,067 61,260 69,615
Long term assets 1,417,540 1,449,909 1,109,929 1,385,253 1,334,949 1,930,930 2,671,668 3,284,770 3,923,273 4,535,035
Long term investments
738,378 772,349 173,102 496,646 334,213 374,350 421,110 475,524 538,784 612,269
Provisions for LT Investments
(13,135) (17,469) (17,912) (18,740) (8,652) (20,851) (23,455) (26,486) (30,010) (34,103)
Tangible Fixed Assets
215,111 173,205 161,518 197,285 209,961 522,868 1,132,864 1,697,424 2,277,240 2,818,590
Historical price 796,017 810,569 857,048 986,815 1,079,664 1,472,545 2,197,545 2,922,545 3,647,545 4,372,545
Accum depreciation
(580,906) (637,364) (695,530) (789,530) (869,703) (949,678) (1,064,681) (1,225,122) (1,370,305) (1,553,955)
Intangible Fixed Assets
116,151 213,697 210,924 243,266 297,099 283,246 269,392 255,539 241,685 227,832
Historical price 117,036 215,659 215,716 250,504 307,058 307,058 307,058 307,058 307,058 307,058
Accum Amortization
(885) (1,962) (4,792) (7,238) (9,959) (23,812) (37,666) (51,519) (65,373) (79,226)
Financial Leased Assets
86,189 92,241 116,988 78,041 41,802 (29,450) 61,525 61,525 61,525 61,525
Historical price 117,001 144,391 174,399 108,366 61,525 61,525 61,525 61,525 61,525 61,525
Accum Amortization
(30,812) (52,150) (57,411) (30,325) (19,723) (90,975) - - - -
Construction in progress
164,744 110,454 125,878 66,176 392,882 725,000 725,000 725,000 725,000 725,000
Other long-term assets
110,102 105,432 339,431 322,579 67,644 75,768 85,232 96,245 109,049 123,922
Total assets 3,326,864 3,274,072 3,017,826 2,702,314 3,425,068 5,434,349 5,187,183 6,125,327 7,141,712 8,192,441
Current liabilities 1,855,015 1,639,411 1,486,753 1,232,275 1,567,562 358,118 1,024,380 2,340,867 3,618,727 4,870,351
Short term debt 1,358,547 1,303,072 1,161,787 1,025,232 1,251,131 - 621,291 1,893,815 3,112,047 4,294,409
Accounts payable 311,605 208,388 221,495 99,773 118,846 128,177 144,426 163,245 185,117 210,521
Bonus funds 1,269 1,213 804 591 557 - - - - -
Other current liabilities
183,594 126,738 102,667 106,679 197,028 229,941 258,663 283,808 321,563 365,421
Long term debt 118,621 338,886 222,066 76,078 9,524 2,683,610 2,105,212 1,469,086 769,464 -
Total long term liabilities
118,621 338,886 222,066 76,078 9,524 2,683,610 2,105,212 1,469,086 769,464 -
Total liabilities 1,973,636 1,978,297 1,708,819 1,308,353 1,577,086 3,041,728 3,129,591 3,809,953 4,388,191 4,870,351
Shareholder equity
1,352,817 1,295,297 1,314,539 1,397,861 1,847,982 1,886,866 2,057,591 2,315,374 2,753,521 3,322,090
Chartered capital 660,000 660,000 660,000 1,250,446 1,250,446 1,250,446 1,250,446 1,250,446 1,250,446 1,250,446
Share premium 611,965 611,965 611,965 21,519 21,519 21,519 21,519 21,519 21,519 21,519
Retained earnings 108,270 21,750 69,992 153,314 603,435 642,319 813,044 1,070,827 1,508,974 2,077,543

Other funds - 29,000 - - - - - - - -
Treasury stock (27,418) (27,418) (27,418) (27,418) (27,418) (27,418) (27,418) (27,418) (27,418) (27,418)
Minority Interest 411 478 (5,532) (3,900) - - - - - -
Total liabilities and owner equity
3,326,864 3,274,072 3,017,826 2,702,314 3,425,068 4,928,593 5,187,183 6,125,327 7,141,712 8,192,441
APPENDIX A3: INCOME STATEMENT (IN VND MILLIONS)
2014A 2015A 2016A 2017A 2018A 2019E 2020E 2021E 2022E 2023E
Net Revenue 2,769,743 2,494,423 2,824,525 2,949,141 4,117,989 4,612,536 5,188,691 5,859,147 6,638,595 7,544,040
COGS 3,113,259 2,055,332 2,403,469 2,421,648 3,173,944 3,704,141 4,166,828 4,705,244 5,331,188 6,058,314
Gross profit (343,516) 439,091 421,056 527,493 944,045 908,395 1,021,863 1,153,903 1,307,408 1,485,726
Selling expenses 190,510 160,344 135,666 145,764 160,836 180,151 202,654 228,840 259,283 294,647
G & A expenses 112,915 68,743 133,025 38,051 7,388 8,276 9,309 10,512 11,911 13,535
EBITDA (646,941) 210,004 152,365 343,678 775,821 719,967 809,899 914,550 1,036,214 1,177,544
Depreciation & Amortization
(761,232) 57,535 60,996 96,446 82,894 93,828 128,857 174,294 159,037 197,503
Operating Profit / EBIT
114,290 152,469 91,369 247,232 692,927 626,139 681,042 740,256 877,176 980,041
Financial income 20,896 40,942 154,496 19,625 73,915 74,432 77,433 80,926 84,984 89,697
Interest income 7,346 15,145 6,158 9,949 50,699 50,699 50,699 50,699 50,699 50,699
Investment income (3,937) (77,357) (96,193) (2,089) (12,696) (16,492) (18,515) (20,870) (23,609) (26,792)
Other financial income
17,487 103,154 244,530 11,765 35,912 40,225 45,250 51,097 57,894 65,790
Financial expenses 83,339 117,117 89,338 63,842 75,220 401,836 304,807 276,006 267,533 251,501
Interest expense 65,852 81,839 76,318 56,834 45,918 369,016 267,887 234,315 220,296 197,821
Other financial expenses
17,487 35,278 13,020 7,008 29,302 32,821 36,920 41,691 47,237 53,680
Net other income 9,705 (3,268) (10,416) (31,650) 558 625 703 794 900 1,023
Profits from associates/ joint ventures
- (67,876) (117,273) (4,757) (2,032)
Earning before tax 61,552 5,150 28,838 166,607 690,148 299,360 454,372 545,970 695,527 819,260
Income tax 233 3,964 14,776 23,142 85,672 37,420.0 45,437 54,597 34,776 40,963
Deferred tax 13 (405) 630 (535) 310
Net income 61,306 1,591 13,432 144,000 604,166 261,940 408,934 491,373 660,751 778,297
APPENDIX A4: COMMON SIZE OF INCOME STATEMENT
ANV COMMON SIZE INCOME STATEMENT
2014A 2015A 2016A 2017A 2018A 2019E 2020E 2021E 2022E 2023E
Net Revenue 100.0% 100.0% 100.0% 100.0% 100.0% 100.0% 100.0% 100.0% 100.0% 100.0%
COGS 112.4% 82.4% 85.1% 82.1% 77.1% 80.3% 80.3% 80.3% 80.3% 80.3%
Gross profit -12.4% 17.6% 14.9% 17.9% 22.9% 19.7% 19.7% 19.7% 19.7% 19.7%
Selling expenses 6.9% 6.4% 4.8% 4.9% 3.9% 3.9% 3.9% 3.9% 3.9% 3.9%
G & A expenses 4.1% 2.8% 4.7% 1.3% 0.2% 0.2% 0.2% 0.2% 0.2% 0.2%
EBITDA -23.4% 8.4% 5.4% 11.7% 18.8% 15.6% 15.6% 15.6% 15.6% 15.6%
Depreciation & Amortization
-27.5% 2.3% 2.2% 3.3% 2.0% 2.0% 2.5% 3.0% 2.4% 2.6%
Operating Profit / EBIT
4.1% 6.1% 3.2% 8.4% 16.8% 13.6% 13.1% 12.6% 13.2% 13.0%
Financial income 0.8% 1.6% 5.5% 0.7% 1.8% 1.6% 1.5% 1.4% 1.3% 1.2%

Interest income 0.3% 0.6% 0.2% 0.3% 1.2% 1.1% 1.0% 0.9% 0.8% 0.7%
Investment income -0.1% -3.1% -3.4% -0.1% -0.3% -0.4% -0.4% -0.4% -0.4% -0.4%
Other financial income 0.6% 4.1% 8.7% 0.4% 0.9% 0.9% 0.9% 0.9% 0.9% 0.9%
Financial expenses 3.0% 4.7% 3.2% 2.2% 1.8% 8.7% 5.9% 4.7% 4.0% 3.3%
Interest expense 2.4% 3.3% 2.7% 1.9% 1.1% 8.0% 5.2% 4.0% 3.3% 2.6%
Other financial expenses
0.6% 1.4% 0.5% 0.2% 0.7% 0.7% 0.7% 0.7% 0.7% 0.7%
Net other income 0.4% -0.1% -0.4% -1.1% 0.0% 0.0% 0.0% 0.0% 0.0% 0.0%
Profits from associates/ joint ventures
0.0% -2.7% -4.2% -0.2% 0.0% 0.0% 0.0% 0.0% 0.0% 0.0%
Earning before tax 2.2% 0.2% 1.0% 5.6% 16.8% 6.5% 8.8% 9.3% 10.5% 10.9%
Income tax paid 0.0% 0.2% 0.5% 0.8% 2.1% 0.8% 0.9% 0.9% 0.5% 0.5%
Deferred tax 0.0% 0.0% 0.0% 0.0% 0.0% 0.0% 0.0% 0.0% 0.0% 0.0%
Net income 2.2% 0.1% 0.5% 4.9% 14.7% 5.7% 7.9% 8.4% 10.0% 10.3%
Minority Interest 0.0% 0.0% -0.2% 0.1% 0.1% 0.0% 0.0% 0.0% 0.0% 0.0%
Net income attributable to Equity Shareholders
2.2% 0.1% 0.7% 4.8% 14.6% 5.7% 7.9% 8.4% 10.0% 10.3%
APPENDIX A5: FCFE SCHEDULE (IN VND MILLIONS)
2015A 2016A 2017A 2018A 2019E 2020E 2021E 2022E 2023E
Free Cash Flow to Equity (FCFE)
88,153 (117,672) 355,874 435,874 1,224,414 (533,700) 396,983 410,864 425,579
Terminal value 4,062,550
Cost of equity 11.58%
Discount Period
0.7 1.7 2.7 3.7 4.7
Discount Factor
0.92 0.83 0.74 0.67 0.60
Present Value of FCFE
1,131,459 (441,998) 294,650 273,304 253,711
Cumulative Present Value of FCFE
1,511,126
Present Value of Terminal value 2,421,907
Equity value 3,933,033
Proportion of PV of Terminal Value to Equity Value
61.58%
Plus Total Debt 1,260,655
Less Cash and Cash equivalent (69,153)
Enterprise Value 5,124,535
Number of Outstanding shares 127,144,875
Intrinsic Value per Share 30,993

PART B: PROJECTION OF ANV’S REVENUE
APPENDIX B1: COST OF EQUITY CALCULATION
Variable Value
Risk-free rate 4.80%
Beta 0.81
Equity Risk Premium 8.59%
Cost of equity 11.58%
Source: Team estimate
Source: Thomson Reuter, Team estimate
Risk-free rate; The risk-free rate applicable to ANV is based on 10-year Vietnam Government bonds with yield of 4.796% in April
19th 2019.
Beta: Since single regressed Beta has many drawbacks, we modify the regression beta. The method is shown below:
(1) We find the companies working in similar or relevant industry of food processing industry in which ANV operates.
(2) 5-year regression Beta of these companies are average out and de-levered by D/E ratio and tax rate to get the unlevered
beta.
(3) We come up with the levered beta by formula: Levered beta = Unlevered beta * (1+(1-t)*D/E)
Equity risk premium: Using methodology and data offered by Prof. Aswath Damodaran, we come up with the equity risk premium
for Vietnam is 8.59%.
APPENDIX B2: REVENUE PROJECTION – REVENUE FROM EXPORTING
2014A 2015A 2016A 2017A 2018A 2019E 2020E 2021E 2022E 2023E
Revenue 2,467,571 2,267,393 1,997,847 2,106,799 3,305,276 3,923,363 4,657,031 5,527,896 6,561,613 7,788,635
Growth
-8.1% -11.9% 5.5% 56.9% 18.7% 18.7% 18.7% 18.7% 18.7%
Source: Team estimate
Revenue from exporting was oscillated since 2014. Until 2017, it increased again, and it can be said that the year 2018 was a
successful year for the company. We expect that revenue from exporting will raise based on historical performance, market demand
and outlook. Chinese clients continue to be the biggest clients, company keeps looking for new customers from other countries.
APPENDIX B3: REVENUE PROJECTION – REVENUE FROM DOMESTIC
Domestic 2014A 2015A 2016A 2017A 2018A 2019E 2020E 2021E 2022E 2023E
Revenue 302,172 227,158 826,679 842,341 812,714 812,714 812,714 812,714 812,714 812,714
Growth
-24.8% 263.9% 1.9% -3.5% 0.0% 0.0% 0.0% 0.0% 0.0%
Source: Team estimate
Beta
Unlevered beta 0.58
D/E ratio 68.2%
Tax rate 12%
Levered beta 0.77

Revenue from domestic has been not the key factor of revenue. In the past, this revenue decreased overtime. Based on historical data
and BOD’s point of view, revenue from domestic will be stable in the next years.
PART C: CAPITAL EXPENDITURE, DEPRECIATION AND
AMORTIZATION
NEW ASSETS 2019E 2020E 2021E 2022E 2023E
New Fixed Assets 392,881 725,000 725,000 725,000 725,000
Depreciation of Tangible Assets
New assets in 2015 12,311 24,622 24,622 24,622 24,622
New assets in 2016 22,718 45,436 45,436 45,436
New assets in 2017 22,718 45,436 45,436
New assets in 2018 22,718 45,436
New assets in 2019 22,718
Total Depreciation 12,311 47,340 92,777 138,213 183,649
Recently, the company officially started construction of Binh Phu High-tech Aquaculture Application Area of 600ha with investment
capital of VND 4,000 billion. Therefore, we reckon that ANV will spend a lot of expenditures on its manufacturing activity.
PART D: OWNERSHIP STRUCTURE
(As of 01/2019)
No Investor Name % Outstanding Number of shares
1 Doan (Toi) 46.33% 58,905,000.00 Chairman and CEO
2 Doan (Thanh Chi) 13.50% 17,160,000.00 Son of Doan Toi
3 Doan (Thien Chi) 13.50% 17,159,999.00 Son of Doan Toi
4 Nguyen (Huu Trong) 2.03% 2,585,630.00 Member of Supervisory Board
5 Nguyen (Nhut Duy) 0.41% 519,000.00 Vice General Director
6 Do (Nghiep Lap) 0.37% 469,000.00 Vice General Director
7 Mirae Asset Global Investments Co., Ltd.
0.04% 55,000.00
8 Le (Dung Tien) 0.02% 30,000.00 Chief accountant
9 Duong (Phong Minh) 0.02% 20,444.00 Chief of Supervisory Board
10 Doan (Hoi Quoc) 0.02% 20,000.00 Young sibling of Doan Toi
11 Tran (Canh Minh) 0.02% 20,000.00 Finance Director
12 Le (Huong Thi Lan) 0.01% 14,440.00
13 Le (Mai Thi Tuyet) 0.01% 7,500.00 Member of Supervisory Board
PART E: KEY EXCUTIVES
No Name Position Education Experience
1 Doan Toi Chairman of BOD, General Director
Bachelor of Laws 2006 -now: Chairman of the Board cum General Director of Nam Viet Joint Stock Company 2001 -2006: General Director of the Company Nam Viet Limited 1971 to 2001: Military officers
(Junior Colonel) retired.
2 Nguyen Duy Nhut Member of BOD, Vice General Director
Master of Economic 2006 - now: Member of BOD, Chief Financial Officer; 2004 - 2006: Finance Director; 2002 - 2004: Vice Director of An Giang State Treasury; 1989 - 2002: Head of An Giang State Treasury Department; 1983 - 1989: Officer of An Giang Department of Finance.
3 Do Lap Nghiep Member of BOD, Vice General Director
Master of Business Administration
2006 - now: Member of BOD, Production Director; 2004 - 2006: Production Manager; 2000 - 2004: Vice Director of Nam Viet Fishery Frozen Factory
4 Nguyen Van Vy Director of Aquaculture Division
Master of Business Administration
From 1999 - now: Director of Aquaculture Division
5 Tran Minh Canh Finance Director Bachelor of Business Administration
2010 - 2017: Finance Director; 2008 - 2010: Vice Director of Finance of Nam Viet
6 Huynh Thi Kim Thoa Chief Accountant Bachelor of Business Administration
From July 19, 2007, working at Nam Viet Company
7 Doan Chi Thanh Sale Director Bachelor of Information Technology at RMIT University Melbourne Campus
2006 - now: Member of the Board of Directors, Assistant of General Director; 2005 - 2006: Assistant of General Director of Nam Viet Company Limited
8 Doan Chi Thien 2012: Assistant to General Director
Bachelor of Business Administration
2012 -now : Assistant of General Director, Nam Viet Company
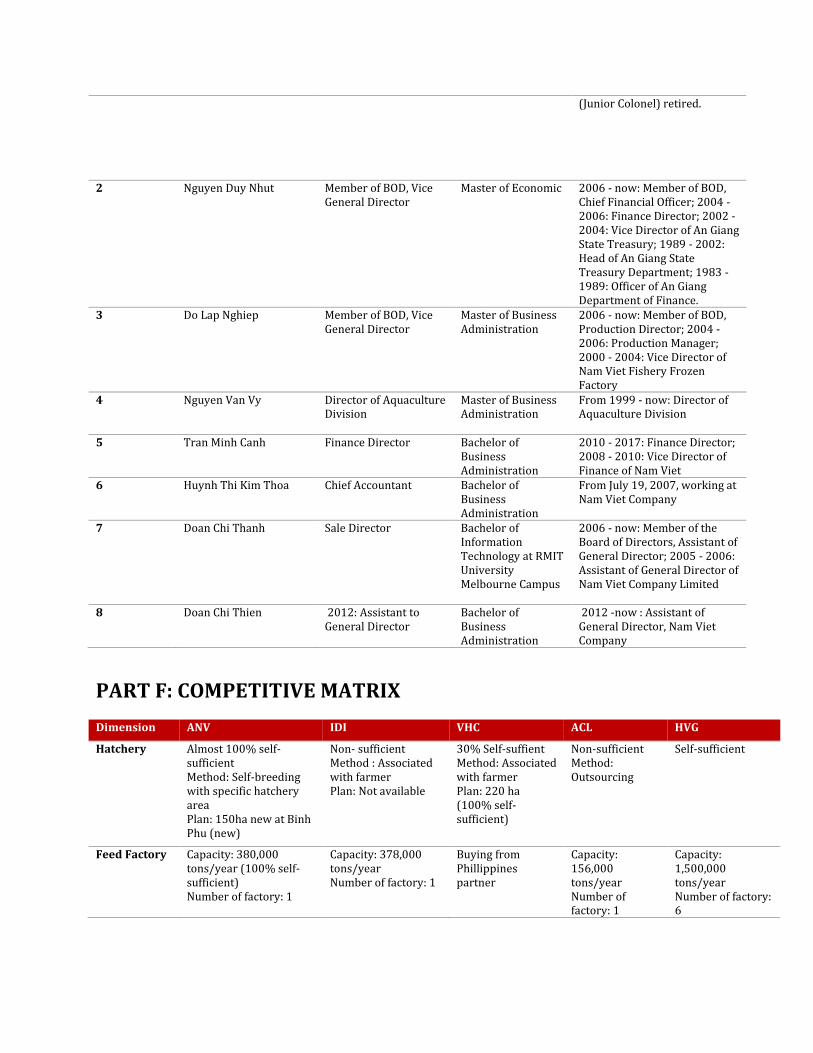
PART F: COMPETITIVE MATRIX
Dimension ANV IDI VHC ACL HVG
Hatchery Almost 100% self-sufficient Method: Self-breeding with specific hatchery area Plan: 150ha new at Binh Phu (new)
Non- sufficient Method : Associated with farmer Plan: Not available
30% Self-suffient Method: Associated with farmer Plan: 220 ha (100% self-sufficient)
Non-sufficient Method: Outsourcing
Self-sufficient
Feed Factory Capacity: 380,000 tons/year (100% self-sufficient) Number of factory: 1
Capacity: 378,000 tons/year Number of factory: 1
Buying from Phillippines partner
Capacity: 156,000 tons/year Number of factory: 1
Capacity: 1,500,000 tons/year Number of factory: 6

Farming Area Area: 330ha + 450 ha new(100% self-24,000 tons/month , 100% self-sufficient) Capacity: 120,000 tons/ years + 130,000 tons/year (new)
240 ha (40ha self-production; 200ha outsourcing) Capacity: 96,000 tons/year Plan: 350 ha
Area: 815ha, (530ha -65% self-production, 285ha- outsourcing) Capacity: 200,000 tons/year Plan: 230ha
Area: 120 ha (80% self-sufficient) Capacity: 36,000 tons/year
Area: 700ha Capacity: 120,000 tons/year (50% export)
Processing Factory
Max Capacity: 1,200 tons/day Current Capacity: 450 tons/day Number of factory: 4
Max Capacity: 450 tons/day Current Capacity: 450 tons/day Number of factory: 2
Max Capacity: 850 tons/day Current Capacity: 850 tons/day Number of factory: 6
Max Capacity: 250 tons/day
"Max Capacity: 1200 tons/day Current Capacity: 450 tons/day Number of factory: 11
PART G: Output Yield and Value of Pangasius Exports
2012 2013 2014 2015 2016 2017 2018
2019 (Est.)
Output yield (million tons)
1.19 1.15 1.16 1.05 1.19 1.23 1.42 1.51
Annual export (billion USD)
1.80 1.73 1.75 1.57 1.67 1.79 2.26 2.53
Source: VASEP
Part H: Top 5 Vietnamese Pangasius Exporting Companies (2010-
2017)
Million USD 2010 2011 2012 2013 2014 2015 2016 2017
VINH HOAN
126,4
VINH HOAN
150,7
VINH HOAN
154,9
VINH HOAN
166,2
VINH HOAN
207,4
VINH HOAN
227,6
VINH HOAN
251,2
VINH HOAN
270,3
HUNG
VUONG
100,9
HUNG
VUONG
123,5
HUNG
VUONG
111,9
AGIFISH
112,6
HUNG
VUONG
139,7
BIEN DONG
116,7
BIEN DONG
134,0
HUNG
VUONG
120,6
VIET AN
61,7
AGIFISH
84,0
AGIFISH
91,9
HUNG
VUONG
105,5
NAM VIET
109,8
HUNG
VUONG
95,7
HUNG
VUONG
102,2
BIEN DONG
114,2
AGIFISH
58,8
VIET AN
83,0
VIET AN
82,8
NAM VIET
86,7
AGIFISH
84,6
NAM VIET
93,1
GOLDEN
QUALITY
100,7
I.D.I
96,7
NAM VIET
58,2
NAM VIET
53,7
I.D.I
58,3
I.D.I
79,7
BIEN DONG
76
I.D.I
67,5
NAM VIET
80,2
NAM VIET
85,3
Source: VASEP

Part I: Nationalwide Major Fish Farming Area
Source: Company filings