daudin morys o'rourke chapter
TRANSCRIPT

8/3/2019 Daudin Morys O'Rourke Chapter
http://slidepdf.com/reader/full/daudin-morys-orourke-chapter 1/43
Globalization, 1870-1914
Guillaume Daudin
University of Edinburgh and OFCE
Matthias Morys
University of Oxford
Kevin H. O’Rourke
Trinity College Dublin
Preliminary draft, not for citation. Comments welcome, including suggestions as to where we can cut.
8/3/2019 Daudin Morys O'Rourke Chapter
http://slidepdf.com/reader/full/daudin-morys-orourke-chapter 2/43
1
Section 1. Measuring and explaining globalization
1.1. Introduction
The period from 1870 to 1914 represented the high water mark of 19th century globalization,
which as Chapter 4 in the previous volume showed had been developing since the end of the
Napoleonic Wars. This chapter will explore several dimensions of this globalization, as well as its
effects on the European economy. Since the topic is vast, our focus will be on the links between
Europe and the rest of the world, rather than on the growing integration of the European economy
itself, although that will be alluded to at several stages during the chapter.
Nineteenth century globalization involved increasing transfers of commodities, people, capitaland ideas between and within continents. There are several complementary ways to measure
increasing international economic integration. The most straightforward is simply to measure the
growing volume of these international flows, perhaps scaled by measures of economic activity more
generally: for example, the ratio of commodity trade to GDP, or the number of migrants per head of
population. A more direct measure of integration is provided by the cost of moving goods or factors
of production across borders, and this cost will show up in international price gaps. Because it is less
easy to measure integration in the international ‘markets’ for ideas and technology, these flows are
often not discussed in economists’ accounts of globalization, but they are sufficiently important that
they will be briefly considered here, problems of measurement notwithstanding.
Having documented the increasing integration of international markets in the late 19th century,
we then discuss some of the effects of this unprecedented globalization. Finally, we turn to the
question of how sustainable the relatively liberal 19th century world economy was: could globalization
have continued unabated after 1914, had World War I not intervened, or were there forces that would
have undermined open markets even had that cataclysm not occurred?
1.2. Trade, 1870-1914
Transport costs have long been seen as the main driver of trade growth during this period.
Steamships did not replace sailing ships, but they became more and more important, increasing in
regularity and speed. The opening of the Suez Canal in 1869 allowed their usage in Euro-Asian trade,
and implied a dramatic shift in favour of steam and against sail (since sailing ships could not be used
on the Canal route: see Fletcher 1958). Freight rates declined steadily, as a result of constant technical
improvements, while the reduction of internal transport costs through the development of railways
linked inland producers and consumers to ports, and hence to other countries and continents. Since
overland transport was much more expensive than water transport, such improvements were crucial
for the development of international as well as domestic markets. For example, based on Harley
(1980, 1990), we can divide the cost of transporting wheat from Chicago to Liverpool into the

8/3/2019 Daudin Morys O'Rourke Chapter
http://slidepdf.com/reader/full/daudin-morys-orourke-chapter 3/43
2
Chicago to New York City cost, and the New York to Liverpool cost. Between 1866 and 1870 the
former was equivalent to 17.2% of the Chicago wheat price, and the latter to just 11.6% of the
Chicago price. By 1909-13, these ‘freight factors’ had declined to 5.5% and 4.7% respectively
(Findlay and O’Rourke 2007, p. 382). Thus, the 18.6 percentage point decline in the Chicago-
Liverpool freight factor during this period can be decomposed into an 11.7 percentage point decline in
the Chicago to New York component, and a 6.9 percentage point decline in the trans-oceanic
component.
In addition, peace between the main powers between 1871 and 1914 promoted trade (Jacks
2006). The development of European formal and informal empires increased extra-European trade
through the reduction of trade barriers, the inclusion of colonies in currency unions, and the better
protection of (European) property rights (Mitchener and Weidenmier 2007). Meanwhile, the gradualspread of the gold standard dampened exchange rate fluctuations and reduced uncertainty in trade.
Recent econometric work clearly shows that the gold standard promoted trade between countries
participating in it: by up to 30%, according to López-Córdova and Meissner (2003) (for different
estimates, see also Estevadeordal et al. 2003 and Flandreau and Maurel 2005). The gradual spread of
the gold standard during the late 19th century was thus one of the factors underlying that period’s
trade boom. Whether international currency arrangements such as the Latin Monetary Union (LMU)
and Scandinavian Monetary Union (SMU) had an additional positive effect on trade is a matter of
controversy. López-Córdova and Meissner (2003) find that such monetary ‘unions’ did promote trade
between their members, but Estevadeordal et al. (2003) find no such effect. According to Flandreau
and Maurel (2005), the SMU boosted trade but the LMU one did not, and indeed Flandreau (2000)
argues that trade promotion was in any case not an aim of the LMU.
The major force operating in the opposite direction was trade policy, and in particular the
anti-globalization ‘backlash’ that will be discussed later in this chapter, which applied particularly to
trade in agricultural products. Notwithstanding this trend, intra-European and extra-European trade
grew rapidly during the 19th century. In most sectors, it reached a high point in 1913. European trade
roughly quadrupled in real terms between 1870 and 1913, with the increase being slightly higher in
Eastern than in Western Europe, albeit from a substantially smaller base (Maddison 2001, p. 362).
The export to GDP ratio of France, Germany and the United Kingdom (in 1990 prices) increased by
approximately 50 %, while the Spanish ratio more than doubled (ibid, p. 363). As shown in Figure
1.1.1, the geographical structure of European trade was fairly stable. Intra-European trade declined
slightly, from 71 % to 68 % of European trade. The share of trade with North America declined as
well, whereas the share of Africa more than doubled, presumably reflecting the incorporation of most
of that continent into European empires. This increased diversification of European exports continued
a trend that had started in the early 19 th century, although the United Kingdom was the only country
that exported more outside Europe than in Europe. (NB: If we knew total European nominal GDP, we
could compute an extra-European openness rate)

8/3/2019 Daudin Morys O'Rourke Chapter
http://slidepdf.com/reader/full/daudin-morys-orourke-chapter 4/43
3
Europe was a net exporter of manufactures and a net importer of primary products (Table
1.1). As can be seen, however, this masks important differences between regions. At one extreme lay
the United Kingdom, very heavily specialised in manufacturing and largely reliant on imported food
and raw materials. The rest of Northwestern Europe was similarly specialised, but in a much less
extreme fashion. The rest of Europe, however, still exported primary products and imported
manufactures, net. On the other hand, Eastern and Southern Europe were far more similar to North
America, another agricultural region beginning to industrialise, than to Oceania, Latin America or
Africa, which exported virtually no manufactured goods. Note also that this specialization dampened
somewhat over time, as European’s primary deficit and manufactured surplus rose more slowly than
total European trade. This was probably the result of the relative decline of European industrialization
rates compared with the rest of the world, especially the United States. European commodity tradewas in deficit throughout the period (Yates 1959). This must have been balanced by some net exports
of services, but these have not been estimated. To give an idea of their magnitude, the United
Kingdom surplus in business services trade averaged over $800 million during 1911-13, as compared
with a figure for total European exports of just under $11 billion in 1913 (Imlah 1952 and Maddison
2001).
Price convergence remains the best indicator of international commodity market integration.
It is well documented for this period, especially across the Atlantic. Liverpool wheat prices exceeded
Chicago prices by 57.6% in 1870 but by only 15.6% in 1913. London-Cincinnati price differentials
for bacon were 92.5% in 1870, over 100% in 1880, 92.3% in 1895, but 17.9% in 1913 (reflecting the
introduction of modern refrigeration technology relatively late in this period). Price gaps for
manufactured goods (which were initially dearer in the United States) were falling as well: from
13.7% in 1870 to -3.6% in 1913 for cotton textiles, from 75% to 20.6% for iron bars, from 85.2% to
19.3% for pig iron, and from 32.7% to -0.1% for copper (O’Rourke and Williamson 1994, p. 900).
Liverpool cotton prices exceeded Bombay prices by 57 % in 1870 and by only 20 % in 1913 (Collins
1996), and exceeded their Alexandria equivalents by 42.1% in 1824-1832, by 40.8% during 1863-
1867, but by just 5.3% during the last decade of the 19th century (Issawi 1966, pp.447-8). Similar
price convergence can be observed between London, Calcutta and Rangoon (Collins 1996).
Recent research, focussed on the international wheat market (e.g. Federico and Persson 2007,
Jacks 2005), has added greatly to our understanding of this phenomenon. First, a great deal of the total
price convergence experienced during this period was due to domestic market integration, driven by
railroads. Metzer (1974) has documented an impressive decline in grain price dispersion within
Russia after 1870, while Hurd (1975) and Williamson (1974, p.259) do the same for India and the
United States respectively. The implication is that studies looking at increasing integration between
port cities understate the convergence of the period.
Second, studies focussing on the Anglo-American comparison can overstate the price
convergence of the period, since elsewhere in Europe agricultural protection raised barriers to trade in

8/3/2019 Daudin Morys O'Rourke Chapter
http://slidepdf.com/reader/full/daudin-morys-orourke-chapter 5/43
4
grain and other commodities, beginning in the 1870s (Bairoch 1989, O’Rourke 1997). Thus, Federico
and Persson (2007) show that while prices converged among free trade countries during our period,
there was a substantial increase in price dispersion between free trade and protectionist countries, with
the result that overall price dispersion actually increased. Falling transport costs implied that potential
market integration was increasing during this period, but politicians always had the possibility of
muting or even reversing this via protectionist policies (O’Rourke 2002). Thus, it is not surprising that
authors such as Federico and Persson, and Jacks (2005), have recently started to point out that overall
commodity price convergence was if anything more impressive between 1830 or 1840 and 1870 than
in the more intensively studied 1870-1913 period (Volume 1, Chapter 4). Whether these findings can
be generalised to commodities other than grains is a matter for further research. In a rare example of a
study going beyond grains, Klovland (2005) confirms that protectionism seems to have disruptedAnglo-German price convergence for cereals, but that convergence continued after the 1880s for a
range of other commodities, which is consistent with the anti-trade backlash of the late 19 th century
being a disproportionately agricultural phenomenon, industrial protectionism notwithstanding.
1.3. Capital flows, 1870-1914
International capital market integration was also extremely impressive during this period.
Europe was the world’s banker (Feis 1930), and those regions with good access to European capital
such as the US, Canada, Argentina and Australia prospered most between 1870 and 1913. There was
also a smaller, but still important, transfer of capital from the Western European core to the more
peripheral economies of Central and Eastern Europe.
Before turning to some more precise measures of capital market integration, some simple
statistics may illustrate our main point. For the UK, by far the most important capital exporter,
Edelstein (2004, p. 193) estimates that 32% of net national wealth was held overseas in 1913. This
reflects four decades in which foreign investment as a percentage of (domestic) savings averaged
roughly one third, and often reached more than 50% in a given year (Table 1.2). As British savings
oscillated between 10% and 14% of GDP, the UK committed, on average, some 4% of its GDP to
capital formation abroad over a period of more than 40 years, an unprecedented phenomenon.
France and Germany exported less capital than England, and their capital accumulation
abroad remains less impressive even when accounting for differences in GDP levels. What matters
more in our context is the extent to which Europe as a whole dominated foreign investment. In 1914,
England (42%), France (20%) and Germany (13%) combined accounted for 75% of total foreign
investment. Half of the remaining 25% was held by Belgium, the Netherlands, and Switzerland, the
other European countries with sizeable amounts of capital invested abroad (Maddison 1995: 65).
Another way of appreciating Europe’s role as the world’s banker is to look at the percentage of
foreign-owned capital stock in capital importing countries. In the case of Argentina, for instance,
Taylor (1992) estimated that 50% of the 1913 capital stock was owned by foreigners, most of whom

8/3/2019 Daudin Morys O'Rourke Chapter
http://slidepdf.com/reader/full/daudin-morys-orourke-chapter 6/43
5
were Europeans.
What form did the foreign investment take and what was it used for? Roughly three quarters
of European investment before World War I was portfolio investment, i.e. investment in bonds and
shares rather than foreign direct investment (FDI) (Edelstein 2004, p. 195). This is very different from
today’s era of FDI-dominated global capital markets and requires an explanation. Informational
asymmetries were certainly greater a hundred years ago than today, and increased the agency
problems associated with many types of investment. This is the key factor for Bordo, Eichengreen and
Irwin (1999) in explaining the composition of overseas investment then as opposed to now. Debt is
less risky for investors than equity, and thus a more uncertain environment led to more bond
purchases and fewer direct investments. Informational problems also explain the sectoral composition
of investment. The lion’s share of portfolio investment was used for government bonds and railway bonds (UK: 35% + 22% of total portfolio investment; Germany: 49% + 33% of total portfolio
investment)1, with most of the remainder going into extractive industries and social overhead projects
other than railways (such as public utilities, urban infrastructure and transport etc.). As Bordo et al.
point out, it was easier to monitor a railway company (since the key numbers involved, miles of track
laid and passengers and goods carried, were easily available) than manufacturing or commercial
firms. It was also presumably relatively easy to gather information about the trustworthiness and
expenditure and revenue patterns of a foreign government. Furthermore, given that the most pressing
need was for transportation and social infrastructure, it may have been inevitable that portfolio
investment dominated FDI by such a wide margin, since such investments have probably always lent
themselves better to portfolio investment. Finally, while as we will see later the first modern
multinationals began to make their appearance during this period, the intangible assets which
ultimately motivate such investments (e.g. proprietorial knowledge, brand-names, and so on) were
probably less important then than now (Caves 1996).
What kinds of evidence can we muster to compare the integration of global capital markets
over time? There are at least three that have been used in the literature, and all tell the same story:
capital market integration has traced out a U-shape over the past 150 years (Obstfeld and Taylor
2004). Capital markets became more integrated during the late 19th century; they disintegrated after
1914; and they recovered those losses during the last two or three decades of the 20 th century.
The first measure simply looks at the sizes of the capital flows involved. According to
Obstfeld and Taylor (2004, p. 55), foreign assets accounted for 7% of world GDP in 1870, but for
nearly 20% during 1900-14, which represents impressive integration. There followed a period of
disintegration: the figure was only 8% in 1930, just 5% in 1945, and still only 6% in 1960. However,
it then shot up to 25% in 1980, 49% in 1990, and 92% in 2000. On this measure it was not until some
time in the 1970s that the pre-1914 level of integration was recouped. These figures represent stocks
of foreign assets, but Obstfeld and Taylor also present evidence on the flow of net foreign investment,
1 Stone 1999, p. 403 (Table 54); Esteves 2007, p. 34 (Table 4).

8/3/2019 Daudin Morys O'Rourke Chapter
http://slidepdf.com/reader/full/daudin-morys-orourke-chapter 7/43
6
as measured by the absolute value of the current account, scaled by GDP. Again, the U-shaped pattern
emerges from the data, with the difference that on this measure pre-1914 levels of capital flows have
not yet been recouped. The stock and flow data may in part yield different results because while the
former is gross, the latter is net, and the extent of two-way flows of short-term investments between
markets is one feature of today’s capital markets that is completely unprecedented.
The second approach looks at price convergence. As capital market integration progresses,
price gaps – bonds spreads in the language of financial markets – should decline to the point where
they reflect only differences in risk between the assets under consideration. Several studies2 have
shown that bond spreads between peripheral economies, be they in Europe or not, and the North-
Western European core countries of England, France, and Germany fell, on average, from some 5%
on 1870 to only 1% on 1914 (Figure 1.2), less than today (Mauro, Sussman and Yafeh 2002). Evenmore compelling evidence of integration emerges if price gaps between identical assets decline. For
example, Garbade and Silber (1979) show that trans-Atlantic price spreads on US ‘5-20’ bonds fell
immediately after the introduction of the trans-Atlantic telegraph in 1866. Obstfeld and Taylor (2004,
pp. 89-91) find that US-UK interest rate differentials were “small and steady” before World War I,
widened during the two World Wars and the interwar period, and narrowed during the 1980s and
1990s, consistent with the U-shaped pattern mentioned earlier.
The third approach uses quantity data and was first suggested by Feldstein and Horioka
(1980). International capital mobility breaks the link between domestic savings and domestic
investment, as domestic savings can be invested abroad and foreign capital can go into domestic
investment. Consequently, the weaker the relationship between domestic savings and domestic
investment, the higher is international capital mobility. Figure 1.2 shows one of the many
implementations of Feldstein and Horioka’s basic idea, and it confirms the existence of a U-shaped
pattern of integration, disintegration and reintegration.
All three indicators of global financial integration show that capital market integration
increased substantially between 1870 and 1914, but that this was not a continuous process. As is true
today, there were reversals which potentially subjected capital-receiving countries to ‘sudden stops’
(Calvo 1998). A first wave of financial integration came to an end with the Baring crisis of 1891.
Capital receded dramatically for roughly a decade before massive foreign lending resumed again
around the turn of the century. Financial integration was at its peak immediately before the outbreak
of World War I.
What explains late 19th century capital market integration and what accounts best for the size
and the direction of capital flows? Some of the reasons suggested by economic historians are more
controversial than others, while confusion among competing theories is increased by the fact that
some studies are concerned with accounting for bond spreads, while others attempt to explain the
sizes and direction of flows. Without doing too much injustice to a large body of literature, we can
2 E.g. Flandreau and Zumer (2004), Mauro, Sussman, and Yafeh (2002).

8/3/2019 Daudin Morys O'Rourke Chapter
http://slidepdf.com/reader/full/daudin-morys-orourke-chapter 8/43
7
distinguish between political, institutional and more purely economic explanations for late 19th
century capital market integration.
To begin without the risk of controversy: everyone agrees that the absence of military conflict
among the main lending countries – England, France, Germany, the US, Netherlands, Belgium and
Switzerland – between the Franco-Prussian War and World War I helped to create and stabilise an
atmosphere conducive to foreign lending. The second political explanation, by contrast, has been
highly controversial. Marxists have long argued that late 19 th century capital exports and imperialism
are only two sides of the same coin. The argument runs as follows: excessive saving at home,
generated by a highly unequal distribution of income, required outlets in underdeveloped countries, as
domestic investment would have been subject to Marx’s law of the falling rate of profit. This idea
pioneered by J.A. Hobson, allowed Lenin to declare imperialism to be the highest stage of capitalism.The contention of a connection between empire and capital exports was subsequently discredited 3,
only to be resuscitated recently. In a twist to the historiography, the almost forgotten Marxist theory
of a connection between empire and capital exports has been revived, but this time by revisionist
historians arguing for a more benign interpretation of imperialism. For example, Ferguson and
Schularick (2006) argue that members of the British Empire benefited from their colonial status
through substantially reduced interest rates, presumably as a result of more secure property rights.
Table 1.3 shows the destinations of English, French and German capital exports. It certainly
raises doubts about whether colonial affiliation truly mattered for the size and the direction of capital
flows. All English colonies combined (excluding Canada, Australia and New Zealand) received a
paltry 16.9% of English capital exports, which is less than what the US alone received (20.5%). The
French and German experiences suggest the same, with colonies receiving only 8.9% and 2.6%,
respectively, of the overall capital exports of their respective mother countries.
Turning to economic institutions and policies, a great deal of attention has been devoted to the
gold standard (Bordo and Kydland 1995, Bordo and Rockoff 1996) and, more recently, to sound
fiscal policies (Flandreau and Zumer 2004). Adherence to gold is seen as having promoted global
financial integration in two ways. First, it eliminated exchange-rate risk. Second, it signalled that the
government concerned would pursue conservative fiscal and monetary policies, which assured
potential investors that returns were reasonably safe.
While there has been much debate about whether it was gold standard adherence per se or
sound fiscal policy that mattered more, proponents of both positions probably agree that economic
institutions and policies can only facilitate capital imports, but never attract them if there is no
genuine interest on the part of investors in what a specific country has to offer. This brings us to
economic fundamentals as the main determinant in explaining the size and direction of flows.
What explains the fact that more than 50% of British capital exports went to areas of recent
settlement? British foreign investment headed mainly for regions where natural resources could be
3 Among others, in a detailed econometric study by Obstfeld and Taylor (2003).

8/3/2019 Daudin Morys O'Rourke Chapter
http://slidepdf.com/reader/full/daudin-morys-orourke-chapter 9/43
8
exploited, not necessarily where labour was cheap (as would have been the case in Africa and Asia).
Investment demand in the areas of recent settlement was high due to capital (and labour) requirements
associated with frontier expansion. If New World land was to produce food for European consumers,
and raw materials for factories, railways had to make it accessible, land had to be improved, and
housing and infrastructure had to be provided for the new frontier communities.
This explanation for the direction of capital flows between 1870 and 1914 certainly matches
nicely the data on British capital exports (Table 1.3). Clemens and Williamson (2004a) provide
econometric evidence in favour of this view, showing that British capital exports went to countries
with abundant supplies of natural resources, immigrants, and young, educated, urban populations.
They also find that gold standard adherence and membership of the British Empire helped attract
capital inflows, ceteris paribus, but these two variables mattered far less in explaining capital flowsthan did endowments, despite all the ink that has been spilt on discussing them. Supply and demand
imbalances across countries, rather than the presence or absence of frictions leading to price gaps
between markets, were what was really crucial. Clemens and Williamson did not have the data to
provide a similar analysis for French and German capital exports, however, and this is unfortunate
since the French and the German cases were somewhat different. While foreign investment into
Africa and Asia was rather unpopular in all three countries, France and Germany sent 61.1% and
53.3%, respectively, of their capital exports to other European countries. Investment into areas of
recent settlement, by contrast, played a substantially reduced role for both countries. According to a
recent paper by Esteves (2007), however, economic fundamentals were as important for German
investors as they were for British ones during this period.
1.4. Migration, 1870-1914
It is in the area of migration that the late 19 th century was most impressively globalized, even
compared with today. At the beginning of the century, intercontinental migration was still dominated
by slavery: during the 1820s, free immigration into the Americas averaged only 15,380 per annum,
about a quarter of the annual slave inflow. Twenty years later, the free inflow was more than four
times as high as the slave flow, at 178,530 per annum (Chiswick and Hatton 2003, p.68), and the
numbers rose to more than a million per annum after 1900 (Figure 1.3), with Italians and Eastern
Europeans adding to the traditional outflow from northwest Europe. Some of the country-specific
migration rates were enormous (Table 1.4): during the 1880s, the decadal emigration rate per
thousand was 141.7 in Ireland, and 95.2 in Norway, while an emigration rate of 107.7 per thousand
was recorded in Italy in the first decade of the 20th
century. There were also significant migrations
within Europe, for example from Italy to France, and from Ireland to Britain. The average Western
European annual outmigration rate was 2.2 per thousand in the 1870s and 5.4 per thousand for the
1900s, very large numbers that are, for example, far in excess of any reasonable projections of African
emigration between now and 2030 (Hatton and Williamson 2005, p. 261).

8/3/2019 Daudin Morys O'Rourke Chapter
http://slidepdf.com/reader/full/daudin-morys-orourke-chapter 10/43
9
The causes of this mass migration are by now well understood, thanks in particular to the
work of Hatton and Williamson (1998, 2005). On one level, the causes are obvious: the New World
was endowed with a higher land-labour ratio than Europe, and hence American and Australian
workers earned higher wages than their European counterparts. For example, British real wages in
1870 were less than 60% of wages in the New World destinations relevant to British workers, whereas
the equivalent figure for Irish workers was just 44%, and for Norwegian workers was just 26%
(Hatton and Williamson 2005, p. 55). The gains from migration were thus potentially enormous, and
once the new steam technologies had lowered the cost of travel sufficiently, mass emigration became
inevitable. This was particularly so since 19th
century immigration policy was relatively liberal,
notwithstanding the policy developments which we will note later on.
On another level, there is the issue of what determined the timing of emigration streams fromdifferent European countries: why did emigration from relatively rich countries such as Britain take
off before emigration from poorer countries such as Italy, where the gains to migrants were
presumably higher? What explains the fact that so few Frenchmen and women emigrated, while so
many Irish and Italians left? What explains the initial rise, and subsequent decline, of emigration rates
in several countries, documented in Table 1.4? Hatton and Williamson provide a simple econometric
explanation for all these questions, which can be represented in Figure 1.4. EM is a downward-
sloping function relating emigration rates from a given European economy to home wage rates: as
home wages rise, emigration rates should fall, ceteris paribus. The initial rise in emigration rates
experienced in the typical economy (say from e0 to e1) must then have been due to rightward shifts in
the emigration function, from EM to EM’, since wages were rising (say from W0 to W1), not falling,
in late 19th century Europe. In turn, such rightward shifts were caused by a variety of factors. First,
would-be emigrants were initially constrained by the cost of trans-oceanic transport, but as transport
costs fell, more migrants were able to leave their homelands. Second, these poverty traps could also
be overcome by previous emigrants sending home remittances or pre-paid tickets, thus directly
financing the cost of travel. This meant that emigration rates tended to increase as countries built up
stocks of emigrants overseas, the so-called friend and relatives effect . Third, as Chapter 5 indicates,
fertility rates were on the rise throughout Europe during this period, leading to an increase in the
supply of young, mobile adults. And finally, it has often been argued that the industrialisation
documented in Chapter 3 led to workers being detached from the land, again increasing their mobility.
Rising fertility, structural transformation and falling transport costs thus increased emigration
rates, initially in the richer economies whose workers could best afford the cost of transport, and then
in poorer economies as living standards rose across the continent. This emigration was initially self-
reinforcing, as a result of the friends and relatives effect: all these factors led to EM shifting
rightwards. But eventually, the emigration function stabilised, and when this happened, emigration
became self-limiting: by lowering labour supply at home, it pushed up real wages (say from W1 to
W2), and economies thus moved up their EM schedules, experiencing lower emigration rates (e2).

8/3/2019 Daudin Morys O'Rourke Chapter
http://slidepdf.com/reader/full/daudin-morys-orourke-chapter 11/43
10
Hatton and Williamson show that low French and high Irish emigration rates can be explained without
appealing to weird cultural behaviour in either country, since this one-size-fits-all European model fits
most countries perfectly satisfactorily. Thus, high Irish emigration rates can be explained by the
Famine of the 1840s, which created a large Irish migrant stock in the New World, while low French
rates can be explained by such factors as a precocious fertility transition. Economic rationality turns
out to do a pretty good job of explaining European emigration during this period.
1.5. Trade in knowledge, 1870-1914
Globalization is not simply about the movement of goods or factors of production. It also
includes technological transfers and the deepening of other intellectual exchanges.
Technology circulated relatively freely in the late 19
th
century. In Europe and in the Atlanticworld, despite laws forbidding the emigration of skilled workers (repealed in the United Kingdom in
1825) and machinery exports (repealed in the United Kingdom in 1842), technologies had been
circulating for a long time. Textile mills around the world used similar machines, often imported from
Britain (Clark 1987, p. 160). Ship building, iron and steel, telegraph and telephone technologies
transferred quickly, unless slowed by adaptation issues. Europe was internally exchanging new
technologies, diffusing them – both to European offshoots and to the rest of the world –and receiving
new technologies, mainly from the United States. Japan was an especially keen learner (Jeremy 1991).
Several new factors increased the speed and the reach of technological transfers. Migration
was easier. Imperialism allowed European entrepreneurs to invest overseas, taking advantage of low
wages, with no fear of expropriation by hostile governments. The decline in transport and
communication costs helped the diffusion of ideas, new goods and machines. This last effect was
especially important because more and more technology was embedded in machines rather than in
individual know-how, even if training was still necessary. Firms could now export capital goods on a
large scale. For example, Platt, a Lancashire firm, exported at least 50 % of their cotton spinning
machines between 1845 and 1870 (Clark and Feenstra 2003). Explicit policies aiming at import
substitution encouraged domestic technological emulation with mixed success. Japan was able to
replace its English suppliers of textile machinery, but France had difficulties in replacing its American
telephone suppliers, and had to postpone the diffusion of this important good.
To circumvent these restrictions and better protect their intellectual property, several firms set
up production in foreign countries and transformed themselves into multinationals during this period.
Sometimes, the motive was to produce inside protected markets: for example, by 1911 International
Harvester was producing harvesting machines in France, Germany, Russia and Sweden as a result of
those countries’ protectionist policies (Wilkins 1970, pp. 102-3). Ericsson, a Swedish firm, and
Western Electrics, an American firm, both had to establish overseas branch plants in order to win
telephone contracts in various European countries (Foreman-Peck 1991). Sometimes direct foreign
investment arose simply because, as the theory of the firm predicts, it proved difficult or impossible to

8/3/2019 Daudin Morys O'Rourke Chapter
http://slidepdf.com/reader/full/daudin-morys-orourke-chapter 12/43
11
transfer intangible assets such as new technologies abroad at ‘arms length’, via the market: thus,
Singer’s attempts to profit from its invention of the sewing machine to a French merchant proved a
complete disaster, the latter refusing to pay what he owed, or even disclose how many sewing
machines he was producing (ibid ., pp. 38-9).
The diffusion of technologies was also helped by the creation of international scientific and
technical organizations. The Institution of Naval Architects was founded in 1860 in the United
Kingdom, but organized meetings in different countries and through its membership created an
international network of professional and learned bodies (Ville 1991). The number of international
scientific conferences and organizations increased dramatically (Error! Reference source not found.
1.5). Paradoxically however, at the same time science was seen as one of the weapons in the struggle
between European nations. Besides straightforward military applications, academic activity was useda diplomatic weapon. Inviting foreign scientists and participating in scientific congress was part and
parcel of the rivalry between France and Germany, as each hoped to tighten their links with allied and
neutral countries, especially the United States (Charle 1994, ch. 8).
Governments increased formal technical cooperation. The International Telegraph Union was
founded in 1865 and the Universal Postal Union in 1874. Humanitarian cooperation was expanded as
well: the Red Cross was founded in 1863 and the first Geneva Convention signed in 1864. Most
sovereign states, both European and non-European, joined these global institutions. Another form of
rising globalization was the diffusion of popular forms of international exchanges and competitions.
The World Fairs were official showcases for the technical prowess of each nation. The 1876 World
Fair in Philadelphia was the first not to take place in Europe, and included official exhibitions from
Japan and China. The first Venice Biennale took place in 1895. The first modern Olympics took place
in 1896. The first five Nobel prizes were awarded in 1901 (English 2005).
Labour movements were increasingly globalized as well. Socialist ideals rejected nationalism
and advocated the international defence of the interests of labour. The first international was founded
in 1864 and the second in 1889, the latter having Japanese and Turkish members. The significance of
these events is difficult to assess. International, especially pan-European, scientific and cultural
cooperation between individuals had existed for a long time. De facto agreements about the rules of
war and the management of public goods – e.g. the high seas – pre-dated the first globalization. To
some extent, the heyday of elite cultural globalization was before 1870. The issue of nationalist
cultural identity gained in importance in the second half of the 19 th century, leading to the
fragmentation of cultural activities as they become more popular. The formalization of cultural and
scientific discourse can be seen both as a weak attempt to stem the rise of nationalism, and as a way to
accommodate the inclusion of more diverse actors into the high spheres of European society and
culture. In the end, of course, it was too fragile to stand against the forces of nationalism.
Section 2. The effects of late 19th
century globalization

8/3/2019 Daudin Morys O'Rourke Chapter
http://slidepdf.com/reader/full/daudin-morys-orourke-chapter 13/43
12
2.1. Globalization and factor price convergence
As we have seen, the late 19 th century was characterised by dramatically declining transport
costs and booming commodity trade; by mass migration from the Old World to the New; and by large
transfers of capital from the Old World to the New. How did each of these separate dimensions of
globalization influence income distribution within and between countries?
Let us begin with the within-country evidence. According to Heckscher-Ohlin logic, the land-
abundant New World should have exchanged food and raw materials for European manufactured
goods, and trade should have led to the wage-rental ratio, w/r , converging internationally. In land-
abundant and labour-scarce New World economies, where w/r was high, w/r should have declined, as
farmers found new overseas outlets for their output, and manufacturing suffered from foreigncompetition. In land-scarce European economies, where w/r was low, it should have increased, as
workers were hired by expanding manufacturing industries, and land rents were undermined by
imports of cheap food. Furthermore, trade should have led to absolute factor price convergence, with
cheap European wages catching up on high New World wages, and expensive European land falling
in price relative to cheap New World land.
By and large, these predictions hold good for the late 19th
century (O’Rourke, Taylor and
Williamson 1996, O’Rourke and Williamson 1999, Williamson 2002a). Between 1870 and 1910, real
land prices fell in countries such as Britain, France and Sweden -- in Britain by over 50% -- while
land prices soared in the New World. There was certainly absolute convergence in the returns to land
during this period. Furthermore, the 40 years after 1870 saw substantial relative factor price
convergence, with wage-rental ratios rising in Europe, and falling in the New World (Williamson
2002a, Table 4, p. 74). In Europe, the British ratio increased by 1910 to 2.7 times its 1870 level; the
Irish ratio increased by a factor of 5.6, the Swedish ratio by a factor of 2.6, and the Danish ratio by a
factor of 3.1. The increase was less pronounced in protectionist economies: the ratio increased by a
factor of 2.0 in France, 1.4 in Germany, and not at all in Spain. This suggests a link between trade and
factor price trends, which is confirmed by both econometric evidence and CGE simulations
(O’Rourke and Williamson 1994; O’Rourke, Taylor and Williamson 1996). In turn, these wage-rental
ratio trends implied that the European income distribution was becoming more equal, since
landowners were typically better off than unskilled workers.
In addition to these Heckscher-Ohlin predictions, there was a more mundane reason why
declining transport costs were good for European workers. In an era where a large fraction of a
labourer’s budget was still spent on food, cheaper transport meant cheaper food, and thus higher real
wages. What was bad for farmers was directly beneficial to urban workers, then as now, and this
explains why, by and large, socialist parties tended to support free trade in Europe at this time. Britain
was a country where workers could be expected to particularly benefit from free trade: not only did it
lower the price of food, but any negative impact on agricultural labour demand would have only a

8/3/2019 Daudin Morys O'Rourke Chapter
http://slidepdf.com/reader/full/daudin-morys-orourke-chapter 14/43
13
small effect on the overall labour market, given agriculture’s small share in overall employment there
(just 22.6% in 1871). Thus, O’Rourke and Williamson (1994) estimate that British real wages rose by
43% between 1870 and 1913, and that no fewer than twenty percentage points of this increase can be
directly attributed to declining transport costs. On the other hand, in more agricultural economies the
net impact of cheap grain on wages could have been negative, if it sufficiently depressed agricultural
employment and wages (O’Rourke 1997).
While trade had a profound impact on land rents and relative factor prices, migration was the
dimension of globalization that probably had the greatest impact on European workers’ living
standards during this period. Emigration due to poverty can be a source of great sadness for the
families and communities left behind. It can be difficult therefore for people to admit that emigration
may in fact have been hugely beneficial for peripheral and impoverished economies, and yet this is precisely what basic economic theory would suggest: lower the supply of labour, and its price should
rise.
Figure 1.6 shows the (PPP-adjusted) wages of unskilled male urban workers in three countries
of mass emigration, Ireland, Italy and Norway. Between 1870 and 1910, emigration lowered the Irish
labour force by 45%, the Italian labour force by 39%, and the Norwegian labour force by 24%
(O’Rourke and Williamson 1999, Table 8.1). The wages are measured relative to wages in the leading
European economy of the day, Britain. The figure shows that living standards in these three
economies did not just rise during the late 19th
century: they rose more rapidly than in Britain. In
Ireland, for example, real wages rose from 73% to 92% of British wages during this period, while
Norwegian wages rose from 48% to 95%. This represents impressive convergence. In Italy there was
no convergence until the turn of the century, which is exactly when Italian emigration rates exploded,
attaining levels of over 100 per thousand per decade; thereafter, real Italian wages rose from 40% of
British wages in 1900, to 56% in 1913. Figure 1.7 repeats the exercise, this time reporting the three
countries’ wages relative to wages in the US. The figure shows that Norwegian wages continually
converged on US wages, while Italian wages converged after 1900; Irish wages converged over the
period as a whole, although very rapid US growth in the final two decades of the period implied Irish
divergence after 1895 or so.
Clearly, living standards in these peripheral emigrant economies rose very rapidly in the late
19th century, more rapidly even than in core economies like Britain and the US. At a minimum,
emigration did not prevent convergence; more positively, econometric and simulation studies show
that emigration was an important source of living standard convergence for countries such as Ireland.
To what extent can these findings be generalised? Taylor and Williamson (1997) calculate the labour
market impact of migration in 17 Atlantic economy countries between 1870 and 1910, taking care to
take account of return migration rates, which varied from country to country. According to their
analysis, which makes use of econometrically estimated labour demand elasticities and information on
labour’s share of income, emigration raised Irish wages by 32%, Italian by 28% and Norwegian by

8/3/2019 Daudin Morys O'Rourke Chapter
http://slidepdf.com/reader/full/daudin-morys-orourke-chapter 15/43
14
10%. International real wage dispersion fell by 28% between 1870 and 1910, reflecting a convergence
of poorer countries on the rich, but in the absence of the mass migrations international real wage
dispersion would have increased by 7%. Wage gaps between New World and Old in fact declined
from 108 to 85% during the period, but in the absence of the mass migrations they would have risen
to 128% in 1910. The results suggest that more than all (125%) of the real wage convergence between
1870 and 1910 was attributable to migration. Even when allowance is made for the possibility that
capital may have chased labour, lowering the impact of migration on capital-labour ratios, migration
emerges as a major determinant of living standards convergence, explaining about 70% of the
convergence. Mass migration accounted for all of Ireland’s and Italy’s convergence on the United
States, and for 65-87% of their convergence on Britain. The biggest lesson of 19 th century migration
history is that emigration is of major benefit to poor economies (a point stressed by Williamson2002b).
2.2. Capital flows and peripheral development
Assuming identical production functions with capital and labour as the only inputs, lower
wages in the European periphery should have been due to lower capital-to-labour ratios, which in turn
should have implied higher returns to capital. Did the European periphery attract capital imports as
this logic suggests, and, if so, did these capital imports have the desired effect of raising the capital-to-
labour ratio and hence wages?
We shall start with Sweden, one of the few cases for which we have relatively reliable data.
Capital imports after 1870 served to make the Swedish capital stock 50% bigger than it would have
been in their absence. It has been estimated that these capital flows increased Swedish real wages by
25% (O’Rourke and Williamson 1999). Sweden may have been the European country that benefited
most from capital imports before World War I. Denmark and Norway also benefited, albeit on a
reduced scale as capital imports there were substantially smaller.
Results for the Scandinavian countries cannot be easily replicated for other countries in the
European periphery, as a result of poor or contradictory data. This may be illustrated with reference to
Austria-Hungary, by far the largest peripheral economy in pre-1914 Europe bar Russia. Looking from
the “outside”, i.e. considering the foreign investment of the European core countries to Austria-
Hungary, the dual monarchy seems to have enjoyed substantial capital imports (Table 1.3). A recent
reconstruction of the Austro-Hungarian balance-of-payments, by contrast, concluded that, over the
period 1880-1913, Austria-Hungary exported rather than imported capital (Morys 2006). Similar
uncertainty surrounds the Italian, the Spanish and the Portuguese cases, while there are indications
that Ireland, another peripheral economy, also exported capital after 1870.
Even if some of the peripheral economies might turn out on closer examination to have
imported capital, the general question remains: Why was the European periphery not able to attract
more capital from the European core? This is the 19th century equivalent to what has become known

8/3/2019 Daudin Morys O'Rourke Chapter
http://slidepdf.com/reader/full/daudin-morys-orourke-chapter 16/43
15
as the Lucas paradox: capital usually flows to rich rather than to poor countries today, despite the fact
that wages are lower in poor countries (Lucas 1990). Three explanations have been offered to explain
the Lucas paradox for late 19th century Europe. First, lower labour productivity in the periphery can
potentially explain why capital did not flow to the poorer European countries (Clark 1987). However,
such an answer only begs the question as to why labour productivity was lower in the European
periphery. Second, non-adherence to gold might have dissuaded foreign investors. In support of the
latter theory it is worth pointing out that the Scandinavian countries had the best record of adherence
to gold among the peripheral economies. And finally, as the earlier discussion of British capital
exports suggests, it may simply be that these countries were not as attractive to investors as the land-
abundant territories of the New World.
2.3. Capital exports and core welfare
We now turn to the capital exporting core countries and ask what were the effects of capital
flows on welfare levels there. Superficially, the answer seems straightforward. As investors preferred
foreign investment opportunities to domestic ones based on their relative profitability, capital exports
should have been beneficial to the core countries, lowering GDP but raising GNP. However, others
have argued that channelling funds abroad could have harmed the domestic economy. This is exactly
the charge that the 1931 Macmillan Report leveled against British capital exports before World War I.
It argued that the City of London systematically discriminated against domestic borrowers, preferring
instead to channel funds into overseas ventures. British industry, starved of capital, grew more slowly
than it would otherwise have done. In other words, to the long debated question as to why late
Victorian Britain failed (as measured by its growth performance relative to the US and Germany, its
main economic rivals at the time) another debate was added: Did late Victorian capital markets fail?
In a monumental study, Edelstein (1987) showed that overseas portfolio investments yielded a
higher realized return than domestic portfolio investment during 1870 – 1913. This result was true
even when adjusting for risk. While this finding “cleared” late Victorian capital markets of any
wrongdoing, the question still lingered as to whether Britain could have done better by retaining more
savings in the domestic economy, for example by imposing a tax on capital exports as suggested by
Temin (1987). But here one has to question what were the real constraints facing the late Victorian
British economy. Research has shown that entrepreneurs had strong internal sources of funding and
easy access to local, provincial financing (as opposed to the London Stock Exchange). Rather, what
was missing was the highly skilled workforce required to take full advantage of the opportunities
offered by the Second Industrial Revolution. Restrictions on overseas capital exports almost certainly
would not have been the best way to encourage domestic, scientifically based industry; publicly
supported general and technical education and, more controversially, tariffs might have been.
The debate on the alleged trade-off between capital exports and domestic industry has also
frequently neglected the positive externalities of European overseas investments benefiting European

8/3/2019 Daudin Morys O'Rourke Chapter
http://slidepdf.com/reader/full/daudin-morys-orourke-chapter 17/43
16
consumers. Since much of the investment went into the construction of railways and other social
overhead projects, it implied cheaper imports of food stuff and raw materials, which represented a
major contribution to European core welfare.
2.4. Imperialism and European welfare
In 1880, European colonies (not including any part of Russia) ranged over 24.5 million
square kilometres and had 312 millions inhabitants. In 1913, they ranged over 52.5 square kilometres,
more than a third of the earth’s land surface, and had 525 millions inhabitants. The United Kingdom,
France, the Netherlands, Spain and Portugal had been colonial powers for a long time. Belgium,
Germany and Italy now joined them. The United Kingdom controlled more than 80% of these
colonized territories in 1880, and still more than 60% in 1913 (Etemad 2006).As noted earlier, Lenin, inspired by Hobson and others, suggested that the mature European
economic system could only be sustained through imperialism. These arguments have been
discredited. Capital exports to colonies were important, but not dominant. Europe was self-sufficient
in coal and nearly self-sufficient in iron ore and other minerals. Textile raw materials were more of an
issue as cotton, for example, could not be produced in Europe in great quantities; but it was largely
supplied by the United States. Colonial empires did not represent vital outlets for European goods
either, absorbing less than 15% of all Western European exports (Bairoch 1993).
Yet, it is true that one of the driving forces behind imperialism was the influence of European
traders, who saw in political control a way to facilitate their economic exchanges with African and
Asian producers and consumers. Some industrialists also believed that the creation of a reserved
market would be a suitable answer to international competition, and they managed to convince certain
politicians, like Joseph Chamberlain (British Colonial Secretary from 1895 to 1903), Jules Ferry
(French Prime Minister from 1880 to 1881 and from 1883 to 1885) and Francesco Crispi (Italian
Prime Minister from 1887 to 1891 and from 1893 to 1896).
It is not certain that empires represented a net benefit for the European powers. The debate
has been centred on the British Empire as it was by far the largest, and was the only empire
controlling economically advanced settler colonies. According to Davis and Huttenback (1986, p.
107), private British investment in the empire after 1880 yielded higher returns than did investment in
the domestic economy, but smaller returns than investments in foreign countries. The direct cost of
empires was limited, as the United Kingdom, like the other colonizers, tried to have its colonies pay
for themselves and provided mainly disaster relief, funds for military campaigns, and shipping and
cable subsidies. The indirect military cost was more important since, India excepted, the British
Empire contributed very little to general military spending. While all these points have been
extensively debated, the final word must go to Avner Offer (1993), who makes the obviously correct
point that the military debts of the French and British empires were paid in full during the First World
War.

8/3/2019 Daudin Morys O'Rourke Chapter
http://slidepdf.com/reader/full/daudin-morys-orourke-chapter 18/43

8/3/2019 Daudin Morys O'Rourke Chapter
http://slidepdf.com/reader/full/daudin-morys-orourke-chapter 19/43
18
America might have sparked rapid growth there, even in the absence of protection. Perhaps Germany
and the United States would have grown even more rapidly than they actually did in the absence of
protection. Such considerations have not prevented such prominent economic historians as Paul
Bairoch from stating that “protection = economic growth and expansion of trade; liberalism =
stagnation in both” (Bairoch 1989, p. 69).
Multiple regression analysis can evaluate such claims more precisely, by examining the
correlation between protectionism and economic growth, controlling for other factors that might
influence growth. By using panel data, it is furthermore possible to control for unmeasured
differences across countries that are invariant over time (by adding country dummy variables to the
specification). O’Rourke (2000) provided such an analysis for ten rich countries between the 1870s
and the Great War, including seven European economies: Denmark, France, Germany, Italy, Norway,Sweden and the UK. His surprising finding was that there was a clear positive partial correlation
between average tariffs and growth for this sample of countries: in one specification, a one standard
deviation increase in the average tariff was associated with a 0.74% increase in annual growth rates, a
large effect (O’Rourke 2000, p. 465). Not surprisingly, such a finding has been challenged by other
scholars. For example, Irwin (2002) argues that this positive correlation is a coincidence, driven by
the fact that the frontier economies of the time, such as the US, Canada and Australia (the three non-
European countries in this sample) had both a high growth potential and a high reliance on import
tariffs as a source of government revenue. (On the other hand, if this argument is correct, then
introducing country dummy variables into the analysis should lower or eliminate the positive
correlation between tariffs and growth, whereas in fact it strengthens it.) Clemens and Williamson
(2004b) broaden the analysis by including 35 countries in their sample, including such poorer
European countries as Austria-Hungary, Greece, Portugal, Russia, Serbia and Spain, as well as a
variety of Asian, Middle Eastern and Latin American counties. They find that while the overall
correlation between tariffs and growth was indeed positive, the correlation was negative for the poorer
European countries. Protectionism may have helped a country such as Germany during this period,
perhaps by fostering industrialisation there, but it did little good in countries such as Greece or Serbia,
if these results are to be believed. Quite why the same policy should have had different effects in
different countries is a question which these statistical exercises do not answer, but it should be noted
that Friedrich List himself, the great German protectionist thinker, maintained that
Measures of protection are justifiable only for the purpose of furthering and protecting the internalmanufacturing power, and only in the case of nations which through an extensive and compactterritory, large population, possession of natural resources, far advanced agriculture, a high degree ofcivilisation and political development, are qualified to maintain an equal rank with the principal
agricultural manufacturing commercial nations, with the greatest naval and military powers (PartTwo, Ch, 26).
If free trade was not a universal panacea, then neither was protectionism, it appears.

8/3/2019 Daudin Morys O'Rourke Chapter
http://slidepdf.com/reader/full/daudin-morys-orourke-chapter 20/43
19
Section 3. The sustainability of late 19th
century globalization
3.1. Backlash
3.1.1. Trade
As we saw in Chapter 4 of Volume 1, 19th century European trade policy trends initially
reinforced the impact of falling transport costs. Things were different after the 1870s, however, as a
result of the growing impact of intercontinental trade on factor prices highlighted above. As we have
seen, this hurt European landed interests, and wherever these were powerful enough, the legislative
reaction was predictable. In Germany, Bismarck protected both agriculture and industry in 1879; inFrance, tariffs were raised in the 1880s, and again in 1892; in Sweden, agricultural protection was re-
imposed in 1888 and industrial protection was increased in 1892; in Italy, moderate tariffs were
imposed in 1878, followed by more severe tariffs in 1887 (although this was not enough to prevent
mass emigration from the countryside: see Kindleberger 1951). Figure 1.8 gives ad valorem
equivalent tariffs for the four major European grains (wheat, barley, oats and rye) in three countries,
France, Germany and Sweden. In all three countries, tariffs on individual grains at times exceeded
50%, which represents heavy protection by any standard.
There were exceptions to this pattern of liberalisation followed by a reversion to protection.
Liberalization was both shorter and less dramatic in Iberia. Some small countries remained relatively
liberal: the Netherlands, Belgium, Switzerland, and Denmark, which transformed itself from a grain-
exporter to a grain-importing exporter of animal products (ibid.). The United Kingdom also
maintained free trade, despite the efforts of Joseph Chamberlain. As a grain-exporter, Russia hardly
feared free trade in agricultural products, but it was the first to backtrack from what had in any event
being a rather half-hearted liberalization, increasing tariffs substantially in 1877, 1885 and again in
1891. The purpose was to stimulate industrialization, and tariffs were combined with export subsidies
for cotton textile producers. Austria-Hungary also shifted sharply towards protectionism in the 1880s.
The Balkan countries had inherited liberal tariff policies from their Ottoman masters, but they too
gradually moved towards higher protection, albeit at a slower pace than the Germans or Russians
(Bairoch 1989).
Exactly why not all food-importing countries reverted to agricultural protection has sparked a
large political science literature (e.g. Gourevitch 1986, Rogowski 1989). Economic considerations
were surely important: it seems as though countries such as Denmark and the United Kingdom which
retained agricultural free trade were less vulnerable to the price and rent reductions which
globalization implied. In the Danish case grain prices had been low to begin with, while the country
was exceptionally well suited to meet the growing British demand for butter, eggs and bacon, in part
due to the success of its cooperative societies. In the British case, agriculture had already shrunk

8/3/2019 Daudin Morys O'Rourke Chapter
http://slidepdf.com/reader/full/daudin-morys-orourke-chapter 21/43
20
significantly (Chapter 3), and further decline had little impact on the overall economy (O’Rourke
1997). Elsewhere, it seems that globalization undermined itself. Moreover, this switch towards
protectionism would turn out to be permanent. Countries such as Germany, and in particular France,
have remained strongly in favour of agricultural protection up to the present day (Tracy 1989).
3.1.2. Immigration
Meanwhile, something similar was happening in the land-abundant countries of the New
World. While emigration was good for European workers, as we have seen, the immigration of
millions of predominantly unskilled workers was bad news for their counterparts overseas. Hatton and
Williamson (1998) show that immigration lowered unskilled wages in the United States, although this
is clearly a ceteris paribus finding, since economic growth was raising living standards generallyduring this period. Nonetheless, the effects could be large. According to the Taylor and Williamson
(1997) estimates cited earlier, immigration lowered US unskilled real wages by 8%, relative to what
they would have been in its absence; they lowered Canadian real wages by 15%; and they lowered
Argentinian real wages by 21%. Counterfactual or not, such impacts did not go unnoticed at the time,
and the result was a political backlash, resulting in gradually tightening restrictions on immigration in
the main destination countries (Timmer and Williamson 1998). For example, in 1888 the United
States banned all Chinese immigration for twenty years, while in 1891 it banned the immigration of
persons “likely to become public charges” as well as those “assisted” in passage (ibid ., p. 765). The
screw continued to be tightened on immigration until 1917, when a literacy test was imposed on
would-be migrants, a provision which effectively blocked much of the low-skilled immigration of the
day. Very similar trends can be discerned in Canada and Argentina as well. This shift away from a
relatively laisser faire immigration policy was to prove extremely long-lasting, with the result that
European economies no longer had available to them the safety valve of overseas emigration that had
helped sustain living standards during the population boom and slow transition to modern growth of
the late 19th century.
3.1.3. Democracy, the gold standard and capital flows
Global financial integration switched from an all-time high to a low virtually overnight in the
summer of 1914. Does it follow that pre-war levels of capital market integration would necessarily
have been sustained in the absence of war?
Widespread – by 1913 almost universal – adherence to the gold standard was a central pillar
of the pre-World War I financial system. Adherence to the gold standard implied a commitment to a
policy of external balance, even when this conflicted with domestic economic imbalances, notably
unemployment. According to Eichengreen (1992), one of the factors that undermined attempts to
reinstate the gold standard after 1918 was the fact that the war had given a boost to the extension of
the franchise, and thus to workers’ political power: it was no longer clear that gold standard discipline

8/3/2019 Daudin Morys O'Rourke Chapter
http://slidepdf.com/reader/full/daudin-morys-orourke-chapter 22/43
21
– i.e. raising the discount rate when needed – would be adhered to if this conflicted with domestic
policy objectives. However, Eichengreen also notes that the franchise was already being extended
before the war in many countries, and that unemployment was becoming a growing social issue. One
can therefore speculate that even in the absence of war, this political factor would have ultimately
succeeded in undermining the gold standard, and with it the foundations of the pre-war international
financial system. Furthermore, according to Karl Polanyi (1957, p. 234) such a political development
might well have been inevitable, since “Socialism is, essentially, the tendency inherent in an industrial
civilization to transcend the self-regulating market by consciously subordinating it to a democratic
society”. To this extent, one might yet again see globalization as having undermined itself.
Several objections could be raised against such reasoning, however. First, the single largest
push for universal suffrage and democratisation came, as Eichengreen says, in the wake of World WarI, not as a result of globalisation. Second, even if the gold standard had proved unsustainable, this
would not necessarily have implied the end of global financial integration. In today’s world, most
capital circulates among rich countries which are (with the notable exception of the euro zone) no
longer connected by fixed exchange rates. Indeed, as Obstfeld and Taylor (2004) point out,
abandoning fixed exchange rates makes it possible for countries to pursue both independent monetary
policies and a commitment to open capital markets. It was the attempt to combine fixed exchange
rates with Keynesian macroeconomic policies which, in their view, condemned mid-20th century
capital markets.
Yet another question is whether the magnitude of capital flows experienced before World
War I was sustainable. We have pointed out that frontier expansion was one of the main reasons for
the massive capital exports, and frontier expansion, by definition, has to come to a halt at some point.
Still, the areas of recent settlement were destined to remain the land-abundant countries for some time
to come, and hence could have continued to attract European capital (and labour). Even today,
population density in the US remains at 10% the level of the UK and Germany.
3.2. How sustainable was the ‘Great Specialisation’?
Even if policy had not intervened to mute late 19 th century globalization, a trend which as
Chapter 6 will show accelerated during and after World War I, there are reasons to wonder whether
the international economy of the late 19th century, with its highly developed international division of
labour, could have been sustained. As we saw above, the Industrial Revolution had led to an
extremely asymmetric world economy. Northwest Europe largely exported manufactured goods, and
imported food and primary products not just from Eastern Europe, but from the rest of the world. In
turn, Asia, Africa, Australia and Latin America exported virtually no manufactured goods, and their
primary product exports were largely directed towards Europe. It seems inevitable that this stark
asymmetry between North and South would have had to have come to an end at some stage
(Robertson 1938). Southern export growth was to a large extent driven by the extension of frontiers,

8/3/2019 Daudin Morys O'Rourke Chapter
http://slidepdf.com/reader/full/daudin-morys-orourke-chapter 23/43
22
just as in the American West, with hitherto uncultivated land being cleared to produce rice (as in
Burma), cocoa (as in Ghana), or other primary products. Eventually, these frontiers would inevitably
be exhausted, as they were being exhausted by the end of this period in New World economies such
as the United States (where the frontier was officially declared “closed” in 1890). Once this had
happened, continuing population growth would lead to the onset of diminishing returns, forcing up
the price of the South’s primary exports. Meanwhile, declining transport costs meant that modern
industry would no longer be tied to coalfields and sources of iron ore, implying that it could spread to
low wage regions. Notably, several ‘Southern’ countries, notably Japan, but also India, Mexico,
Brazil and others, were beginning to industrialize by the end of the period. All this suggests that the
North-South division of labour which underlay the late 19th century world economy would ultimately
have become blurred.In addition, as we have seen there were powerful political forces which were undermining
that international economy as well. However, it would be wrong to portray European governments of
this period as being faced with a binary choice between open and closed international markets. Their
options were not restricted to resisting or giving into protectionist anti-globalization backlashes.
Rather, there was a range of complementary domestic policies which governments could – and did –
put in place during this period in order to shore up support for liberal international policies. Thus,
Huberman and Lewchuk (2003) show that there was extensive government intervention in European
labour markets in the late 19th century, a period that also saw a sustained rise in social transfers and
the beginnings of what eventually evolved into the modern welfare state (Lindert 2004). A range of
labour market regulations was introduced across the continent, for example prohibiting night work for
women and children, prohibiting child labour below certain ages, and introducing factory inspections.
The period also saw the widespread introduction of old-age, sickness and unemployment insurance
schemes. Moreover, this ‘labour compact’ was more widespread in the more open European
economies. Huberman and Lewchuk interpret this finding as providing support for the argument that
unions were persuaded to back free trade, or openness more generally, in return for pro-labour
domestic policies. In related work, Huberman (2004) finds that working hours in Europe and her
offshoots declined between 1870 and 1913 as a result of labour legislation and union pressure, and
that the decline was greatest in small open economies such as Belgium, where the Labour Party
supported free trade after 1885 (Huberman 2007). Not only did governments not indulge in a race to
the bottom during the late 19th century globalization boom: in some cases governments cooperated so
as to ensure a general raising of standards. Such was the case, for example, with the Franco-Italian
labour accord of 1904, which raised labour standards in Italy as a quid pro quo for granting Italian
workers in France benefits which their French colleagues already enjoyed.
To some extent, therefore, late 19th century governments successfully managed the political
challenges posed by globalization, sometimes defusing protectionist demands by means of domestic
legislation, and sometimes giving into them. World trade might have grown more slowly after 1914

8/3/2019 Daudin Morys O'Rourke Chapter
http://slidepdf.com/reader/full/daudin-morys-orourke-chapter 24/43
23
than it did before, even had war not intervened, and the political challenges facing governments might
have been exacerbated; but the 1920s and 1930s would have been utterly different had it not been for
the Great War, to which we now turn.
3.3. World War I: devil ex machina?
Whether globalization was sustainable or not, it was cut short by the advent of World War I in
the summer of 1914. As discussed in Chapter 6, the war disrupted the international economic system
beyond repair.
Some Marxists have maintained that the development of international capitalism linked to
globalisation was the central cause of the war, mainly because it exacerbated imperialist conflicts that
would ultimately lead to it. Yet, the immediate causes of World War I were clearly unrelated to anyimperialist rivalry for the control of the world economy. The Moroccan crises (1905 and 1911)
between France and Germany heightened tensions, but both were resolved peacefully. Italy conquered
Libya in 1912 without too many difficulties. The immediate cause of World War I is to be found,
obviously, in the conflict between Austria-Hungary and Serbia following the assassination of
Archduke Franz Ferdinand on June 28, 1914 in Sarajevo. Austria-Hungary was not trying to impose
its economic domination on Serbia, but was trying to protect its great power status in the Balkans.
Furthermore, business groups were mostly cautious and pacifistic. The City as a group was clearly
pacifist, no French businessman ever recommended war as a way to check German economic
dynamism, and even the bellicosity of German business groups as whole is not proven. International
glass and chemical cartels formed in the 1900s showed that peaceful co-existence between business
interests in different countries was possible. As Niall Ferguson (2005) points out, the outbreak of war
came as a complete shock to financial markets, despite the best efforts of those prophesying doom.
Globalization, by increasing international inter-dependency, dramatically increased the actual
costs of war. Norman Angell made precisely this point in 1910 in a very successful book (Angell
1910). Ex-post, he seems to have been vindicated, at least to the extent that the costs of World War I
were far greater than any conceivable benefits, even for the victors (Ferguson 1998). Rowe (2005) has
also pointed out that the fact that globalization tended to raise wages in 19 th century Europe made it
more costly for states to maintain large standing armies, unless they relied on conscription; but that
the opportunity cost of conscription was therefore also rising for workers, implying growing anti-
militarism, especially among socialist parties. This would not on the face of it seem to have been an
environment conducive to large-scale military adventures, although some conservative Germans saw
in war a way to stop the rise of socialism and democracy following the major social-democrat
electoral victory in 1913 (Fischer 1975 (1969)).
Yet, by increasing inter-dependency, globalization also increased the vulnerability of
European states, especially given Western European reliance on large-scale imports of food and raw
materials (Offer 1989). British planners, concerned to maintain food supplies in time of war,

8/3/2019 Daudin Morys O'Rourke Chapter
http://slidepdf.com/reader/full/daudin-morys-orourke-chapter 25/43
24
perceived that Germany might also be vulnerable, and began to view naval blockades as a potentially
useful offensive weapon in time of war; German planners reached similar conclusions and the two
nations embarked on a naval arms race. This vulnerability also meant that German worries that the
Reich could only lose a drawn-out, defensive war, and especially a two-front war. This encouraged it
to gamble on a quick victory against France. According to Rowe, the fact that states now found it
more difficult to maintain large armies also heightened the sense of insecurity which military planners
felt, and made it more difficult for them to credibly deter aggression. Paradoxically, Rowe concludes
(p. 446) that “Europe did not go to war despite globalization’s constraints on military force in prewar
Europe; Europe went to war because these constraints undermined the very foundations on which
European peace rested.”
8/3/2019 Daudin Morys O'Rourke Chapter
http://slidepdf.com/reader/full/daudin-morys-orourke-chapter 26/43
25
References
Angell, N. 1910. The Great Illusion: A Study of the Relation of Military Power in Nations to their
Economic and Social Advantage. London: William Heinemann.
Bairoch, P. 1974. General Structure and Trade Balance of European Foreign Trade. Journal of
European Economic History 3: 557-608.
Bairoch, P. 1989. European Trade Policy, 1815-1914. In The Cambridge Economic History of
Europe, Volume VIII , The Industrial Economies: The Development of Economic and Social Policies,ed. P. Mathias and S. Pollard. Cambridge: Cambridge University Press.
Bairoch, P. 1993. Economics and World History: Myths and Paradoxes. Hemel Hempstead:Harvester-Wheatsheaf.
Bordo, M.D., B. Eichengreen and D.A. Irwin. 1999. Is Globalization Today Really Different fromGlobalization a Hundred Years Ago? in Brookings Trade Forum 1999, ed. R.Z. Lawrence and S.M.Collins. Washington DC: Brookings Institution Press.
Bordo, M.D., and F.E. Kydland. 1995. The Gold Standard as a Rule: An Essay in Exploration. Explorations in Economic History 32: 423-64.
Bordo, M.D., and H. Rockoff. 1996. The Gold Standard as a 'Good Housekeeping Seal of Approval'. Journal of Economic History 56: 389-428.
Cain, P.J. and A.G. Hopkins. 2002. British Imperialism 1688-2000, Second Edition. Harlow:Longman.
Calvo, G. 1998. Capital Flows and Capital-Market Crises: The Simple Economics of Sudden Stops. Journal of Applied Economics 1: 35-54.
Caves, R.E. 1996. Multinational Enterprise and Economic Analysis. Cambridge: CambridgeUniversity Press.
Charle, C. 1994. La République des Universitaires. Paris: Seuil.
Chiswick, B.R. and T.J. Hatton. 2003. International Migration and the Integration of Labor Markets.In Globalization in Historical Perspective, ed. M.D. Bordo, A.M. Taylor and J.G. Williamson.Chicago: University of Chicago Press.
Clark, G. 1987. Why Isn't the Whole World Developed? Lessons from the Cotton Mills. Journal of
Economic History 47: 141-173.
Clark, G. and R.C. Feenstra. 2003. Technology in the Great Divergence. In Globalization in
Historical Perspective, ed. M.D. Bordo, A.M. Taylor and J.G. Williamson. Chicago: University ofChicago Press.
Clemens, M.A. and J.G. Williamson. 2004a. Wealth Bias in the First Global Capital Market Boom,1870-1913. Economic Journal 114: 304-337.
Clemens, M.A. and J.G. Williamson. 2004b. Why did the Tariff-Growth Correlation Change after1950? Journal of Economic Growth 9: 5-46.
Collins, W.J. 1996. Regional Labor Markets in British India. Mimeo, Harvard University.
Davis, L.E. and R.A. Huttenback. 1986. Mammon and the Pursuit of Empire: The Political Economy
8/3/2019 Daudin Morys O'Rourke Chapter
http://slidepdf.com/reader/full/daudin-morys-orourke-chapter 27/43
26
of British Imperialism, 1860-1912. Cambridge: Cambridge University Press.
Edelstein, M. 1982. Overseas Investment in the Age of High Imperialism. New York: ColumbiaUniversity Press.
Edelstein, M. 2004. Foreign Investment, Accumulation and Empire, 1860-1914. In The Cambridge
Economic History of Modern Britain, ed. R. Floud and P. Johnson. Cambridge: Cambridge UniversityPress.
Eichengreen, B. 1992. Golden Fetters: The Gold Standard and the Great Depression 1919-1939.Oxford: Oxford University Press.
English, J.F. 2005. The Economy of Prestige: Prizes, Awards and the Circulation of Cultural Value.Cambridge and London: Harvard University Press.
Estevadeordal, A., B. Frantz and A.M. Taylor. 2003. The Rise and Fall of World Trade, 1870-1939.Quarterly Journal of Economics 118: 359-407.
Esteves, R.P. 2007. Between Imperialism and Capitalism. European Capital Exports Before 1914.Mimeo, Oxford University.
Etemad, B. 2006. Colonial and European Domestic Trade: A Statistical Perspective Over Time. In A
Deux Ex Machina Revisited: Atlantic Trade and European Economic Development , ed P. C. Emmer,O. Pétré-Grenouilleau and J. V. Roitman. Leiden & Boston: Brill.
Federico, G. and K.G. Persson. 2007. Market Integration and Convergence in the World WheatMarket, 1800-2000. In The New Comparative Economic History: Essays in Honor of Jeffrey G.
Williamson, ed. T.J. Hatton, K.H. O'Rourke and A.M. Taylor. Cambridge, MA: MIT Press.
Feldstein, M., and C. Horioka. 1980. Domestic Saving and International Capital Flows. Economic
Journal 90: 314-29.
Feis, H. 1930. Europe the World’s Banker 1870-1914: An Account of European Foreign Investment
and the Connection of World Finance with Diplomacy Before the War . New Haven: Yale UniversityPress.
Ferguson, N. 1998. The Pity of War . London: Penguin.
Ferguson, N. 2005. Sinking Globalization. Foreign Affairs 84:64-77.
Ferguson, N., and M. Schularick. 2006. The Empire Effect: The Determinants of Country Risk in theFirst Age of Globalization, 1880-1913. Journal of Economic History 66: 283-312.
Findlay, R. and K.H. O’Rourke. 2007. Power and Plenty: Trade, War, and the World Economy in the
Second Millennium. Princeton: Princeton University Press.
Fischer, Fritz. 1975. War of Illusions: German Policies from 1911 to 1914. London: Chatto andWindus.
Flandreau, M. 2000. The Economics and Politics of Monetary Unions: A Reassessment of the Latin
Monetary Union, 1865–71. Financial History Review 7: 25-43.
Flandreau, M. and M. Maurel. 2005. Monetary Union, Trade Integration, and Business Cycles in 19thCentury Europe. Open Economies Review 16:135-152.
Flandreau, M., and F. Zumer. 2004. The Making of Global Finance. 1880 - 1913. Paris: OECD.
8/3/2019 Daudin Morys O'Rourke Chapter
http://slidepdf.com/reader/full/daudin-morys-orourke-chapter 28/43
27
Fletcher, M.E. 1958. The Suez Canal and World Shipping, 1869-1914. Journal of Economic History 18:556-573.
Foreman-Peck, J. 1991. International Technology Transfer in Telephony, 1876-1914. In InternationalTechnology Transfer : Europe, Japan and the USA, 1700-1914, ed. D.J. Jeremy. Aldershot: EldwardElgar.
Garbade, K.D. and W.L. Silber. 1978. Technology, Communication and the Performance of FinancialMarkets: 1840-1975. Journal of Finance 33:819-832.
Gourevitch, P. 1986. Politics in Hard Times: Comparative Responses to International Economic
Crises. Ithaca: Cornell University Press. Harley, C.K. 1980. Transportation, the World Wheat Trade, and the Kuznets Cycle, 1850-1913.
Explorations in Economic History 17: 218-250.
Harley, C.K. 1990. North Atlantic Shipping in the Late Nineteenth Century: Freight Rates and theInterrelationship of Cargoes. In Shipping and Trade, 1750-1950: Essays in International Maritime
History, ed. L.R. Fischer and H.W. Nordvik. Pontefract: Lofthouse.
Hatton, T.J. and J.G. Williamson. 1994. What Drove the Mass Migrations from Europe in the Late Nineteenth Century? Population and Development Review 20: 1-27.
Hatton, T.J. and J.G. Williamson. 1998. The Age of Mass Migration: Causes and Economic Impact .Oxford: Oxford University Press.
Hatton, T.J. and J.G. Williamson. 2005. Global Migration and the World Economy: Two Centuries ofPolicy and Performance. Cambridge MA: MIT Press.
Huberman, M. 2004. Working Hours of the World Unite? New International Evidence of Worktime,1870-1913. Journal of Economic History 64: 964-1001.
Huberman, M. 2007. A Ticket to Trade: Belgian Workers and Globalization Before 1914. Economic
History Review, forthcoming.
Huberman, M. and W. Lewchuk. 2003. European Economic Integration and the Labour Compact,1850-1913. European Review of Economic History 7: 3-41.
Hurd, J. 1975. Railways and the Expansion of Markets in India, 1861-1921. Explorations in Economic History 12: 263-288.
Imlah, A.H. 1952. British Balance of Payments and Export of Capital, 1816-1913. Economic History
Review 5:208-239.
Irwin, D.A. 2002. Interpreting the Tariff-Growth Correlation of the Late 19th Century. American
Economic Review 92: 165-169.
Issawi, C. 1966. The Economy of the Middle East 1800-1914. Chicago: University of Chicago Press.
Jacks, D.S. 2005. Intra- and International Commodity Market Integration in the Atlantic Economy,1800–1913. Explorations in Economic History 42:381-413.
Jacks, D.S. 2006. What Drove 19th Century Commodity Market Integration? Explorations in
Economic History 43: 383-412.

8/3/2019 Daudin Morys O'Rourke Chapter
http://slidepdf.com/reader/full/daudin-morys-orourke-chapter 29/43
28
Jeremy, D.J., ed. 1991. International Technology Transfer, Europe, Japan and the USA, 1700-1914.Aldershot: Edward Elgar.
Jones, M.T. and M. Obstfeld. 2001. Saving, Investment, and Gold: A Reassessment of HistoricalCurrent Account Data. In Money, Capital Mobility, and Trade: Essays in Honor of Robert A.
Mundell, ed. G.A. Calvo, M. Obstfeld and R. Dornbusch. Cambridge MA: MIT Press.
Kindleberger, C.P. 1951. Group Behavior and International Trade. Journal of Political Economy 59:30-46.
Kirk, D. 1946. Europe’s Population in the Interwar Years. New York, London and Paris: Gordon andBreach Science Publishers.
Klovland, J.T. 2005. Commodity Market Integration 1850-1913: Evidence from Britain and Germany. European Review of Economic History 9: 163-197.
Lévy-Leboyer, M., and F. Bourguignon. 1990. The French Economy in the Nineteenth Century.Cambridge: Cambridge University Press.
Lindert, P.H. 2004. Growing Public: Social Spending and Economic Growth since the Eighteenth
Century, Volume I, The Story. Cambridge: Cambridge University Press.
López-Córdova, J.E. and C.M. Meissner. 2003. Exchange-Rate Regimes and International Trade:Evidence from the Classical Gold Standard Era. American Economic Review 93:344-353.
Lucas, R.E. 1990. Why Doesn't Capital Flow from Rich to Poor Countries? American Economic
Review 80: 92-96.
Maddison, A. 1995. Monitoring the World Economy 1820-1992. Paris: OECD.
Maddison, A. 2001. The World Economy: A Millennial Perspective. Paris: OECD.
Maddison, A. 2003. The World Economy: Historical Statistics. Paris: OECD.
Mauro, P., N. Sussman, and Y. Yafeh. 2002. Emerging Market Spreads: Then Versus Now. Quarterly
Journal of Economics 117: 695-733.
Metzer, J. 1974. Railroad Development and Market Integration: The Case of Tsarist Russia. Journal
of Economic History 34: 529-550.
Mitchener, K.J. and M. Weidenmier. 2007. Trade and Empire. Mimeo, Santa Clara University andClaremont McKenna College.
Morys, M. 2006. The Classical Gold Standard in the European Periphery: A Case Study of Austria-Hungary and Italy, 1870-1913. PhD thesis, London School of Economics and Political Science.
O'Brien, P.K. and L. Prados de la Escosura, eds. 1998. The Costs and Benefits of EuropeanImperialism from the Conquest of Ceuta, 1415, to the Treaty of Lusaka, 1974. Revista de Historia
Económica Special Issue, XVI, 1, Invierno.
Obstfeld, M., and A.M. Taylor. 2003. Sovereign Risk, Credibility and the Gold Standard: 1870-1913vs. 1925-1931. Economic Journal 113: 241-75.
Obstfeld, M. and A.M. Taylor. 2004. Global Capital Markets: Integration, Crisis, and Growth.Cambridge: Cambridge University Press.

8/3/2019 Daudin Morys O'Rourke Chapter
http://slidepdf.com/reader/full/daudin-morys-orourke-chapter 30/43
29
Offer, A. 1989. The First World War: An Agrarian Interpretation. Oxford: Clarendon Press.
Offer, A. 1993. The British Empire, 1870-1914: A Waste of Money? Economic History Review 46:215-238.
O’Rourke, K.H. 1997. The European Grain Invasion, 1870-1913. Journal of Economic History 57:775-801.
O’Rourke, K.H. 2000. Tariffs and Growth in the Late 19 th Century. Economic Journal 110: 456-483.
O’Rourke, K.H. 2002. Europe and the Causes of Globalization, 1790-2000. In From Europeanization
of the Globe to the Globalization of Europe, ed. H. Kierzkowski. Basingstoke: Palgrave Macmillan.
O’Rourke, K.H., A.M. Taylor, and J.G. Williamson. 1996. Factor Price Convergence in the Late Nineteenth Century. International Economic Review 37: 499-530.
O’Rourke, K.H. and J.G. Williamson. 1994. Late 19th Century Anglo-American Factor PriceConvergence: Were Heckscher and Ohlin Right? Journal of Economic History 54: 892-916.
O’Rourke, K.H. and J.G. Williamson. 1997. Around the European Periphery 1870-1913:Globalization, Schooling and Growth. European Review of Economic History 1: 153-191.
O’Rourke, K.H. and J.G. Williamson. 1999. Globalization and History: The Evolution of a
Nineteenth Century Atlantic Economy. Cambridge MA: MIT Press.
Polanyi, K. 1957. The Great Transformation: The Political and Economic Origins of our Time.Boston: Beacon Press.
Robertson, D.H. 1938. The Future of International Trade. Economic Journal 48: 1-14.
Rodríguez, F. and D. Rodrik. 2001. Trade Policy and Economic Growth: A Skeptic’s Guide to theCross-National Evidence. In Macroeconomics Annual 2000, ed. B. Bernanke and K.S. Rogoff.Cambridge MA: MIT Press.
Rogowski, R. 1989. Commerce and Coalitions: How Trade Affects Domestic Political Alignments.Princeton: Princeton University Press.
Rowe, D.M. 2005. The Tragedy of Liberalism: How Globalization Caused the First World War.Security Studies 14: 407-447.
Sachs, J. D. and A.M. Warner. 1995. Economic Reform and the Process of Global Integration. Brookings Papers on Economic Activity 1: 1-118.
Stone, I. 1999. The Global Export of Capital from Great Britain, 1865-1914: A Statistical Survey.
London: Macmillan Press.
Taylor, A.M. 1992. External Dependence, Demographic Burdens, and Argentine Economic Declineafter the Belle Epoque. Journal of Economic History 52: 907-36.
Taylor, A.M. 1996. International Capital Mobility in History: The Saving-Investment Relationship.
NBER Working Paper No. 5743.
Taylor, A.M. and J.G. Williamson. 1997. Convergence in the Age of Mass Migration. European
Review of Economic History 1: 27-63.
Temin, P. 1987. Capital Exports, 1870-1914: An Alternative Model. Economic History Review 40:
8/3/2019 Daudin Morys O'Rourke Chapter
http://slidepdf.com/reader/full/daudin-morys-orourke-chapter 31/43
30
453-458.
Timmer, A. and J.G. Williamson. 1998. Immigration Policy Prior to the Thirties: Labor Markets,Policy Interactions and Globalization Backlash. Population and Development Review 24: 739-771.
Tracy, M. 1989. Government and Agriculture in Western Europe 1880-1988 , Third Edition. NewYork: Harvester Wheatsheaf.
Ville, S. 1991. Shipping Industry Technologies. In International Technology Transfer : Europe, Japan and the USA, 1700-1914, ed. D.J. Jeremy. Aldershot: Eldward Elgar.
Wilkins, M. 1970. The Emergence of Multinational Enterprise: American Business Abroad from the
Colonial Era to 1914. Cambridge MA: Harvard University Press.
Williamson, J.G. 1974. Late Nineteenth Century American Development: A General Equilibrium
History. Cambridge: Cambridge University Press.
Williamson, J.G. 1995. The Evolution of Global Labor Markets Since 1830: Background Evidenceand Hypotheses. Explorations in Economic History 32: 141-96.
Williamson, J.G. 2002a. Land, Labor and Globalization in the Third World, 1870-1940. Journal of
Economic History 62: 55-85.
Williamson, J.G. 2002b. Winners and Losers Over Two Centuries of Globalization. NBER Working
Paper No. 9161.
Yates, P.L. 1959. Forty Years of Foreign Trade. London: George Allen and Unwin.
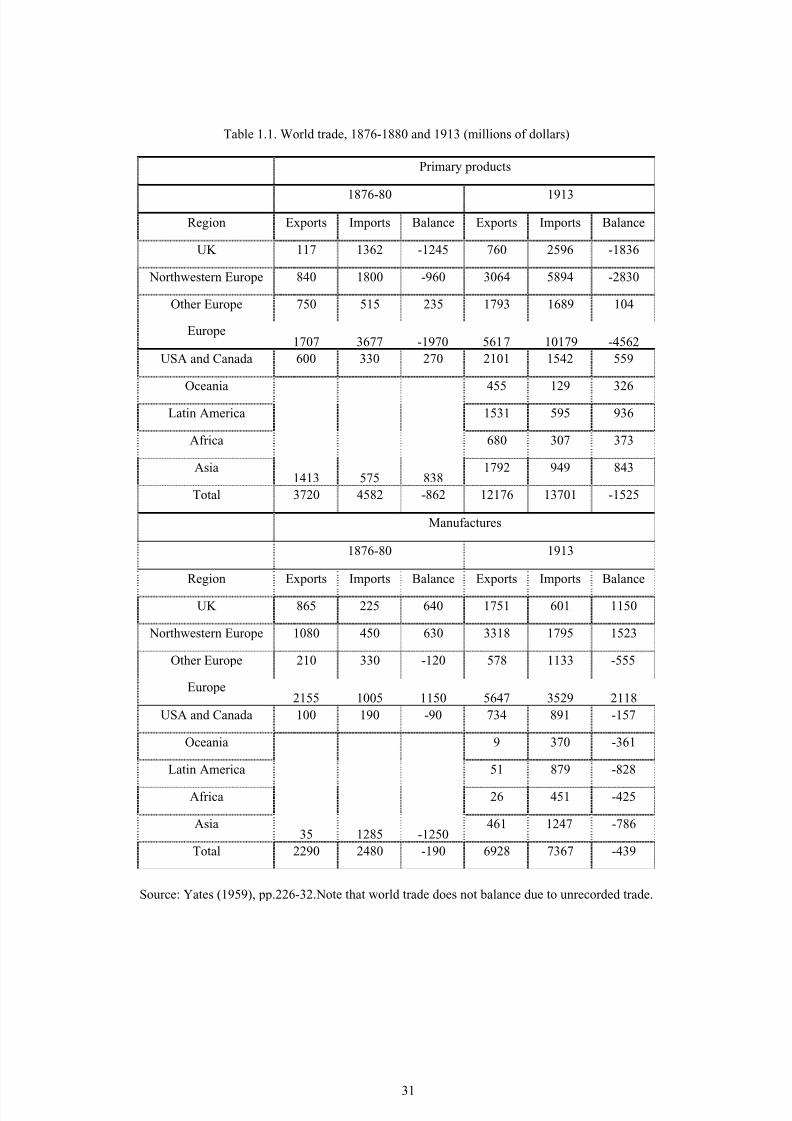
8/3/2019 Daudin Morys O'Rourke Chapter
http://slidepdf.com/reader/full/daudin-morys-orourke-chapter 32/43
31
Table 1.1. World trade, 1876-1880 and 1913 (millions of dollars)
Primary products
1876-80 1913
Region Exports Imports Balance Exports Imports Balance
UK 117 1362 -1245 760 2596 -1836
Northwestern Europe 840 1800 -960 3064 5894 -2830
Other Europe 750 515 235 1793 1689 104
Europe1707 3677 -1970 5617 10179 -4562
USA and Canada 600 330 270 2101 1542 559
Oceania 455 129 326Latin America 1531 595 936
Africa 680 307 373
Asia1413 575 838
1792 949 843
Total 3720 4582 -862 12176 13701 -1525
Manufactures
1876-80 1913
Region Exports Imports Balance Exports Imports Balance
UK 865 225 640 1751 601 1150
Northwestern Europe 1080 450 630 3318 1795 1523
Other Europe 210 330 -120 578 1133 -555
Europe2155 1005 1150 5647 3529 2118
USA and Canada 100 190 -90 734 891 -157
Oceania 9 370 -361
Latin America 51 879 -828
Africa 26 451 -425
Asia35 1285 -1250
461 1247 -786
Total 2290 2480 -190 6928 7367 -439
Source: Yates (1959), pp.226-32.Note that world trade does not balance due to unrecorded trade.

8/3/2019 Daudin Morys O'Rourke Chapter
http://slidepdf.com/reader/full/daudin-morys-orourke-chapter 33/43
32
Table 1.2. Foreign Investment of England, France and Germany, 1870 - 1913
England France Germany
S a v i n g / G D P
F o r e i g n I n v e s t m e n t /
G D P
F o r e i g n I n v e s t m e n t
a s
% o
f S a v i n g
S a v i n g / G D P
F o r e i g n I n v e s t m e n t /
G D P
F o r e i g n I n v e s t m e n t
a s
% o
f S a v i n g
S a v i n g / G D P
F o r e i g n I n v e s t m e n t /
G D P
F o r e i g n I n v e s t m e n t
a s
% o
f S a v i n g
1870 – 79 12.3% 4.0% 32.5% 23.9% 10.2%
1880 – 89 12.2% 4.7% 38.5% 5.1% 18.8%
1890 – 99 11.0% 3.4% 30.9% 16.5% 12.1%
1900 – 09 12.6% 3.7% 29.4% 19.1% 8.3%
1905 – 14 13.1% 6.5% 49.6% 17.3% 7.5%
Net national wealthheld overseas in 1914
32.1%
Share of global foreigninvestment
41.8% 19.8% 12.8%
Sources: Edelstein (1982, 2004), Feis (1930), Jones & Obstfeld (2001), Lévy-Leboyer& Bourguignon (1990),
Maddison (1995, 2003).
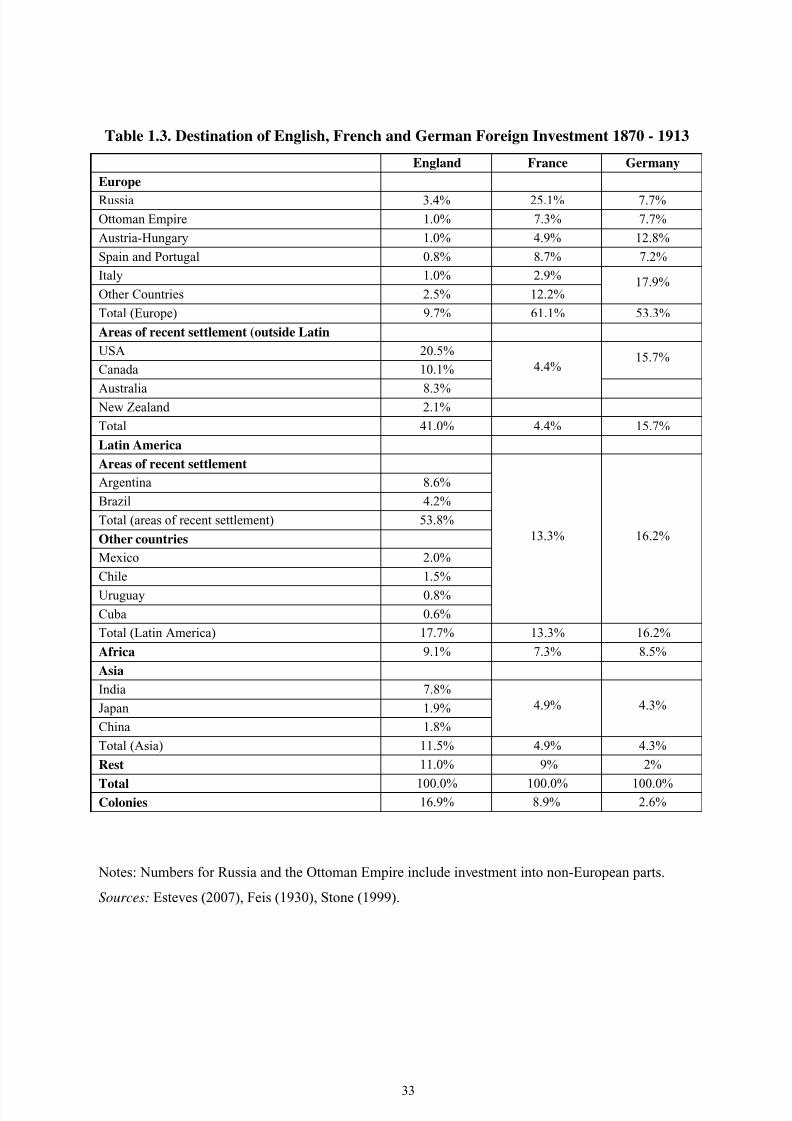
8/3/2019 Daudin Morys O'Rourke Chapter
http://slidepdf.com/reader/full/daudin-morys-orourke-chapter 34/43
33
Table 1.3. Destination of English, French and German Foreign Investment 1870 - 1913
England France Germany
Europe
Russia 3.4% 25.1% 7.7%
Ottoman Empire 1.0% 7.3% 7.7%
Austria-Hungary 1.0% 4.9% 12.8%
Spain and Portugal 0.8% 8.7% 7.2%
Italy 1.0% 2.9%
Other Countries 2.5% 12.2%17.9%
Total (Europe) 9.7% 61.1% 53.3%
Areas of recent settlement (outside Latin
USA 20.5%
Canada 10.1%15.7%
Australia 8.3%
4.4%
New Zealand 2.1%
Total 41.0% 4.4% 15.7%
Latin America
Areas of recent settlement
Argentina 8.6%
Brazil 4.2%
Total (areas of recent settlement) 53.8%
Other countries
Mexico 2.0%
Chile 1.5%
Uruguay 0.8%
Cuba 0.6%
13.3% 16.2%
Total (Latin America) 17.7% 13.3% 16.2%
Africa 9.1% 7.3% 8.5%
Asia
India 7.8%
Japan 1.9%
China 1.8%
4.9% 4.3%
Total (Asia) 11.5% 4.9% 4.3%
Rest 11.0% 9% 2%
Total 100.0% 100.0% 100.0%Colonies 16.9% 8.9% 2.6%
Notes: Numbers for Russia and the Ottoman Empire include investment into non-European parts.
Sources: Esteves (2007), Feis (1930), Stone (1999).

8/3/2019 Daudin Morys O'Rourke Chapter
http://slidepdf.com/reader/full/daudin-morys-orourke-chapter 35/43
34
Table 1.4. Migration Rates by Decade (per 1000 mean population)
Country 1851-60 1861-70 1871-80 1881-90 1891-00 1901-10
European Emigration Rates
Austria-Hungary 2.9 10.6 16.1 47.6Belgium 8.6 3.5 6.1British Isles 58.0 51.8 50.4 70.2 43.8 65.3Denmark 20.6 39.4 22.3 28.2Finland 13.2 23.2 54.5France 1.1 1.2 1.5 3.1 1.3 1.4
Germany 14.7 28.7 10.1 4.5Ireland 66.1 141.7 88.5 69.8Italy 10.5 33.6 50.2 107.7
Netherlands 5.0 5.9 4.6 12.3 5.0 5.1 Norway 24.2 57.6 47.3 95.2 44.9 83.3Portugal 19.0 28.9 38.0 50.8 56.9Spain 36.2 43.8 56.6Sweden 4.6 30.5 23.5 70.1 41.2 42.0Switzerland 13.0 32.0 14.1 13.9
Source: Hatton and Williamson (1998: Table 2.1).

8/3/2019 Daudin Morys O'Rourke Chapter
http://slidepdf.com/reader/full/daudin-morys-orourke-chapter 36/43
35
0%
5%
10%
15%
20%
25%
30%
35%
1870 1880 1890 1900 1910
Oceania
Africa
Asia
South America
North America
Figure 1.1: Continental shares in Europe’s extra-European exports
Source: Bairoch (1974).
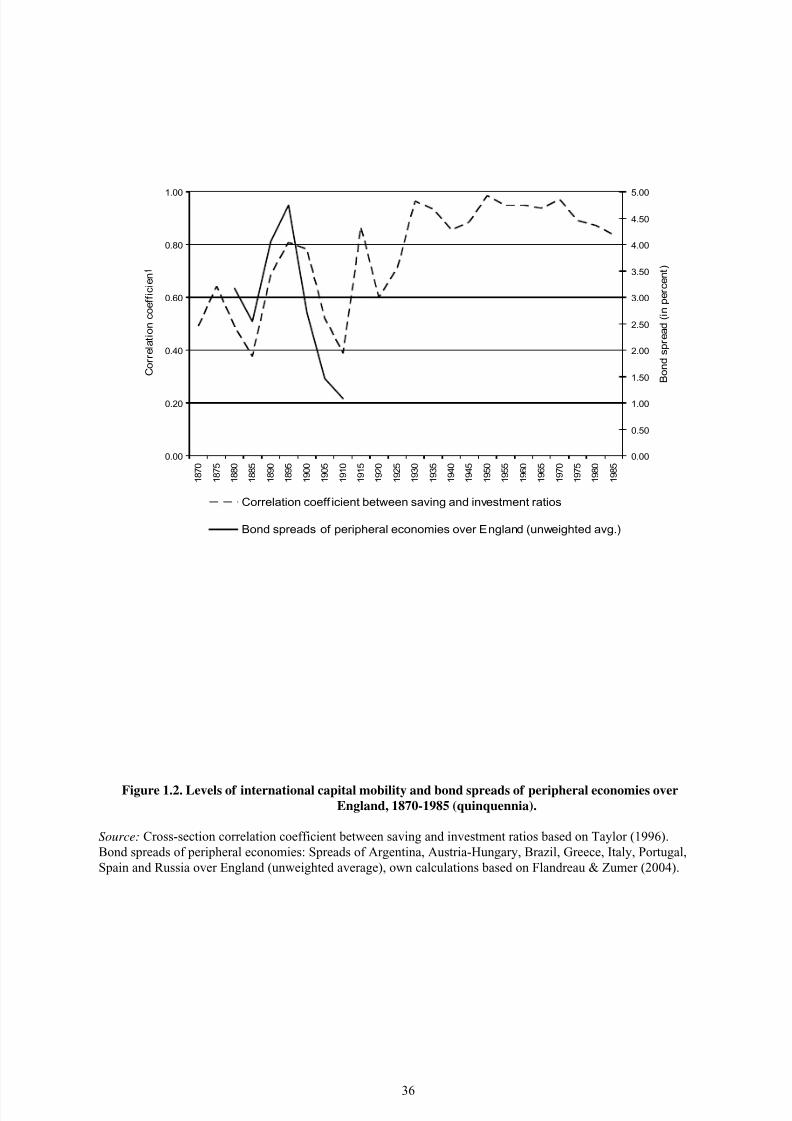
8/3/2019 Daudin Morys O'Rourke Chapter
http://slidepdf.com/reader/full/daudin-morys-orourke-chapter 37/43
36
0.00
0.20
0.40
0.60
0.80
1.00
1 8 7 0
1 8 7 5
1 8 8 0
1 8 8 5
1 8 9 0
1 8 9 5
1 9 0 0
1 9 0 5
1 9 1 0
1 9 1 5
1 9 2 0
1 9 2 5
1 9 3 0
1 9 3 5
1 9 4 0
1 9 4 5
1 9 5 0
1 9 5 5
1 9 6 0
1 9 6 5
1 9 7 0
1 9 7 5
1 9 8 0
1 9 8 5
C o r r e l a t i o n c o e f f i c i e n
0.00
0.50
1.00
1.50
2.00
2.50
3.00
3.50
4.00
4.50
5.00
B o n d s p r e a d ( i n p e r c e n t )
Correlation coeff icient between saving and investment ratios
Bond spreads of peripheral economies over England (unweighted avg.)
Figure 1.2. Levels of international capital mobility and bond spreads of peripheral economies overEngland, 1870-1985 (quinquennia).
Source: Cross-section correlation coefficient between saving and investment ratios based on Taylor (1996).
Bond spreads of peripheral economies: Spreads of Argentina, Austria-Hungary, Brazil, Greece, Italy, Portugal,
Spain and Russia over England (unweighted average), own calculations based on Flandreau & Zumer (2004).

8/3/2019 Daudin Morys O'Rourke Chapter
http://slidepdf.com/reader/full/daudin-morys-orourke-chapter 38/43
37
0
200
400
600
800
1000
1200
1400
1600
1840 1860 1880 1900 1920
Year
T h o u s a n d s
Old
New
Total
Figure 1.3. Average annual overseas emigration from Europe, 1846-1915
Source: Kirk (1946), p. 279. Note: ‘Old’ consists of Britain and Ireland, Germany, Scandinavia, France,
Switzerland and the Low Countries. ‘New’ consists of Italy, Austro-Hungarian Empire, Russian Empire, Iberiaand the Balkans.
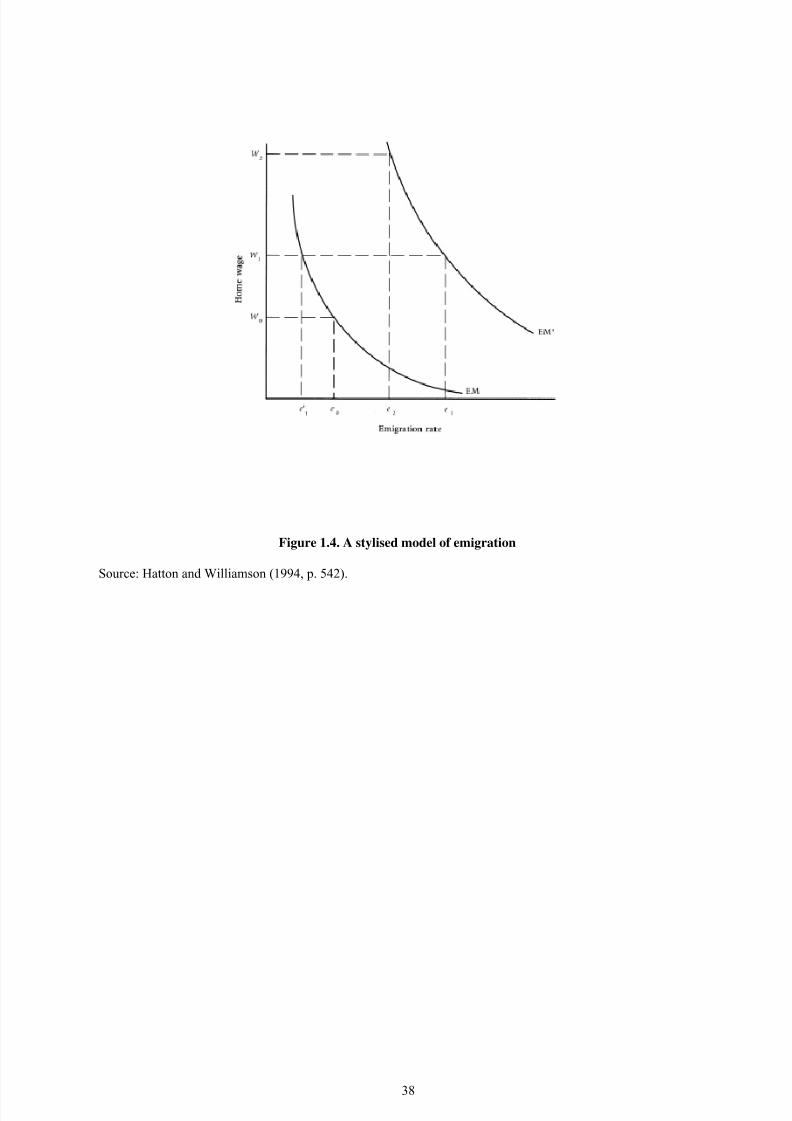
8/3/2019 Daudin Morys O'Rourke Chapter
http://slidepdf.com/reader/full/daudin-morys-orourke-chapter 39/43
38
Figure 1.4. A stylised model of emigration
Source: Hatton and Williamson (1994, p. 542).

8/3/2019 Daudin Morys O'Rourke Chapter
http://slidepdf.com/reader/full/daudin-morys-orourke-chapter 40/43
39
0
50
100
150
200
250
300
350
400
1850-
1854
1855-
1859
1860-
1865
1865-
1869
1870-
1874
1875-
1879
1880-
1884
1885-
1889
1890-
1894
1895-
1899
1900-
1904
1905-
1909
1910-
1914
1915-
1920
0
20
40
60
80
100
120
140
160
Number of international congresses (left axis) Number of international organizations founded (right axis)
Figure 1.5: The rise of the international scientific community
Sources: Union des Associations Internationales, Les Congrés Internationaux de 1681 à 1899
/ International Congresses 1681 to 1899, Bruxelles, 1960; Union des AssociationsInternationales, Les 1.978 Organisations Internationales fondées depuis le Congrès de
Vienne, Bruxelles, 1957.

8/3/2019 Daudin Morys O'Rourke Chapter
http://slidepdf.com/reader/full/daudin-morys-orourke-chapter 41/43
40
Figure 1.6. Wages relative to Britain, 1870-1913
Source: Williamson (1995), amended in O’Rourke and Williamson (1997).

8/3/2019 Daudin Morys O'Rourke Chapter
http://slidepdf.com/reader/full/daudin-morys-orourke-chapter 42/43
41
Figure 1.7. Wages relative to Britain, 1870-1913
Source: Williamson (1995), amended in O’Rourke and Williamson (1997).

8/3/2019 Daudin Morys O'Rourke Chapter
http://slidepdf.com/reader/full/daudin-morys-orourke-chapter 43/43
0
10
20
30
40
50
60
70
1870 1875 1880 1885 1890 1895 1900 1905 1910
France Germany Sweden
Wheat
0
10
20
30
40
50
60
70
1870 1875 1880 1885 1890 1895 1900 1905 1910
France Germany Sweden
Rye
0
10
20
30
40
50
60
70
1870 1875 1880 1885 1890 1895 1900 1905 1910
France Germany Sweden
Oats
0
10
20
30
40
50
60
70
1870 1875 1880 1885 1890 1895 1900 1905 1910
France Germany Sweden
Barley
p e r c e n t
p e r c e n t
p e r c e n t
p e r c e n t
Figure 1.8. European grain tariffs 1870-1913
(ad valorem equivalent, percent)
Source: data underlying O'Rourke (1997).