daytonregionalstemcenter.orgdaytonregionalstemcenter.org/wp-content/...resources.final_.docx ·...
TRANSCRIPT

Printable ResourcesCurrently Adrift
Appendix A: Pre/Post Test Student VersionAppendix B: Pre/Post Test Teacher EditionAppendix C: Ocean Currents ArticleAppendix D: Black Box Prediction SheetAppendix E: Engineering Design Challenge KWL ChartAppendix F: Water Density Inquiry Handout Student VersionAppendix G: Water Density Inquiry Handout Teacher VersionAppendix H: Engineering Design Process WheelAppendix I: Engineering Design Process Wheel CoverAppendix J: Student Handout for Engineering Design ChallengeAppendix K: Design Challenge RubricAppendix L: Coordinate Plane Graph Paper InformationAppendix M: First Trial Exit TicketAppendix N: List of Possible LocationsAppendix O: Mapping Handout for Engineering Design Challenge Appendix P: The Great Ocean Conveyor Belt Simulation ExperienceAppendix Q: 3-2-1 Exit TicketAppendix R: Investigative Process Career Connections Go Team NTSB Appendix S: Let’s Dive In Career Research Note-Taking GuideAppendix T: PSA Career Poster AssignmentAppendix U: PSA Career Poster ChecklistAppendix V: PSA Career Poster RubricAppendix W: Poster SampleAppendix X: Plane Down: Missing Flight Recorder HandoutAppendix Y: List of Unrecovered Flight RecordersAppendix Z: Presentation RubricAppendix AA: Self/Peer/Team Reflection
Page 1

Currently Adrift
Appendix A: Pre/Post Test Student VersionName _____________________________
1. What factors affect seawater density? a. Temperature b. Salinityc. Depth of waterd. All of the above
2. What are surface currents mostly driven by? a. Human activityb. Wind c. Density d. Gravitational forces of the Sun and Moon
3. Why are surface currents important? a. They carry heat away from the tropics, giving it back to the atmosphere as they
head towards the poles.b. They preserve plant and animal habitats. c. They keep the water depth of the ocean normal. d. None of the above.
4. What is the strongest surface current?a. The Gulf Stream b. Canary Currentc. South Equatorial d. Antarctic Circumpolar Current
5. What drives the Ocean Current Conveyor Belt?a. Surface Currentsb. Temperaturec. Densityd. Winds
6. What would cause water to become the most dense? a. Cold water with high salinityb. Cold water with low salinityc. Warm water with high salinity d. Warm water with low salinity
7. What are the global wind belts and their directions in order from the equator to the North Pole?a. Trade winds, west to east; Westerlies, east to west; Polar Easterlies, west to eastb. Westerlies, east to west; Trade winds, west to east; Polar Easterlies east to west.c. Trade winds, east to west; Westerlies, west to east; Polar Easterlies, east to
west. d. Westerlies, west to east; Trade winds, east to west; Polar Easterlies, west to
east.
Page 2

Currently Adrift
8. If a person walks 1/2 a mile every ¼ of an hour, how many miles per hour are they walking? a) One mile per hourb) 4 miles per hourc) Half a mile per hourd) 2 miles per hour
9. On a scale drawing of a boat, the scale is 3/8 of an inch is equal to 7 feet. If the size of your boat is 30 feet, what is the length of your scale drawing? Round your answer to the nearest hundredths.
10. If the scale is 14 in. is equal to 20 miles, then explain how you would calculate the distance in miles if the distance on the map is 6 in. Show calculations to support your reasoning.
11. Explain why the Engineering Design Process works as a cycle.
Page 3

Currently Adrift
Page 4

Currently Adrift
Appendix B: Pre/Post Test Teacher VersionName _____________________________
1. What factors affect seawater density? a. Temperature b. Salinityc. Depth of waterd. All of the above
2. What are surface currents mostly driven by? a. Human activityb. Wind c. Density d. Gravitational forces of the Sun and Moon
3. Why are surface currents important? a. They carry heat away from the tropics, giving it back to the atmosphere as they
head towards the poles.b. They preserve plant and animal habitats. c. They keep the water depth of the ocean normal. d. None of the above.
4. What is the strongest surface current?a. The Gulf Stream b. Canary Currentc. South Equatorial d. Antarctic Circumpolar Current
5. What drives the Ocean Current Conveyor Belt?a. Surface Currentsb. Temperaturec. Densityd. Winds
6. What would cause water to become the most dense? a. Cold water with high salinityb. Cold water with low salinityc. Warm water with high salinity d. Warm water with low salinity
7. What are the global wind belts and their directions in order from the equator to the North Pole?a. Trade winds, west to east; Westerlies, east to west; Polar Easterlies, west to eastb. Westerlies, east to west; Trade winds, west to east; Polar Easterlies east to west.c. Trade winds, east to west; Westerlies, west to east; Polar Easterlies, east to
west. d. Westerlies, west to east; Trade winds, east to west; Polar Easterlies, west to
east.
Page 5

Currently Adrift
8. If a person walks 1/2 a mile every ¼ of an hour, how many miles per hour are they walking? a. One mile per hourb. 4 miles per hourc. Half a mile per hourd. 2 miles per hour
9. On a scale drawing of a boat, the scale is 3/8 of an inch is equal to 7 feet. If the size of your boat is 30 feet, what is the length of your scale drawing? Round your answer to the nearest hundredths.
About 1.61 inches
10. If the scale is 14 in. is equal to 20 miles, then explain how you would calculate the distance in miles if the distance on the map is 6 in. Show calculations to support your reasoning. Round to the nearest tenth.
Set up a proportion of 14 in. over 20 miles equals 6 in. over x. Cross multiply to get the equation to 14x=120. Divide by 14 on both sides to get an answer of 8.6 miles.
11. Explain why the Engineering Design Process works as a cycle.
Answers may vary. One possible answer is: Engineers may design something, test it, find a new problem, and repeat an earlier step to make changes and improvements.
Page 6

Currently Adrift
Appendix C: Ocean Currents ArticleName _____________________________
At last, a clue found from Malaysia Airlines plane that vanished last year
By Associated Press, adapted by Newsela staff
08.11.15
Grade Level 8 Word Count 851
French police officers carry part of a jetliner's wing in Saint-Andre, Reunion Island, July 29, 2015. The debris is from Malaysia Airlines Flight 370, which vanished more than a year ago. Photo: AP/Lucas Marie
SYDNEY, Australia — For the past 17 months, the fate of Malaysia Airlines Flight 370 has baffled people around the world. The plane seemed to have simply vanished, leaving not a single trace behind.
The lack of any physical clues was eerie and unsettling, and led to all sorts of wild theories about what might have happened. At times, Flight 370 almost seemed like the real-life version of the jetliner at the heart of the TV show "Lost."
Now, at last, a piece of the mystery plane has been discovered. On Thursday, the Malaysian prime minister announced that a wing fragment found on an Indian Ocean island belongs to the missing plane.
Flight 370 disappeared on March 8, 2014, on its way from Kuala Lumpur, Malaysia, to Beijing, China, with 239 people on board.
Page 7

Currently Adrift
No Longer "Vanished Without A Trace"We now know it ended up in the ocean — but we still do not know why. What does the discovery of the wing fragment change, if anything?
"The appearance of at least some wreckage takes it out of the realm of 'vanished without a trace,'" said Ric Gillespie, a former U.S. aviation accident investigator. It is now clear, Gillespie said, that the plane "did go down in the ocean." Most likely what happened was "an aviation accident," he said.
Before the discovery of the wing piece on the French island of Reunion, experts generally agreed that the Boeing 777 crashed in a remote stretch of the Indian Ocean. With no physical evidence, however, no one could say so with certainty. There were nagging suspicions that the experts had gotten it wrong. Did the plane fly north to Asia, rather than south into the ocean? Could those on board even be stuck on some far-flung island, like the characters on "Lost?"
Australia is leading the search for the plane in a desolate stretch of ocean 2,600 miles to the east of Reunion Island. The country's prime minister, Tony Abbott, said the discovery provides at least one piece of the puzzle.
"What we have found in the western Indian Ocean does seem to indicate that the plane did come down more or less where we thought it did," Abbott said. "And it suggests that, for the first time, we might be a little bit closer to solving this baffling mystery."
Many Unanswered QuestionsYet in many ways, the mystery only deepens from here. Discovering the wing piece is not expected to help narrow the vast body of ocean where the search for the main body of the plane continues.
Investigators examining the wing fragment in France are trying to find clues about the plane's fate based on the fragment's condition. Their examination only opens up more questions: How, exactly, did the plane end up in the water? Was it a controlled landing, or was there an explosion? If it was not an accident, who was behind it and why?
Officials had already determined that the jetliner took a straight path across the ocean after it went off-course. In turn, that led them to conclude that the plane flew on autopilot for hours before running out of fuel and crashing into the water.
However, there are plenty of other theories, and news of the wing flap's discovery did little to put an end to them. After Malaysian Prime Minister Najib Razak's announcement, online commenters immediately began debating whether the flap could have been planted on the island by terrorists. Some also raised the possibility that the plane landed on Diego Garcia, a British atoll in the Indian Ocean where the United States has a military base.
Such speculation is unlikely to stop, Gillespie said, unless officials find the plane's flight recorders, its so-called "black boxes." These would give investigators definite answers about
Page 8

Currently Adrift
the plane's flight path, and about any mechanical failures or overrides that might have occurred.
A Most Confounding MysteryFor the families of those on board, the discovery of the wing flap does little to end the painful uncertainty they have endured since the plane vanished last year. They are still not much closer to knowing what happened to their loved ones.
For some families, only the recovery of a body will bring any closure. However, the discovery of at least one part of the plane marks a step in that direction, said grief counselor Angela Crawford, of the New Zealand agency Victim Support.
"It's a long journey — it's a piece of a wing," Crawford said. "It's starting to bring that realization to them that they may be heading toward more understanding and closure, which can only be helpful."
Overall, though, officials were relieved that there finally seemed to be something concrete to cling to in what has been one of aviation's most confounding mysteries.
"At least it is a piece of evidence," Australian Foreign Minister Julie Bishop told reporters in Kuala Lumpur. "I remember early on, somebody said it is not as if we are looking for a needle in a haystack — we are still trying to locate the haystack. This gives us some indication that we are in the right place."
Copyright 2016 The Associated Press. All rights reserved. AP material may not be published, broadcast, rewritten or redistributed.
Page 9

Currently Adrift
Appendix D: Black Box Prediction SheetName _____________________________
After reading the Malaysian Airlines article, predict where the missing Malaysian Flight 370 black box/ flight recorder might be. On the ocean currents map below, mark the possible location of the missing black box.
Provide evidence to support your prediction for the location of the black box/flight recorder. Be sure to use the words/phrases ocean conveyor belt, salinity, temperature, and density.
____________________________________________________________________________________________________________________________________________________________________________________________________________________________________________________________________________________________________________________________________________________________________________________________________________________________________________________________________________________________________________
Page 10

Currently Adrift
Appendix E: Engineering Design Challenge KWL ChartName _____________________________
Directions: Review the design challenge below. Based on what you read, record what you know that could help you meet the challenge. Next, record what you wonder that could help you meet the challenge. At the end of class, you will record what you learned today to help you meet the design challenge.
Design Challenge: The news has just reported an aircraft crashing into the ocean. As part of the search and recovery team, you need to recover the flight data recorder. It can provide key evidence in determining the cause of the aircraft loss. The design challenge is to engineer a model simulation of ocean currents and then estimate the location of a flight data recorder of a downed-at-sea aircraft. The ocean model will simulate the drift of a flight data recorder to an island based on ocean currents. Your team will have to manipulate currents to carry your flight data recorder onto two different islands. Your team will have hot water (yellow-dyed water) and cold water (blue-dyed water) to represent the conveyor belt. Using two syringes with tubes taped onto a tub of water, which represents the ocean, hot and cold water will be pumped into the tub to create the ocean currents.
KNOW WONDER LEARNED
Page 11

Currently Adrift
Appendix F: Water Density Inquiry Handout (Student Version)Name _____________________________
A) Demonstration: You saw a jar of hot water placed upside down over a jar of cold water. The hot water stayed on top of the cold water without mixing.
1. Why did the hot water stay on top of the cold water?
2. Why do you think the hot and cold water mixed when the cold water was placed on top?
B) Student Inquiry: Is there a density difference between hot and cold water?Procedure:1. Obtain the following materials for each group
• Cold water (colored blue) in foam cup• Hot water (colored yellow) in foam cup• Room-temperature water in clear plastic cup (colorless)• 2 droppers
2. Fill one dropper with blue cold water. Poke the end of the dropper about halfway into the colorless room-temperature water.3. While observing from the side, very gently squeeze the dropper so that the cold water slowly flows into the room-temperature water.4. Fill another dropper with yellow hot water. Poke the end of the dropper about halfway into the room-temperature water.5. While observing from the side, very gently squeeze the dropper so that the hot water slowly flows into the room-temperature water. 6. Record your observations on the activity sheet.
Data: 1. Draw what you observed in the cup of room-temperature water after adding blue cold water and yellow hot water.2. Label the areas of cold and hot water.
Page 12

Currently Adrift
Analysis: 1. Is cold water more, less, or the same density as room-temperature water?
2. Is hot water more, less, or the same density as room-temperature water?
Conclusion:1. Look at the model of water molecules in the diagram below to help you compare the volume, mass, and density of cold and hot water.
2. Write more, less, or same in the chart to describe the volume, mass, and density of cold and hot water compared to room temperature water.
Cold Water Hot WaterVolumeMass
Density
3. Why does cold water sink in room-temperature water?
Page 13

Currently Adrift
4. Why does hot water float on room-temperature water?
Extension: Your teacher did a demonstration with two cups of water that both had food coloring on the bottom. Ice was placed in one cup of water, but not the other. The food coloring mixed more quickly in the cup that had the ice. Use what you know about the density of water at different temperatures to explain why this happened.
From: Lesson 3.6: Temperature Affects Density. American Chemical Society. Web. 6 March 2015http://www.middleschoolchemistry.com/lessonplans/chapter3/lesson6
Page 14

Currently Adrift
Appendix G: Water Density Inquiry Handout (Teacher Version)Name _____________________________
A) Demonstration: You saw a jar of hot water placed upside down over a jar of cold water. The hot water stayed on top of the cold water without mixing.
1. Why did the hot water stay on top of the cold water?
The hot water stayed on top of the cold water because the hot water is less dense than the cold water.
2. Why do you think the hot and cold water mixed when the cold water was placed on top?
The hot and cold water mixed when the cold water was placed on top because the cold water is more dense than the hot water, so it immediately sank (or mixed) with the water below it.
B) Student Inquiry: Is there a density difference between hot and cold water?Procedure:1. Obtain the following materials for each group
• Cold water (colored blue) in foam cup• Hot water (colored yellow) in foam cup• Room-temperature water in clear plastic cup (colorless)• 2 droppers
2. Fill one dropper with blue cold water. Poke the end of the dropper about halfway into the colorlessroom-temperature water.3. While observing from the side, very gently squeeze the dropper so that the cold water slowly flows into the room-temperature water.4. Fill another dropper with yellow hot water. Poke the end of the dropper about halfway into the room-temperature water.5. While observing from the side, very gently squeeze the dropper so that the hot water slowly flows into the room-temperature water. 6. Record your observations on the activity sheet.
Data: 1. Draw what you observed in the cup of room-temperature water after addingblue cold water and yellow hot water.2. Label the areas of cold and hot water.
Page 15

Currently Adrift
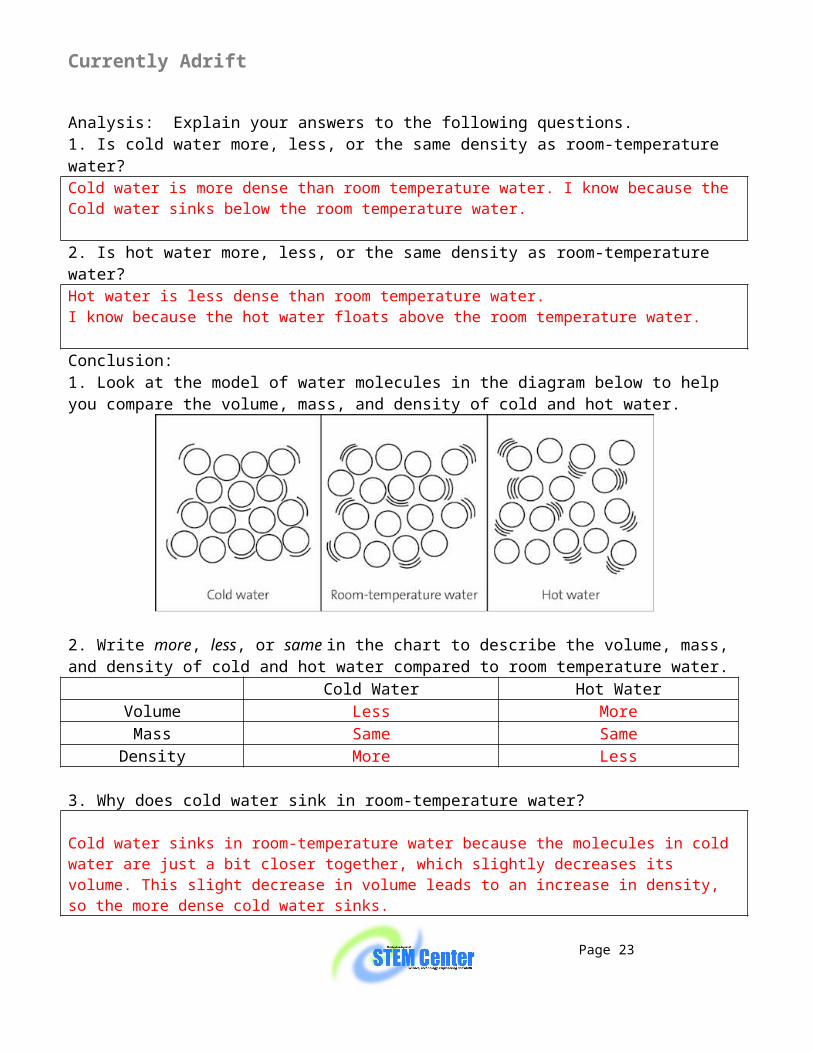
Analysis: Explain your answers to the following questions. 1. Is cold water more, less, or the same density as room-temperature water?Cold water is more dense than room temperature water. I know because theCold water sinks below the room temperature water.
2. Is hot water more, less, or the same density as room-temperature water?Hot water is less dense than room temperature water.I know because the hot water floats above the room temperature water.
Conclusion:1. Look at the model of water molecules in the diagram below to help you compare the volume, mass, and density of cold and hot water.
2. Write more, less, or same in the chart to describe the volume, mass, and density of cold and hot water compared to room temperature water.
Cold Water Hot WaterVolume Less MoreMass Same Same
Density More Less
3. Why does cold water sink in room-temperature water?
Cold water sinks in room-temperature water because the molecules in cold water are just a bit closer together, which slightly decreases its volume. This slight decrease in volume leads to an increase in density, so the more dense cold water sinks.
4. Why does hot water float on room-temperature water?
Hot water floats in room-temperature water because the molecules in hot water are just a bit further apart, which slightly increases its volume. This slight increase in volume leads to a decrease in density, so the less dense hot water floats.
Page 16

Currently Adrift
Extension: Your teacher did a demonstration with two cups of water that both had food coloring on the bottom. Ice was placed in one cup of water, but not the other. The food coloring mixed more quickly in the cup that had the ice. Use what you know about the density of water at different temperatures to explain why this happened.
The food coloring mixed more quickly in the cup containing ice because as the ice melted, the cold water sank to the bottom of the cup, agitating the food coloring, and causing it to mix with the rest of the water. The cup containing water but no ice did not have this extra mixing.
From: Lesson 3.6: Temperature Affects Density. American Chemical Society. Web. 6 March 2015http://www.middleschoolchemistry.com/lessonplans/chapter3/lesson6
Page 17

Currently Adrift
Appendix H: Engineering Design Process WheelName _____________________________
Page 18
Step 8:Redesign
Step 6:Test and evaluate
the solution(s)
Step 4:Select the best
possible solution(s)
Step 2: Research the Problem
Step 7: Communicate the
solution(s)
Step 5:Construct a prototype
Step 3:Develop possible
solutions
Step 1:Identify the
problem or need

Currently Adrift
Appendix I: Engineering Design Process Wheel Cover
Page 19

Currently Adrift
Appendix J: Student Handout for Engineering Design ChallengeName _____________________________
Team Members:
______________________________________________________________________For each trial, your team is responsible for performing the following steps:
Step 1: On a separate sheet of graph paper, show the starting location of your raft, where your team placed both the hot and cold tubing for your currents, and the location of your island. Please have your teacher check your island location before your team starts your trials. Also, list the trial number in the upper right hand corner of the graph paper.
Step 2: Before your trial, sketch the path (in red pen) your team predicts the raft will float on your graph paper.
Step 3: After your trial, sketch the path (in black pen) that your raft actually floated based on the current your team created on the graph paper.
Step 4: On the back of the graph paper, explain what happened to your raft. Why did it move the direction that it did based on your currents? Answer in complete sentences with a minimum of one paragraph.
Step 5: On the back of the graph paper, describe the changes your team will make on the next trial. Are you moving the locations of the tubes? Where are the tubes going, etc. Explain how these redesigns will change the results of your next trial.
Page 20

Currently Adrift
Appendix K: Design Challenge RubricTeam Members: ________________________________________
Objectives 4 3 2 1Use of Coordinate Plane:The team located the position of a nearby island on the coordinate grid
Students found the location on the first attempt without teacher assistance
Students found the location on the second attempt without teacher assistance
Students found the location on the second attempt but with teacher assistance
Students found the location of the island with teacher assistance
Video Evidence:The team videotaped trials of their engineering design challenge
Students recorded and saved every trial during their Engineering Design Challenge
Students recorded and saved at least 75% of their trials during their Engineering Design Challenge
Students recorded and saved at least 50% of their trials during their Engineering Design Challenge
Students recorded at least 1 of their trials for each island
Graphing:The team sketched their trials on a coordinate graph
After every trial, the students sketched out where the hot and cold water tubes were placed in the tub and approximated where the raft floated
After every trial, the students sketched out where the hot or cold water tubes were placed in the tub and approximated where the raft floated
In at least 50% of the trials, the students sketched out where the hot and cold water tubes were placed in the tub and approximated where the raft floated
In less than 50% of the trials, the students sketched out where the hot and cold water tubes were placed in the tub and approximate where the raft floated.
ORIn at least 50% of the trials, the students sketched out where the hot or cold water tubes were placed in the tub and approximated where the raft floated
Explanation of Results:The team explained the results of their trials
After every trial, the team explained the results of the trial in detail using at least one paragraph
After every trial, the team explained the results of the trial using at least two sentences but omitting important information
After every trial, the team listed a few of the results of their trial
In at least half of the trials, the students provided at least one detail about their trial.
Redesign:The team justified their next trial
Before each trial, the team described the changes they
Before each trial, the team described the changes they
Before at least 50% of the trials, the team described the
Before less than 50% of the trials, the team described
Page 21

Currently Adrift
made to the location of both the hot and cold tubes and predict the path the raft will float.
made to the location of both the hot and cold tubes or predict the path the raft will float. .
changes they made to the location of both the hot and cold tubes and predict the path the raft will float.
the changes they made to the location of both the hot and cold tube and predict the path the raft will float.
ORBefore at least 50% of the trials, the team will describe the changes they made of both the hot and cold tubes or predict the path the raft will float.
Final Map:The team mapped their “most successful” trial
Using the video of the team’s most successful trial, the team will correctly plot at least 5 points on the coordinate plane and connect the points showing the path of the black box with 100% accuracy.
Using the video of the team’s most successful trial, the team will correctly plot at least 5 points on the coordinate plane and connect the points showing the path of the black box with at least 75% accuracy.
Using the video of the team’s most successful trial, the team will correctly plot at least 5 points on the coordinate plane and connect the points showing the path of the black box with at least 50% accuracy.
Using the video of the team’s most successful trial, the team will correctly plot at least 5 points on the coordinate plane and connect the points showing the path of the black box with less than 50% accuracy or the points are not connected to show the path of the black box.
Use of Scale:The team used a given scale to calculate an actual distance based on their model.
The students applied the scale to find the actual distance and time relative to the starting location of the raft at 100% accuracy. The students showed all calculations to support their answers.
The students applied the scale to find the actual distance and time relative to the starting location of the raft with at least 75% accuracy. The students showed all calculations to support their answers.
The students applied the scale to find the actual distance and time relative to the starting location of the raft at least 50% accuracy. The students showed all calculations to support their answers.
The students applied the scale to find the actual distance relative to the starting location of the raft at less than 50% with calculations to support their answers.
ORThe students applied the scale to find the actual distance relative to the starting point with at least 50% accuracy but without calculations to support their answers.
Page 22
Currently Adrift
Page 23

Currently Adrift
Appendix L: Coordinate Plane Graph Paper Information
To print graph paper in various sizes, go to https://incompetech.com/graphpaper/plain/ to generate the size needed to be below the box. You can print smaller individual pieces together or copy onto 11x17 (ledger) paper. This can be done and then laminated to allow for multiple uses of the same paper as the students are video-taping their boats movements.
***Note: when importing the PDF, it resized to fit on the page. If you double-click on the PDF image, it will open a PDF of the correct-sized document for printing purposes.
PDF for 11x17: PDF for 8.5 x11
PDF for 8.5 x 14
Page 24

Currently AdriftAppendix M: First Trial Exit Ticket
Name _____________________________
Team Members: ______________________________________________________________________
Using the box below to represent your team’s tub, label the approximate location of your team’s “nearby” island. Next, show the location of where you plan to locate the two tubes. Make sure that you label which tube is for the hot water and which tube is for the cold water. Also, make sure that you give measurements of the tube’s location, for example the tube is ½ inch from the bottom of the tub and located along the top side 3 inches from the right side of the tub. The dimensions do not need to be to scale.
Explain why you chose these locations for both tubes. Show the path that your team feels the black box will take. Explain in detail your reasoning (use the back if necessary).
Page 25

Currently Adrift
Appendix N: List of Locations
List of Possible LocationsTeacher Resource
Location Description Point
1 2 miles East, 2.5 miles North (4, 5)
2 3 miles East, 0.5 miles North (6, 2)
3 6 miles East, 5 miles North (12, 10)
4 7 miles East, 6 miles North (14, 12)
5 2 miles East, 7.5 miles North (4, 15)
6 4 miles West, 5 miles North (-8, 10)
7 6 miles West, 2 miles North (-12, 4)
8 3.5 miles West, 6 miles North (-7, 12)
9 9 miles West, 10 miles North (-18, 20)
10 7.5 miles West, 7.5 miles North (-15, 15)
11 3 miles East, 3.5 miles South (6, -7)
12 5 miles East, 7.5 miles South (10, -15)
13 4 miles East, 5 miles South (8, -10)
14 9 miles East, 10 miles North (18, 20)
15 2.5 miles East, 7.5 miles South (5, -15)
16 4 miles West, 5 miles South (-8, -10)
17 6 miles West, 7.5 miles South (-12, -15)
18 10 miles West, 1.5 miles South (-20, -3)
19 7.5 miles West, 2.5 miles South (-15, -5)
20 8.5 miles West, 10 miles South (-17, -20)
Page 26

Currently Adrift
Appendix O: Mapping Handout for Engineering Design Challenge
Team members:
___________________________________________________________________________
After all your team’s trials to land on both the nearby islands, perform the following steps:
Step 1: Using the video recording of your team’s “most successful” trial, plot the location of the black box/flight recorder 5 different times throughout the trial. Make sure that these five different points are spread throughout the entire trial. Use a stopwatch or another cell phone to determine the time from the start of the trial. Connect the points on your graph with a smooth curve. List the time and ordered pair of each of the five location points. See example below.
Page 27

Currently Adrift
Step 2: Using the scales ¼ inch = ½ mile and 1 second = 12 hours, calculate the position and time of the black box/flight recorder relative to its initial location for each of the 5 location points. For example, after 24 hours the raft was at 2 miles East and 3.25 miles North of the raft initial position. Show all calculations on a separate sheet of paper and attach them to the graph of your “most successful” trial. Below is an example of the first 3 location points after the crash using the graph in step 1.
Step 3: Paper clip all your team’s two graphs (one for each most successful trial) and work. Place this sheet on top and hand in to your teacher.
Page 28

Currently Adrift
Appendix P: The Great Ocean Conveyor Belt Simulation ExperienceName _____________________________
Task 1: DirectionsGo to: http://ocp.ldeo.columbia.edu/climatekidscorner/nemo_page.shtm
This little clownfish, , was caught in the Great Barrier Reef, , northeast of Australia. He was sold and flown to New York City. He has just escaped and jumped into the Atlantic Ocean. Help him get back home! His only chance is to swim with the ocean currents back to his home in the Coral Sea.
1. Start on the Gulf Stream arrow below the picture of little clownfish.2. Trace along the currents in the direction indicated by the arrows.3. You should end up in the Coral Sea, EAST of Australia, not in the Indian Ocean, WEST
of Australia.4. Remember that the earth is really a sphere, and when an arrow points off the right side,
it pops right back in on the left side!5. How long do you think it would take the clownfish to get home?
Task 2: Directions
Go to: http://spaceplace.nasa.gov/ocean-currents/en/
1. Read through the text, look at the animation, view the video clip and read through the directions for the game.
2. Play the game.
Task 3: Reflection
1. Complete the attached 3.2.1. Exit ticket based on these two experiences.
Page 29

Currently Adrift
Appendix Q: 3-2-1 Exit TicketName __________________________________
Three things you learned:
1. ______________________________________________________________________
______________________________________________________________________
______________________________________________________________________
2. ______________________________________________________________________
______________________________________________________________________
______________________________________________________________________
3. ______________________________________________________________________
______________________________________________________________________
______________________________________________________________________
Two things that interest you that you’d like to learn more about:
1. ______________________________________________________________________
2. ______________________________________________________________________
One question you still have:
1. ___________________________________________________________________
Page 30

Currently Adrift
Appendix R: Investigative Process Career Connections Go Team NTSB
The Investigative Process
The National Transportation Safety Board was established in 1967 to conduct independent investigations of all civil aviation
accidents in the United States and major accidents in the other modes of transportation. It is not part of the Department of
Transportation, nor organizationally affiliated with any of DOT's modal agencies, including the Federal Aviation Administration.
The Safety Board has no regulatory or enforcement powers.
To ensure that Safety Board investigations focus only on improving transportation safety, the Board's analysis of factual
information and its determination of probable cause cannot be entered as evidence in a court of law.
The NTSB "Go Team"
At the core of NTSB investigations is the "Go Team." The purpose of the Safety Board Go Team is simple and effective: Begin
the investigation of a major accident at the accident scene, as quickly as possible, assembling the broad spectrum of technical
expertise that is needed to solve complex transportation safety problems.
The team can number from three or four to more than a dozen specialists from the Board's headquarters staff in Washington,
D.C., who are assigned on a rotational basis to respond as quickly as possible to the scene of the accident. Go Teams travel
by commercial airliner or government aircraft depending on circumstances and availability. Such teams have been winging to
catastrophic airline crash sites for more than 35 years. They also routinely handle investigations of certain rail, highway, marine
and pipeline accidents.
During their time on the "duty" rotation, members must be reachable 24 hours a day by telephone at the office or at home, or
by pager. Most Go Team members do not have a suitcase pre-packed because there's no way of knowing whether the
accident scene will be in Florida or Alaska, but they do have tools of their trade handy -- carefully selected wrenches,
screwdrivers and devices peculiar to their specialty. All carry flashlights, tape recorders, cameras, and lots of extra tape and
film.
The Go Team's immediate boss is the Investigator-in-Charge (IIC), a senior investigator with years of NTSB and industry
experience. Each investigator is a specialist responsible for a clearly defined portion of the accident investigation. In aviation,
these specialties and their responsibilities are:
OPERATIONS: The history of the accident flight and crewmembers' duties for as many days prior to the crash as appears
relevant.
STRUCTURES: Documentation of the airframe wreckage and the accident scene, including calculation of impact angles to
help determine the plane's pre-impact course and attitude.
Page 31

Currently Adrift
POWERPLANTS: Examination of engines (and propellers) and engine accessories.
SYSTEMS: Study of components of the plane's hydraulic, electrical, pneumatic and associated systems, together with
instruments and elements of the flight control system.
AIR TRAFFIC CONTROL: Reconstruction of the air traffic services given the plane, including acquisition of ATC radar data and
transcripts of controller-pilot radio transmissions.
WEATHER: Gathering of all pertinent weather data from the National Weather Service, and sometimes from local TV stations,
for a broad area around the accident scene.
HUMAN PERFORMANCE: Study of crew performance and all before-the-accident factors that might be involved in human
error, including fatigue, medication, alcohol. Drugs, medical histories, training, workload, equipment design and work
environment.
SURVIVAL FACTORS: Documentation of impact forces and injuries, evacuation, community emergency planning and all
crash-fire-rescue efforts.
Under direction of the IIC, each of these NTSB investigators heads what is called a "working group" in one area of expertise.
Each is, in effect, a subcommittee of the overall investigating team. The groups are staffed by representatives of the "parties"
to the investigation (see the next section - The Party System) - the Federal Aviation Administration, the airline, the pilots' and
flight attendants' unions, airframe and engine manufacturers, and the like. Pilots would assist the operations group;
manufacturers' experts, the structures, systems and power plants groups; etc. Often, added groups are formed at the accident
scene - aircraft performance, maintenance records, and eyewitnesses, for example. Flight data recorder and cockpit voice
recorder teams assemble at NTSB headquarters.
In surface accident investigations, teams are smaller and working groups fewer, but the team technique is the same.
Locomotive engineers, signal system specialists and track engineers head working groups at railroad accidents. The
specialists at a highway crash include a truck or bus mechanical expert and a highway engineer. The Board's weather, human
performance and survival factors specialists respond to accidents of all kinds.
At least once daily during the on-scene phase of an investigation, one of the five Members of the Safety Board itself, who
accompanies the team, briefs the media on the latest factual information developed by the team. While a career investigator
runs the inquiry as Investigator-in-Charge, the Board Member is the primary spokesperson for the investigation. A public affairs
officer also maintains contact with the media. Confirmed, factual information is released. There is no speculation over cause.
At major accidents, transportation disaster assistance specialists also accompany the team to fulfill the Board's responsibilities
under the Aviation Disaster Family Assistance Act of 1996 and the Rail Passenger Disaster Family Assistance Act of 2008.
See the Disaster Assistance section of the NTSB' web site for details on this activity.
Page 32

Currently Adrift
The individual working groups remain as long as necessary at the accident scene. This varies from a few days to several
weeks. Some then move on - power plants to an engine teardown at a manufacturer or overhaul facility; systems to an
instrument manufacturer's plant; operations to the airline's training base, for example. Their work continues at Washington
headquarters, forming the basis for later analysis and drafting of a proposed report that goes to the Safety Board itself perhaps
12 to 18 months from the date of the accident. Safety recommendations may be issued at any time during the course of an
investigation.
Aviation Go Teams respond only to accidents that occur on U.S. territory or in international waters. Elsewhere, the investigator
is the government in whose territory the accident occurs, usually assisted by a U.S. "accredited representative" from the
NTSB's staff of IICs if a U.S. carrier or U.S. manufactured plane is involved.
The Party System
The Board investigates about 2,000 aviation accidents and incidents a year, and about 500 accidents in the other modes of
transportation - rail, highway, marine and pipeline. With about 400 employees, the Board accomplishes this task by leveraging
its resources. One way the Board does this is by designating other organizations or companies as parties to its investigations.
The NTSB designates other organizations or corporations as parties to the investigation. Other than the FAA, which by law is
automatically designated a party, the NTSB has complete discretion over which organizations it designates as parties to the
investigation. Only those organizations or corporations that can provide expertise to the investigation are granted party status
and only those persons who can provide the Board with needed technical or specialized expertise are permitted to serve on the
investigation; persons in legal or litigation positions are not allowed to be assigned to the investigation. All party members
report to the NTSB.
Eventually, each investigative group chairman prepares a factual report and each of the parties in the group is asked to verify
the accuracy of the report. The factual reports are placed in the public docket.
Investigations Involving Criminal Activity
In cases of suspected criminal activity, other agencies may participate in the investigation. The Safety Board does not
investigate criminal activity; in the past, once it has been established that a transportation tragedy is, in fact, a criminal act, the
FBI becomes the lead federal investigative body, with the NTSB providing any requested support.
One example would be the crash of a Pacific Southwest Airlines flight in San Luis Obispo, California on December 7, 1987. All
43 persons aboard died in the crash of the Bae-146. Because of information conveyed over the radio by the flight crew shortly
before the crash, the FBI instituted its own investigation, parallel to the Safety Board's investigation, to determine if a crime had
been committed. Within days, it was learned that a former employee of the airline had boarded the plane with a gun and, while
the plane was in cruise flight, had shot the flight crew, causing the aircraft to crash. When that was made evident, the FBI
assumed control of the investigation.
Page 33

Currently Adrift
More recently, on September 11, 2001, the crashes of all four airliners were obviously the result of criminal actions and the
Justice Department assumed control of the investigations. The NTSB provided requested technical support.
As the result of recent legislation, the NTSB will surrender lead status on a transportation accident only if the Attorney General,
in consultation with the Chairman of the Safety Board, notifies the Board that circumstances reasonably indicate that the
accident may have been caused by an intentional criminal act.
Safety Recommendations
Safety recommendations are the most important part of the Safety Board's mandate. The Board must address safety
deficiencies immediately, and therefore often issues recommendations before the completion of investigations.
Recommendations are based on findings of the investigation, and may address deficiencies that do not pertain directly to what
is ultimately determined to be the cause of the accident.
For example, in the course of its investigation of the crash of TWA flight 800, once it was determined that an explosion in the
center fuel tank caused the breakup of the aircraft, the Board issued an urgent safety recommendation and three other
recommendations in 1996, four years before completion of its investigation, that were aimed at eliminating explosive fuel/air
vapors in airliner fuel tanks. The Board issued an additional recommendation in 1997 regarding the detection of explosives and
six recommendations in 1998 to improve fuel quantity indication systems. When the Board issued its final report on the TWA
800 accident in 2000, four additional safety recommendations were issued that focused on the aircraft wiring systems.
Public Hearing
The Board may hold a public hearing as part of a major transportation accident investigation. The purpose of the hearing is
two-fold; first, to gather sworn testimony from subpoenaed witnesses on issues identified by the Board during the course of the
investigation, and, second, to allow the public to observe the progress of the investigation. Hearings are usually held within six
months of an accident, but may be delayed for complex investigations.
The Remainder of the Investigation and Final Report
More months of tests and analysis eventually lead to the preparation of a draft final report by Safety Board staff. Parties do not
participate in the analysis and report writing phase of NTSB investigations; however, they are invited to submit their proposed
findings of cause and proposed safety recommendations, which are made part of the public docket. The Board then deliberates
over the final report in a public Board meeting in Washington, D.C. Non-Safety Board personnel, including parties and family
members, cannot interact with the Board during that meeting.
Once a major report is adopted at a Board Meeting, an abstract of that report - containing the Board's conclusions, probable
cause and safety recommendations - is placed on the Board's web site under "Publications". The full report typically appears
on the web site several weeks later.
Page 34

Currently Adrift
Appendix S: Let’s Dive in Career Research Note-Taking Guide
Name: ________________________________
Career TitleAnd Specialty
Description
Education
Income
Important Skills
Page 35

Currently Adrift
Appendix T: PSA Career Poster Assignment
Using PowerPoint or Google Slides, create one slide for the PSA Career Poster for one of your career connections that you have learned about during your teamwork. Please read the tips below and as a team choose one career that you have been interested in as you have been working through your STEM Challenge. Your team will have a Poster Checklist and Rubric to guide you.
If the viewer of your poster carries away only one idea, ask yourself: “What do I want it to be?” Now write down your answer. Your answer will become the theme and focal point of your poster. Everything you include on your poster should support that theme.
Keep your poster simple and uncluttered. White space provides a frame for your material and makes components
stand out. Remember, though, that too much white space can cause the viewer's eye to wander, while too little can cause confusion.
Limit your poster’s content to a few main ideas. Arrange your poster’s components to read from left to right and from top to
bottom. Make connections between the text and the graphics. Emphasize important points with lines, frames, boxes, or arrows. Keep the lettering simple.
Page 36

Currently Adrift
Appendix U: PSA Career Poster Checklist
Criteria Requirement √Purpose Sells a Career Choice
Promotes InterestCharacteristics Tells the story quickly
Is attention-gettingMakes use of striking colorConvincing, informative, and accurateSimple to interpret
Components Contains a titleLists authorsContains an imageContains a logoIncorporates a catch career slogan
Page 37

Currently Adrift
Appendix V: PSA Career Poster RubricObjective Level 1 Level 2 Level 3 Level 4Graphics Clarity
Many graphics are not clear or are too small.
Most graphics are in focus and the content easily viewed and identified from 1m away.
Most graphics are in focus and the content easily viewed and identified from 2m away.
Graphics are all in focus and the content easily viewed and identified from 2m away.
Graphics Relevance
Graphics do not relate to the topic OR several borrowed graphics do not have a source citation.
Some graphics relate to the topic. Most borrowed graphics have a source citation.
All graphics are related to the topic and most make it easier to understand. All borrowed graphics have a source citation.
All graphics are related to the topic and make it easier to understand. All borrowed graphics have a source citation.
Labels Labels are too small to view OR no important items were labelled.
Several items of importance on the poster are clearly labelled with labels that can be read from at least 1 m away.
Almost all items of importance on the poster are clearly labelled with labels that can be read from at least 1 m away.
All items of importance on the poster are clearly labelled with labels that can be read from at least 1 m away.
Content Student appears to have insufficient knowledge about the facts or processes used in the poster.
Student can accurately answer about 75% of questions related to facts in the poster and processes used to create the poster.
Student can accurately answer most questions related to facts in the poster and processes used to create the poster.
Student can accurately answer all questions related to facts in the poster and processes used to create the poster.
Attractiveness The poster is distractingly messy or very poorly designed. It is not attractive.
The poster is acceptably attractive though it may be a bit messy.
The poster is attractive in terms of design, layout, and neatness.
The poster is exceptionally attractive in terms of design, layout, and neatness.
Title The title is too small and/or does not describe the content of the poster well.
Title can be read from 1 m away and describes the content well.
Title can be read from 2 m away and describes content well.
Title can be read from 2 m away and is quite creative.
Comments:
Page 38

Currently Adrift
Appendix W: Poster Sample
Page 39

Currently Adrift
Appendix X: Plane Down: Missing Flight Recorder Handout
Name _____________________________
Research and Presentation Requirements
Now that you have discovered how the ocean conveyor belt works, your next task is to pinpoint the location of a missing flight recorder/black box. In addition, you will be communicating your results from your Engineering Design Challenge, by providing a video, your mapping results, important calculations, and your results.
Your assigned flight: __________________________________________
Presentation Requirements● 5-7 minute presentation● Collaborative Presentation Program (Prezi, Google Doc, etc.)
○ From Engineering Design Challenge■ 10-30 second video of your most successful raft drifting simulation■ Calculations■ Team’s mapping results, with explanations
○ From Plane Down: Missing Flight Recorder■ Background information on Flight■ Map depicting downed location of plane and predicted location of
flight recorder■ Name and discuss impact of currents in location and how they
impacted your predicted location
Our next steps:
Page 40

Currently Adrift
Appendix Y: List of Unrecovered Flight Recorders
List of Unrecovered Flight Recorders(as adapted from https://en.wikipedia.org/wiki/List_of_unrecovered_flight_recorders)
1. Siberia Airlines Flight 1812; crashed 10/4/20012. Iran Air Flight 655; crashed 7/3/19883. Korean Air Flight 858; crashed 11/29/19874. South African Airways 295; crashed 11/28/19875. Varig aircraft cargo; crashed 1/30/19796. Pan American World Airlines 816;crashed 7/22/19737. ALM 980; crashed 5/2/1970
Page 41

Currently Adrift
Appendix Z: Presentation Rubric
Criteria 4 3 2 1
Content Team shows full understanding of the
topic.
Team shows a good understanding of the topic with 1-2 minor
misconceptions.
Team shows a good understanding of parts of the topic with 3 or
more misconceptions.
Team shows little to no understanding of
the topic
Comprehension Team is able to accurately answer all questions posed by
classmates or teacher about the
topic.
Team is able to answer most
questions posed by classmates or teacher
about the topic.
Team is able to answer few questions posed by classmates or teacher about the
topic.
Tean is not able to answer questions
posed by classmates or teacher about the
topic.
Vocabulary Team uses vocabulary
appropriate for the audience and topic.
Team uses mostly appropriate
vocabulary for the audience and topic.
Team uses some appropriate
vocabulary and shows flawed understanding
in key terms.
Team does not use appropriate
vocabulary and shows flawed
understanding in key terms.
Preparedness Team is completely prepared.
Team is mostly prepared.
Team is somewhat prepared.
Team is not prepared.
Speaks Clearly Team members speak clearly and
distinctly while making eye contact
with audience.
Team members speak clearly and distinctly
while making eye contact with audience.
Team members speak somewhat clearly and
distinctly or makes some eye contact with
audience.
Team members do not speak clearly and
distinctly or makes no eye contact with
audience.
Page 42

Currently Adrift
Appendix AA: Self/Peer/Team Reflection
TEAM MEMBERS:__________________________________________________
Please rate your contribution to the group and then evaluate the team on a scale from 1 – 10 with 10 being the highest.
INDIVIDUAL EVALUATION: Name______________________
____1. Thought critically ____6. Actively listened
____2. Followed my Career Expectations ____7. Used all steps of design process
____3. Selected and used thinking skills ____8. Applied redesign skills
____4. Worked well as a team ____9. Stayed on task and met deadlines
____5. Respected diverse perspectives ____10. Produced a quality product
I could improve on__________________________________________________________________
________________________________________________________________________________.
I rank my contributions to the group as__________ because_________________________________
________________________________________________________________________________.
TEAM EVALUATION:
____1. Thought critically ____6. Actively listened
____2. Followed career expectations ____7. Used all steps of design process
____3. Selected and used thinking skills ____8. Applied redesign skills
____4. Worked well as a team ____9. Stayed on task and met deadlines
____5. Respected diverse perspectives ____10. Produced a quality product
I rank our team’s efforts at working together as______ because______________________________
________________________________________________________________________________
Draft: 5/12/2023 Page 43

Currently AdriftPEER EVALUATION:
Rank each individual group member using a scale of 1 – 10. Explain your reasons for the assigned ranking. Please elaborate in the blank space below, if needed.
Page 44
Team Member and Career Ranking Explanation