db infrastructure challenge - team splunk
TRANSCRIPT

Hello Data Geeks,
Last weekend Deutsche Bahn in Germany invited to their Deutsche Bahn goes 4.0
Hackaton over the weekend. The concept was „We provide data, you innovate“.
Splunk participated with a team and got their hands dirty digging down into a
labyrinth to analyze 10 GB infrastructure Data. The challenge was tough: starting at
5pm they spend 24 hours over night to solve the problem. After the presentation of
their results a jury of DB awarded the first price to Team Splunk.

There have been three challenges they were given including questions that needed
to be answered:
# challenge description
1 Track position defect
A deviation from the original track position in horizontal or vertical direction or
a deviation of the tracks altitude. Such defects may occur during the construction
or by transformation of the track bed.
Is it possible to extract reasons for the appearance of track position defects from
the given data? Could you even think about building a model which illustrates
correlations in this context? What are the reasons and possible models?
Are track position defects and the development of these defects predictable
before they occur? Which correlations are recognizable between these defects
and the used technology (e.g. wooden vs. concrete railroad ties) or weather
conditions? Is there a link between indication notifications (Befundmeldungen)
and disfunction notifications (Störmeldungen).
2 Construction work impact
There are dependencies between the various network segments in complex
network industries by:
diversions through other sections are required and
multiple impacts of more than one construction works on route of long distance
trains.
It’s the challenge to visualize the function and the dependencies of network
sections by analyzing the construction works and their timetable changings of
several years. In addition to sections that cause particularly many diversions,
delays or diversion routes need to be identified and characterized graphically.
In addition, the impact of construction sites are to be displayed graphically
(network graphics or charts).
3 Use the data for anything you have on your mind ...
without any barriers. Create an app., conduct an intelligent analysis. Surprise
with innovative, outstanding solutions we are not aware of.
The team onboarded a lot of heterogeneous data including data for geographical
classification, data for tracks and points, level crossings, electrical equipment,
bridges, tunnels and passages, orders, construction equipment, earthworks and
retaining structures, telecommunication facilities, signaling construction, catenary
system, machine techniques, conductor rail, MakSi-FM (construction works in
tracks, time table changes etc.) and data for defects in tracks.
The Splunk Team of Philipp, Robert and Niko really enjoyed the Hackaton and
thanks Deutsche Bahn for hosting such a great event.
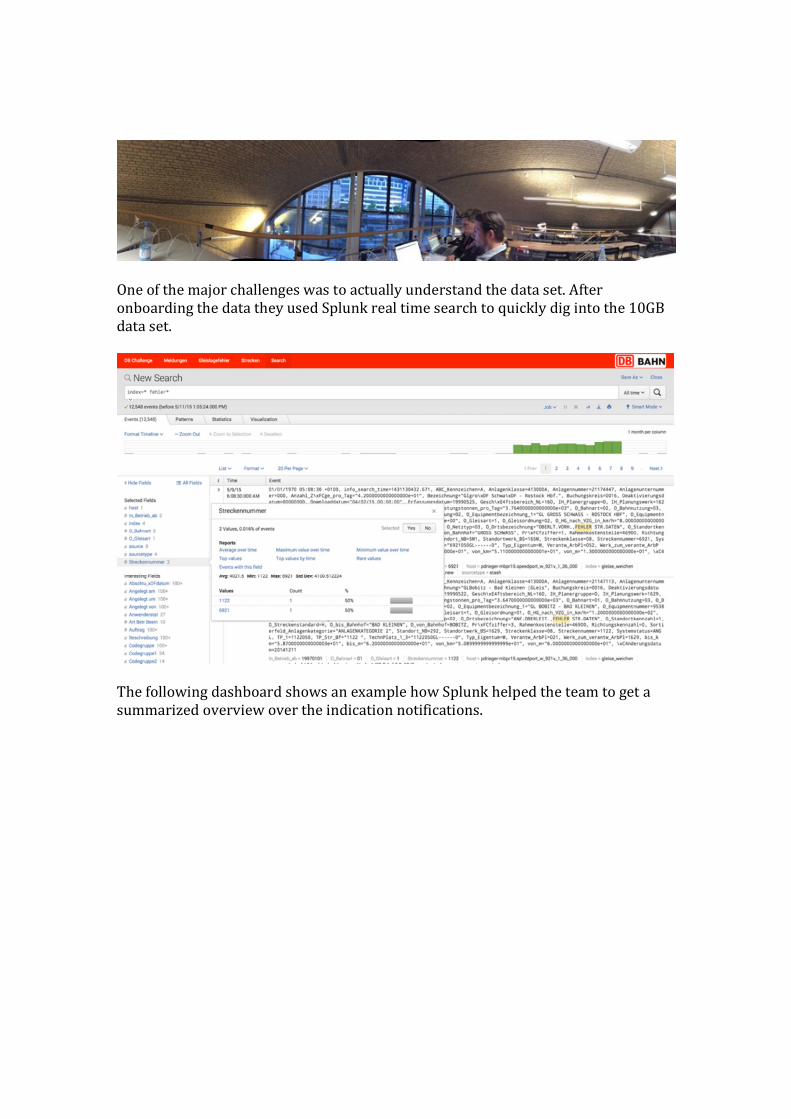
One of the major challenges was to actually understand the data set. After
onboarding the data they used Splunk real time search to quickly dig into the 10GB
data set.
The following dashboard shows an example how Splunk helped the team to get a
summarized overview over the indication notifications.

After a first glance at the data they explored ideas and possibilities of additional data
like earthquakes and weather data to add value from external data sources. By
mapping geoinformation into Splunk they showed which tracks are electrified or
run by fuel in different regions.
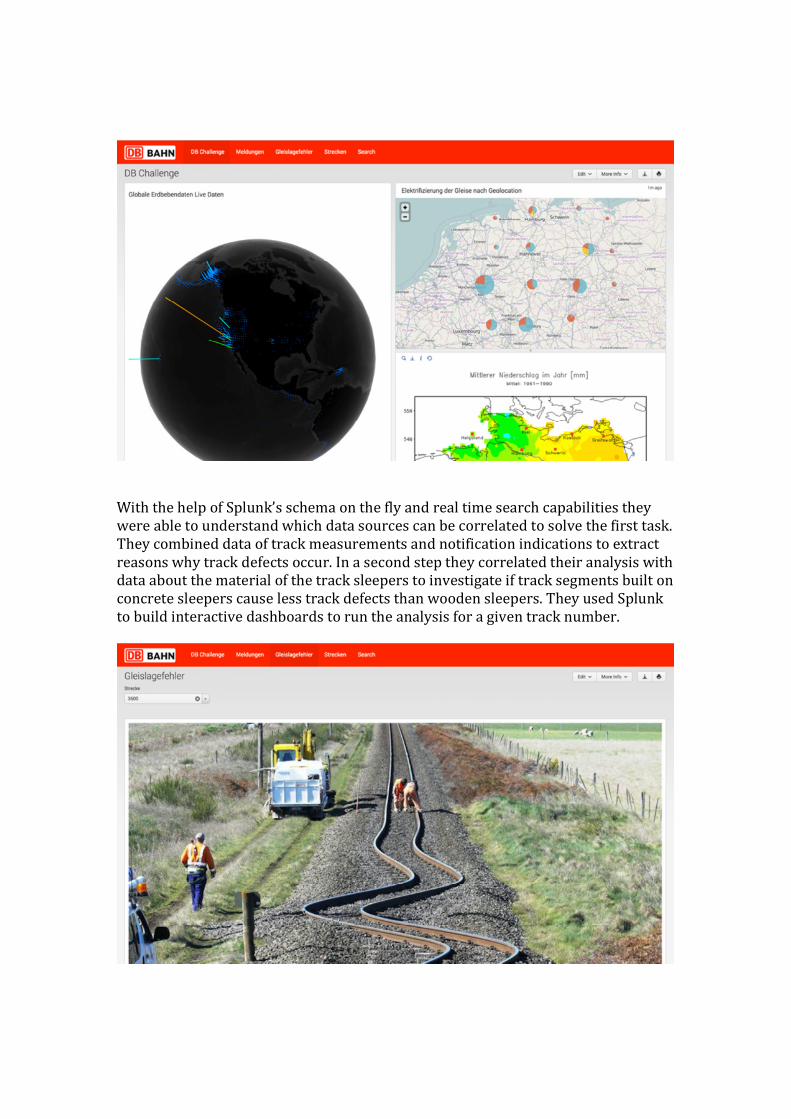
With the help of Splunk’s schema on the fly and real time search capabilities they
were able to understand which data sources can be correlated to solve the first task.
They combined data of track measurements and notification indications to extract
reasons why track defects occur. In a second step they correlated their analysis with
data about the material of the track sleepers to investigate if track segments built on
concrete sleepers cause less track defects than wooden sleepers. They used Splunk
to build interactive dashboards to run the analysis for a given track number.

The stacked charts show different deviation types and how they correlate to the
material. Leveraging a visual analytics approach they found out that there is a
correlation of local maxima of track deviations and track segments with wooden
sleepers:
Finally they aggregated the measurements and found out that concrete track
sleepers result in 18% less track defects compared to wooden sleepers for the
whole data set. This supports the fact that concrete has a longer life cycle than
wood. As a result Deutsche Bahn could use this analysis to determine which parts of
their tracks could be renewed with a material that is more resistant to natural
erosion.

In a second part they analysed the occurrence of track defects for given connections
between cities. The Splunk team picked the major hub Frankfurt to investigate the
track deviations on the connections around. By visualizing the connections in a
senkey diagram they quickly found out that the connection between Fulda and
Frankfurt has high deviations which was confirmed by experts from Deutsche Bahn
at the hackathon.
After a sleepless night and 24h hard work, the Splunk team presented their results
to the jury and the audience. The success criteria were usability, potential business
value, creativity and the quality of demo and presentation. In all aspects they
convinced the jury and won 1st place. Splunk clearly showed their flexibility to
analyze the data set and solve the tasks using Splunk as a platform for
heterogeneous infrastructure data. And just imagine they had another 24 hours…