debt reclassifications under revolving facilities ... · debt reclassifications under revolving...
TRANSCRIPT

Debt Reclassifications under Revolving Facilities: Determinants and
Real Impact*
Xin Chang
Nanyang Business School
Nanyang Technological University
Yunling Chen
Department of Finance
Hong Kong University of Science and Technology
Sudipto Dasgupta#
Department of Finance
Hong Kong University of Science and Technology
This draft: March 2009
* An updated version of this paper will be available in 2 months. We thank Amir Sufi for making the lines of credit data available on his Web site. Chang acknowledges financial support from Academic Research Fund Tier 1 provided by Ministry of Education (Singapore) under grant numbers SUG FY08, M58010006. # Corresponding author. Department of Finance, Hong Kong University of Science and Technology, Clear Water Bay, Kowloon, Hong Kong. E-mail: [email protected]. Tel: 852-2358-7685. Fax: 852-2358-1749.
1

Debt Reclassifications under Revolving Facilities: Determinants and Real Impact
ABSTRACT
Using a hand-collected sample of 15,000 firm-years over the period 1993-2005, we empirically examine the factors that determine the decision of firms to reclassify existing or new short-term debt as long-term debt. On average, 33% of the firms reclassify short-term debt as long-term debt each year. Almost all reclassifications are done under a “revolving credit facility” or line of credit. Debt reclassifications indicate intent by firms to roll over their short-term debt on a long-term basis, and therefore, represent a particular way in which firms use their credit lines. In our sample, among firms that reclassify short-term debt, the average percentage of reclassified debt to total debt is 40%. We show that debt reclassifications occur when firms have major investment projects, market conditions are not favorable for equity and long-term debt issuance, and firms face refinancing risk. Firms that reclassify overcome the financing frictions and achieve significantly higher sales and asset growth, and invest more in both fixed assets and working capital. Consistent with the idea that firms face tighter financial constraints around periods of reclassification than expected future constraints, we find that the cash flow-sensitivity of investment increases and that of cash holdings decreases at the time of debt reclassification. JEL classification: G31, G32 Keywords: Debt Reclassification, Lines of Credit, Revolving Facilities, Capital Structure, Investments
2

1. Introduction
The importance of bank lines of credit in firms’ liquidity management has been
highlighted in recent research. Sufi (2007) finds that 75% of firms in his sample have
bank lines of credit, amounting to an average of 16% of book assets. Bank lines of credit
are a substitute for cash holdings in mitigating adverse liquidity shocks. Firms prefer
lines of credit to holding cash as they become more profitable, presumably because lines
of credit typically have cash flow-based covenants that might be violated by firms with
poor profitability.
In this paper, we focus on a specific use of lines of credit or revolving credit
facilities – namely, debt reclassifications. Debt reclassification is the practice of
classifying short-term debt as long term debt when firms intend to roll-over such debt on
a long term basis, and have the ability to do so.1 Reclassifications are almost always done
under a line of credit or a revolving credit facility. We find that in a sample of 15,000
firm-years over the period 1993-2005, in each year, on average, 33% of the firms with
lines of credit reclassify existing or new short-term debt as long-term debt. 2 The
percentage of firms that reclassify short-term debt increases through the nineties and
peaks at around 40% in the years 1999 and 2000, and falls to an average of 27% in the
five years after the 2001 recession. Among the firms that reclassify short-term debt, the
percentage of reclassified debt to total debt over our sample period is 40%, and shows a
similar time trend.
1 Statement of Financial Accounting Standard (SFAS) no. 6. 2 We are able to verify the availability of lines of credit on a sub-sample of 8,500 firms over the 1996-2003 period available from Amir Sufi’s website. For this sub-sample, almost all the firms that reclassify debt have available lines of credit.
3

We find that the reclassifications mostly involve reclassifications of short-term
debt to medium term debt of maturity between 3 to 5 years. Importantly, firms often
reclassify new short-term debt. In 22% of the firm years in which firms report having any
debt that has been reclassified in the previous year, the outstanding amount of reclassified
debt exceeds the level reported in the previous year plus debt that would have matured at
the end of that year and the year after, implying that there must be new short-term debt
being reclassified as long term debt. Among firms that start to reclassified debt, i.e., do
not have reclassified debt in the previous year but do have some in the current year, this
percentage increases to 62%.
Reclassifiers are firms in need of liquidity but are not firms in financial distress.
Consistent with Sufi’s (2007) evidence, more profitable firms are more likely to
reclassify – but the effect of profitability on the likelihood of reclassification is present
even among firms with existing lines of credit and even when the existence of credit lines
is modeled as an endogenous decision. Reclassifications typically start after periods of
high growth, and coincide with years in which firms have spikes in acquisition activity
and capital expenditures. Firms with higher asset growth are more likely to reclassify, but,
their market-to-book ratios (as well as stock returns) are lower. Reclassifiers also have
high debt ratios prior to reclassification – especially long-term debt. This suggests that
weak equity market conditions and either reluctance or inability to issue additional long-
term debt, combined with an immediate need to invest, are important reasons for firms to
reclassify. Reclassifiers also have lower liquidity ratios, which is consistent with the
evidence that firms draw down their cash reserves as they pursue high-growth strategies.
Therefore, firms reclassifying short-term debt are achieving at least two objectives: at a
4

time when they have a need for funds (and debt and equity market conditions are not
favorable), they are reducing the risk of refinancing short-term debt by utilizing their
revolving loan facilities, and they are also reducing the possibility of violating liquidity-
based covenants by removing short-term debt from their balance sheets.
Reclassification is somewhat persistent – half of the firms that reclassify in a
given year also have reclassified debt five years later. We find an interesting - and
consistent - contrast in the characteristics of firms that start reclassification and those that
end reclassification. Firms are more likely to end reclassification when their growth slows,
when they become less profitable, when their liquid reserves improve, and when their
stock returns are higher – precisely the opposite characteristics of firms that start
reclassifications.
We find that firms are also more likely to reclassify and reclassify larger amounts
when the term spread decreases, and returns in the overall stock market are lower. Lower
term spreads are supposed to be precursors of weak economic conditions, which are not
ideal for long-term debt, or short-term debt without the back-up of bank lines of credit.
The term spread is highly negatively correlated in our sample period with the credit
spread, a measure of default risk. 3 The importance of overall equity market conditions in
explaining the reclassification decisions confirms that reclassifications, to some extent,
reflect firms’ desire to avoid equity financing when conditions for equity issuance are not
favorable. Firms also favor reclassifications to both short and long-term debt when the
term spread is lower, and favor reclassifications over long-term debt when the overall
stock market performs poorly.
3 The correlation between the term spread and the credit spread is -0.81 in our sample period. The credit spread is defined as the difference between the annualized yield on the 3-month commercial paper over the rate on the 3-month US Treasury bill.
5

All these results indicate that firms find it costly to issue desired amounts of
equity or long-term debt and possibly face temporary financial constraints when they
reclassify debt. Consistent with the view that reclassifications help firms bridge the gap
between their investment needs and available finance, we find that firms’ investment-
cash flow sensitivities increase, and their cash holding-cash flow sensitivities decrease,
when they reclassify short term debt. These results imply that at the time of debt
reclassification, firms allocate additional cash more to investment and less to cash
balance. This is consistent with the idea that when financial constraints tighten relative to
expected future constraints, the cash flow sensitivity of investment will be higher;
however, at the same time, since firms add to cash holdings in anticipation of future
financing constraints, the cash flow sensitivity of cash holding will be lower.
Some of our results suggest that firms “time” their reclassification decisions, that
is, they reclassify when investment opportunities are very good but financial frictions
exist. It is important to know whether the firms reclassifying debt under the revolving
facilities manage to overcome the financing frictions and invest more, i.e., do the
reclassifications affect firms’ “real” decisions. We estimate a simultaneous equations
model that treats both reclassifications and investment (alternatively, sales growth, asset
growth and or change in working capital) as endogenous variables. Our two-stage least
square estimates reveal that there is a bi-directional causality with respect to each of these
variables: the amount reclassified positively affects each of these variables, and higher
levels of these variables in turn cause firms to reclassify higher amounts of short-term
debt. Since reclassifications occur when firms are in need of funds but alternative
6

financing is more difficult, our results indicate that the availability of the lines of credit
are especially valuable under these circumstances.
The rest of the paper is organized as follows. Section 2 briefly discusses debt
reclassification and revolving facilities. Section 3 reviews the related literature. The data,
variables, and univariate analysis are described in Section 4. Section 5 presents the main
empirical results and Section 6 concludes.
2. Reclassification and Revolving Facilities
According to the Statement of Financial Accounting Standard (SFAS No.6),
short-term obligations expected to be refinanced can be excluded from current liabilities,
and classified as long-term liability, if both of the following conditions are met: (1) The
enterprise intends to refinance the obligation on a long-term basis, and (2) The enterprise
has the ability to consummate the refinancing. This standard is effective from 1975.
Most reclassifications are done under a “revolving facility” or a line of credit (also
called a revolving credit agreement or revolving credit loans). Under such a facility, a
bank or several banks stand ready to lend to a borrower on demand at any time during a
given period a pre-agreed amount of funds. In contrast to installment credit, borrowers
may use or withdraw funds up to the credit limit whenever they want and the credit may
be used repeatedly. The terms of agreement generally extend over one to five years, and
can be renewed or revised during or at the end of the agreement period. Banks generally
require that borrowers pay down all outstanding balances for a period of a few days or
weeks each year to demonstrate that the line is used for short-term purposes only. This is
the so-called “clean-up period”. In many cases, banks also require a “compensating
7

balance”, i.e., the borrower has to deposit a certain percentage of the commitment amount
of the line as collateral. Both the length of clean-up period and the level of compensating
balance are negotiable based on the bank-borrower relationship and the borrower’s
financial condition.
There are two basic forms of revolving facility, committed and uncommitted. For
uncommitted lines, banks and borrowers do not enter into a binding agreement, and banks
can unilaterally deny credit to borrowers. For committed lines, however, a formal written
agreement is required, which binds the bank to provide funds when requested. Therefore,
committed lines generally have covenants to ensure that the borrower adheres to certain
conditions. The interest rate on the debt outstanding under the line is generally a floating
rate linked to the prime rate or a market-determined rate such as the LIBOR, plus a
spread reflecting a customer-specific risk premium. A commitment fee is charged on the
unused portion of the credit line. In short, the committed credit line is a commitment on
the part of banks that ensures that borrowers get the funds whenever needed, as long as
the covenants are met.
Sometimes, companies, especially those above investment grade, use the
revolving facility as a back-up line for their commercial paper programs. They can
borrow under the line whenever they do not want to or cannot refinance their commercial
paper in the open market. For example, for the financial year 1993, the 10-K filing of
Albertson’s Inc. (gvkey 1240), a retail grocery store company, has the following note on
their commercial paper program:
The Company has in place a $200 million commercial paper program.
Interest on the outstanding commercial paper borrowings ranges from 3.10%
8

to 3.17% with an effective weighted average rate of 3.13%. The Company has
established the necessary credit facilities, through its revolving credit
agreement, to refinance the commercial paper borrowings on a long-term
basis. These borrowings have been classified as noncurrent because it is the
Company's intent to refinance these obligations on a long-term basis.
It is worth noting that it is not just short-term debt outstanding under the line or
commercial paper with back-up line that can qualify as reclassified short-term debt. As
long as it can be refinanced under the line, any short-term debt will do, even if it turns out
to be financed by an alternative source.
3. Relevant Literature
a. Bank Lines of Credit
The theoretical literature has long recognized the importance of lines of credit or
loan commitments for liquidity management. Boot, Thakor and Udell (1987) and
Holmstrom and Tirole (1998) present models that illustrate the intuition that in a
stochastic environment, loan commitments mitigate the adverse consequences of liquidity
shocks. Both models show that moral hazard problems are exacerbated in certain future
states of the economy due to adverse shocks to liquid balances or interest rates, causing
firms to invest or exert effort suboptimally. By granting firms loan commitments, banks
can provide insurance against these liquidity shocks, and recoup expected losses ex-ante
by charging commitment fees.
In spite of these theoretical insights, empirical evidence on the importance of lines
of credit has only become available recently. For the period 1996-2003, by searching
9

through keywords in the electronic versions of firms’ 10-K SEC filings, Sufi (2007)
identifies existing lines of credit for Compustat firms. He also compiles more detailed
information for a randomly selected sample of 300 firms. Sufi (2007) shows that lines of
credit substitute for cash holdings in the context of firms’ liquidity management. More
profitable firms are more likely to hold lines of credit and hold less in the form of cash
balances. Sufi (2007) argues that this is because lines of credit are often associated with
cash flow-based covenants, and banks are likely to restrict access to lines of credit if
these covenants are violated.
b. Debt Reclassifications
The literature on debt reclassifications is sparse, possibly again because the data
needs to be directly retrieved from 10-K filings. Gramlich, McAnally and Thomas (2001)
identify a sample of 197 firms (1765 firm years). The authors show that reclassifications
substantially improve firms’ current ratios, which would be lower than previous years in
the absence of reclassification, and suggest that reclassifications are a form of balance
sheet management, possibly motivated by a need to work around restrictive covenants.
Gramlich, Mayew and McAnally (2006) base their study on a sample of 1684 firm-year
observations between 1989 and 2000. They find that firms with lower operating cash
flows, leverage and current ratio are more likely to reclassify debt. The authors conclude
that “managers reclassify to obscure the firm’s true financial condition and not to simply
reveal the likely timing of debt payments.” They find that reclassifying firms are more
likely to experience a rating downgrade; moreover, market value of equity decreases
when firms start reclassifying and increases when they stop reclassifying.
10

c. Debt Maturity Structure
Debt reclassifications typically involve firms expressing intent to use revolving
credit facilities to refinance existing short-term debt for a certain number of periods. In
our hand-collected data from 10-K filings, 60% of the reclassifiers explicitly report a
maturity period for the reclassified debt. The mean and median maturity are 3.84 years
and 4 years, respectively. Thus, it appears that debt reclassification also involves a choice
of debt maturity structure. Firms reclassifying debt are mostly opting for medium term
debt as opposed to short and long term debt.
Theories of debt maturity suggest that certain types of firms may prefer
intermediate term debt over longer or shorter term debt. Myers’s (1977) debt overhang
theory implies that firms with growth options should avoid issuing long-term debt, or
debt that cannot be renegotiated, since the benefits of good projects would partially go to
debtholders. Diamond (1991, 1993), on the other hand, stresses “liquidation risk”
inherent in short-term debt: firms with growth options but uncertain cash flows may
default on short-term debt and lose their growth options.
Bank debt that can be rolled over subject to firms not violating covenants would
appear to resolve some of these problems. First, it would avoid the problem of debt
overhang since firms can choose not to roll over the debt if market conditions improve in
the future. Second, the revolving facilities are ideal for reducing refinancing risk and at
the same time allowing firms to pursue their growth options.
4. Data, Variables, and Univariate Analysis
11

a. Data
We start with all non-financial and non-utility U.S.-based firms in Compustat that
belong to the S&P 1500 any year during 1993 to 2005.4 We set the beginning of the
sample period to 1993 because annual 10-K SEC filings are available electronically for
all firms in the years after 1993. The information on debt reclassifications is manually
collected from annual 10-K SEC filings available through EDGAR (www.sec.gov). We
require firms to have 4 consecutive years of non-missing data on short-term debt, long-
term debt, total assets, PP&E, EBIT, share prices, and stock returns. This enables us to
examine how debt reclassifications evolve for a given firm over time. We obtain data on
stock prices and returns from the Center for Research on Security Prices (CRSP) files.
We exclude firm-year observations where the amounts of long-term debt and total debt in
Compustat are inconsistent with those in 10-K filings. Also excluded are observations
where the amount of long-term debt changes significantly (changes by ±30% or more)
due to restatement in the following year. All dollar values are converted into 2000
constant dollars using the GDP deflator. The final data set is an unbalanced panel
consisting of 14,902 firm-year observations.
We also merge our data with Sufi’s (2007) sample to obtain information of lines
of credit.5 Sufi's (2007) sample offers information on whether a firm has lines of credit
from 1996 through 2003. About 87% of firms in our sample also exist in Sufi’s sample
during his sample period (1996 – 2003).
b. Determinants of Debt Reclassification 4 More specifically, we focus on S&P 500 (Compustat item 276 = 10), S&P MidCap 400 (Compustat item 276 = 91), and S&P SmallCap 600 firms (Compustat item 276 = 92). 5 Sufi’s (2007) sample is obtained from Amir Sufi’s homepage (http://faculty.chicagogsb.edu/amir.sufi/).
12

The decision to reclassify is arguably a capital structure decision, because firms
presumably weigh the costs and benefits of alternative forms of finance in choosing to
roll over debt. It might also be argued that the decision represents a debt maturity
structure decision as well. Accordingly, we try to explain the reclassification decisions in
terms of some standard control variables that capture the costs and benefits of different
types of financing.
We consider the following firm characteristics and macroeconomic variables as
the determinants of reclassification decisions. The detailed definitions of these variables
are provided in Appendix A. To mitigate the impact of outliers or misrecorded data, all
variables are winsorized at the 0.5% level at both tails of the distribution.
We include the log of the book value of assets, Ln(Assets), as a proxy for
company size. We also take into account company maturity by including the log of the
company’s age plus one (Ln(Age)). Sales Growth is included to capture a firm's recent
growth prospects. Various capital structure theories suggest that the use of debt is related
to profitability. We use return on assets (ROA) as a proxy for profitability. Companies
having more tangible assets are expected to support more debt as these assets can be
pledged as collateral. The net PPE-to-asset ratio (Tangibility) is used to measure the
tangibility of the firm’s assets. The market-to-book ratio (MB) is considered to be an
important variable in leverage decisions and has been used as a proxy for a firm’s long-
term growth potential as well as equity market conditions.
We expect that companies will be more likely to issue equity rather than reclassify
short-term debt when their stock performance has been good. This is consistent with both
the equity market timing and adverse selection arguments, as companies' equity are less
13

likely to be undervalued during such periods.6 We use the excess stock return (Excess
Stock Return) to measure a company’s past stock performance, which is computed as the
compounded monthly stock returns in the past 12 months minus stock market return. The
current ratio measures a company's liquidity and its ability to pay off short-term debt.
Leverage ratio is defined as total debt (the sum of short-term and long-term debt) divided
by total assets. Faulkender and Petersen (2006) argue that companies that have a debt
rating have greater access to public bond markets, and document that these firms take on
more debt. To capture a company’s access to bond markets, we include a debt rating
indicator variable (Debt Rating) that equals one if a company has a debt rating assigned
by Standard & Poor’s, zero otherwise. To capture business variability, we include
earnings volatility, which is measured as the standard deviation of the EBIT to assets
ratio in the past 5 years.
We expect macroeconomic conditions to influence debt reclassification choices
because time-varying macroeconomic conditions may be associated with time-varying
debt and equity market conditions as well as financing needs. We consider the following
three macroeconomic variables. Stock market return is computed by compounding
monthly returns on the CRSP value-weighted index of stocks traded on NYSE, NASDAQ,
and AMEX. To the extent that the run-up in the equity market serves as a credible signal
of economic performance and enhanced growth opportunities, firms should shorten debt
maturity to take advantage of low liquidity risk and to avoid debt overhang (Myers
(1977)). On the other hand, the model of Lucas and McDonald (1990) implies a positive
relation between stock market return and the use of long-term debt. Their model is based
on the idea that during good times (under favorable stock market conditions), adverse 6 See among others, Baker and Wurgler (2002) and Chang, Dasgupta, and Hilary (2006, 2008).
14

selection costs (information asymmetry) will be lower.7 Thus a stock price run-up (high
stock return) will usually precede the issue of information disadvantaged securities, such
as equity or long-term debt. We use Post 2000 dummy to capture the possible regime
shift around 2000. Term spread is defined as the difference between the December 10-
year Treasury bond yield and the annualized December 3-month Treasury bill yield.8
Intuitively, the higher the spread, the higher the propensity for firms to borrow short-term
debt, because high term spread means long-term debt is more expensive than short-term
debt (higher interest expenses and lower prices). The survey by Graham and Harvey
(2001) indicates that a large fraction of chief financial officers indeed prefer short-term
debt “when short-term interest rates are low compared to long-term rates”. Conversely,
Korajczyk and Levy (2003) argue that term spread serves as a proxy for investment
opportunities. A high term spread implies good economic prospects, which in turn lead to
an increase in debt maturity if firms borrow long to finance long-term investments. The
term spread is highly negatively correlated with the credit spread – a measure of default
risk. Thus, it could be argued that the term spread proxies for debt market conditions
generally. 9
c. Univariate Analysis
7 This happens because the cash flows from a company’s assets in place have a publicly observable component that is related to general economic conditions and to a component that is private information to the company’s insiders, as in Myers and Majluf (1984). The publicly available component is relatively more important during good times, thereby reducing the adverse selection costs of equity issuance. 8 Treasury and corporate bond yields are retrieved from the Federal Reserve files at www.federalreserve.gov. 9 The tax theory developed by Brick and Ravid (1985) also suggests a positive relation between term spread and average debt maturity. In their model, borrowers maximize the present value of interest tax shields by accelerating interest payments, while lenders minimize their personal tax liabilities by slowing down interest payments. As a result, on a before-tax basis, a short debt maturity strategy is more costly to borrowers than a long debt maturity strategy since the former involves a premium, which is paid to lenders to encourage them to accept a larger tax bill.
15

We present a detailed analysis of the characteristics for firms that begin
reclassification and end reclassification, and compare these with those of some control
groups. We believe a detailed analysis of these descriptive statistics is quite revealing in
terms of understanding the motives for debt reclassification.
In Table 1, we first examine the prevalence of reclassification, and its time trend.
On average, 33% of our sample firms in any given year have reclassified debt. The
percentage of firms that reclassify increases through the nineties, and peaks immediately
prior to the 2001 recession. It drops sharply during the recession, and continues to decline
until the end of the sample period. Reclassified debt as a percentage of total assets (total
debt) averages at 13% (40%). These two ratios show a time trend that is very similar to
that of the fraction of firms that reclassify.
The fact that reclassifications peak in the year 2000 and decline sharply the
following year, we believe, is significant. The Federal Reserve’s Senior Loan Officer
Opinion Survey on Bank Lending Practices indicates that both standards on Commercial
and Industrial loans as well as spreads of loan rates over banks’ cost of funds sharply
increased in the years 2000 and 200110. In fact, loan standards were tighter in 2001 than
in 2000. In both years, overall stock market returns were -11%. Yet, reclassifications
were at a peak in 2000, and experienced a sharp decline in the following year. One
possible reason for this difference is that the economy was still growing in the year 2000
(GDP growth was a respectable 3.7%), and firms were in need of funds to finance
investment. However, issuing equity was not an attractive option due to the state of the
stock market, so firms tried to preserve their liquidity by choosing to roll over debt (either
10 See http://www.federalreserve.gov/boarddocs/snloansurvey/.
16

maturing or new short-term debt). However, firms cut back on expansion the following
year, so the need for funds and reclassifications decreased.
Column (6) in Table 1 shows the number of firm-years that are in common
between our sample and Sufi’s (2007) sample. Column (9) reveals an important
characteristic: a very large fraction (about 98%) of firms that reclassify (as identified by
our search) in the merged sample also have a line of credit (as identified by Sufi’s search).
In other words, as we expect, bank lines of credit are the typical way in which firms that
reclassify can meet the FASB 6 guideline that they must be able to demonstrate an ability
to refinance a short-term obligation on a long-term basis. In terms of the percentages and
time trends, columns (10) and (11) are similar to columns (4) and (5).
In Table 2, we examine characteristics of firms that start reclassification in any
given year (i.e., they have reclassified debt in year t but not the year before) and those
that stop reclassification in a given year (i.e., they have reclassified debt in year t-1 but
not in year t). We start with Panel A. For firms that start reclassification at time t, the
“Yes” group consists of firms that reclassify in t but not in t-1, while the “No” group
comprises of firms that do not have any reclassified debt either in year t or t-1 (as
revealed by the dummy variable RecD which takes a value of 1 whenever a firm has
reclassified debt, and zero otherwise). First, it is important to note that when firms start
reclassification, 62% raise new short-term debt and reclassify that as long-term debt: the
dummy variable MoreRecD takes a value of 1 if reclassified debt in period t exceeds that
in period t-1 plus debt that would have matured at the end of that year or the year after,
and zero otherwise. Thus, reclassifications have implications beyond mere accounting
changes “that obscure firms’ true financial condition” (Gramlich, McAnnally, and
17

Thomas (2001)), and are in fact an integral part of the way firms arrange new financing
for growth.
In the year that they start reclassification (year t), firms have more tangible assets,
slightly higher return on assets, higher cash flows, much higher return on equity, lower
stock returns (both unadjusted and market-adjusted) and market-to-book ratios, much
higher investment, asset growth, sales growth and especially acquisition activity, higher
leverage ratios, lower cash balance and current ratio than firms that did not reclassify in
any given year as well as the year before. These differences are all useful in
understanding which types of firms reclassify. The higher ROA is consistent with the
association of reclassifications and bank lines of credit, and with Sufi’s (2007) evidence
that profitability is positively associated with the presence of lines of credit. The higher
ROE reflects a leverage effect but also suggests that debt reclassifiers are unlikely to be
overburdened with debt financed at very unfavorable terms.
Capital expenditures, asset growth, acquisitions and sales growth are much higher
for firms that start reclassification than those that do not. The most noticeable difference
is in asset growth, mirrored in acquisition activity, which are significantly higher in the
year of reclassification. It appears, therefore, that the demand for funds is driven to some
extent by acquisitions that are at least partially financed by cash. This would appear
consistent with the lower unadjusted and market-adjusted excess stock returns and
market-to-book ratios in Panel A, which suggest that these are not periods in which stock-
financed acquisitions are attractive. In fact, the lower stock returns and market-to-book
ratios possibly indicate why these firms choose to rely on short-term financing rather than
raise equity or long-term debt. The last row in Panel A shows that the term spread is also
18

lower for firms that start reclassification, consistent with the notion that lower term-
spreads ( associated with higher default spreads) reflect weakening of economy-wide
fundamentals and tighter debt market conditions.
Not surprisingly, firms that start reclassification have higher debt ratios, and lower
current ratios and cash balance, than those that do not. We also examine net debt and
equity issuances around reclassification. The amounts of net debt and net equity issues
(∆D and ∆E, respectively) are computed using Compustat’s cash flow statement data.11
Companies are defined as issuing debt (equity) when the net debt (equity) issued divided
by total assets exceeds 3 percent.12 Compustat counts the reclassification of short-term
debt to long-term debt as a part of long-term debt issuance, we thus find in Table 2 a
much higher percentage of reclassifiers issue debt compared to firms that do not,
reflecting the effect of reclassification. In contrast, a smaller fraction of reclassifiers issue
new equity. The same patterns are observed in terms of the size of new debt and equity
issuance.
The higher leverage ratio and low current ratio and cash balance could reflect
financing policy of the recent past. When we compare the same set of firms one year
before, we find that while the unadjusted stock returns of firms that would start
reclassification next year are not yet as unfavorable relative to the ones that would not,
most of the differences are already apparent. In particular, debt ratios are already higher
and current ratios lower, consistent with Gramlich, McAnnally, and Thomas (2001). The
lower cash balance and current ratio could reflect Sufi’s (2007) finding that firms with
11 Net equity issues (∆E) equal the sale of common and preferred stock minus the purchase of common and preferred stock. Net debt issues (∆D) equal long-term debt issuance minus long-term debt reduction plus changes in current debt. 12 A fixed cutoff for defining large debt/equity issues is used in many previous studies, including Hovakimian, Opler, and Titman (2001), Leary and Roberts (2005), and Chang and Dasgutpa (2008). The alternative cutoff of 1%, 5%, or 10% makes little difference to the results that follow.
19

lines of credit hold less cash balance, but could also be due to the fact that such firms
exhaust cash holdings as they expand more rapidly.
Finally, Panel A reports the change in the maturity structure of debt around the
decision to start reclassification. The debt maturity information is obtained from
Compustat, which reports debt maturing in one, two, three, four and five years. We treat
any remaining debt as maturing in more than five years. Firms do not follow a consistent
policy in reporting the maturity of reclassified debt. When a specific date of maturity is
not reported, there is a possibility that reclassified debt is classified as maturing in more
than five years. However, the summary information in Panel A reveals that there is a only
a slight increase in debt maturing in more than five years in the year the firms start
reclassification; on the other hand, there is a significant increase in debt maturing in more
than three but less than five years. Therefore, it appears that reclassified short-term debt
is classified as debt maturing in the intermediate term.
Moving forward to the year after reclassification, we find that the major
difference is that sales and asset growth of the reclassifiers come down drastically. The
year reclassification starts appears to be one in which growth rate registers a spike.
In Panel B, we consider firms that end reclassification. We have almost exactly
the opposite picture to that in Panel A. The return on equity (ROE) is much lower for
firms that end reclassification compared to those that have reclassified debt both in the
current and the previous years (the “No” group). This also could reflect a leverage effect,
since firms that stop reclassification have lower debt than those that do not. Both the
stock returns and the market-to-book are higher than for firms that continue to reclassify
their debt, suggesting that alternative financing in the form of equity is likely to be
20

cheaper for firms that stop reclassification. However, growth rates in sales and assets are
also lower – so the need for financing is lower. The fact that firms that stop
reclassification have higher current ratios is consistent with the notion that these firms
hold more cash as the need for funds for expansion is less. They are also likely to add to
inventory as sales growth slows. Firms that stop reclassification experience an increase in
the proportion of debt maturing in more than five years. This is consistent with our
earlier observation that most reclassified debt is of intermediate-term maturity.
The comparisons between the two groups do not change much one year before or
after, suggesting that the decision to stop reclassification – similar to the decision to start
- does reflect a change in the firm’s environment.
To summarize, the descriptive statistics in Tables 2 indicates that reclassifications
are initiated by firms that are growing rapidly, and in particular, coincide with periods
that show a spike in asset and sales growth and acquisition activity. They also coincide
with periods in which firm’s stock valuations are unfavorable, as reflected in the market-
to-book or stock returns. Most of the reclassified debt is stated to mature in the
intermediate term, that is, between three to five years. The picture that emerges is one of
firms that are in need of funds to sustain growth, but are unable or unwilling to issue
significant amounts of equity or long-term debt.
5. Main Results
In this section, we first present regression evidence to further understand which
types of firms reclassify debt, and what the possible motivates reclassifications. We then
21

examine whether reclassification has an impact on firms’ real decisions, such as
investment and growth.
a. The Determinants of Debt Reclassification Decisions
We now present regression analysis to understand the determinants of
reclassification decisions. In Table 3, we present results for five regressions. The
regressions control for 2-digit SIC industry fixed-effects and standard errors are clustered
at the level of the firm.13 The first column reports results from an OLS regression, and the
dependent variable is the ratio of outstanding reclassified debt over total assets. The next
four columns report results for logistic regressions and the dependent variables are all
indicator variables. The dependant variable in column (2) takes a value of 1 if a firm has
reclassified debt in a given year, and zero otherwise; that in column (3) takes a value of 1
if reclassified debt that period exceeds reclassified debt last period plus short-term debt
that would have been due that period and the subsequent period (that is, it represents new
short-term debt reclassified as long-term), and zero otherwise14, that in column (4) takes
a value of 1 if the firm started to reclassify or resumed reclassification in a given year
(that is, it had no reclassified debt in the previous year), and zero otherwise; that in
column (5) takes a value of 1 if a firm ended reclassifying its debt in a given year (i.e., it
had reclassified debt in the previous year but not in that year), and zero otherwise.
The results are consistent with the descriptive statistics presented in Tables 2.
Firms with high sales growth in the past year have more reclassified debt and are more
likely to reclassify, start reclassification or raise new short-term debt that is reclassified,
13 Results that incorporate firm-fixed effects are similar and are presented in a later table. 14 The sum of reclassified debt last period and short-term debt that would have been due that period and the subsequent period is the maximum amount that may have to be renewed. Any higher amount must be new short-term debt reclassified as long-term debt.
22

and less likely to end reclassification. However, a higher market-to-book ratio or excess
stock returns have a negative effect on reclassifications, but a positive effect on the end of
reclassification. Profitability has a positive effect on reclassification, and a negative effect
on the end of reclassification. Firm size (as measured by the logarithm of book assets) has
a significant negative effect on the magnitude and likelihood of reclassification as well as
the likelihood of a firm ending reclassification. To the extent that firm age and size are
positively correlated, the result is consistent with that in Sufi (2007), who finds that
younger firms utilize lines of credit more. Age itself has a negative coefficient in Table 3.
These results suggest that older and larger firms are likely to face lower refinancing risk
because of their reputation or rating, and accordingly, may not need access to lines of
credit. Earnings volatility has a negative effect on reclassifications, but a positive effect
on the end of reclassifications. This is consistent with Sufi’s (2007) finding that firms are
reluctant to use lines of credit for liquidity management if cash flows or earnings are low,
since they risk defaulting on cash flow-based covenants typically associated with bank
lines of credit.
One variable that deserves more discussion is the credit rating dummy, which
takes a value of 1 if a firm has a credit rating, and zero otherwise. Firms with rated debt
are less likely to take recourse to debt reclassification, and are more likely to end
reclassification. This is consistent with the idea that long-term debt and reclassified debt
are substitutes – if firms can tap the long-term debt market, they are less likely to
reclassify. It is also possible that firms with rating find it easier to issue commercial paper,
and therefore have less refinancing risk and need for lines of credit or debt rollover.
23

The lagged debt ratio is positively related to the probability of reclassification,
and negatively related to the end of reclassification. In results not reported in a table, we
find that when we further break up the debt ratio into short, intermediate (maturing in 2-5
years) and long-term (maturing in more than 5 years) debt, the latter has a significant
positive effect on the decision to start reclassification. This suggests that debt overhang
problems might be a reason for firms to seek short term debt (and reclassify). In contrast,
it is the ratio of short-term debt to total assets that has a significant positive effect on the
decision to end reclassification, and intermediate term debt over assets has a negative
effect. It appears as though the “end reclassification” (or declassification) decision is a
gradual process, as firms start to declassify some debt before declassifying all debt.
Table 3 also shows the effect of some variables that capture overall market
conditions or the level of economic activity. Table 1 shows that there is a sharp drop in
reclassifications after the year 2000. There could be several reasons for such an effect –
for example, it could represent accounting conservatism in the post-Enron period, and a
reluctance to reclassify short-term debt such as commercial paper as long term. The
evidence is also consistent with our finding that firms reclassify when they need funds for
growth, and not in response to worsening financial conditions that might trigger covenant
violations, given that the U.S. economy was still in the aftermath of the 2001 recession
during this period (2001-2005). However, even after controlling for this time-period
effect, reclassification decisions are sensitive to debt and equity market conditions.
Consistent with the notion that firms are more likely to reclassify when overall equity
market conditions are weak, we find that the return on the overall stock market affects the
likelihood of reclassifications negatively in column 2. Moreover, the term spread affects
24

the likelihood and size of reclassifications negatively, and that of ending reclassifications
positively. The term spread is thought to be negatively associated with the likelihood of
economic downturns (Estrella and Mishkin (1998)). Moreover, it is negatively correlated
with the credit spread15, a measure of default risk. In our sample, the correlation between
the term spread and the credit spread is -0.81. Thus, a low term spread is likely to be
associated with adverse conditions in public debt markets, and encourage firms to use
their lines of credit to back up commercial paper issues or delay repaying maturing debt.
In Table 4, we address some robustness issues. The dependent variable in the
regressions reported in this Table is the amount of reclassified debt as a proportion of the
book value of assets, RecA. In column (1), we report the results from a regression that
incorporates firm-fixed effects. Given that reclassified debt cannot be negative, the
regression in column (2) incorporates a Tobit specification. Since reclassifications almost
always involve firms taking advantage of their revolving facilities, it is also worthwhile
to investigate to what extent our results in Table 3 capture the determinants of lines of
credit as opposed to reclassifications. This is accomplished in columns (3)-(5) of Table 4.
In column (3), we report an OLS regression with a line of credit dummy; in column (4),
we condition the regression on the existence of lines of credit, based on Sufi’s (2007)
sample, and finally in column (5), we report the results from a Heckman selection model.
The qualitative nature of the results remains unchanged. In particular, those in columns
(3)-(5) suggest that the determinants of reclassification decisions are different from those
15 The credit spread is the spread between the rate on 3-month commercial paper and 3-month treasury bills.
25

of lines of credit. This is not surprising since reclassifications represent a specific use of
lines of credit – namely, the roll-over of either existing short term debt, or new debt.16
In the next sections, we further explore the extent to which reclassifications
represent substitutions between debts of different maturities.
b. Is Reclassified Debt a Substitute for Long-term Debt?
Almost by its very nature, debt reclassifications represent a preference by firms
for debt maturing in more than one year over short-term debt. Some of our earlier results
indicate that firms may also choose to reclassify debt when they are unable or unwilling
to issue longer term debt. In Tables 3 and 4, the (lagged) debt ratio has a significant
positive effect on the size and likelihood of debt reclassifications. In unreported results,
we find that this effect comes entirely from long-term debt, suggesting debt overhang as a
possible reason for firms’ reluctance to issue long term debt and roll over short-term debt
instead. In Tables 3 and 4, a dummy variable indicating that the firm has a credit rating is
negatively related to the likelihood and size of debt reclassification, and positive related
to the likelihood of firms ending reclassification. This suggests that debt reclassifications
increase when it is more difficult for firms to issue long-term debt.
In this section, we provide additional evidences in support of the possibility that
reclassifications are more likely when long-term debt issuance is less attractive. In the
first two columns of Table 5, we report Logit regressions on the choice between long
term debt and reclassified debt. The third column presents Logit results for the choice
between short-term debt and reclassified debt. In column (1), the dependent variable
16 In results not reported in a table, we find that on the much smaller sample of 300 firms for which Sufi (2007) has detailed information on lines of credit, in 50% of the cases, there is a one-to-one relationship between change in reclassified debt and draw-downs from the lines.
26

takes a value of 1 if the amount of long-term debt issue from firms’ cash flow statement
(which includes change in reclassified debt) less change in reclassified debt exceeds 3%
of the book value of assets, and zero if reclassified debt exceeds 3% of book value of
assets (cases in which both of these exceed 3% of book value of assets are dropped). In
column (2), the dependent variable takes a value of 1 if the change in debt maturing in
more than five years based on firms’ balance sheet data exceeds 3% of book value of
assets,17 and zero if reclassified debt exceeds 3% of book value (again, cases in which
both of these exceed 3% of book value of assets are dropped). In column (3), the
dependent variable takes a value of 1 if debt in current liability less the current portion of
long-term debt exceeds 3% of book value of assets, and zero if reclassified debt exceeds
3% of book value (cases in which both of these exceed 3% of book value of assets are
dropped). In these regressions, our interest is to examine the determinants of the choice
between conventional short-or long-term debt issuance and debt reclassification. (in
excess of 3% of book value of assets). Our results are very similar if we examine the
determinants of the choice between conventional debt issuance and new (i.e., additional)
debt reclassifications.
The Logit regressions in columns (1) and (2) of Table 5 suggest that reclassifying
firms choose this form of financing as a substitute for longer term debt. Firms prefer to
reclassify debt over issuing new long term debt or very long-term debt when they are
more profitable, when equity market conditions are less favorable, when they are more
leveraged, when earnings volatility is lower, and when they do not have rated debt. They
are less likely to choose debt reclassification over issuance of long-term debt in the post -
17 We add back the debt amount that would have matured in 6 years as of a year ago, since it could be argued that this is a mechanical reduction in debt maturing in more than 5 years. However, our results are not affected by this adjustment.
27

2000 period, and when the term spread indicated favorable economic outlook and debt
market conditions. The results in column (3) are remarkably similar. The only exception
is that in the post-2000 period, firms seem to have moved away from short-term debt and
in favor of reclassified debt. It is also interesting to note that lower term spread –
indicating unfavorable economic outlook – encourages reclassifications at the expense of
both short and long-term debt. It appears that the firms take advantage of the revolving
facilities when default risk is high in the economy.
As a robustness check for our Logit results, we estimate a multinomial Logit
model in which the decisions to issue the three types of debt are modeled simultaneously.
The dependent variable, y, takes a value of one if a firm issue short-term debt in a given
year (greater than 3% of the book value of assets), a value of two if the firm reclassify
short-term debt as long-term (reclassified debt greater than 3% of the book value of
assets), and a value of three if the firm issues long-term debt (greater than 3% of total
assets). We choose debt reclassification as the base category. The results are reported in
columns (4) and (5). They are generally consistent with those reported in the first three
columns of Table 5.
To summarize, in this section, we find evidence consistent with the idea that firms
substitute reclassified debt for short and long-term debt: the choice between reclassified
debt and these two alternative types of debt financing is affected by firm and market
characteristics in a very similar way as the likelihood of debt reclassification itself. In
other words, debt reclassification is relatively more favored over the alternatives under
certain conditions. In section 5-d, we further show that when firms reclassify debt, they in
fact issue less long-term debt.
28

c. The Real Impact of Debt Reclassifications
The descriptive statistics of Tables 2 and our previous empirical analysis suggest
that the start of reclassifications coincide with periods of especially high investment
activity and asset growth. Since other evidence in Table 2 suggests that during these
periods, firms also face frictions in financial markets, it is of interest to know whether
reclassifying firms are, in the end, able to invest at higher levels.18 To properly address
this question, one needs to take into account the simultaneity of the investment and
reclassification decisions.
We estimate four sets of simultaneous equations using the two-stage least squares
method of estimation. In each of these pairs of simultaneous equations, the amount
reclassified is treated as one of the endogenous variables, and the other endogenous
variable is, alternatively, sales growth, asset growth, investment over assets, or change in
working capital over assets. In the equations in which we model the determinants of these
four “growth variables”, to identify the system, we include the lagged value of the
dependent variable, firms’ R&D over sales, a dummy variable to indicate whether R&D
is missing, corporate profit growth and GDP growth, and drop the overall stock market
returns, the term spread, the post-2000 dummy, the current ratio and debt ratings from the
set of explanatory variables.
Table 6 first reports OLS results on the effect of debt reclassifications on the
growth variables. The amount reclassified has a significant positive effect on each of
18 When firms reclassify debt, they are in fact using the lines of credit to support additional financing. As we noted above, for Sufi’s (2007) smaller “random sample” for which there is more detailed data on lines of credit, we find a one-to-one relation between the draw-down of lines and increases in reclassification for 50% of the sample firm years. Firms are also likely to use the credit lines to back up commercial paper programs and reduce refinancing risk, as we noted above. Thus, reclassifications are associated with the use of lines of credit to secure additional financing.
29

these four growth variables. R&D over Sales, the R&D dummy, GDP growth and
corporate profit growth all have significant effects. Table 7 reports the two-stage least
square results for equations concerning the impact of debt reclassification on the growth
variables. The results for debt reclassification equation are reported in Appendix C. The
results suggest a bi-directional causality: all the growth variables cause firms to reclassify
larger amounts, and larger amounts of reclassification cause higher growth.
To further address the concern of causality, we employ the single-firm, four-way
matching methodology based on industry, size, market-to-book ratio and sale growth.19
In order to find each reclassifying firm’s closest match we first limit the sample of
potential matches to those firms who do not reclassify short-term debt in a particular year.
All firms in the same industry as the reclassifying firm based on the 2-digit SIC industry
classification are found. We require at least five potential matches for each reclassifying
firm, otherwise it is omitted from the sample. The absolute difference between the size,
market-to-book ratio and sales growth of the sample firm and those of the potential
matches is then deflated by each variable’s sample standard deviation. Size is estimated
using the beginning-or-period book value of assets. Similarly, market-to-book and sale
growth are estimated at the beginning of the fiscal year.
Matches are chosen for each reclassifying firm by minimizing the sum of the
standardized differences in size, market-to-book ratio and sale growth for firms in the
same industry. Namely, we select matches by solving the following:
(| | | | | |)Size SaleGrowthMB
Size MB SaleGrowth
diff diffdiffMinσ σ σ
+ +
19 This matching procedure is based on Barber and Lyon (1997) and Lyon, Barber and Tsai (1999).
30

where diff is the difference between the sample firm’s size (MB, Sales Growth) and that
of the matching firm. Table 9 reports the difference in growth and investment variables
between reclassifiers and their matches. Reclassifying firms have significantly higher
sales and asset growth, and make more investment in both fixed assets and working
capital than their non-reclassifying counterparts.
d. Reclassifications and Financing Constraints
Our previous results suggest that adverse equity and debt market conditions are
important for the reclassification decision. In other words, reclassifications occur in an
environment in which firms are likely to face financial constraints. There is a large
literature that suggests that when financial constraints are binding, investment is
positively related firms’ cash flows, i.e. the cash flow sensitivity is positive. There is also
a literature that argues that financially constrained firms save more out of their cash flows,
so that they can draw on internal funds when they have good projects in the future.
One important issue that has not been adequately addressed in the literature is that
it matters whether financing constraints bind today versus whether they are expected to
bind in the future. If firms have large investment needs today then financial constraints
are likely to bind today. In this situation, the cash flow sensitivity of investment is
expected to be higher than in other periods. For the same reason, the cash flow sensitivity
of cash is likely to be low. Since firms save cash in anticipation of future financing
constraints, the cash flow sensitivity of cash should be lower (higher) today if today’s
constraints are more (less) binding than expected future constraints. Therefore, we should
31

expect that the cash flow sensitivity of investment should increase, and the cash flow
sensitivity of cash holdings should decrease, when firms reclassify debt.
Table 9 presents the results. The cash flow identity20 includes different uses of
cash – investment, addition to net working capital, addition to cash holdings, dividend
payout and reduction in debt and equity issuance. Treating cash flows as exogenous, we
examine how the other components of the cash flow identity respond to a dollar change in
cash flows. We estimate separate regressions in which each of the other components of
the cash flow identity is a dependent variable, and cash flow, the market-to-book ratio,
log of assets and the amount reclassified (RecA) plus its interaction with cash flow are
the independent variables. All flow variables are scaled by total assets. The regressions
incorporate firm-fixed effects. We also separately regress issuance of total debt less
additional reclassified debt, issuance of long-term debt excluding additional reclassified
debt, and short-term debt, on the same set of explanatory variables.
The amount reclassified itself has a significant positive impact on investment, a
negative effect on dividend payouts, and a negative effect on additional debt issues
(excluding reclassified debt). These results confirm that reclassifications are done to fund
capital expenditures at times when firms are unable to issue more conventional types of
debt. While the amount reclassified itself has an insignificant effect on the issuance of
short-term debt, its interaction with cash flow has a significant negative effect. This result
suggests that firms with very low cash flows do not substitute reclassified debt for short-
term debt, but those with higher cash flow do. Importantly, the cash flow sensitivity of
20 The cash flow identity is: Investment + Dividend Payout+ Addition to Cash Holdings+ Change in Non-Cash Net Working Capital – Net Debt Issuance – Net equity Issuance = Operating cash Flow.
32

investment increases and that of cash holdings decreases as more debt is reclassified,
consistent with the idea that financial constraints tighten when firms reclassify debt.
6. Conclusion
In this paper, we provide new evidence on how lines of credit are used by firms in
need of certain types of financing. In our hand-collected data sample which contains
15,000 firm-years over the period 1993-2005, on average, 33% of the firms reclassify
existing or new short-term debt as long-term debt. Among the firms that reclassify short-
term debt, the percentage of reclassified debt to total debt over our sample period is 40%.
Taken together, our results suggest the following motives for debt reclassification.
Firms are able to reclassify if they have the intent and ability to roll over short-term debt.
The rollovers occur when firms have a need for funds and they want to reduce
refinancing risk. This suggests that the following situations will lead to more
reclassifications. First, when firms pursue growth, they are likely to run out of internal
funds, and inability to refinance is also going to be very costly. Second, firms in danger
of violating liquidity-based covenants such as the current ratio might want to reclassify
short-term debt – firms pursuing growth aggressively would fall into this category as they
are likely to deplete internal funds in the process. Third, firms reclassify when equity
market conditions are not favorable for equity issuance. Fourth, they reclassify when debt
market conditions are not favorable for long-term debt issuance, either because credit
markets are tight, or because of debt overhang problems.
Since most of the reclassified debt is considered intermediate term debt, it might
be asked why firms prefer to use the revolving facilities and reclassify, rather than
33

directly borrow intermediate term debt from banks. One possible reason is that the market
conditions might be considered temporary: firms might prefer the flexibility of being able
to go back to the equity or longer-term debt markets when conditions improve, and not be
locked into possibly more expensive credit.21 Moreover, a feature of revolving facilities
is that the when firms borrow short-term under the revolving facility, banks providing the
facility typically require a “clean-up period” – often a few weeks or a month – during
which the firm has to pay down all outstanding balances. This is a unique type of
covenant that reduces the risk to the lender and possibly lowers borrowing costs as well.
More generally, since banks can not allow the rollover if the firm’s financial condition
deteriorates, the arrangement gives the bank greater flexibility, and can lead to ex-ante
better contracting.
All these results indicate that firms find it costly to issue desired amounts of
equity or long-term debt and possibly face temporary financial constraints when they
reclassify debt. Consistent with the view that reclassifications help firms bridge the gap
between their investment needs and available finance, we find that firms’ investment-
cash flow sensitivities increase, and their cash holding-cash flow sensitivities decrease,
when they reclassify short term debt. These results imply that at the time of debt
reclassification, firms allocate additional cash more to investment and less to cash
balance. This is consistent with the idea that when financial constraints tighten relative to
expected future constraints, the cash flow sensitivity of investment will be higher;
however, at the same time, since firms add to cash holdings in anticipation of future
financing constraints, the cash flow sensitivity of cash holding will be lower.
21 Recall that firms’ liquidity ratios are typically lower and leverage ratios higher when they reclassify. This may imply that they have to borrow at somewhat unfavorable terms.
34

Some of our results suggest that firms “time” their reclassification decisions, that
is, they reclassify when investment opportunities are very good but financial frictions
exist. We also estimate a simultaneous equations model that treats both reclassifications
and investment (alternatively, sales growth, asset growth and or change in working
capital) as endogenous variables. Our two-stage least square estimates reveal that there is
a bi-directional causality with respect to each of these variables: the amount reclassified
positively affects each of these variables, and higher levels of these variables in turn
cause firms to reclassify higher amounts of short-term debt.
35

References Baker, M., and J. Wurgler. 2002. Market timing and capital structure. Journal of Finance 57 (February): 1–32. Barber and Lyon, 1997, “Detecting Long-Run Abnormal Stock Returns: The Empirical Power and Specification of Test Statistics,” Journal of Financial Economics 43, 341-372. Barclay, M. J, Smith, C. W Jr, 1995. The maturity structure of corporate debt, Journal of Finance 50, 609-631. Boot, A., A. Thakor, and G. Udell, 1987, “Competition, Risk Neutrality, and Loan Commitments,” Journal of Banking and Finance, 11, 449-471. Brick, I. and S. A. Ravid, 1985, On the relevance of debt maturity structure, Journal of Finance 40, 1423-1437. Chang, X., S. Dasgupta, and G. Hilary. 2006. Analyst coverage and capital structure decisions. Journal of Finance 61 (December): 3009–3048. Chang, X., S. Dasgupta, and G. Hilary. 2008. The effect of auditor choice on financing decisions. The Accounting Review, Forthcoming. Chang, X., and S. Dasgupta. Target behavior and financing: How conclusive is the evidence? Journal of Finance, Forthcoming. Datta, S., Iskandar-Datta, M., Raman, K., 2005. Debt Managerial Stock Ownership and the Maturity Structure of Corporate, Journal of Finance 60, 2333-2350. Diamond, D. W., 1991. Debt Maturity Structure and Liquidity Risk. The Quarterly Journal of Economics 106, 709-737. Diamond, Douglas W., 1993, Seniority and maturity of debt contracts, Journal of Financial Economics 33, 341–368. Estrella, A. and F. Mishkin, 1998, Predicting U.S. Recessions: Financial Variables as Leading Indicators, Review of Economics and Statistics 80, 45-61. Faulkender, Michael and Mitchell Petersen, 2006, Does the Source of Capital Affect Capital Structure? Review of Financial Studies 19, 45 – 79 Financial Accounting Standards Board (FASB), Statement of Financial Accounting Standards No. 6 Classification of Short-Term Obligations Expected to Be Refinanced, an amendment of FASB No. 43, Chapter 3A Flannery, M. J., 1986. Asymmetric Information and Risky Debt Maturity Choice. The Journal of Finance 41, 19-37.
36

Faulkender, Michael, and Mitchell A. Petersen, 2006, Does the Source of Capital Affect Capital Structure, Review of Financial Studies 19, 45-79. Graham, John R., and Campbell Harvey, 2001, The theory and practice of corporate finance: Evidence from the field, Journal of Financial Economics 60, 187-243. Gramlich, Jefferey D., Mary Lea McAnally, and Jacob Thomas, 2001, Balance Sheet Management: The Case of Short-Term Obligations Reclassified as Long-Term Debt.”, Journal of Accounting Research 39, 283 – 295 Gramlich Jefferey D., William J. Mayew and Mary Lea McAnally, 2006, Debt Reclassification and Capital Market Consequences, Journal of Business Finance & Accounting, 33(7) & (8), 1189 – 1212 Heckman, J. J. 1979. Sample selection bias as a specification error. Econometrica 47 (January): 153-161. Hovakimian, Armen, Tim Opler, and Sheridan Titman, 2001, The debt-equity choice, Journal of Financial and Quantitative Analysis 36, 1-24. Holmstrom, B. and J. Tirole, 1998, “Private and Public Supply of Liquidity,” Journal of Political Economy, 106, 1-40. Korajczyk, R., and A. Levy, 2003. Capital Structure Choice: Macroeconomic Conditions and Financial Constraints. Journal of Financial Economics 68, 75-109. Leary, Mark T., and Michael R. Roberts, 2005, Do firms rebalance their capital structures? Journal of Finance 60, 2575-2619. Lucas, Deborah J., and Robert L. McDonald, 1990, Equity issues and stock price dynamics, Journal of Finance 45, 1019-1043. Lyon, Barber, and Tsai, 1999, “Improved Methods for Tests of Long-Run Abnormal Stock Returns”, Journal of Finance 54, 165-201. Mackie-Mason, J., 1990, “Do Taxes Affect Corporate Financing Decisions?” Journal of Finance, 45, 1471-1493. Myers, S.,1977. The determinants of corporate borrowing. Journal of Financial Economics 5, 147-175. Myers, Stewart C., and Nicholas S. Majluf, 1984, Corporate financing and investment decisions when firms have information that investors do not have, Journal of Financial Economics 13, 187-221.
37
38
Opler, Tim C. and Sheridan Titman, 1994, Financial Distress and Corporate Performance, Journal of Finance 49, 1015 – 1040. Rajan, R., 1992. Insiders and outsiders: the choice between informed and arms-length debt. Journal of Finance 47, 1367-1399. Stohs, M. H., Mauer, D. C., 1996. The determinants of corporate debt maturity structure. The Journal of Business 69, 279-312. Sufi, Amir, 2007, Bank Lines of Credit in Corporate Finance: An Empirical Analysis, Review of Financial Studies, forthcoming.

Table 1: Distribution of debt reclassifications 1993-2005
The full sample contains all non-financial and non-utility US-based firms from Compustat that belong to the S&P 500, S&P MidCap 400, or S&P SmallCap 600 groups from 1993 through 2005. Debt reclassifications are collected from Edgar 10-K SEC filings. Panel A presents the distribution of debt reclassification for the full sample. Panel B reports the distribution of debt reclassification for firms that exist in both the full sample and Sufi’s (2007) sample. Firms that are in Sufi’s (2007) sample have information on lines of credit from 1996 through 2003. RecA is the reclassified debt over total assets. RecP is the reclassified debt over total debt. The average RecA and RecP (column 4, 5, 10, and 11) are computed conditional on firms reclassifying short-term debt as long-term.
Panel A: Full sample Panel B: Firms that exist in both the full sample and Sufi’s (2007) sample
Year Number
of firms
Percentage of firms
that reclassify
(RecA > 0)
Average reclassified debt/Assets
(RecA)
Average reclassified debt /Total
debt (RecP)
Number of
firms
Percentage of firms having lines of credit
Percentage of firms
that reclassify
(RecA > 0)
Percentage of
reclassifiers having lines
of credit
Average reclassified debt/Assets
(RecA)
Average reclassified debt/Total
debt (RecP)
(1) (2) (3) (4) (5) (6) (7) (8) (9) (10) (11) 1993 797 31.6% 10.0% 32.69% - - - - - - 1994 957 31.9% 12.1% 37.8% - - - - - - 1995 1,156 35.4% 13.8% 38.8% - - - - - - 1996 1,245 36.2% 14.2% 40.6% 982 90.2% 36.4% 97.8% 13.9% 41.0% 1997 1,283 37.8% 16.0% 44.2% 1,049 91.7% 37.8% 98.2% 15.5% 45.2% 1998 1,305 39.4% 15.9% 42.3% 1,115 91.0% 39.6% 98.4% 15.8% 43.2% 1999 1,249 40.6% 15.2% 42.5% 1,127 92.4% 40.8% 98.5% 15.1% 42.9% 2000 1,217 40.8% 14.0% 43.7% 1,109 91.3% 41.3% 98.3% 14.1% 44.8% 2001 1,202 33.2% 11.7% 41.0% 1,101 91.3% 33.8% 98.7% 11.6% 41.3% 2002 1,212 28.7% 9.2% 36.0% 1,093 90.4% 28.3% 99.0% 9.3% 37.1% 2003 1,133 24.6% 7.6% 32.8% 1,028 90.4% 24.5% 99.6% 7.1% 32.7% 2004 1,110 24.0% 8.4% 33.7% - - - - - - 2005 1,036 25.0% 9.1% 35.2% - - - - - - Total 14,902 33.4% 12.8% 39.5% 8,604 91.1% 35.4% 98.5% 13.3% 41.7%
39

Table 2: Summary statistics, 1993 – 2005 The full sample contains all non-financial and non-utility US-based firms from Compustat that belong to the S&P 500, S&P MidCap 400, or S&P SmallCap 600 groups from 1993 through 2005. Debt reclassifications are collected from Edgar 10-K SEC filings. In Panel A, firms that start reclassification (the “Yes” groups) are those who reclassify at t but not at t - 1. The “No” groups contain firms that do not reclassify debt at t or t - 1. In Panel B, firms that end reclassification (the “Yes” groups) are those who reclassify at t - 1 but stop reclassification at t. The “No” groups include firms that reclassify debt at t and t – 1. RecD is a dummy variable which takes a value of 1 if a firm reclassifies short-term debt as long-term, and zero otherwise. MoreRecD takes a value of 1 if reclassified debt in period t exceeds that in period t-1 plus debt that would have matured at the end of that year and the year after, and zero otherwise. RecA is the reclassified debt scaled by total assets. Ln(Assets) is the natural log of total assets. Tangibility is the net PPE over total assets. ROA is the operating income before depreciation over total assets. ROE is the income before extraordinary items divided by the book value of common equity. Cash Flow/A is internal cash flows divided by total assets. MB is the market-to-book ratio, which is measured as the total assets less the book value of equity plus the market value of equity divided by total assets. Stock Return is the annual stock return computed by compounding monthly returns over the past 12 months. Excess Stock Return is Stock Return minus the stock market return. Capital Expenditure /A is the capital expenditure to assets ratio. Acquisition/A is the acquisitions to assets ratio. Asset Growth is the change in total assets scaled by the lagged assets. Sales Growth is the change in net sales scaled by the lagged net sales. Cash/A is the cash to assets ratio. Current Ratio is current assets divided by current liabilities. Non-cash Working Capital/A the difference between non-cash current assets and non-current-debt current liabilities scaled by total assets. Leverage is total debt (the sum of short-term and long-term debt) divided by total assets. Net debt issues (∆D /A) equals long-term debt issuance - long-term debt reduction + the change in short-term debt, scaled by total assets. Net equity issue (∆E /A) equals the sale of common and preferred stock minus the purchase of common and preferred stock, scaled by total assets. Firms are defined to issue debt or equity if the amount of issuance exceeds 3% of total assets. Dividends/A is the cash dividends to assets ratio. D1+/D is the proportion of debt that is due in more than one year. D3+/D is the proportion of debt that is due in more than three years. D5+/D the proportion of debt that is due in more than five years. Debt Rating is a dummy variable that takes a value of 1 if a firm has long-term debt rated by Standard & Poor’s. Term spread is the difference between the December 10- year Treasury bond yield and the annualized December 3-month Treasury bill yield (times 100). Panel A compares the average values of firm-specific variables between firms that start reclassification at time t and those who do not. Panel B compares the average values of firm-specific variables between firms that end reclassification at time t and those who do not.
40

41
Panel A: Start reclassification at t or not Panel B: End reclassification at t or not No Yes No Yes No Yes No Yes No Yes No Yes t - 1 t t + 1 t - 1 t t + 1 RecD 0 0 0 1 0.08 0.69 1 1 1 0 0.81 0.29 MoreRecD 0 0 0 0.62 0.05 0.22 0.36 0.27 0.27 0 0.21 0.15 RecA 0 0 0 0.11 0.01 0.08 0.14 0.09 0.13 0 0.10 0.03 Ln(Assets) 6.65 6.67 6.74 6.87 6.84 6.94 7.13 6.93 7.22 6.97 7.28 7.05 Tangibility 0.28 0.35 0.28 0.35 0.27 0.35 0.39 0.35 0.38 0.34 0.37 0.33 ROA 0.13 0.16 0.13 0.15 0.13 0.14 0.15 0.14 0.15 0.14 0.15 0.14 ROE 0.03 0.07 0.03 0.10 0.04 0.08 0.11 0.02 0.08 0.00 0.06 0.02 Cash Flow/A 0.13 0.14 0.12 0.14 0.12 0.13 0.13 0.12 0.12 0.12 0.12 0.13 MB 2.41 1.94 2.36 1.79 2.32 1.75 1.68 1.72 1.64 1.76 1.64 1.77 Stock Return 0.26 0.25 0.23 0.15 0.22 0.14 0.16 0.15 0.14 0.21 0.15 0.19
Excess Stock Return 0.14 0.10 0.11 0.02 0.09 0.01 0.02 0.07 0.02 0.12 0.05 0.09 Capital Expenditure/A 0.08 0.09 0.07 0.10 0.07 0.08 0.09 0.08 0.08 0.07 0.08 0.07 Acquisition/A 0.03 0.05 0.03 0.11 0.04 0.04 0.06 0.05 0.05 0.03 0.04 0.05 Asset Growth 0.21 0.21 0.17 0.33 0.17 0.12 0.20 0.14 0.14 0.10 0.11 0.14 Sales Growth 0.19 0.20 0.16 0.21 0.16 0.16 0.17 0.13 0.14 0.10 0.11 0.10 Cash/A 0.18 0.08 0.18 0.05 0.18 0.06 0.04 0.05 0.04 0.08 0.04 0.08 Current Ratio 2.81 2.02 2.76 1.89 2.70 1.96 1.81 1.88 1.79 1.93 1.78 2.00 Non-cash Working Capital/A 0.13 0.14 0.12 0.14 0.12 0.14 0.15 0.15 0.14 0.14 0.14 0.13 ∆Cash/A 0.07 0.03 0.05 -0.02 0.04 0.01 0.00 0.00 0.01 0.04 0.01 0.02 ∆Working Capital/A 0.01 0.02 0.01 0.04 0.01 0.02 0.02 0.02 0.01 0.00 0.01 0.01 Leverage 0.18 0.23 0.18 0.28 0.19 0.27 0.31 0.28 0.31 0.25 0.31 0.25 ∆D /A 0.02 0.01 0.02 0.11 0.03 0.03 0.05 0.02 0.03 0.00 0.02 0.03 ∆E /A 0.07 0.05 0.03 0.00 0.02 0.01 0.01 0.02 0.00 0.02 0.00 0.01
Fraction of firms issuing debt 0.22 0.25 0.21 0.55 0.24 0.37 0.43 0.35 0.38 0.26 0.35 0.28
Fraction of firms issuing equity 0.18 0.15 0.16 0.11 0.14 0.11 0.10 0.12 0.08 0.15 0.08 0.10 Fraction of firm having debt rated 0.51 0.54 0.52 0.57 0.54 0.59 0.62 0.60 0.65 0.63 0.67 0.64 Dividends/A 0.01 0.01 0.01 0.01 0.01 0.01 0.01 0.01 0.01 0.01 0.01 0.01 D1+/D 0.73 0.76 0.74 0.88 0.75 0.87 0.91 0.88 0.91 0.78 0.89 0.82 D3+/D 0.54 0.55 0.54 0.66 0.54 0.65 0.64 0.60 0.64 0.60 0.64 0.63 D5+/D 0.38 0.40 0.37 0.39 0.37 0.38 0.36 0.38 0.36 0.43 0.38 0.44 Term Spread 1.87 1.82 1.73 1.59 1.50 1.36 1.64 1.72 1.53 1.79 1.47 1.72
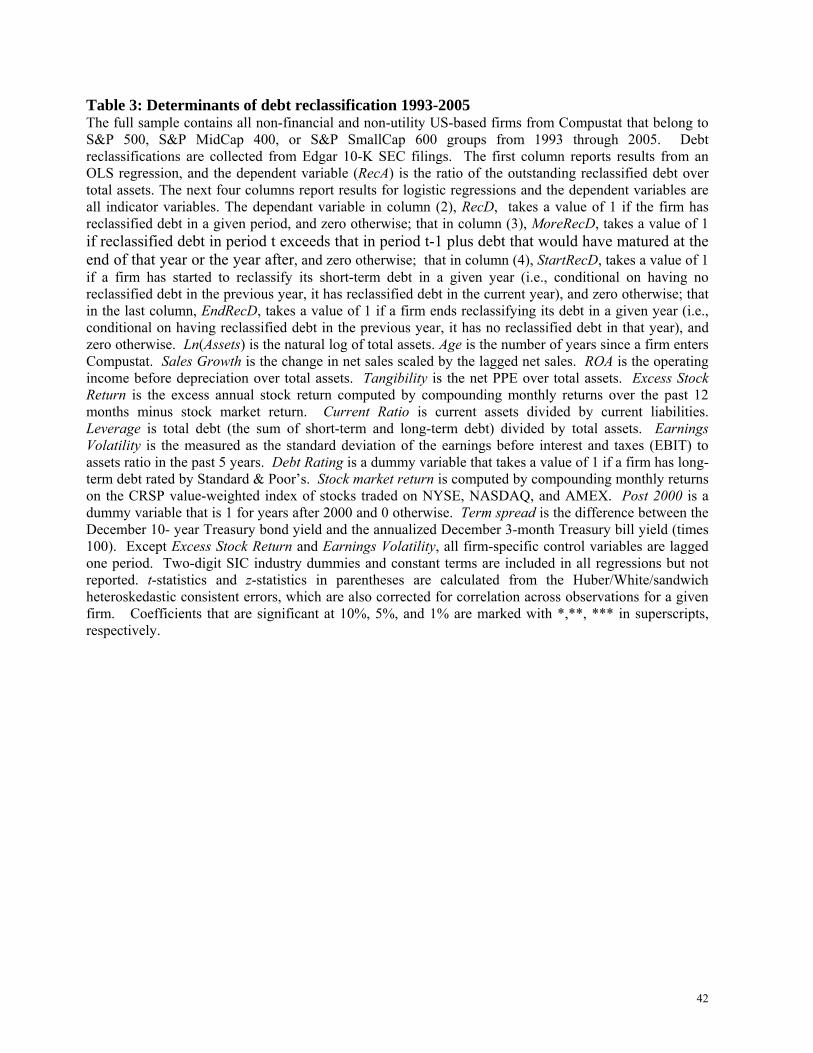
Table 3: Determinants of debt reclassification 1993-2005 The full sample contains all non-financial and non-utility US-based firms from Compustat that belong to S&P 500, S&P MidCap 400, or S&P SmallCap 600 groups from 1993 through 2005. Debt reclassifications are collected from Edgar 10-K SEC filings. The first column reports results from an OLS regression, and the dependent variable (RecA) is the ratio of the outstanding reclassified debt over total assets. The next four columns report results for logistic regressions and the dependent variables are all indicator variables. The dependant variable in column (2), RecD, takes a value of 1 if the firm has reclassified debt in a given period, and zero otherwise; that in column (3), MoreRecD, takes a value of 1 if reclassified debt in period t exceeds that in period t-1 plus debt that would have matured at the end of that year or the year after, and zero otherwise; that in column (4), StartRecD, takes a value of 1 if a firm has started to reclassify its short-term debt in a given year (i.e., conditional on having no reclassified debt in the previous year, it has reclassified debt in the current year), and zero otherwise; that in the last column, EndRecD, takes a value of 1 if a firm ends reclassifying its debt in a given year (i.e., conditional on having reclassified debt in the previous year, it has no reclassified debt in that year), and zero otherwise. Ln(Assets) is the natural log of total assets. Age is the number of years since a firm enters Compustat. Sales Growth is the change in net sales scaled by the lagged net sales. ROA is the operating income before depreciation over total assets. Tangibility is the net PPE over total assets. Excess Stock Return is the excess annual stock return computed by compounding monthly returns over the past 12 months minus stock market return. Current Ratio is current assets divided by current liabilities. Leverage is total debt (the sum of short-term and long-term debt) divided by total assets. Earnings Volatility is the measured as the standard deviation of the earnings before interest and taxes (EBIT) to assets ratio in the past 5 years. Debt Rating is a dummy variable that takes a value of 1 if a firm has long-term debt rated by Standard & Poor’s. Stock market return is computed by compounding monthly returns on the CRSP value-weighted index of stocks traded on NYSE, NASDAQ, and AMEX. Post 2000 is a dummy variable that is 1 for years after 2000 and 0 otherwise. Term spread is the difference between the December 10- year Treasury bond yield and the annualized December 3-month Treasury bill yield (times 100). Except Excess Stock Return and Earnings Volatility, all firm-specific control variables are lagged one period. Two-digit SIC industry dummies and constant terms are included in all regressions but not reported. t-statistics and z-statistics in parentheses are calculated from the Huber/White/sandwich heteroskedastic consistent errors, which are also corrected for correlation across observations for a given firm. Coefficients that are significant at 10%, 5%, and 1% are marked with *,**, *** in superscripts, respectively.
42

OLS Logit regressions (1) (2) (3) (4) (5)
Dependent Variables: RecA RecD MoreRecD StartRecD EndRecD Ln(Assets) -0.003*** 0.042 -0.141*** -0.158*** -0.140*** (-3.04) (1.09) (-3.89) (-3.97) (-3.06) Ln(Age) -0.010*** -0.209*** -0.268*** -0.140* -0.018 (-4.57) (-3.17) (-4.08) (-1.93) (-0.26) Sales Growth 0.006*** 0.256*** 0.192*** 0.161*** -0.444** (3.46) (4.97) (3.93) (2.82) (-2.07) ROA 0.049*** 2.415*** 3.568*** 2.878*** -0.938 (6.03) (5.14) (7.37) (6.15) (-1.10) Tangibility 0.019** 0.478* 0.255 0.295 -0.385 (2.07) (1.91) (1.03) (1.04) (-1.29) MB -0.002*** -0.275*** -0.221*** -0.195*** 0.063 (-4.31) (-6.48) (-5.17) (-4.74) (0.98) Excess Stock Return -0.007*** -0.274*** -0.406*** -0.283*** 0.195*** (-6.69) (-7.16) (-6.07) (-3.78) (2.91) Current Ratio -0.001*** -0.187*** -0.107*** -0.214*** -0.078 (-3.31) (-5.83) (-3.56) (-5.34) (-1.38) Leverage 0.141*** 3.222*** 0.322 1.038*** -1.237***
(13.82) (12.79) (1.36) (3.84) (-3.78) Earnings Volatility -0.038*** -4.092*** -2.992*** -2.450** 2.434* (-3.10) (-3.65) (-2.98) (-2.16) (1.79) Debt Rating -0.016*** -0.344*** 0.121 0.029 0.274** (-3.99) (-3.25) (1.06) (0.25) (2.47) Stock Market Return -0.002 -0.386*** 0.17 -0.222 -0.078 (-0.50) (-3.79) (0.90) (-1.05) (-0.35) Post 2000 -0.012*** -0.290*** -0.428*** -0.179* 0.624*** (-5.64) (-4.24) (-4.34) (-1.74) (5.86) Term Spread -0.008*** -0.156*** -0.245*** -0.100** 0.080* (-9.34) (-6.78) (-6.33) (-2.20) (1.65) Observations 14902 14866 11837 9126 4698 R2 /Pseudo R2 0.15 0.17 0.10 0.09 0.06
43

Table 4: Determinants of the size of debt reclassification - Robustness checks The full sample contains all non-financial and non-utility US-based firms from Compustat that belong to S&P 500, S&P MidCap 400, or S&P SmallCap 600 groups from 1993 through 2005. Debt reclassifications are collected from Edgar 10-K SEC filings. The dependent variable (RecA) is the ratio of the outstanding reclassified debt over total assets (RecA). Column (1) reports the results from a regression that incorporates firm-fixed effects. The regression in column (2) incorporates a Tobit specification which addresses the concern that reclassified debt cannot be negative. Column (3) reports an OLS regression with a line of credit dummy. Column (4) conditions the regression on the existence of lines of credit, based on Sufi’s (2007) sample. Column (5) reports the results from a Heckman selection model in which the availability of lines of credit is endogenized. Ln(Assets) is the natural log of total assets. Age is the number of years since a firm enters Compustat. Sales Growth is the change in net sales scaled by the lagged net sales. ROA is the operating income before depreciation over total assets. Tangibility is the net PPE over total assets. Excess Stock Return is the excess annual stock return computed by compounding monthly returns over the past 12 months minus stock market return. Current Ratio is current assets divided by current liabilities. Leverage is total debt (the sum of short-term and long-term debt) divided by total assets. Earnings Volatility is the measured as the standard deviation of the earnings before interest and taxes (EBIT) to assets ratio in the past 5 years. Debt Rating is a dummy variable that takes a value of 1 if a firm has long-term debt rated by Standard & Poor’s. Stock market return is computed by compounding monthly returns on the CRSP value-weighted index of stocks traded on NYSE, NASDAQ, and AMEX. Post 2000 is a dummy variable that is 1 for years after 2000 and 0 otherwise. Term spread is the difference between the December 10- year Treasury bond yield and the annualized December 3-month Treasury bill yield (times 100). Except Excess Stock Return and Earnings Volatility, all firm-specific control variables are lagged one period. Two-digit SIC industry dummies and constant terms are included in all regressions but not reported. t-statistics and z-statistics in parentheses are calculated from the Huber/White/sandwich heteroskedastic consistent errors, which are also corrected for correlation across observations for a given firm. Coefficients that are significant at 10%, 5%, and 1% are marked with *,**, *** in superscripts, respectively.
44

(1) (2) (3) (4) (5)
Dependent Variable: RecA Firm fixed
effects Tobit OLS
OLS conditional on having
lines of credit
Heckman
Lines of Credit 0.015*** (4.38) Ln(Assets) 0.001 -0.005*** -0.004*** -0.004*** -0.004*** (0.28) (-2.58) (-2.76) (-2.88) (-3.76) Ln(Age) -0.009* -0.024*** -0.011*** -0.011*** -0.013*** (-1.78) (-7.54) (-3.83) (-3.68) (-7.28) Sales Growth 0.003*** 0.022*** 0.005*** 0.008*** 0.008*** (2.65) (6.31) (2.90) (3.20) (3.98) ROA 0.027*** 0.272*** 0.046*** 0.073*** 0.047*** (4.19) (11.00) (4.55) (5.42) (3.36) Tangibility 0.049*** 0.035*** 0.020* 0.02 0.021*** (4.41) (2.78) (1.71) (1.56) (2.8) MB -0.001*** -0.023*** -0.002*** -0.003*** -0.002** (-2.89) (-11.01) (-3.37) (-4.06) (-2.07) Excess Stock Return -0.005*** -0.027*** -0.008*** -0.009*** -0.009*** (-5.39) (-8.09) (-6.02) (-5.90) (-5.55) Current Ratio 0.000 -0.016*** -0.001 -0.001 0.000 (0.15) (-9.11) (-1.42) (-0.94) (0.01) Leverage 0.052*** 0.368*** 0.165*** 0.175*** 0.154***
(6.29) (28.20) (11.80) (11.53) (17.87) Earnings Volatility 0.009 -0.271*** -0.032** -0.053** -0.032** (0.94) (-8.04) (-2.11) (-2.08) (-1.98) Debt Rating -0.024*** -0.038*** -0.017*** -0.018*** -0.018*** (-6.22) (-7.38) (-3.25) (-3.39) (-5.97) Stock Market Return -0.004 -0.025** -0.001 0.000 -0.001 (-1.22) (-2.18) (-0.20) (0.02) (-0.18) Post 2000 -0.010*** -0.034*** -0.012*** -0.013*** -0.012** (-4.58) (-6.75) (-3.67) (-3.65) (-2.4) Term Spread -0.008*** -0.020*** -0.008*** -0.008*** -0.008*** (-10.76) (-8.76) (-5.23) (-5.06) (-3.66) Observations 14902 14902 8604 7838 8113 R2 /Pseudo R2 0.50 0.39 0.18 0.18 -
45

Table 5: Substitution between reclassified debt and other debt
The full sample contains all non-financial and non-utility US-based firms from Compustat that belong to S&P 500, S&P MidCap 400, or S&P SmallCap 600 groups from 1993 through 2005. Debt reclassifications are collected from Edgar 10-K SEC filings. In columns (1)-(3), we report estimates from three Logistic regressions. In column (1), the dependent variable takes a value of 1 if the amount of long-term debt issue from firms’ cash flow statement (which includes change in reclassified debt) less change in reclassified debt exceeds 3% of the book value of assets, and zero if reclassified debt exceeds 3% of book value of assets (cases in which both of these exceed 3% of book value of assets are dropped). In column (2), the dependent variable takes a value of 1 if the change in debt maturing in more than five years based on firms’ balance sheet data exceeds 3% of book value of assets, and zero if reclassified debt exceeds 3% of book value (again, cases in which both of these exceed 3% of book value of assets are dropped). In column (3), the dependent variable takes a value of 1 if debt in current liability less the current portion of long-term debt exceeds 3% of book value of assets, and zero if reclassified debt exceeds 3% of book value (cases in which both of these exceed 3% of book value of assets are dropped). In columns (4) and (5), the estimated model is a maximum likelihood multinomial (polytomous) logistic model. The dependent variable y represents three categories of debt financing. “y=1” (Short-term debt issues) corresponds to issue years in which the debt in current liability less the current portion of long-term debt exceeds 3% of book value of assets. “y=2” (Debt reclassification) corresponds to firm-years in which reclassified debt exceeds 3% of book value of assets. “y=3” (Long-term debt issues) corresponds to firm-years in which the amount of long-term debt issue from firms’ cash flow statement (which includes change in reclassified debt) less change in reclassified debt exceeds 3% of the book value of assets. Cases in which any two of these exceed 3% of book value of assets in the same year are dropped. The base category is “y=2”, i.e., firm has reclassified debt. Ln(Assets) is the natural log of total assets. Age is the number of years since a firm enters Compustat. Sales Growth is the change in net sales scaled by the lagged net sales. ROA is the operating income before depreciation over total assets. Tangibility is the net PPE over total assets. Excess Stock Return is the excess annual stock return computed by compounding monthly returns over the past 12 months minus stock market return. Current Ratio is current assets divided by current liabilities. Leverage is total debt (the sum of short-term and long-term debt) divided by total assets. Earnings Volatility is the measured as the standard deviation of the earnings before interest and taxes (EBIT) to assets ratio in the past 5 years. Debt Rating is a dummy variable that takes a value of 1 if a firm has long-term debt rated by Standard & Poor’s. Stock market return is computed by compounding monthly returns on the CRSP value-weighted index of stocks traded on NYSE, NASDAQ, and AMEX. Post 2000 is a dummy variable that is 1 for years after 2000 and 0 otherwise. Term spread is the difference between the December 10- year Treasury bond yield and the annualized December 3-month Treasury bill yield (times 100). Except Excess Stock Return and Earnings Volatility, all firm-specific control variables are lagged one period. Two-digit SIC industry dummies and constant terms are included in all regressions but not reported. t-statistics and z-statistics in parentheses are calculated from the Huber/White/sandwich heteroskedastic consistent errors, which are also corrected for correlation across observations for a given firm. Coefficients that are significant at 10%, 5%, and 1% are marked with *,**, *** in superscripts, respectively.
46

Logit M-Logit (1) (2) (3) (4) (5)
Dependent Variables:
Additional long-term
debt issue (1) vs.
reclassification (0)
Very long-term
debt issue (1) vs.
reclassification(0)
Short-term debt issue (1)
vs. reclassification
(0)
Short-term debt issue
Additional Long-term Debt issue
Ln(Assets) 0.128*** 0.226*** 0.146** 0.211*** 0.102** (2.75) (3.71) (2.36) (3.23) (2.15) Ln(Age) 0.008 0.02 0.490*** 0.424*** -0.044 (0.10) (0.21) (4.55) (3.84) (-0.56) Sales Growth -0.02 -0.122 -0.213 -0.161 -0.042 (-0.30) (-1.08) (-1.62) (-1.50) (-0.61) ROA -2.981*** -3.451*** -2.047** -2.708*** -3.276*** (-5.90) (-5.10) (-2.19) (-4.12) (-5.91) Tangibility 0.229 -0.198 -1.136** -1.098** 0.188 (0.79) (-0.55) (-2.57) (-2.47) (0.59) MB 0.358*** 0.408*** 0.295*** 0.338*** 0.347*** (6.89) (5.89) (3.45) (5.27) (6.17) Excess Stock Return 0.115** 0.242*** 0.09 0.079 0.134** (2.17) (3.33) (1.42) (1.09) (2.41) Current Ratio 0.03 -0.023 -0.439*** -0.371*** 0.063* (0.84) (-0.48) (-5.31) (-4.96) (1.73) Leverage -2.579*** -2.640*** -3.321*** -2.886*** -2.763***
(-8.31) (-6.80) (-7.54) (-6.96) (-8.14) Earnings Volatility 2.158 3.522*** 3.041** 2.948** 1.672 (1.47) (3.26) (2.21) (2.02) (1.21) Debt Rating 0.436*** 0.629*** 0.129 0.122 0.497*** (3.63) (4.11) (0.81) (0.70) (3.87) Stock Market Return 0.675*** 1.582*** 0.113 0.335* 0.868*** (3.73) (6.84) (0.66) (1.71) (4.36) Post 2000 0.486*** 0.566*** -0.529*** -0.516*** 0.554*** (4.92) (4.76) (-4.57) (-3.97) (5.22) Term Spread 0.113*** 0.178*** 0.174*** 0.202*** 0.142*** (2.81) (3.67) (4.40) (4.27) (3.27) Observations 4987 3348 5293 5848 5848 R2 /Pseudo R2 0.12 0.15 0.20 0.15 0.15
47

Table 6: Real impact of debt reclassification - OLS regressions The full sample contains all non-financial and non-utility US-based firms from Compustat that belong to S&P 500, S&P MidCap 400, or S&P SmallCap 600 groups from 1993 through 2005. Debt reclassifications are collected from Edgar 10-K SEC filings. The dependant variable in column (1), Sales Growth, is the change in net sales scaled by the lagged net sales. The dependent variable in column (2), Asset Growth, is the change in total assets scaled by the lagged total assets. In column (3), the dependent variable is the investment to asset ratio. In column (4), the dependent variable is the change in net working capital to asset ratio. RecA is the ratio of the outstanding reclassified debt over total assets. Ln(Assets) is the natural log of total assets. Age is the number of years since a firm enters Compustat. Sales Growth is the change in net sales scaled by the lagged net sales. ROA is the operating income before depreciation over total assets. Tangibility is the net PPE over total assets. Excess Stock Return is the excess annual stock return computed by compounding monthly returns over the past 12 months minus stock market return. Current Ratio is current assets divided by current liabilities. Leverage is total debt (the sum of short-term and long-term debt) divided by total assets. Earnings Volatility is the measured as the standard deviation of the earnings before interest and taxes (EBIT) to assets ratio in the past 5 years. R&D / Sales is the research and development expenses scaled by total sales. R&D Dummy is a dummy variable which equals1 if research and development expense is missing, 0 otherwise. GDP Growth is the difference of logs of real Gross Domestic Product in 1996 dollars. (Source: U.S. Department of Commerce, Bureau of Economic Analysis.) Corporate Profit Growth is the difference of logs of aggregate annual corporate profits after tax for non-financial firms. (Source: U.S. Department of Commerce, Bureau of Economic Analysis). Except RecA, Excess Stock Return and Earnings Volatility, all firm-specific control variables are lagged one period. Two-digit SIC industry dummies and constant terms are included in all regressions but not reported. t-statistics in parentheses are calculated from the Huber/White/sandwich heteroskedastic consistent errors, which are also corrected for correlation across observations for a given firm. Coefficients that are significant at 10%, 5%, and 1% are marked with *,**, *** in superscripts, respectively.
48

(1) (2) (3) (4)
Dependent Variables: Sales Growth Asset Growth Investment /
Assets Δ Working
Capital/AssetsRecA 0.447*** 0.970*** 0.455*** 0.133*** (8.04) (11.21) (14.02) (9.69) Lagged dependent variable 0.098*** 0.057*** 0.048*** 0.082*** (3.49) (3.05) (3.22) (3.33) Ln(Assets) -0.008** -0.018*** -0.012*** -0.006*** (-2.38) (-4.94) (-7.34) (-9.54) Ln(Age) -0.052*** -0.029*** -0.020*** -0.005*** (-6.53) (-4.15) (-5.86) (-3.61) Sales Growth 0.012 0.004
(1.58) (1.46) ROA -0.318*** 0.099 0.250*** 0.040** (-3.18) (0.78) (4.01) (2.57) Tangibility 0.02 -0.014 0.098*** -0.023*** (0.75) (-0.46) (6.19) (-4.83) MB 0.040*** 0.072*** 0.023*** 0.003*** (7.10) (6.08) (6.83) (2.61) Excess Stock Return 0.097*** 0.160*** 0.040*** 0.006*** (15.64) (9.87) (7.44) (2.75) Leverage 0.003 -0.236*** -0.153*** -0.038*** (0.10) (-7.46) (-9.95) (-5.71) Earnings Volatility 0.109 0.243** 0.078 -0.041** (0.92) (2.17) (1.55) (-2.19) R&D/Sales 0.199*** -0.029*** -0.005 -0.002
(4.10) (-2.70) (-1.21) (-1.63) R&D Dummy 0.040*** 0.032*** 0.007 0.003 (4.40) (3.31) (1.46) (1.16) Z Score 0.023** 0.003 -0.007** -0.001 (2.07) (0.56) (-2.02) (-1.12) Dividend/Assets 0.048 -0.311* -0.06 -0.002 (0.23) (-1.73) (-0.79) (-0.05) GDP Growth 1.692*** 0.921*** 0.299** 0.223*** (5.61) (2.88) (1.98) (3.42) Corporate Profit Growth 0.002*** 0.000* 0.000 0.000*** (8.08) (1.74) (0.73) (5.50) Observations 14786 14786 14773 14758 R2 /Pseudo R2 0.22 0.22 0.19 0.08
49

Table 7: Real impact of debt reclassification – Simultaneous equations The full sample contains all non-financial and non-utility US-based firms from Compustat that belong to S&P 500, S&P MidCap 400, or S&P SmallCap 600 groups from 1993 through 2005. Debt reclassifications are collected from Edgar 10-K SEC filings. Four sets of simultaneous equations are estimated using the two-stage least squares method of estimation. In each of these pairs of simultaneous equations, the amount of reclassified debt (RecA) is treated as one of the endogenous variables, and the other endogenous variable is, alternatively, either sales growth, or asset growth, or investment over assets, or change in working capital over assets. The dependant variable in column (1), Sales Growth, is the change in net sales scaled by the lagged net sales. The dependent variable in column (2), Asset Growth, is the change in total assets scaled by the lagged total assets. In column (3), the dependent variable is the investment to asset ratio. In column (4), the dependent variable is the change in net working capital to asset ratio. RecA is the ratio of the outstanding reclassified debt over total assets. Ln(Assets) is the natural log of total assets. Age is the number of years since a firm enters Compustat. Sales Growth is the change in net sales scaled by the lagged net sales. ROA is the operating income before depreciation over total assets. Tangibility is the net PPE over total assets. Excess Stock Return is the excess annual stock return computed by compounding monthly returns over the past 12 months minus stock market return. Current Ratio is current assets divided by current liabilities. Leverage is total debt (the sum of short-term and long-term debt) divided by total assets. Earnings Volatility is the measured as the standard deviation of the earnings before interest and taxes (EBIT) to assets ratio in the past 5 years. R&D / Sales is the research and development expenses scaled by total sales. R&D Dummy is a dummy variable which equals1 if research and development expense is missing, 0 otherwise. GDP Growth is the difference of logs of real Gross Domestic Product in 1996 dollars. (Source: U.S. Department of Commerce, Bureau of Economic Analysis.) Corporate Profit Growth is the difference of logs of aggregate annual corporate profits after tax for non-financial firms. (Source: U.S. Department of Commerce, Bureau of Economic Analysis). Except RecA, Excess Stock Return and Earnings Volatility, all firm-specific control variables are lagged one period. Two-digit SIC industry dummies and constant terms are included in all regressions but not reported. t-statistics in parentheses are calculated from the Huber/White/sandwich heteroskedastic consistent errors, which are also corrected for correlation across observations for a given firm. Coefficients that are significant at 10%, 5%, and 1% are marked with *,**, *** in superscripts, respectively.
50

(1) (2) (3) (4)
Dependent Variables: Sales Growth Asset Growth Investment /
Assets Δ Working
Capital/AssetsRecA 2.392*** 2.207*** 0.788*** 0.376*** (6.22) (6.25) (4.94) (4.66) Lagged dependent variable 0.095*** 0.043*** 0.038*** 0.079*** (14.94) (7.02) (5.43) (10.27) Ln(Assets) 0.003 -0.010*** -0.010*** -0.005*** (0.81) (-2.79) (-5.95) (-6.06) Ln(Age) -0.028*** -0.016** -0.017*** -0.002 (-3.75) (-2.15) (-5.02) (-1.22) Sales Growth 0.012*** 0.003*
(3.70) (1.82) ROA -0.428*** 0.085* 0.206*** 0.027*** (-8.91) (1.90) (10.49) (2.73) Tangibility -0.03 -0.058** 0.092*** -0.030*** (-1.13) (-2.16) (7.57) (-5.34) MB 0.044*** 0.074*** 0.024*** 0.003*** (18.97) (32.42) (22.40) (6.62) Excess Stock Return 0.112*** 0.169*** 0.043*** 0.007*** (16.88) (25.92) (14.26) (5.39) Leverage -0.261*** -0.405*** -0.194*** -0.071*** (-4.73) (-7.86) (-8.32) (-6.21) Earnings Volatility 0.177*** 0.299*** 0.099*** -0.031*** (3.52) (5.98) (4.20) (-2.93) R&D/Sales 0.192*** -0.013*** 0.000 -0.001
(29.83) (-2.66) (0.07) (-1.14) R&D Dummy 0.043*** 0.048*** 0.020*** 0.005** (3.99) (5.17) (4.85) (2.28) Z Score 0.021*** 0.002 -0.003** -0.001* (7.24) (0.76) (-2.46) (-1.73) Dividend/Assets -0.026 -0.327*** -0.091** -0.018 (-0.22) (-3.23) (-2.19) (-0.69) GDP Growth -0.087 -0.372 -0.118 -0.008 (-0.20) (-1.01) (-0.75) (-0.09) Corporate Profit Growth 0.002*** 0.000 -0.000** 0.000*** (5.77) (0.80) (-2.19) (3.76) Observations 14786 14786 14773 14758
51

Table 8: Real impacts of debt reclassification: Matching reclassifying firm based on a 4-way matching procedure The full sample contains all non-financial and non-utility US-based firms from Compustat that belong to S&P 500, S&P MidCap 400, or S&P SmallCap 600 groups from 1993 through 2005. Debt reclassifications are collected from Edgar 10-K SEC filings. The single-firm, four-way matching methodology is employed based on industry, size, market-to-book ratio and sales growth. In order to find each reclassifying firm’s closest match we first limit the sample of potential matches to those firms who do not reclassify short-term debt in a particular year. All firms in the same industry as the reclassifier based on the 2-digit SIC industry classification are found. We require at least five potential matches for each reclassifying firm, otherwise it is omitted from the sample. The absolute difference between the sample firm’s size, market-to-book ratio and sale growth and those of potential matches is then deflated by each variable’s respective standard deviation. Size is estimated using the beginning-or-period book value of assets. Similarly, market-to-book and sale growth are estimated at the beginning of the fiscal year. Matches are chosen for each reclassifying firm by minimizing the sum of the standardized differences in size, market-to-book ratio and sale growth for firms in the same industry. Namely, we select matches by solving the following:
(| | | | | |)Size SaleGrowthMB
Size MB SaleGrowth
diff diffdiffMinσ σ σ
+ +
where diff is the difference between the sample firm’s size (MB, Sales Growth) and that of the matching firm. Reported are the difference in growth and investment variables between reclassifiers and their matches. Differences that are significant at 10%, 5%, and 1% are marked with *,**, *** in superscripts, respectively.
(1) (2) (3) Reclassifiers Non-
reclassifiers Difference
Sales Growth 0.165 0.110 0.056*** (8.6) Assets Growth 0.187 0.121 0.066*** (8.4) Investment/Assets 0.153 0.111 0.042*** (13.6) Δ Working Capital/Assets 0.022 0.010 0.012*** (7.5) N 4842 4842
52

53
Table 9: Debt reclassification and cash flow sensitivities – Estimated with firm fixed effects
The full sample contains all non-financial and non-utility US-based firms from Compustat that belong to S&P 500, S&P MidCap 400, or S&P SmallCap 600 groups from 1993 through 2005. Debt reclassifications are collected from Edgar 10-K SEC filings. The dependent variables in the first four columns represent different uses of cash – investment, addition to non-cash working capital, dividend payout, and addition to cash holdings. The dependent variables in the last three columns are change in debt and equity issuance and additional debt issuance net of newly reclassified debt. Regressions are run separately for each of these uses of cash, and additional debt and equity issues. Additional debt issue is the amount of total debt issue from firms’ cash flow statement (which includes change in reclassified debt) less change in reclassified debt. Regressions are estimated with firm and year fixed effects. Constant terms are included in all regressions but not reported. t-statistics in parentheses are calculated from the Huber/White/sandwich heteroskedastic consistent errors. Coefficients that are significant at 10%, 5%, and 1% are marked with *,**, *** in superscripts, respectively.
(1) (2) (3) (4) (5) (6) (7) (8) (9)
Investment/Assets
ΔNWC/ Assets
Dividend/ Assets
ΔCash/ Assets ΔD/Assets ΔE/Assets
Additional debt
issue/Assets
Additional LT debt
issue/Assets
ST debt issue/Assets
MB 0.025*** 0.002* 0.000*** 0.023*** 0.009*** 0.025*** 0.006*** 0.006*** -0.001*** (5.50) (1.86) (4.96) (4.61) (4.13) (4.53) (3.41) (3.64) (-2.81) Cash Flow/Assets 0.425*** 0.245*** 0.007*** 0.236*** 0.071*** -0.220* 0.035* 0.022 0.013** (6.56) (7.63) (5.75) (2.87) (2.67) (-1.72) (1.68) (1.08) (2.45) Ln(Assets) -0.097*** -0.006 0.000 -0.096*** -0.036*** -0.124*** -0.026*** -0.027*** 0.001* (-13.04) (-1.55) (1.11) (-9.91) (-7.36) (-9.97) (-6.08) (-6.60) (1.75) RecA 0.324*** 0.029 -0.005* 0.096** 0.423*** -0.033 -0.220*** -0.224*** 0.004 (4.60) (0.61) (-1.94) (2.26) (6.76) (-0.52) (-4.71) (-5.14) (0.41) RecA×Cash Flow/Assets 1.398*** 0.138 0.021 -1.310*** 1.076** -0.299 0.192 0.283 -0.091** (2.93) (0.43) (1.20) (-5.21) (2.56) (-0.79) (0.73) (1.15) (-2.26) Observations 14893 14890 14892 14885 14890 14891 13900 13901 13900 Adj. R2 0.27 0.11 0.68 0.13 0.11 0.21 0.03 0.03 -0.04

Appendix A: Variable Definitions
Variables Definitions Age The number of years since the firm entered Compustat. Acquisition/A The acquisitions to assets ratio. Log (Assets) The natural log of total assets. Asset Growth The change in total assets scaled by the lagged assets. Additional debt issue The amount of total debt issue from firms’ cash flow statement (which
includes change in reclassified debt) less change in reclassified debt Additional long-term debt issue
The amount of long-term debt issue from firms’ cash flow statement (which includes change in reclassified debt) less change in reclassified debt.
Capital Expenditure/A The capital expenditure to assets ratio. Cash/A The cash to assets ratio Cash Flow/A Internal cash flows divided by total assets. Corporate Profit Growth
The difference of logs of aggregate annual corporate profits after tax for non-financial firms. (Source: U.S. Department of Commerce, Bureau of Economic Analysis).
Credit Spread The difference between the annualized yield on the 3-month commercial paper over the rate on the 3-month US Treasury bill.
Current Ratio Current assets divided by current liabilities. ∆D /A Long-term debt issuance - long-term debt reduction + the change in
short-term debt, scaled by total assets D1+/D The proportion of debt that is due in more than one year. D3+/D The proportion of debt that is due in more than three years. D5+/D The proportion of debt that is due in more than five years. Debt Rating Dummy variable: 1 if the firm has a debt rating assigned by Standard &
Poor’s, 0 otherwise. Dividends/A The cash dividends to assets ratio. ∆E /A The sale of common and preferred stock minus the purchase of
common and preferred stock, scaled by total assets. Earnings Volatility The standard deviation of the earnings before interest and taxes (EBIT)
to assets ratio in the past 5 years. EndRecD Dummy variable: 1 if a firm ends reclassifying its debt in a given year
(i.e., conditional on having reclassified debt in the previous year, it has no reclassified debt in that year), and zero otherwise.
Excess Stock Return The excess annual stock return computed by compounding monthly returns over the past 12 months minus stock market return.
GDP Growth The difference of logs of real Gross Domestic Product in 1996 dollars. (Source: U.S. Department of Commerce, Bureau of Economic Analysis.)
Leverage (Short-term debt + long-term debt)/total assets MB (Total assets + market value of equity - book value of equity) / total
assets MoreRecD Dummy variable: 1 if reclassified debt in period t exceeds that in period
t-1 plus debt that would have matured at the end of that year or the year after, and zero otherwise.
Non-cash Working Capital/A
The difference between non-cash current assets and non-current-debt current liabilities scaled by total assets.
54

R&D / Sales Research and development expenses scaled by total sales. R&D Dummy Dummy variable: 1 if research and development expense is missing, 0
otherwise. RecA The reclassified debt scaled by total assets. RecD Dummy variable: 1 if a firm reclassifies short-term debt as long-term,
and zero otherwise. ROA Ratio of operating income before depreciation and amortization to total
assets. ROE The income before extraordinary items divided by the book value of
common equity. Sales Growth The change in net sales scaled by the lagged net sales. StartRecD Dummy variable: 1 if a firm has started to reclassify its short-term debt
in a given year (i.e., conditional on having no reclassified debt in the previous year, it has reclassified debt in the current year), and zero otherwise.
Stock market return Computed by compounding monthly returns on the CRSP value-weighted index of stocks traded on NYSE, NASDAQ, and AMEX.
Tangibility Net PPE-to-assets ratio Term spread The difference between the December 10- year Treasury bond yield and
the annualized December 3-month Treasury bill yield (times 100). Un-leveraged Z-Score (3.3× pretax income + sales + 1.4× retained earnings + 1.2×(current
assets - current liabilities)) / total assets.
55

Appendix B: Selection Equation of Column (5) Table 4 – Determinants of lines of credit The full sample contains all non-financial and non-utility US-based firms from Compustat that belong to S&P 500, S&P MidCap 400, or S&P SmallCap 600 groups from 1993 through 2005. Debt reclassifications are collected from Edgar 10-K SEC filings. The dependent variable of the selection equation is the dummy variable which equals 1 if a firm has lines of credit, zero otherwise, based on Sufi’s (2007) sample. The explanatory variables in selection equation, which predict the availability of lines of credit, are the same set of variables as in Table 3 of Sufi (2007), including EBITDA/Assets, Tangibility, Ln(Assets), Net worth to assets ratio, industry sales volatility, cash flow volatility, Traded over the counter dummy, ln(Age), and year and industry dummies. Industry sales volatility is constructed as follows. Using the entire set of firms with data available in the Compustat quarterly industrial files, for every firm-year, we calculate the standard deviation of the quarterly differences in sales, scaled by average assets over the year. We then obtain the median across all 3-digit SIC industries, for every given year. This variable is then appended to each firm-year observation with the same 3-digit SIC code. This measure is similar to the earnings variance measure used in Mackie-Mason (1990). z-statistics are in parentheses. Coefficients that are significant at 10%, 5%, and 1% are marked with *,**, *** in superscripts, respectively.
Heckman
Selection Equation
EBITDA/A 1.484*** (8.34) Tangibility 0.866*** (4.62) Ln(Assets) 0.073*** (3.68) Net Worth/Assets -2.446*** (-16.50) MB -0.056*** (-6.07) Industry Sale Volatility 0.462 (0.31) Cash Flow Volatility -0.564*** (-2.79) Traded over the counter -0.222 (-1.00) Ln(Age) -0.057 (-1.36)
56

Appendix C: Simultaneous equations – RecA regressions of Table 7 The full sample contains all non-financial and non-utility US-based firms from Compustat that belong to S&P 500, S&P Midcap 400, or S&P SmallCap 600 groups from 1993 through 2005. The dependent variable, RecA, is the ratio of the outstanding reclassified debt over total assets z-statistic are in parentheses. Coefficients that are significant at 10%, 5%, and 1% are marked with *,**, *** in superscripts, respectively.
(1) (2) (3) (4) Dependent Variable: RecA Endogeneous variables: Sales Growth Asset Growth Investment
/Assets Δ Working
Capital/AssetsEndogeneous variable 0.017*** 0.123*** 0.362*** 0.193*** (3.00) (7.89) (7.49) (2.69) Ln(Assets) -0.003*** -0.001* 0.001 -0.002** (-4.53) (-1.80) (1.09) (-2.48) Ln(Age) -0.010*** -0.005*** 0.000 -0.009*** (-7.86) (-3.08) (0.03) (-6.62) Sales Growth -0.002 0.004***
(-1.20) (3.04) ROA 0.059*** 0.017** -0.034** 0.040*** (8.65) (2.22) (-2.56) (5.68) Tangibility 0.017*** 0.022*** -0.023*** 0.022*** (3.47) (4.18) (-2.99) (4.11) MB -0.003*** -0.010*** -0.010*** -0.002*** (-5.20) (-8.60) (-8.34) (-5.36) Stock Return -0.009*** -0.026*** -0.021*** -0.008*** (-6.96) (-9.66) (-9.30) (-6.90) Leverage 0.140*** 0.148*** 0.165*** 0.141***
(29.01) (27.23) (23.32) (27.38) Earnings Volatility -0.033*** -0.065*** -0.068*** -0.028*** (-3.64) (-6.16) (-5.94) (-2.89) Current Ratio -0.001*** -0.001*** -0.001*** -0.002***
(-3.84) (-3.80) (-3.31) (-4.20) Debt Rating -0.013*** -0.009*** -0.010*** -0.012*** (-7.15) (-5.38) (-5.65) (-6.27) Stock Market Return 0.008** 0.004 0.000 0.001 (2.16) (0.81) (0.04) (0.16) Post 2000 -0.014*** -0.009*** -0.008*** -0.014*** (-8.12) (-5.45) (-5.13) (-6.61) Term Spread -0.007*** -0.006*** -0.006*** -0.007*** (-8.47) (-7.89) (-7.19) (-8.15) Observations 14786 14786 14773 14758
57