fair value reclassifications of financial assets … value reclassifications of financial assets...
TRANSCRIPT
1
Fair Value Reclassifications of Financial Assets during the Financial Crisis
Jannis Bischof University of Mannheim
Ulf Brüggemann Humboldt University of Berlin
Holger Daske University of Mannheim
June 2017
ABSTRACT. EU politicians pressured the IASB to change the accounting rules for financial assets at the peak of the financial crisis in October 2008. The new reclassification rules enabled banks to forgo the recognition of unrealized fair value losses. The accounting rules change was part of a broader set of policies directed at the recapitalization of the banking sector. This paper examines to what extent accounting reclassifications provided banks with regulatory relief and assesses informational costs that potentially outweigh the regulatory benefits of the measure. We find that the impact of reclassifications on regulatory capital is similar to other discretionary accounting choices, especially loan loss provisions, but substantially smaller in magnitude than the impact of real measures such as capital injections, dividend cuts, or the reduction in risk-weighted assets. Consistent with a trade-off between regulatory benefits and informational costs, we observe a negative market reaction to banks’ reclassification announcements that is significantly muted if the reclassification helps a bank avoid regulatory capital reductions. Additional analyses of share liquidity during the financial crisis suggest that fair value reclassifications mitigate financial statement transparency as perceived by capital market participants and shed further light on the trade-off behind the accounting choice.
JEL classification: G14, G21, G28, M41, M48 Key Words: Bank Regulation, Regulatory Capital, Fair Value Accounting, Financial Crisis, IAS 39
We appreciate the helpful comments of Yakov Amihud, Mary Barth, Günther Gebhardt, Silviu Glavan, Joerg-Markus Hitz, Bob Holthausen, Paul Klumpes, Jim Leisenring, Christian Leuz, Edgar Löw, Stuart McLeay, Scott Richardson, Katherine Schipper, Doug Skinner, Donna Street, Mary Tokar, Johannes Voget, Gero Wiechens, and Steve Young as well as workshop participants at the Global Issues in Accounting Conference (University of North Carolina at Chapel Hill), the 4th Tel Aviv International Conference in Accounting, the Workshop on Accounting and Economics in Vienna, the 33rd EAA Annual Congress in Istanbul, the INTACCT workshop in Paris, the 11th IAAER World Congress in Singapore, Cass Business School, ESMT Berlin, Georg August University Göttingen, Goethe University Frankfurt, London Business School, Maastricht University, Stockholm School of Economics, University of Chicago Booth School of Business, University of Mannheim, Vienna University of Economics and Business, and the Institute of Chartered Accountants in England and Wales, London. We thank Si Yue Li, Philip Di Salvo, Jan Schwarting, and Linda Tjoa for excellent research assistance. This project is funded by the IAAER and KPMG under the “Research Informing the IASB Standard Setting” grant. Correspondence: [email protected].
2
1. Introduction
The recapitalization of the banking sector was the key concern of politicians and regulators at
the peak of the financial crisis in October 2008. A set of government interventions such as state
guarantee schemes, the acquisition of impaired assets, or direct capital injections through bail-
outs were important parts of the recapitalization strategy in many countries. Prior literature offers
extensive evidence on the design of these financial sector rescue programs and the effectiveness
of the measures (e.g., Bank for International Settlement 2009; European Central Bank 2009,
2010; Black and Hazelwood, 2012; Cornett et al., 2013). However, banks’ regulatory capital is
in most jurisdictions linked to book equity and, therefore, bank recapitalization also hinges on
financial accounting regulation. Simultaneous to the governmental recapitalization programs, the
IASB permitted the reclassifications of financial assets out of fair value categories and into
amortized cost categories right in October 2008. The new accounting rule provided banks with
the option to forgo fair-value write-downs and, if regulatory capital was linked to IFRS
accounting, a further reduction in the capital buffer. Prior literature offers descriptive evidence
on banks’ use of the reclassification option (CESR, 2009) and the corresponding capital market
perceptions (e.g., Paananen et al., 2012; Lim et al., 2013). Little evidence exists to what extent
reclassifications ultimately contributed to the political objective of bank recapitalization, i.e.,
served as an effective means of regulatory forbearance, and on the costs that managers trade off
against the regulatory incentives in the accounting choice (Acharya and Ryan, 2016). This paper
addresses these questions.
In October 2008, the IASB adopted two amendments to IAS 39 and IFRS 7. On the one
hand, the amendments permit the reclassification of trading assets (apart from derivatives) and
available-for-sale assets into alternative accounting categories. On the other hand, they mandate
extensive footnote disclosures explaining this accounting choice. Then-IASB chairman Sir
3
David Tweedie later acknowledged that the new accounting rules were a direct response to
political pressure that mainly came from EU politicians and regulators (House of Commons
[2008]). The amendments came without any regular due process and less than one week after the
EU Commission and the Euro Summit decided on political actions intended to stabilize the
banking sector (such as direct capital injections into the banking sector through government bail-
outs or the purchase of troubled assets by government funds.). The actions, by all accounts,
aimed at the avoidance of any further bank closures, after the recent experience with the
bankruptcy of Lehman Bros. All these political decisions, including the pressure towards the
IASB, were directed at bolstering banks’ regulatory capital. The accounting measure has to be
viewed against this background and as an additional means of providing the banking sector with
regulatory relief, i.e., as an act of regulatory forbearance.
Yet, even at the peak of the 2008 financial crisis, the measure was highly controversial with
capital market participants still demanding the fair value information about troubled assets (e.g.,
André et al., 2009). Analyst and investor groups publicly argued that the new rules ‘threaten to
undermine investor confidence in company accounts’ (Financial Times, October 20, 2008). Put
differently, the potential regulatory relief came along with the general perception of a decline in
financial statement transparency. Consistent with the trade-off between regulatory benefits and
informational costs, we document a heterogeneous usage of the accounting option with only
about 40% of the 302 international banks in our sample reclassifying some financial assets out of
fair-value categories. At the same time, more than one third of the reclassifying banks do not
achieve any regulatory capital savings at all and even for many other banks, the regulatory capital
impact of reclassifications is small. This observation points to other accounting incentives,
beyond regulatory capital management, playing into the reclassification choice of bank managers,
most likely earnings management motivations.
4
In the first part of our analysis, we provide descriptive evidence on the relative importance of
the reclassification option for regulatory capital management. We find that the regulatory capital
of our sample banks, on aggregate, is higher by about EUR 19.1bn on December 31, 2008, as a
consequence of the reclassification choice. The effect is relatively at par with the effects of other
accounting-based measures such as reporting higher deferred tax assets (DTAs, EUR 23.7bn),
recognizing non-recurring revenues (EUR 3.6bn) or reporting lower loan-loss provisions (LLPs,
EUR 26.5bn). However, the effect is relatively small compared to the effects of real capital
measures such as capital injections (EUR 137.5bn) or dividend cuts (EUR 51.6bn), or the effect
of a reduction in risk-weighted assets (RWAs, EUR 75.5bn). In contrast to both accounting-
based and real capital measures which banks continue to rely on in the next financial year, the
fair value reclassifications provide for a one-time effect and are hardly used by any bank in 2009
(or thereafter). The decline of the importance arguably comes from the retroactive option that
gave bank managers the opportunity to exactly foresee the regulatory capital effect of the
accounting choice but that they were only allowed to apply for a few weeks in October until
November 1, 2008.
In the second part of our analysis, we use a two-stage approach to model the reclassification
choice. At the first stage, we test whether a bank’s reclassification choice is associated with
bank-specific incentives to increase the regulatory capital and with other recapitalization
measures. Consistent with fair value reclassifications being used for regulatory capital
management, we find that reclassifying banks are at greater risk of violating regulatory capital
restrictions. We also find that the use of the reclassification option is positively associated with a
bank’s use of capital injections, dividend cuts, or asset sales, i.e., a complement to real
recapitalization measures. At the same time, the use of the option is negatively associated with
the recognition of income-increasing discretionary loan-loss provisions, deferred tax assets, and
5
gains from non-recurring activities, i.e., a substitute to accounting-based recapitalization
measures. Since the IFRS disclosure requirements for those alternative accounting measures are
less extensive than for fair value reclassifications, the latter finding suggests that banks, when
complementing real recapitalization measures by accounting measures, tend to prefer less visible
accounting choices over fair value reclassifications. The finding is, therefore, supporting the
notion that reclassifications are associated with informational costs that banks weigh off against
potential regulatory benefits.
One obvious concern with the first-stage analysis is the plausible overlap between regulatory
capital incentives and other earnings management incentives, e.g., from management
compensation or capital market pressures. To better identify the role of regulatory capital
management in managers’ reclassification decision, we exploit plausibly exogenous cross-
country variation in the extent to which unrealized fair value gains and losses of financial assets
in the available-for-sale category are included in the regulatory capital computation (prudential
filters). More precisely, the existence of prudential filters mutes the potential impact of the
accounting choice on regulatory capital. At the same time, prudential filters for trading assets are
constant across countries. Therefore, we model the bank’s choice whether to reclassify available-
for-sale assets at the second stage conditional on the bank’s choice to use the reclassification
option. We find a negative association between the magnitude of the prudential filter and a
bank’s choice to reclassify available-for-sale assets, even after controlling for differences in asset
composition. We conclude that regulatory capital management is the most plausible explanation
for the negative association.
In the third part of our analysis, we conduct two additional sets of empirical tests to shed
further light on the trade-off behind the reclassification choice. First, we investigate short-term
reactions in equity markets around the reclassification announcements. We examine the
6
association between market expectations about banks’ reclassification choice and abnormal stock
returns around the regulatory announcement on October 13, 2008. While we observe slightly
negative abnormal returns for banks that are most likely to use the reclassification option, the
event is clearly confounded by several simultaneous government interventions into the banking
sector (see Acharya and Ryan [2016] for a detailed discussion of the weaknesses of our
approach). To overcome this challenge and disentangle market reactions to reclassification
announcements from reactions to other regulatory measures, we also investigate abnormal stock
returns around the bank-specific announcements of the reclassification choice. We observe
substantial variation in the timing of these bank-specific announcements over the period from
October 2008 to June 2009 that mitigates the potential impact from simultaneous policy actions.
We benchmark the returns of reclassifying banks against the returns of a control group of non-
reclassifying banks around earnings announcements during the same time period and document a
negative association between abnormal stock returns and the reclassification choice. Yet, the
negative association is offset for those banks for which reclassifications have the greatest impact
on regulatory capital ratios. Overall, for these cases the results point to regulatory benefits
outweighing economic costs of the reclassification choice.
Second, we focus on market liquidity of bank stocks as an established proxy for information
asymmetry among equity investors to address potential economic costs of the accounting choice.
If market participants view reclassifications of financial assets, i.e., the switch from the
recognition to the footnote disclosure of fair value information, as a decrease in bank
transparency, we expect to observe a negative association between liquidity and the
reclassification choice. Consistent with this expectation, we find that reclassifying banks
experience a significant increase in bid-ask spreads relative to non-reclassifying banks around the
introduction of the reclassification option. Additional tests reveal that the association largely
7
stems from reclassifying banks that do not fully comply with the accompanying IFRS 7
disclosure requirements. These findings are in line with the notion that fair value
reclassifications mitigate financial statement transparency as perceived by capital market
participants.
Our paper contributes to three different strands of the recent accounting literature. First and
most obviously, we add to the evidence on determinants and economic consequences of banks’
use of the IAS 39 reclassification option. Prior literature shows that the likelihood of a bank’s
reclassification choice is associated with a bank’s capital ratio and the size of the securities
portfolio (Paananen et al. [2012]). Extant evidence also suggests that the value relevance of
reclassified assets is smaller than of other assets measured at fair value (Paananen et al. [2012])
and that analyst forecasts for reclassifying banks are less accurate than for other banks (Lim et al.
[2013]). Overall, prior research already points to both regulatory capital incentives and
informational costs playing into the reclassification decision. Against this background, we put
fair value reclassification in the broader context of recapitalization measures and document the
complementarity with and the importance relative to real capital measures such as capital
injections. At the same time, we disentangle the regulatory capital incentive from concurrent
earnings management incentives by exploiting cross-country variation in prudential filters to
explain the choice between the reclassifications of trading assets and available-for-sale assets (see
Acharya and Ryan [2016] for a discussion of the benefits from this approach).
Second, we contribute to the literature that studies regulators’ use of accounting rules to
practice forbearance. Gallemore (2016) shows that bank regulators are more likely to practice
forbearance when a bank’s financial reporting is less transparent. Skinner (2008) documents how
Japanese regulators granted banks an accounting option to substantially overstate deferred tax
assets in the computation of regulatory capital during the 1990’s banking crisis. The use of the
8
option helped banks avoid costly regulatory interventions. Our study highlights that European
regulators used fair value accounting rules for a similar purpose during the 2008-09 financial
crisis, and quantifies its ex-post contribution vis-a-vis other existing as well as newly introduced
support measures in contemporaneous financial sector rescue programs.
Third, and most generally, we contribute to the academic discussion about the role of
financial accounting and, more specifically, fair value accounting during the crisis (see, e.g.,
Ryan [2008], Laux and Leuz [2009] for an overview). While a substantial number of banks made
use of the reclassification option (Fiechter [2011]) and, in select cases that were pinpointed in the
financial press, individual banks experienced a substantial regulatory relief, the overall effect on
regulatory capital is, if at all, modest. Consistent with evidence from the U.S. environment (Laux
and Leuz [2010], Badertscher et al. [2012]) and in contrast to theoretical predictions (Plantin et
al. [2008]), our findings, therefore, suggest that the institutional subtleties of international
accounting rules and bank regulation at the national level prevented fair value accounting from
having accelerated the financial crisis.
2. Background: The October 2008 Amendments to IAS 39 and IFRS 7
2.1. The Reclassification Option for Financial Assets
At the peak of the financial crisis in October 2008, the IASB forwent the regular due process
to issue amendments to IAS 39 and IFRS 7 (André et al., 2009; Howieson, 2011). The
amendments allow companies reporting under IFRS to reclassify financial assets out of
categories that require fair value measurement through profit and loss (P&L) or other
comprehensive income (OCI). Upon reclassification, the amendments also require the disclosure
of fair value changes of reclassified assets.
9
Accounting for financial assets under IAS 39 uses three different measurement bases: fair
value through profit or loss, fair value through OCI, and amortized cost (e.g., Spooner, 2007).
Trading securities, derivatives, and financial assets designated under the fair value option are
recognized at fair value through profit or loss. Available-for-sale (AFS) assets are recognized at
fair value through OCI. Loans and receivables (L&R) as well as marketable debt securities
classified as held to maturity (HTM) are recognized at amortized cost. After initial recognition,
five types of reclassifications of assets recognized at fair value are possible. The original IAS 39
only allowed the reclassification of AFS assets into the HTM category (para. 54). The
amendments issued in October 2008 introduced four additional types of reclassifications in rare
circumstances (such as the 2008 financial crisis): firms can now reclassify trading assets into the
AFS, HTM, or L&R category, and AFS assets into the L&R category. Assets for which the IAS
39 fair value option is used and financial derivatives are exempt from any reclassification.
The five types of reclassifications differ in their accounting consequences. Overall, we can
distinguish between three effects on the measurement of assets and the recognition of gains and
losses. First, reclassifications from the trading category into the HTM or L&R category affect
both future net income and equity if no impairment is triggered because fair value gains and
losses cease to be recognized in profit or loss and, thus, in equity. Second, reclassifications from
the trading category into the AFS category only affect future net income but not equity because
fair value changes continue to be included in shareholders’ equity; however, they are reported in
OCI rather than in P&L after reclassification (again, unless the asset is impaired). Accumulated
OCI, similar to retained earnings, is part of shareholders’ equity (typically reported as a
revaluation reserve or AFS reserve). Third, reclassifications from the AFS category into the L&R
or HTM category affect future equity but not net income because previous fair value gains and
losses had been reported in OCI rather than in profit and loss (unless the asset had been
10
impaired). Thus, any unrecognized fair value change after the reclassification (i.e., those that do
not trigger an impairment) will no longer be included in accumulated OCI as part of
shareholders’ equity.
The effect of reclassifications on a firm’s future income and equity depends on the
impairment rules under IAS 39. These rules determine which fair value changes continue to be
shown in net income and, thus, in retained earnings for assets now recognized at amortized cost
(in the L&R or HTM categories) or at fair value through OCI (in the AFS category). The
impairment rules require objective evidence relating to one or more specific loss events (e.g., an
actual default or a significant change in the credit rating). A decrease in fair value is not
necessarily leading to an impairment write-down if it is not accompanied by such a specific loss
event. Put differently, reclassifications affect net income and shareholders’ equity only if an
instrument’s fair value declined without an impairment being triggered. Moreover, if the asset is
reclassified into the HTM or L&R category (rather than into the AFS category), an impairment
write-down will only capture the portion of the fair value decline that results from incurred losses
but not those that result from changes in discount rates or from changes in expectations about
future losses. If the reason for the initial write-down no longer exists, impairment write-downs of
debt instruments are reversed with the increase in the carrying amount being shown in P&L.
Until November 1, 2008, reclassifications could be made retroactively, taking effect as of
any chosen date between July 1, 2008 and October 31, 2008 (para. 103H). The transitional rule
enabled a bank whose reporting period ended before November 1, 2008, but that had not yet
released its financial statement, to fully assess the reclassification effects on income and equity
during this period. In this situation, a bank was able to make the reclassification decision with
hindsight by comparing fair values of financial assets at the end of the reporting period (which
had already passed) with prior fair values during the reporting period starting on July 1, 2008. In
11
periods after November 1, 2008, any reclassification takes effect as of the reclassification date. In
this case, income and capital effects are unknown to managers at the time of the reclassification
choice because these effects fully depend on future fair value changes until the end of the
reporting period. From that point on, unrealized fair value changes are only recognized if an
impairment is triggered or an impairment write-down is reversed.
The IASB adopted the reclassification amendment to ensure the simultaneous introduction of
disclosure requirements on the use of the option (House of Commons, 2008). These disclosure
requirements are currently part of IFRS 7. They mandate the disclosure of quantitative
information about reclassification amounts and resulting accounting effects as well as qualitative
information about the rare situation that gave rise to the reclassification (para. 12A). If a
reclassifying bank complies with these disclosure requirements, an investor is able to perfectly
adjust the balance sheet and income statement for the effects of the reclassification. As a
consequence, a bank’s reclassification decision is effectively a choice between disclosing fair
value information in the footnotes versus recognizing changes in profit or loss, or in OCI.
2.2. Consequences for Banks’ Regulatory Capital
To the extent prudential supervision and regulatory capital are linked to financial reporting,
reclassifications can affect the regulatory capital that banks report to the responsible supervisory
authorities. The effect depends on country-specific regulation. In our sample countries,
unrealized gains and losses from trading assets (net of deferred taxes) are fully reflected in tier 1
capital via retained earnings. Reclassifications from the trading category, thus, affect a bank’s
tier 1 capital if unrecognized fair value changes after the reclassification date do not trigger an
impairment write-down under the new category (AFS, L&R, or HTM).

12
Major differences across countries arise from the treatment of unrealized gains and losses
from AFS assets that are recognized in accumulated OCI (i.e., revaluation reserves) if the fair
value losses do not trigger an impairment write-down. The prudential filter that is used to fully
or partially exclude those AFS revaluation reserves from regulatory capital is determined by three
main factors. First, the filter depends on the type of AFS instrument. There exist different filters
for equity securities, debt securities, and loans. We use the filter for debt securities in our
analyses because equity securities are not eligible for reclassification into amortized cost
categories and the filter for loans does not vary considerably across countries. Second, the filter
depends on the firm-specific sign of the revaluation reserves for the specific type of instrument,
that is, whether accumulated losses or accumulated gains exist. Since some countries choose a
different filter for losses than for gains, the regulatory capital effect from reclassification can
depend on firm-specific circumstances (i.e., the sign of a bank’s AFS revaluation reserves).
Third, the filter depends on whether accumulated gains and losses are calculated item-by-item or
on a portfolio basis. On an item-by-item basis, the filter is individually applied for each
instrument. On a portfolio basis, the sign of the net reserves for the portfolios of equity
securities, debt securities, and loans is relevant for the prudential filter.
The prudential filter is a percentage rate that is deducted from accumulated gains or losses of
AFS assets (net of deferred taxes, i.e., the revaluation reserves) before inclusion into regulatory
capital. All else equal, the higher the filter, the lower the potential regulatory benefit of a
reclassification during a market downturn when asset fair values decrease (unless an impairment
is triggered). Additionally, country-level regulation differs in whether the reserves (after
application of the filter) are included in tier 1 or tier 2 capital.
Consider the following example: A bank reports accumulated unrealized fair value gains
from a portfolio of AFS debt securities of CU 100 on July 1, 2008. Until September 30, 2008,
13
the fair value of the AFS portfolio decreases by CU 100 (in the absence of objective evidence that
would require an impairment write-down under HTM). By retroactively reclassifying the entire
AFS portfolio into the HTM category before releasing the interim report in October 2008, the
bank can freeze its revaluation reserves at CU 100 (the value as of July 1).1 The reclassification
affects regulatory capital to the extent that the accumulated unrealized fair value gains before
reclassification are included in tier 1 or tier 2 capital. The size of the impact depends on the
country-specific prudential filter for accumulated gains of AFS debt securities. A prudential
filter of 100% would result in the reclassification being irrelevant for regulatory capital, whereas
a prudential filter of 0% would result in the bank avoiding a capital loss of CU 100 (neglecting
any corresponding tax effect).
In addition to the filter, the regulatory capital effect of IAS 39 reclassifications hinges on the
applicability of the IFRS group accounts for the calculation of regulatory capital. IAS 1 requires
the disclosure of this choice (para. 135). For banks that compute regulatory capital based on
local GAAP equity, the regulatory capital effect of IAS 39 reclassifications is zero and, thus,
identical to the one for a bank in a country where a 100% prudential filter is symmetrically
applied to accumulated fair value gains and losses.
3. Data
Our sample selection proceeds as follows. We identify 702 financial firms with publicly
listed stocks that are classified as IFRS users for financial year 2008 in the databases BvD
Bankscope, Worldscope (Industry Groups 102 and 127) and Compustat Global (Industry Groups
4310 and 4320).2 We exclude 264 firms that are not covered by Thomson Reuters Datastream,
1 The amount is amortized over the remaining life of the debt instrument. 2 We modify the coding of the accounting standards in two ways. First, we treat banks from Taiwan as IFRS adopters
even if they are classified as Local GAAP adopters because Taiwanese SFAS 34 and 36 largely correspond to IAS 39 and IFRS 7; both standards have been effective since 2006 and the reclassification amendments were endorsed
14
our source for capital market data. We exclude another 112 firms that are not subject to external
capital oversight (hedge funds, brokerage houses, and securities firms) or for which we cannot
retrieve any data on regulatory capital. Finally, we exclude another 24 firms that do not publish a
financial report in English, French, German, or Chinese on their websites. This procedure yields
a final sample of 302 banks from 39 countries. For this sample, we manually collect detailed
information on reclassification choices and relevant disclosures from the footnotes to the first
annual financial statement following the reclassification amendments to IAS 39 and IFRS 7 on
October 13, 2008.
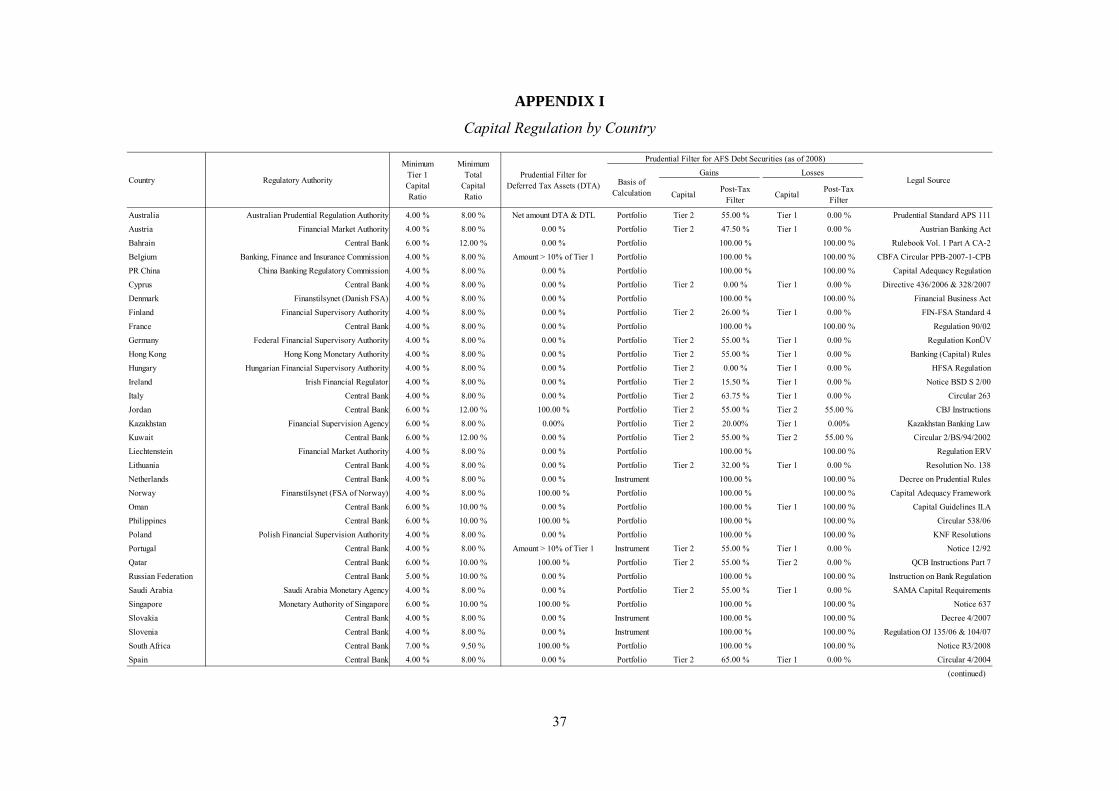
We also collect data on country-specific capital regulation. Starting from the World Bank
dataset by Čihák et al. (2012) containing basic information on total minimum capital ratios and
prudential filters for regulatory capital, we enhance this dataset with information from (i) the
CEBS (2007) report and (ii) our own survey of bank regulators from each of the 39 countries
represented in our sample, and (iii) a review of the relevant primary national legal sources.3
Appendix I summarizes our data on capital regulation in each sample country.
In our 39 sample countries, unrealized gains and losses from trading assets (net of deferred
taxes) are fully reflected in tier 1 capital via retained earnings. While 18 [2] (2) sample countries
require a filter of 100% [55%] (0%) equally to accumulated gains and losses from available-for-
sale assets, the remaining 17 sample countries treat these accumulated gains and losses
asymmetrically and require a higher filter for accumulated gains (varying from 15.5% to 100%)
than for accumulated losses (filter of 0%). Most jurisdictions apply a net approach in
immediately on October 17, 2008. Second, we change the classification of Malaysian banks from IFRS to Local GAAP because the Malaysian Accounting Standards Board declared that FRS 139 and FRS 7, which are the equivalent standards to IAS 39 and IFRS 7, were not effective before 2010.
3 We also asked whether the amendments to IAS 39 induced any regulatory changes to the determination of regulatory capital. None of the responding authorities indicated that this was the case.
15
determining this filter. However, four regulators in our sample (Netherlands, Portugal, Slovakia,
and Slovenia) require determination on an item-by-item basis.
We use a bank’s IAS 1 disclosures in the annual report for financial year 2008 (or, if these
disclosures are not available, contact the Investor Relations department of the bank) to examine
whether banks have the option to choose local GAAP over IFRS for the calculation of regulatory
capital in financial year 2008. We identify 35 banks in our sample from five countries (Austria,
Denmark, Germany, Hungary, and Norway) that do not determine regulatory capital based on
their IFRS financial statements.
We retrieve all capital market data from Thomson Reuters Datastream. For the analysis of
bank announcements, we search Dow Jones Factiva, LexisNexis, and firm websites (especially
the Investor Relations sections) to identify the first public announcement about the bank’s
reclassification choice after the adoption of the reclassification amendments. For reclassifying
banks, we search for the first specific reclassification announcement prior to the publication of
the annual financial statement. These announcements can take various forms, e.g., as part of a
separate press release, an interim report, or a pre-earnings announcement. If information on a
specific announcement is not available, we define the official filing date of the annual financial
statement containing footnote disclosures on the reclassifications as the reclassification
announcement date. For non-reclassifying banks, we use the first earnings announcement date
following the reclassification amendment.
4. Relative Importance of the Reclassification Option for Regulatory Capital Management
Our first descriptive analysis is based on the idea that banks have a range of options available
to protect regulatory capital and that bank managers simultaneously choose between different
capital management tools (as first expressed in Beatty et al. 1995). Prior studies investigate
16
reclassifications on a stand-alone bases. Instead, we benchmark the magnitude of ex-post
realized capital savings from reclassifications against other existing or newly introduced methods
of protecting or enhancing capital (“capital savings”) to gauge their economic significance. This
approach is similar to prudential regulators’ assessment of emergency measures taken around the
world through financial sector rescue programs in Fall 2008 in response to the financial crises
(e.g., BIS 2009, ECB, 2009, 2010), yet outside them considering the impact of the measures
taken by the accounting standard setter.4 These assessments show that the “take-up rates” of
recapitalization measures in general have been relatively widespread as opposed to other
emergency measures, despite that all measures were voluntary (except for rare, yet prominent
cases for which individual rescue plans were implemented, and other than forced recapitalizations
in the U.S.), similar to optional fair value reclassifications introduced by the IASB.
In order to estimate banks’ “take-up rates” of alternative capital protection methods,
Appendix II lists first the different components of capital and the methods we identify under the
Basel II capital framework (applicable to our international sample firms). We also reference
prior studies that have considered these methods usually in isolation and in other settings.
Second, we describe the methodology, data sources, and underlying assumptions that we need to
apply to quantify any capital savings of a bank using a specific method when relying on
externally available data-sources. Third, we control for possible variation in country-specific
transformation of Basel II options into national law that are relevant in quantifying a bank’s
capital protections (i.e., for Deferred Tax Assets (DTA) and AFS Securities, see Appendix I).
4 The support measures taken by governments and central banks can be classified into (i) guarantees for bank liabilities, (ii) recapitalization measures, and (iii) measures to provide relief from legacy assets (asset support/insurance). While capital injections increase the capital base (nominator), asset guarantees/insurances as well as asset purchases lower risk-weighted assets (denominator) of regulatory capital ratios. See ECB (2010) for an overview of the amounts committed and extended under national schemes, as well as other ad hoc measures.
17
Finally, we condense this information into eight methods that banks might use to protect different
components of regulatory capital (Tier 1 or Total Capital), including reclassifications.
Since capital ratios are calculated as regulatory capital divided by the sum of risk-weighted
assets (RWA), banks have basically two options to manage regulatory capital: They can either
increase the amount of regulatory capital in the nominator (by real or accounting-based measures)
and/or reduce the regulatory measure of risk in the denominator (by reducing assets or their
riskiness).
In terms of real capital measures, first, banks can augment capital by the issuance of equity
capital on public markets or by the reception of governmental capital injections (Capital
Injection) which quickly became the dominant source of funding because of banks’ difficulties in
getting financing through capital markets (ECB 2009). Any additional capital is reflected by an
increase in corresponding balance sheet items, and depending on the characteristics of the
instruments issued or received, capital injections increase Tier 1, Tier 2 or Tier 3 capital. To
cover all possibilities, we calculate the changes of share capital, share premium, and equity
hybrid securities (Tier 1) as well as subordinated debt (Tier 2), assuming that these instruments
would be Tier 1 (2) eligible.5 We further condense the selling of treasury shares into the Capital
Injection variable because they turn out to be rather immaterial empirically. Second, banks can
cut dividends to protect capital (Dividend Cuts). We identify dividend cuts by benchmarking the
2008 dividend against the average dividend of the reference period 2005-2007. Third, banks can
strategically realize gains by selling assets that are classified other than fair value through profit
or loss to realize hidden-reserves that subsequently are included into Tier 1 capital via net
income, i.e. engage in real economic transactions (Cherry-Picking). Given the tainting rule of
5 Capital injections through emergency measures were primarily conducted through the acquisition of Tier 1 eligible instruments, see ECB (2010).
18
IAS 39.52 for HTM securities and the illiquidity of L&R, we assume that all realized gains on
securities (RGS) relate to AFS instruments for which no such limitations exist, and again
benchmark RGSs of 2008 against their level in 2005-2007.
In terms of accounting-based measures, because bank capital regulation ackers on financial
statements, an extensive stream of literature examines whether banks exercise their accounting
discretion to manage regulatory capital. First, Loan loss provisions (LLP) have received
particular attention because they constitute a substantial portion of total bank accruals and require
a significant amount of judgment (Lower LLP).6 To calculate the resulting capital savings,
abnormal LLP are estimated using standard regression techniques, i.e. the portion of LLP that is
higher (or lower) than the provision that would economically be necessary. A positive residual
implies under-reserving and regulatory capital management. The capital saving is then calculated
as [Residual × Total Assets] × (1– Tax Rate) for Tier 1 capital, minus [Residual × Total Assets],
up to the applicable regulatory threshold, for Tier 2 capital (see Appendix I for details). Second,
Skinner (2008) shows that Japanese banks used their discretion over the valuation of deferred tax
assets (DTA) to meet regulatory capital requirements during the banking crisis from 1998 to
2003. Since we need to estimate the capital savings from DTAs in a specific period, we use the
total amount of deferred taxes recognized in the income statement in the reporting period, and
take into account any country-specific prudential filters since some countries fully or partially
exclude DTA from regulatory capital. Third, we look at banks’ recognition of any non-recurring
revenues, defined as revenues that are not reasonably expected to recur in the foreseeable future
6 LLP influence regulatory capital in two ways: First, any LLP that is recognized in a specific accounting period is an expense in the income statement, reducing net income (net of the tax shield) and ultimately Tier 1 capital. Second, under Basel II, LLR, i.e. the accumulated amount of total LLP recognized in the past and the present qualify as Tier 2 capital as long as they refer to unidentified future losses. However, inclusion is only eligible up to a limit of 1.25 percentage points of RWA under the SA and 0.6 percentage points of the difference between total eligible provisions and the total expected-loss amount under the IRB-approach. In case LLR exceed the regulatory threshold, additional LLP have no further impact on Tier 2 capital. For more details, see Appendix I.
19
(and thus, compared against a benchmark of zero), and that are discretionarily disclosed in
extraordinary items under IFRS (Non-Recurring Revenues). Forth, we quantify capital savings
from reclassifications (Reclassifications), as described in section 2.2.
Finally, banks can reduce the regulatory measure of risk in the denominator of the capital
ratio (RWA Reduction). This effect can be achieved by reducing the asset base, shifting from
assets with high risk-weight to lower risk-weight assets or a combination of both. During the
crisis, central banks and governments supported the reduction of RWA with asset relief programs
in which banks were able to transfer distressed or illiquid assets with high capital charges to
separate institutions (“bad banks”). We therefore compare the average risk-weight in 2008 with
the average risk-weight for the pre-crisis period 2005 to 2007 to identify the banks in our sample
that have decreased the overall riskiness of their composition of assets, and again estimate the
magnitude of their corresponding regulatory capital savings.
Table 1, Panel A, present the aggregate regulatory capital savings we estimate for each of the
eight methods. In 2008, total capital savings/injections amounted to EUR 336.8bn. As a
consequence of banks’ reclassification choices, we estimate regulatory capital of our sample
banks to be higher by about EUR 19.1bn on December 31, 2008 (5.7% of total). The effect is
relatively at par with the effects of other existing accounting-based measures such as banks’
cumulative reporting of higher deferred tax assets (DTAs, EUR 23.7bn) and the reporting of
lower loan-loss provisions (LLPs, EUR 26.5bn). Instead, recognizing gains from selling assets
with hidden reserves (cherry picking EUR 1.0bn; non-recurring revenues, EUR 3.6bn) contribute
rather little, which is not surprising given overall depressed asset prices during the crises.
However, the aggregate reclassification effect is relatively small when compared to the effects of
real capital measures such as capital injections (EUR 137.5bn) or dividend cuts (EUR 51.6bn).
Of similar large magnitude is the effect of a reduction in RWA (EUR 75.5bn). In addition, in

20
contrast to both accounting-based and real capital measures which banks continue to rely on in
the next financial year, the fair value reclassifications provide only for a one-time relief and are
hardly used by any bank in 2009 (or thereafter)7, contributing only 0.7% of total capital
savings/injections in 2009.
While capital savings from reclassifications seem rather small in aggregate, Table 1, Panel B,
shows the distribution of the capital savings as well as of the effect on capital ratios for individual
banks. We adjust all ratios such that the incremental effect of an individual measure is presented.
We also note that 40 of our sample banks would have fallen below the minimum capital ratio
without their cumulative capital savings/injections, which pinpoints the precarious situation of
many banks during the financial crisis (untabulated).
5. Research Design
5.1. Determinants of the Reclassification Choice
In the second set of analyses, we study the determinants of banks’ reclassification choice in
the financial year ending between October 2008 and September 2009 (in the following: financial
year 2008). Specifically, we focus on the first annual financial statement that a bank releases
after the regulatory announcement of the reclassification amendments to IAS 39 and IFRS 7 on
October 13, 2008. We apply a two-stage approach to model the reclassification choice. At the
first stage, we estimate the probability that a bank chooses to use the reclassification option. At
the second stage, we model the probability that a bank chooses to reclassify available-for-sale
assets conditional on the bank’s choice to use the reclassification option.
7 We check the following years until 2012 and find no evidence of further usage of reclassifications.

21
Step 1
We use the following cross-sectional probit model to estimate the probability that a bank
chooses to use the reclassification option:
P (Reclassification = 1 | X1) =
Φ (β0 + β1 Regulatory Capital Restriction + β2 Local GAAP Regulation +
β3 Accounting-Based Capital Measures + β4 Real Capital Measures + Σ βj Controlsj) (1)
where Φ (z) is the cumulative normal distribution function and X1 is the set of explanatory
variables.
The dependent variable Reclassification is an indicator variable equal to one if the bank
reclassifies trading or available-for-sale assets in accordance with IAS 39 in financial year 2008,
and zero otherwise.
The key independent variable, Regulatory Capital Restriction, is a proxy for the potential
regulatory benefits of reclassification. This variable is defined as the difference between the
minimum tier 1 capital ratio in the bank’s home country and the bank’s tier 1 capital ratio at the
end of financial year 2008 in percentage points. We adjust the bank’s tier 1 capital ratio for
reclassification effects by adding unrecognized fair value changes of reclassified trading and
available-for-sale assets to the numerator. However, we only add the portion of the unrecognized
fair value changes that would not have been subject to a prudential filter had the changes been
recognized. Since banks that are closer to violating the regulatory capital restrictions are more
likely to choose the reclassification option, we expect a positive association between Regulatory
Capital Restriction and the dependent variable Reclassification (i.e., β1 > 0).

22
The independent variable Local GAAP Regulation is an indicator equal to one if the bank’s
regulatory capital is determined based on local GAAP, and zero otherwise. Since using the
reclassification option under IFRS has no impact on regulatory capital that is determined based
on local GAAP, we expect a negative association between Local GAAP Regulation and the
dependent variable Reclassification (i.e., β2 < 0).
The remaining independent variables are proxies for the accounting-based and real capital
measures described in section 3. Accounting Based Capital Measures is an indicator variable
equal to one if the bank uses accounting-based capital measures (higher DTA, non-recurring
revenues or lower LLP) to increase its tier 1 capital in financial year 2008, and zero otherwise.
Real Capital Measures is an indicator variable equal to one if the bank uses real capital measures
(cherry picking, dividend cuts or capital injections) to increase its tier 1 capital in financial year
2008, and zero otherwise. Both variables are set to zero for banks with missing data. In
additional tests, we include separate indicators for each individual accounting-based and real
capital measure. We refrain from making clear predictions as to how accounting-based and real
capital measures are associated with the dependent variable Reclassification.
We include several variables to control for other determinants of banks’ reclassification
choice. Earnings Quality is a proxy for the quality of the bank’s financial statements before the
introduction of the reclassification option in 2008. We measure this variable by the relative
magnitude of accruals (e.g., Leuz et al., 2003; Daske et al., 2013). The magnitude of accruals is
the bank’s median ratio of yearly absolute accruals to absolute cash flows from operations over
financial years 1990 to 2007. We follow Altamuro and Beatty (2010) and use pre-tax income
before loan loss provisions as a bank-specific proxy for cash flows from operations. We convert
the variable into ranks with higher ranks representing higher reporting quality and scale the ranks
on a range of -1 and 0. We predict that the reclassification choice – and its potentially
23
detrimental effect on the perceived quality of financial statements – is more costly for banks with
higher reporting quality prior to financial year 2008. We therefore expect Earnings Quality to be
negatively associated with the dependent variable Reclassification.
We also include the variable % FV Assets to control for the proportion of financial assets that
are eligible for reclassification. We calculate this variable as the sum of the book values of
trading and available-for-sale assets scaled by the book value of total assets at the end of financial
year 2008. We adjust the variable for reclassification effects and add unrecognized fair value
changes of reclassified trading and available-for-sale assets to the numerator and the denominator
of the ratio. Since a lack of eligible financial assets precludes a bank from reclassifying, we
expect the variable % FV Assets to be positively associated with the dependent variable
Reclassification.
We use the variable Zero Earnings Threshold to control for banks’ incentive to use the
reclassification option to avoid reporting a negative net income. Zero Earnings Threshold equals
one if net income before reclassifications in financial year 2008 is negative, and zero otherwise.
Net income before reclassifications is calculated as reported net income adjusted for the
unrecognized fair value changes of the reclassified trading assets. We expect the variable to be
positively associated with the dependent variable Reclassification.
Since the zero earnings threshold is of psychological importance for private depositors
(Goldberg and Hudgins, 2002; Shen and Chih, 2005; Spiegel and Yamori, 2007), banks that
experience a decrease in deposits are likely to be more inclined to avoid reporting a loss. We
control for this incentive by including the indicator variable Zero Earnings Threshold * Δ
Deposits that is equal to one if (1) the bank experiences a change in customer deposits (scaled by
total liabilities) between financial years 2007 and 2008 that is lower than the sample median, and

24
(2) the indicator variable Zero Earnings Threshold has a value of one. Otherwise, the variable
equals zero. We expect Zero Earnings Threshold * Δ Deposits to be positively associated with
the dependent variable Reclassification.
IIF Membership equals one if a bank is a member of the International Institute of Finance
(IIF), and zero otherwise. The variable controls for the possible influence of a bank’s previous
lobbying activities on the reclassification choice. Since the IIF had a leading role in lobbying for
reclassifications, we expect this variable to be positively associated with the dependent variable
Reclassification.
Step 2
At the second stage, we estimate the probability that a bank chooses to use the
reclassification option for available-for-sale assets by exploiting that the regulatory treatment of
fair value gains and losses from these instruments varies across countries. This variation allows
for a refined test of the link between regulatory capital requirements and the reclassification
choice. We use the following cross-sectional probit model:
P (AFS Reclassification = 1 | Reclassification = 1, X2) =
Φ (δ0 + δ1 AFS Assets + δ2 AFS Prudential Filter) (2)
where Φ (z) is the cumulative normal distribution function and X2 is the set of explanatory
variables.
The dependent variable AFS Reclassification is an indicator variable that equals one if the
bank reclassifies available-for-sale assets in accordance with IAS 39 in financial year 2008, and
zero otherwise.
25
We include the variable % AFS Assets to control for the proportion of available-for-sale
financial assets that are eligible for reclassification. We calculate this variable as the sum of the
book values of available-for-sale assets scaled by the book value of total assets at the end of
financial year 2008 (adjusted for reclassification effects). Similar to equation (1), we expect the
variable % FV Assets to be positively associated with the dependent variable AFS
Reclassification as using the reclassification option requires a sufficient amount of eligible
financial assets (i.e., δ1 > 0)..
The key independent variable in equation (2), AFS Prudential Filter, accounts for cross-
country differences in the extent to which available-for-sale reclassifications potentially affect a
bank’s regulatory capital. We define AFS Prudential Filter as the proportion of the revaluation
reserves (accumulated unrealized gains and losses) from available-for-sale debt securities that is
excluded from the determination of tier 1 regulatory capital. We measure the variable at the
country level (including tax adjustments). To account for firm-specific circumstances, we make
the following adjustments: First, we use the sign of the bank’s revaluation reserves to choose the
relevant filter in countries where accumulated unrealized fair value gains and losses are treated
asymmetrically (see section 2 for details). Second, we set the filter to 100% if the bank does not
use IFRS in the calculation of its regulatory capital. Third, in countries where the filter is
determined instrument-by-instrument, we use the filter for accumulated losses (see Appendix II
for details). Since the amount of regulatory capital that a reclassification of available-for-sale
assets can potentially safeguard against further fair value declines is decreasing with the strength
of the prudential filter, we expect a negative association between the independent variable AFS
Prudential Filter and the dependent variable AFS Reclassification (i.e., δ2 < 0).
We estimate the cross-sectional probit models in equations (1) and (2) jointly by maximum
likelihood where the probability that a bank chooses to reclassify available-for-sale assets in
26
equation (2) is conditional on Reclassification being equal to one (Wooldridge, 2010: 570-571).
To compute the z-statistics, we estimate robust standard errors adjusted for heteroskedasticity.
5.2. Stock Market Reactions to Reclassification Announcements
We next perform two sets of tests to examine how capital markets perceived the overall
impact (direction) and magnitude (extent of reaction) of reclassifications, i.e., whether
reclassification announcements are associated with any meaningful abnormal stock returns. The
first set of tests analyzes stock price reactions to the regulatory announcement of the
reclassification amendments. The second set of tests examines stock price reactions to banks’
announcements of their actual reclassification choice subsequent to the introduction of the
reclassification option.
Regulatory Announcement
The first set of tests comprises cross-sectional regressions with the following basic
specification:
Abnormal Return (13/14 October 2008) =
β0 + β1 Expected Reclassification + β2 Regulatory Capital Restriction (Median Split) +
β3 Expected Reclassification * Regulatory Capital Restriction (Median Split) + ε (3)
The dependent variable is the abnormal stock return around the regulatory announcement
introducing the reclassification option on October 13 and 14, 2008.8 Specifically, the abnormal
stock return is the coefficient estimate resulting from bank-specific time-series regressions of
8 IASB approval of the reclassification amendments was announced in the late afternoon (GMT) of October 13,
2008, when the stock exchanges in several sample countries (East Asia, Australia) had already closed. We therefore use the cumulative abnormal return on October 13 and 14, 2008 to ensure that the stock market reaction in all sample countries is taken into account.
27
daily stock log-returns on the DJ STOXX 1800 market index9 and event dummies for October 13
and 14, 2008. These regressions are estimated over the period October 1, 2008 to December 31,
2008.
We include the following independent variables: Expected Reclassification is a proxy for the
unobservable market expectation about a bank’s eventual reclassification choice. We use two
different specifications for this proxy. In the first specification, Expected Reclassification (Probit
Model) is an indicator variable equal to one if the fitted probability from the reclassification
determinants model in equation (1) is higher than 0.5, and zero otherwise. In the second
specification, Expected Reclassification (Perfect Foresight) is an indicator variable equal to one
if the bank eventually uses the reclassification option in financial year 2008, and zero otherwise.
Regulatory Capital Restriction (Median Split) indicates banks with relatively strong incentives to
manage their regulatory capital. This variable is equal to one if the difference between the
minimum tier 1 capital in the bank’s home country and the bank’s tier 1 capital ratio at the end of
financial year 2008 (adjusted for reclassification effects) is below the sample median, and zero
otherwise.
Consistent with the observation that the reclassification option was highly controversial with
capital market participants (see introduction), we predict that (i) banks that are expected to use
the reclassification option experience negative abnormal stock returns around the regulatory
announcement (i.e., β1 < 0, either because reclassifications are perceived as reducing
transparency and confidence in reclassifying banks’ financial statements, or because they are
perceived as signaling fundamental weaknesses), but that (ii) this negative market reaction is
9 The DJ STOXX Global 1800 Index comprises the largest 600 firms, based on free float market capitalization, from
Europe, North and South America, and the Asia/Pacific region (e.g., Armstrong et al., 2010). Since this index also includes banks, we cannot rule out that part of the return effect we aim to detect is picked up by the market index control variable. However, this impact is likely to be rather small as the DJ STOXX Global 1800 contains only 64 of our sample banks (as of December 2008).

28
muted for banks that have relatively strong regulatory incentives (i.e., β3 > 0, by reducing the
expected costs of regulatory intervention).
We estimate equation (3) using the weighted portfolio approach by Sefcik and Thompson
(1986) to account for cross-sectional heteroskedasticity and cross-correlation of the residuals,
Bank Announcements
In the second set of tests, we analyze cross-sectional determinants of stock returns around
bank-specific announcements. We use the first reclassification announcement for reclassifying
banks and, as benchmark announcements, the first earnings announcement for non-reclassifying
banks following the reclassification amendment. The basic regression specification is as follows:
Abnormal Return (Bank Announcements) =
β0 + β1 Reclassification + β2 Regulatory Capital Effect +
Σ βj Controlsj + ε (4)
The dependent variable is the abnormal stock return around the bank-specific announcement.
The abnormal stock return is measured as the cumulative prediction error from the market model
during the announcement window [0, +1], with day 0 being the day of the reclassification
announcement (for reclassifying banks) or the corresponding earnings announcement (for non-
reclassifying banks). We estimate the market model with daily log-returns for the intervals [-60,
-11] and [+11, +60] relative to the announcement day using DJ STOXX 1800 as the market
index. Since some stocks in our sample are thinly traded, we follow the trade-to-trade approach
of Maynes and Rumsey (1993).
We include the following independent variables: Reclassification is an indicator variable
equal to one if the bank uses the reclassification option in financial year 2008, and zero
29
otherwise. Regulatory Capital Effect measures the realized impact of reclassifications on
regulatory capital. We use two different specifications for this variable. In the first specification,
Regulatory Capital Effect (Continuous) is the percentage point difference between the tier 1
capital ratio as reported and the tier 1 capital ratio excluding reclassification effects at the end of
financial year 2008. In the second specification, Regulatory Capital Effect (Dummy > 50 BP) is
an indicator variable equal to one if the continuous difference is higher than 50 basis points, and
zero otherwise. In both specifications, the variable Regulatory Capital Effect equals zero for
non-reclassifying banks.
As explained above, we predict that (i) reclassifying banks experience negative abnormal
stock returns around their reclassification announcements (i.e., β1 < 0) and that (ii) this negative
market reaction is less pronounced for banks that realize a relatively large increase in regulatory
capital through reclassifications (i.e., β2 > 0).
As a control variable, we include Earnings Surprise to capture the impact of announcing
unexpected earnings on stock prices. This indicator variable is equal to one if the announced
earnings number is higher than the most recent average analyst forecast before the
announcement, and zero otherwise. If the reclassification announcement does not coincide with
an earnings announcement, the variable is equal to zero. We expect Earnings Surprise to be
positively associated with the dependent variable.
We estimate equation (4) as a cross-sectional OLS regression. The t-statistics are based on
robust standard errors adjusted for heteroskedasticity.
5.3. Reclassification Disclosures and Bid-Ask Spreads

30
Finally, we examine whether and under which conditions reclassifying banks experience an
increase in information asymmetry after their reclassification announcements, we follow related
literature (e.g., Leuz and Verrecchia, 2000; Muller and Riedl, 2002) and use the bid-ask spread as
a proxy for information asymmetry among equity investors. The basic regression specification is
as follows:
Log(Bid-Ask Spread) =
β0 + β1 Post-Reclassification + β2 Post-Reclassification * Complete Disclosure +
Σ βj Controlsj + ε (5)
We measure all variables at the bank-week level. The estimation period is from July 1, 2008
to June 30, 2009 (i.e., we include each bank with a maximum of 52 weekly observations).
The dependent variable is the median of the daily closing bid-ask spread (i.e., the difference
between the closing bid and closing ask price divided by the midpoint) over the respective bank-
week. We use the natural logarithm of the bid-ask spread to adjust for the skewness of the raw
values.
The independent variables are as follows: Post-Reclassification is an indicator variable equal
to one for all reclassification weeks starting with the first week during which the respective bank
announced a reclassification, and zero otherwise. For non-reclassifying banks, the indicator
variable equals zero throughout the sample period. Complete Disclosure is a time-invariant
indicator variable for each individual bank, recognizing the fact that not all international banks
where fully compliant with corresponding IFRS 7 disclosure requirements following
reclassifications. For reclassifying banks, the variable is equal to one if the bank discloses all six
items required by IFRS 7, para. 12A, in the footnotes to its financial statements for financial year

31
2008, and zero otherwise. For non-reclassifying banks, Complete Disclosure equals zero
throughout the sample period.
Consistent with the observation that the reclassification option was highly controversial with
capital market participants (see introduction), we predict that (i) reclassifying banks experience
an increase in bid-ask spreads (i.e., β1 > 0) and that (ii) this increase is attenuated for banks that
provide complete disclosures about their reclassification choice (i.e., β2 < 0).
As control variables, we include Share Turnover (defined as the average daily share turnover
over the respective bank-week), Market Value (defined as the median of the daily closing market
value over the respective bank-week), and Return Variability (defined as the standard deviation
of daily stock returns over the respective bank-week). For all control variables, we use the
natural logarithm to adjust for the skewness of the raw values. We expect Share Turnover and
Market Value to be negatively associated, and Return Variability to be positively associated with
the dependent variable.
We estimate equation (5) as a panel regression with bank and week fixed effects. We
calculate robust standard errors adjusted for heteroskedasticity and two-way clustering by bank
and week (e.g., Gow et al., 2010).
In an additional test, we assess whether the association between bid-ask spreads and
reclassification choices varies with the materiality of the reclassifications. We enhance the basic
regression specification as follows:
Log(Bid-Ask Spread) =
β0 + β1 Post-Reclassification+ β2 Post-Reclassification * Complete Disclosure +
β3 Post-Reclassification * Regulatory Capital Effect (Median Split) +
32
β4 Post-Reclassification * Complete Disclosure * Regulatory Capital Effect (Median Split) +
Σ βj Controlsj + ε (6)
Regulatory Capital Effect (Median Split) is our proxy for the materiality of the
reclassification and defined as a time-invariant indicator variable. For reclassifying banks, the
variable equals one if the difference between tier 1 capital as reported and tier 1 capital excluding
reclassification effects is above the median across reclassifying banks in our sample at the end of
financial year 2008, and zero otherwise. For non-reclassifying banks, Regulatory Capital Effect
(Median Split) equals zero throughout the sample period. All other variables are the same as in
equation (5).
We predict that (i) reclassifying banks experience a particularly large increase in bid-ask
spreads when reclassifications are material (i.e., β3 > 0) and that (ii) the association between
material reclassifications and bid-ask spreads is less pronounced for banks that provide complete
disclosures (i.e., β4 < 0).
6. Results
In Table 2, we describe the definition and data sources for each variable that we use in the
following empirical analyses. Table 3 reports descriptive statistics.
6.1. Determinants of Reclassification Choice
Table 3 presents results from the joint estimation of the cross-sectional probit models in
equations (1) and (2). The table reports marginal effects at the mean (median) of all continuous
(binary) independent variables. In the estimation of equation (1), the coefficient estimate on the
key independent variable, Regulatory Capital Restriction, has the expected positive sign and is
statistically significant in all three specifications. When we include aggregate proxies for other
33
capital measures, the marginal effect is 0.006 indicating that, all else equal, a decrease of the tier
1 capital ratio by 1 percentage point is associated with an increase in the reclassification
probability of 0.6 percentage points. Thus, all else equal, a decrease in the tier 1 capital ratio by
7.186 percentage points (i.e., one standard deviation of Regulatory Capital Restriction, see Table
3) is associated with an increase in the reclassification probability of 4.3 percentage points. The
marginal effects are even higher in the other specifications. These statistics highlight that the
association between the regulatory capital restriction and the reclassification choice is
economically substantial.
The second and third specification show that the use of the reclassification option is
negatively associated with the recognition of higher deferred tax assets, non-recurring revenues
and lower loan loss provisions. At the time, reclassifying banks are more likely to sell “cherry
picked” asset, cut dividends and resort to capital injections. Hence, while fair value
reclassification seem to complement real capital measures, they appear to substitute other
accounting-based capital measures.
The coefficient estimate on Local GAAP Regulation has the predicted negative sign and is
statistically significant in two of the three specifications. The coefficient estimates on the control
variables have the predicted signs and are statistically significant in all specifications.
In the estimation of equation (2), the coefficient estimate on AFS Prudential Filter is
negative as expected and statistically significant around the 10% level in all specifications. The
marginal effect is about -0.130 indicating that, all else equal, the probability of reclassifying
available-for-sale assets of banks from countries where accumulated unrealized fair value
changes of available-for-sale assets are fully excluded from regulatory capital is 13.0 percentage
34
points higher relative to banks from countries without prudential filters. This result corroborates
our evidence on the link between regulatory capital requirements and the reclassification choice.
Taken together, the results in Tables 3 are consistent with our expectations. In particular, we
find evidence that banks’ reclassification choice is associated with potential regulatory benefits.
Our findings also suggest that fair value reclassifications are used either as complements or as
substitutes to other capital measures.
6.2. Stock Market Reactions to Reclassification Announcements
Regulatory Announcement
Table 5 presents results from the estimation of equation (3) related to the cross-sectional
determinants of abnormal stock returns around the regulatory announcement on October 13 and
14, 2008. In both specifications, the coefficient estimate on Expected Reclassification is negative
and statistically significant at the 10% level. The perfect foresight model, for example, suggests
that banks that will eventually use the reclassification option experience an abnormal stock return
around the regulatory announcement that is 1.1% lower (β1 = -0.011, t-statistic = -1.71) compared
to non-reclassifying banks. The coefficient estimate on the interaction term Expected
Reclassification * Regulatory Capital Restriction (Median Split) is positive but not statistically
significant at conventional levels in both specifications (e.g., β3 = 0.010, t-statistic = 1.13 in the
perfect foresight model). Hence, the negative market reaction to the regulatory announcement is
slightly less pronounced for banks with relatively strong regulatory incentives (see also the
additional test at the bottom of the table). While this evidence is in line with our predictions, we
acknowledge that our tests are confounded by other economic events that coincided with the
regulatory announcement of the reclassification amendment (see Acharya and Ryan [2016] for a
detailed discussion). For example, on October 13, the Financial Times reported that European
35
governments (among them France, Germany, and the UK) pledged a total of US$ 2,546bn in
guarantees for new bank debt as part of coordinated plans to rescue their financial sectors.
Bank Announcements
Table 6 presents results from the estimation of equation (4) related to the cross-sectional
determinants of abnormal stock returns around bank-specific announcements of the actual
reclassification choice. Since these announcements are spread over the period October 2008 to
June 2009, this analysis is less susceptible to confounding events. We use a slightly smaller
sample of 117 reclassifying and 161 non-reclassifying banks in the first two specifications,
because we cannot identify the relevant announcements for all sample banks. In the third and
fourth specifications, we further reduce the sample by examining announcements made before
February 13, 2009. This is the median announcement date for reclassifying banks yielding a
subsample of 58 reclassifying banks and 121 non-reclassifying banks. In the last two
specifications, we focus on announcements made in October 2008 (13 reclassifying and 79 non-
reclassifying banks).
The coefficient estimate on Reclassification (Regulatory Capital Effect) has the expected
negative (positive) sign and is statistically significant in the last four specifications, that is, when
focusing on the early bank announcements. However, it is important to note that these results are
driven by a small subset of 3 to 5 sample banks.
The coefficient estimate on the control variable Earnings Surprise is positive in all
specifications and close to statistical significance in most specifications. This evidence indicates
that banks that beat the mean analyst forecast tend to experience higher abnormal returns than
banks that do not meet the forecast.
36
Taken together, our analysis of whether reclassification announcements are associated with
positive abnormal stock returns yields mild evidence of regulatory benefits outweighing the
economic costs of the reclassification choice.
6.3. Reclassification Disclosures and Bid-Ask Spreads
Table 7 presents results from the estimations of equations (5) and (6). The sample comprises
14,502 bank-weeks.
In the estimation of equation (5), the coefficient estimate on Post-Reclassification is positive
(β1 = -0.220) and statistically significant (t-statistic = 2.83). In contrast, the coefficient estimate
on Post-Reclassification * Complete Disclosure in the second specification has a negative sign
(β2 = -0.242, t-statistic = -2.83). The additional test at the bottom of the table reveals that the sum
of the two coefficient estimates is statistically insignificant (β1 + β2 = -0.022, t-statistic = -0.44).
These results are in line with our prediction that reclassifying banks experience an increase in
bid-ask spreads relative to non-reclassifying banks and that this increase is attenuated for banks
that provide complete disclosures about their reclassification choice. The estimation of equation
(6) illustrates that these associations are more pronounced if the reclassification has a material
impact on financial statements. The coefficient estimates on the control variables Log(Share
Turnover), Log(Market Value) and Log(Return Variability) have the expected signs and are
statistically significant in all specifications.
Taken together, these findings are consistent with the notion that fair value reclassifications
mitigate financial statement transparency as perceived by capital market participants.
7. Conclusions
37
APPENDIX I
Capital Regulation by Country
CapitalPost-Tax
FilterCapital
Post-Tax Filter
Australia Australian Prudential Regulation Authority 4.00 % 8.00 % Net amount DTA & DTL Portfolio Tier 2 55.00 % Tier 1 0.00 % Prudential Standard APS 111
Austria Financial Market Authority 4.00 % 8.00 % 0.00 % Portfolio Tier 2 47.50 % Tier 1 0.00 % Austrian Banking Act
Bahrain Central Bank 6.00 % 12.00 % 0.00 % Portfolio 100.00 % 100.00 % Rulebook Vol. 1 Part A CA-2
Belgium Banking, Finance and Insurance Commission 4.00 % 8.00 % Amount > 10% of Tier 1 Portfolio 100.00 % 100.00 % CBFA Circular PPB-2007-1-CPB
PR China China Banking Regulatory Commission 4.00 % 8.00 % 0.00 % Portfolio 100.00 % 100.00 % Capital Adequacy Regulation
Cyprus Central Bank 4.00 % 8.00 % 0.00 % Portfolio Tier 2 0.00 % Tier 1 0.00 % Directive 436/2006 & 328/2007
Denmark Finanstilsynet (Danish FSA) 4.00 % 8.00 % 0.00 % Portfolio 100.00 % 100.00 % Financial Business Act
Finland Financial Supervisory Authority 4.00 % 8.00 % 0.00 % Portfolio Tier 2 26.00 % Tier 1 0.00 % FIN-FSA Standard 4
France Central Bank 4.00 % 8.00 % 0.00 % Portfolio 100.00 % 100.00 % Regulation 90/02
Germany Federal Financial Supervisory Authority 4.00 % 8.00 % 0.00 % Portfolio Tier 2 55.00 % Tier 1 0.00 % Regulation KonÜV
Hong Kong Hong Kong Monetary Authority 4.00 % 8.00 % 0.00 % Portfolio Tier 2 55.00 % Tier 1 0.00 % Banking (Capital) Rules
Hungary Hungarian Financial Supervisory Authority 4.00 % 8.00 % 0.00 % Portfolio Tier 2 0.00 % Tier 1 0.00 % HFSA Regulation
Ireland Irish Financial Regulator 4.00 % 8.00 % 0.00 % Portfolio Tier 2 15.50 % Tier 1 0.00 % Notice BSD S 2/00
Italy Central Bank 4.00 % 8.00 % 0.00 % Portfolio Tier 2 63.75 % Tier 1 0.00 % Circular 263
Jordan Central Bank 6.00 % 12.00 % 100.00 % Portfolio Tier 2 55.00 % Tier 2 55.00 % CBJ Instructions
Kazakhstan Financial Supervision Agency 6.00 % 8.00 % 0.00% Portfolio Tier 2 20.00% Tier 1 0.00% Kazakhstan Banking Law
Kuwait Central Bank 6.00 % 12.00 % 0.00 % Portfolio Tier 2 55.00 % Tier 2 55.00 % Circular 2/BS/94/2002
Liechtenstein Financial Market Authority 4.00 % 8.00 % 0.00 % Portfolio 100.00 % 100.00 % Regulation ERV
Lithuania Central Bank 4.00 % 8.00 % 0.00 % Portfolio Tier 2 32.00 % Tier 1 0.00 % Resolution No. 138
Netherlands Central Bank 4.00 % 8.00 % 0.00 % Instrument 100.00 % 100.00 % Decree on Prudential Rules
Norway Finanstilsynet (FSA of Norway) 4.00 % 8.00 % 100.00 % Portfolio 100.00 % 100.00 % Capital Adequacy Framework
Oman Central Bank 6.00 % 10.00 % 0.00 % Portfolio 100.00 % Tier 1 100.00 % Capital Guidelines II.A
Philippines Central Bank 6.00 % 10.00 % 100.00 % Portfolio 100.00 % 100.00 % Circular 538/06
Poland Polish Financial Supervision Authority 4.00 % 8.00 % 0.00 % Portfolio 100.00 % 100.00 % KNF Resolutions
Portugal Central Bank 4.00 % 8.00 % Amount > 10% of Tier 1 Instrument Tier 2 55.00 % Tier 1 0.00 % Notice 12/92
Qatar Central Bank 6.00 % 10.00 % 100.00 % Portfolio Tier 2 55.00 % Tier 2 0.00 % QCB Instructions Part 7
Russian Federation Central Bank 5.00 % 10.00 % 0.00 % Portfolio 100.00 % 100.00 % Instruction on Bank Regulation
Saudi Arabia Saudi Arabia Monetary Agency 4.00 % 8.00 % 0.00 % Portfolio Tier 2 55.00 % Tier 1 0.00 % SAMA Capital Requirements
Singapore Monetary Authority of Singapore 6.00 % 10.00 % 100.00 % Portfolio 100.00 % 100.00 % Notice 637
Slovakia Central Bank 4.00 % 8.00 % 0.00 % Instrument 100.00 % 100.00 % Decree 4/2007
Slovenia Central Bank 4.00 % 8.00 % 0.00 % Instrument 100.00 % 100.00 % Regulation OJ 135/06 & 104/07
South Africa Central Bank 7.00 % 9.50 % 100.00 % Portfolio 100.00 % 100.00 % Notice R3/2008
Spain Central Bank 4.00 % 8.00 % 0.00 % Portfolio Tier 2 65.00 % Tier 1 0.00 % Circular 4/2004
(continued)
Legal SourceBasis of Calculation
Gains LossesCountry Regulatory Authority
MinimumTier 1CapitalRatio
MinimumTotal
CapitalRatio
Prudential Filter forDeferred Tax Assets (DTA)
Prudential Filter for AFS Debt Securities (as of 2008)
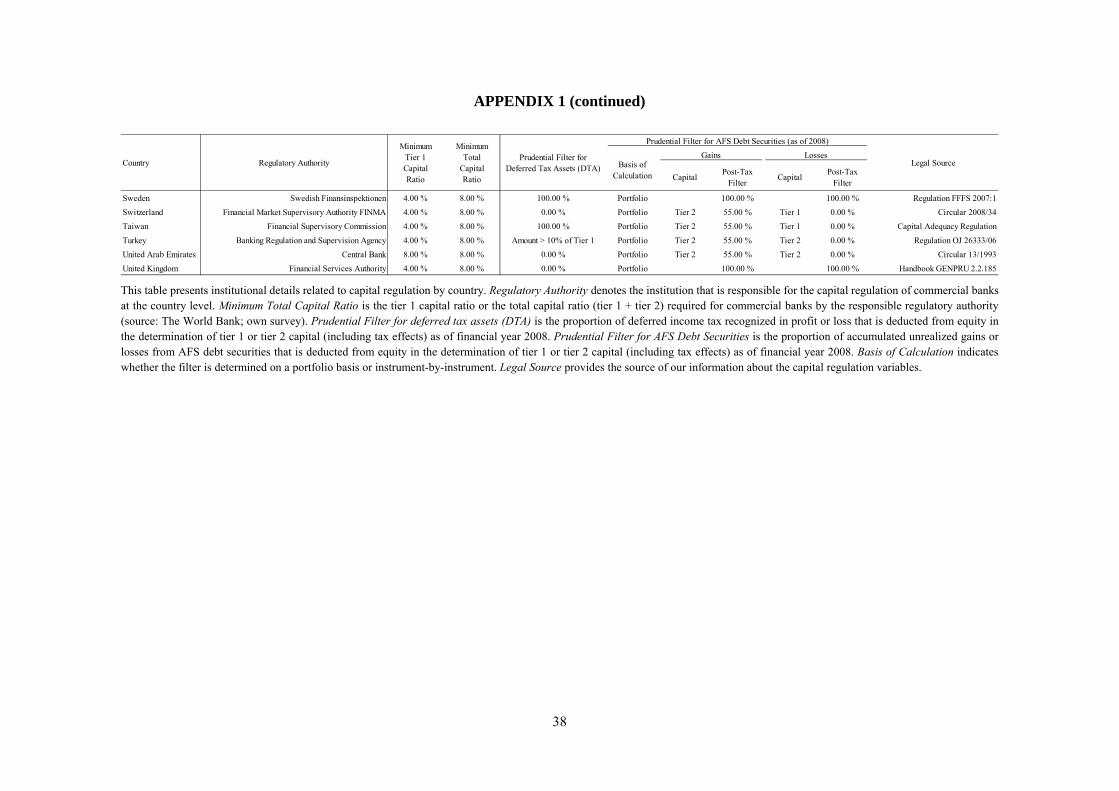
38
APPENDIX 1 (continued)
This table presents institutional details related to capital regulation by country. Regulatory Authority denotes the institution that is responsible for the capital regulation of commercial banks at the country level. Minimum Total Capital Ratio is the tier 1 capital ratio or the total capital ratio (tier 1 + tier 2) required for commercial banks by the responsible regulatory authority (source: The World Bank; own survey). Prudential Filter for deferred tax assets (DTA) is the proportion of deferred income tax recognized in profit or loss that is deducted from equity in the determination of tier 1 or tier 2 capital (including tax effects) as of financial year 2008. Prudential Filter for AFS Debt Securities is the proportion of accumulated unrealized gains or losses from AFS debt securities that is deducted from equity in the determination of tier 1 or tier 2 capital (including tax effects) as of financial year 2008. Basis of Calculation indicates whether the filter is determined on a portfolio basis or instrument-by-instrument. Legal Source provides the source of our information about the capital regulation variables.
CapitalPost-Tax
FilterCapital
Post-Tax Filter
Sweden Swedish Finansinspektionen 4.00 % 8.00 % 100.00 % Portfolio 100.00 % 100.00 % Regulation FFFS 2007:1
Switzerland Financial Market Supervisory Authority FINMA 4.00 % 8.00 % 0.00 % Portfolio Tier 2 55.00 % Tier 1 0.00 % Circular 2008/34
Taiwan Financial Supervisory Commission 4.00 % 8.00 % 100.00 % Portfolio Tier 2 55.00 % Tier 1 0.00 % Capital Adequacy Regulation
Turkey Banking Regulation and Supervision Agency 4.00 % 8.00 % Amount > 10% of Tier 1 Portfolio Tier 2 55.00 % Tier 2 0.00 % Regulation OJ 26333/06
United Arab Emirates Central Bank 8.00 % 8.00 % 0.00 % Portfolio Tier 2 55.00 % Tier 2 0.00 % Circular 13/1993
United Kingdom Financial Services Authority 4.00 % 8.00 % 0.00 % Portfolio 100.00 % 100.00 % Handbook GENPRU 2.2.185
Legal SourceBasis of Calculation
Gains LossesCountry Regulatory Authority
MinimumTier 1CapitalRatio
MinimumTotal
CapitalRatio
Prudential Filter forDeferred Tax Assets (DTA)
Prudential Filter for AFS Debt Securities (as of 2008)

39
APPENDIX II
Identifying Capital Protection Methods under the Basel II Framework
Capital ComponentBasel II (2006 Comprehensive Version)
Capital Protection Method(Prior Literature)
External Data Source (if not included in Appendix I) Methodology Country-specific Basel II-Implemenation
Tier 1Core Capital /Equity Capital
para. 49 (i)-(iii)
Inject Capital
(Panetta et al. 2009, Petrovic and Tutsch 2009, Stolz and Wedow 2010)
SNL Financial:Share Capital (SNLxl KeyField 243626)Share Premium (SNLxl KeyField 224983)Equity Hybrid Securities (SNLxl KeyField 224974)
The Tier 1 Capital saving is calculated as the sum of the year-on-year changes of the balance sheet items share capital, share premium, equity hybrid securities (assuming that all equity hybrid securites are elegible for Tier 1 Capital):
Tier 1 Cap. Saving CI = Δ2007-2008 Share Capital + Δ2007-2008 Share Premium + Δ2007-2008 Equity Hybrid Securities
-
Tier 1 Disclosed Reserves para. 49 (i)-(iii)
Cut Dividends
(Collins et al. 1995, Abreu and Gluamhussen 2013)
SNL Financial:Dividends attributable per Common Share (SNLxl KeyField 233325)Common Shares Outstanding (SNLxl KeyField 132884)
1. Identification of dividend cuts by benchmarking the 2008 dividend against the average dividend of the reference period 2005-2007
2. The Tier 1 Capital saving is calculated as the difference between the 2008 dividend and the benchmark multiplied by the number of common shares outstanding:
Tier 1 Cap. Saving Div. Cuts = (Avg. Dividend 2005-2007 - Dividend 2008) × Common Shares Outstanding 2008
-
Tier 1Net Income of the Current Financial Year
para. 49 (i)-(iii)
Recognize lower LLP
(Moyer 1990, Beatty et al. 1995, Kim and Kross 1998, Ahmed et al. 1999, Huizinga and Laeven 2010)
Bankscope:Total Assets (data11350)Loan Loss Provisions (data2095)Loan Loss Reserves (data2045)Net Charge-Offs (data30090)Non Performing Loans (data4004)
SNL Financial:Tax rate (SNLxl KeyFields 131961 and 132721)
Worldscope:Loan Loss Reserves (data02275)
1. Estimation of the abnormal LLP using the following regression:
LLP/TA = β0 + β1 × LLRt-1/TA + β2 NCO/TA + β3 × Δ NPLt;t-1 + β4 × Ln (TA) + ε
2. Tier 1 Effect: Current period's net income, and ultimately Tier 1 capital via retained earnings, increases due to the lower LLP recognized in the income statement
Tier 1 Cap. SavingLLP = ResidualRegression × TA × (1 - Tax Rate)
-
Tier 1Recognize higher DTA
(Skinner 2008)
Worldscope:Deferred Domestic Income Tax (WS 18188)Deferred Foreign Income Tax (WS 18189)Tax rate (SNLxl KeyFields 131961 and 132721)
Tier 1 Capital saving equals the total amount of deferred income tax recognized in profit or loss during 2008, multiplied by the applicable (country-specific) prudential filter:
Tier 1 Cap. Saving DTA = (DTA Domestic 2008 + DTA Foreign 2008) × (1 - Tax Rate) × Prudential Filter
All countries apply a prudential filter of zero, except for:- Jordan, Norway, Philippines, Qatar, Singapore, South Africa, Sweden, Taiwan 100%- Belgium, Portugal, Turkey: DTA > 10% of Tier 1 capital- Australia: Net amount of DTA and DTL
Tier 1
Sell Assets with Unrealized Gains"Cherry Picking"
(Moyer 1990, Collins et al. 1995, Barth et al. 2014)
SNL Financial:Realized Gains on Securities (SNLxl KeyField 132569)Available for Sale Securities (SNLxl KeyField 225015)Debt Instruments Available for Sale (SNLxl KeyField 225012)Equity Instruments Available for Sale (SNLxl KeyField 225013)Other Instruments Available for Sale (SNLxl KeyField 225014)
1. Realized gains on securities (RGS) include gains, net of losses, on the sale of AFS and HTM securities and are scaled by AFS Securitiesa) Given the tainting rule of IAS 39.52 for HTM securities and the illiquidity of L&R, we assume that those gains relate to the sale of AFS instruments only for which no such restrictions exist
b) RGS are scaled by AFS securities to control for increases in the total amount of securities, independent of any change in the selling behavior of the bank
2. The 2008 ratio is benchmarked against the average ratio for the reference period 2005-2007
3. The Tier 1 Capital saving is calculated as the difference between RGS 2008 and avg. RGS 2005-2007, multiplied by
total AFS securities and the tax rate
Tier 1 Capital Saving RGS = (RGS 2008 - RGS 2005-2007)) × (AFS Securities 2008) × (1 - Tax Rate)
-
Tier 1Report Non-Recurring Revenues
SNL Financial:Non-Recurring Revenues (SNLxl KeyField 132604)Tax rate (SNLxl KeyFields 131961 and 132721)
The Tier 1 Capital saving equals the total (post-tax) amount of non-recurring revenues recognized in 2008:
Tier 1 Cap. Saving NRR = Non-Recurring Revenue 2008 × (1 - Tax Rate)-
Reclassify Financial Assets
SNL Financial:Net Unrealized Gains (SNLxl KeyField 132393)Tax rate (SNLxl KeyFields 131961 and 132721)
Annual Reports:Information on reclassifications disclosed under IFRS 7.12A was handcollectded from the annual reports
1. HFT to HTM or L&R:The Tier 1 capital saving equals the (post-tax) fair value loss that would have been recognized in the income statement had the reclassification not been made:
Tier 1 Cap. Saving NI2Cost = FV Loss not recognized in NI 2008 × (1 - Tax Rate)
2. HFT to AFS:The capital saving is the difference of the (post-tax) fair value loss that would have been recognized in the income statement had the reclassification not been made (Tier 1 effect) and the amount that is recognized in OCI as revaluation reserves instead, adjusted by the applicable prudential filter (Tier 2 effect):
Tier 1 Cap. Saving NI2OCI = FV Loss not recognized in NI 2008 × (1 - Tax Rate)
Total Cap. Saving NI2OCI = FV Loss not recognized in NI 2008 × (1 - Tax Rate) - FV Loss recognized in OCI 2008 × (1 -
Prudential Filter)
3. AFS to HTM or L&R:The capital saving is calculated as the fair value loss that would have been recognized in OCI as revaluation reserves had the reclassification not been made, multiplied by the applicable prudential filter:
Total Cap. Saving OCI2Cost = FV Loss not recognized in OCI 2008 × (1 - Prudential Filter)
The prudential filter varies across countries:- 18 countries apply a filter of 100 %, i.e. fully exclude unrealized gains and losses from regulatory capital (Bahrain, Belgium, China, Denmark, France, Liechtenstein, Netherlands, Norway, Oman, Philippines, Poland, Russian Federation, Singapore, Slovakia, Slovenia, South Africa, Sweden, UK)
- 1 country applies a filter of 0 %, i.e. fully includes unrealized gains and losses in regulatory capital (Cyprus)
- 12 countries apply a filter of 55 % for unrealized gains and 0 % for unrealized losses (Australia, Germany, Hong Kong, Jordan, Kuwait, Portugal, Qatar, Saudi Arabia, Switzerland, Taiwan, Turkey, United Arab Emirates)
- 6 countries apply unique filters for unrealized gains: Austria (47,5 %), Finland (26 %) Ireland (12,5%), Italy (63,75%), Lithuania (32 %), Spain (65 %) while fully excluding unrealized losses from regulatory capital
(continued)

40
APPENDIX II (continued)
Capital ComponentBasel II (2006 Comprehensive Version)
Capital Protection Method(Prior Literature)
External Data Source (if not included in Appendix I) Methodology Country-specific Basel II-Implemenation
Deductions Own Sharespara. 49 (i), footnote 13 ("issued stock")
Sell Treasury Shares
(Hirtle 2014)
SNL Financial:Treasury Stock (SNLxl KeyField 243630)
The Tier 1 Capital saving is derived from the year-on-year change of the balance sheet item treasury shares:
Tier 1 Cap. Saving TS = Δ2007-2008 Treasury Sharesn/a
Deductions Goodwill para. 49 (xv) (i)Worldscope:Goodwill (data11300)
n/a n/a
DeductionsEquity resulting from Securitization Exposure
para. 49 (xv) (ii) n/a n/a n/a
Deductions
Unconsolidated Investments in Subsidiaries(50% Tier 1 / Tier 2)
para. 49 (xv) (iii) n/a n/a n/a
Tier 2Undisclosed Reserves para. 49 (iv) n/a n/a n/a
Tier 2
max. 100% of Tier I
Revaluation reserves para. 49 (v)-(vi)
Sell Assets with Unrealized Gains"Cherry Picking"
(Moyer 1990, Collins et al. 1995, Barth et al. 2014)
SNL Financial:Realized Gains on Securities (SNLxl KeyField 132569)Available for Sale Securities (SNLxl KeyField 225015)Debt Instruments Available for Sale (SNLxl KeyField 225012)Equity Instruments Available for Sale (SNLxl KeyField 225013)Other Instruments Available for Sale (SNLxl KeyField 225014)Net Unrealized Gains (SNLxl KeyField 132393)
3. The Total Capital RGS saving is:a) Tier 1 effect: RGS increase Tier 1 capital via net income, see calculation of Tier 1 Capital Saving RGS above
b) Tier 2 effect: Corresponding effect of the OCI revaluation reserves on regulatory capital depends on the applicable prudential filter. Assumptions: (i) RGS are entirely attributable to the sale of AFS debt securities, thus the prudential filter for debt securities is used (ii) when the filter is determined on an item-by-item basis, the filter for accumulated gains is applied, otherwise the sign of the revaluation reserves determines the prudential filter (iii) RGS are identical to the amount recycled from the OCI revaluation reserves when the asset is sold
Total Cap Saving RGS = Tier 1 Capital Saving RGS - corresponding effect on unrealized gains in OCI (depending on
prudential filter)
Total Cap Saving RGS = Tier 1 Capital Saving RGS - (RGS 2008 - RGS 2005-2007) × AFS Securities 2008 × (1 - Prudential
Filter)
The prudential filter varies across countries:- 18 countries apply a filter of 100 %, i.e. fully exclude unrealized gains and losses from regulatory capital (Bahrain, Belgium, China, Denmark, France, Liechtenstein, Netherlands, Norway, Oman, Philippines, Poland, Russian Federation, Singapore, Slovakia, Slovenia, South Africa, Sweden, UK)
- 1 country applies a filter of 0 %, i.e. fully includes unrealized gains and losses in regulatory capital (Cyprus)
- 12 countries apply a filter of 55 % for unrealized gains and 0 % for unrealized losses (Australia, Germany, Hong Kong, Jordan, Kuwait, Portugal, Qatar, Saudi Arabia, Switzerland, Taiwan, Turkey, United Arab Emirates)
- 6 countries apply unique filters for unrealized gains: Austria (47,5 %), Finland (26 %) Ireland (12,5%), Italy (63,75%), Lithuania (32 %), Spain (65 %) while fully excluding unrealized losses from regulatory capital
Tier 2
max. 100% of Tier I
General Provisions / General Loan-Loss Reserves
para. 49 (vii)-(x)
Recognize lower LLP
(Moyer 1990, Beatty et al. 1995, Ahmed et al. 1999, Kim and Kross 1998, Huizinga and Laeven 2010, Ng and Roychowdhury 2014)
Bankscope:Total Assets (data11350)Loan Loss Provisions (data2095)Loan Loss Reserves (data2045)Net Charge-Offs (data30090)Non Performing Loans (data4004)
SNL Financial:Tax rate (SNLxl KeyFields 131961 and 132721)Total Risk-Weighted Assets (SNLxl KeyField 133174)
Worldscope:Loan Loss Reserves (data02275)
3. Total Capital LLP saving is:
a) Tier 1 effect: Capital saving from under-reserving, i.e. the recognition of lower LLP, see calculation Tier 1 Capital Saving LLP above
b) Tier 2 effect: The total amount of LLR that can be added-back to regulatory capital as Tier 2 capital. However, LLR can only be included in Tier 2 capital up to the regulatory threshold of 1.25 % of RWA (standardized approach) or 0.6 percentage point of the difference between total eligible provisions and the total expected loss amount (IRB-approach). We assume that every bank uses the SA only. If LLR exceed the threshold, the latter are substracted from Tier 2 capital.
Total Cap. Saving LLP = Tier 1 Cap. Savings - ResidualRegression × TA [up to the regulatory threshold]
Regulatory threshold for Tier 2 effect = 1.25% * RWA
-
Tier 2
max. 100% of Tier I
Hybrid Debt Capital Instruments / Subordinated Term Debt
para. 49 (xi)-(xii)Inject Capital
(Panetta et al. 2009)
SNL Financial:Total Subordinated Debt (SNLxl KeyField 134231)
The Total Capital saving is calculated as the sum of the year-on-year changes of the balance sheet items share capital, share premium, equity hybrid securities and total subordinated debt (assuming that all subordinated debt is elegible for Total Capital):
Total Cap. Saving CI = Tier 1 Cap. Saving CI + Δ2007-2008 Total Subordinated Debt
n/a
Tier 3Short-term Subordinated Debt covering Market Risk
para. 49 (xiii)-(xiv)Inject Capital
(Panetta et al. 2009)n/a (subsumed in Total Subordinated Debt (SNLxl KeyField 134231))
see Tier 2, Hybrid Debt Capital Instruments(assuming that all subordinated debt in SNLxl KeyField 134231 are Tier 2 elegible)
n/a
Regulatory Measure of Risk
Credit Risk, Market Risk, Operational Risk
para. 50 - 718(xcix)
Restructure RWA-Portfolio
(Panetta et al. 2009, Kok and Schepens 2013, De Jonghe and Öztekin 2015)
SNL Financial:Total Risk-Weighted Assets (SNLxl KeyField 133174)Total Assets (SNLxl KeyField 131929)
1. Calculation of the average risk-weight of a bank’s portfolio by dividing RWA by total assets (TA)
2. The average risk-weight of 2008 is benchmarked against the average risk-weight for the pre-crisis period 2005 to 2007. When the average risk-weight in 2008 is lower than the benchmark, the bank has decreased the overall riskiness of its portfolio. The resulting capital savings are calculated as follows:
Tier 1 Cap. Saving RWA = Avg. RW 2008 × TA 2008 * Min. Tier 1 Cap. Ratio – Avg. RW 2005-2007 × TA 2008 × Min. Tier
1 Cap. Ratio
Total Cap. Saving RWA = Avg. RW 2008 × TA 2008 * Min. Total Cap. Ratio – Avg. RW 2005-2007 × TA 2008 × Min. Total
Cap. Ratio
The minimum Tier 1 Capital ratio is 4 %, except for:- Russian Federation: 5 %- Bahrain, Jordan, Kazakhstan, Kuwait, Oman, Phillipines, Qatar, Singapore: 6 %- South Africa 7 %- United Arab Emirates 8 %
The minimum Total Capital ratio is 8 %, except for:- South Africa 9.5 %- Oman, Phillipines, Qatar, Russian Federation, Singapore 10 %- Bahrain, Jordan, Kuwait 12 %
41
References
Abreu, J. F., Gulamhussen, M. A., 2013. Dividend payouts: Evidence from U.S. bank holding companies in the context of the financial crisis. Journal of Corporate Finance 22, 54–65
Acharya, V. V., Ryan, S. G., 2016. Banks’ Financial Reporting and Financial System Stability Journal of Accounting Research 54, 277–340.
Ahmed, A. S., Takeda, C., Thomas, S., 1999. Bank loan loss provisions: a reexamination of capital management, earnings management and signaling effects. Journal of Accounting and Economics 28, 1–25.
Altamuro, J., Beatty, A., 2010. How does internal control regulation affect financial reporting? Journal of Accounting and Economics 49, 58–74.
André, P., Cazavan-Jeny, A., Dick, W., Richard, C., Walton, P., 2009. Fair value accounting and the banking crisis in 2008: Shooting the messenger. Accounting in Europe 6, 3–24.
Armstrong, C. S., Barth, M. E., Jagolinzer, A. D., Riedl, E. J., 2010. Market Reaction to the Adoption of IFRS in Europe. The Accounting Review 85, 31–61.
Badertscher, B. A., Burks, J. J., Easton, P. D., 2012. A Convenient Scapegoat: Fair Value Accounting by Commercial Banks during the Financial Crisis. The Accounting Review 87, 59–90.
Bank for International Settlements, 2009. An Assessment of Financial Sector Rescue Programmes. Availabe at http://www.bis.org/publ/bppdf/bispap48.pdf.
Barth, M. E., Gomez-Biscarri, J., Kasznik, R., López-Espinosa, G., 2014. Bank Earnings and Regulatory Capital Management using Available for Sale Securities. Working Paper, Stanford University.
Beatty, A. L., Chamberlain, S. L., Magliolo, J., 1995. Managing financial reports of commercial banks: The influence of taxes, regulatory capital and earnings. Journal of Accounting Research 33, 231–261.
Black, L. K., Hazelwood L. N., 2013. The effect of TARP on bank risk-taking. Journal of Financial Stability 9, 790-803.
CEBS, 2007. Analytical Report on Prudential Filters for Regulatory Capital. London.
CESR, 2009. Application of and disclosures related to the reclassification of financial instruments. http://www.esma.europa.eu/system/files/09_575_CESR_statement_disclosures_reclassification_Chairs.pdf.
Čihák, M., Demirgüç-Kunt, A., Martínez Pería, M.S., Mohseni-Cheraghlou, A., 2012. Bank Regulation and Supervision around the World. Policy Research Working Paper 6286, The World Bank.
Collins, J. H., Shackelford, D. A., Wahlen, J. M., 1995. Bank Differences in the Coordination of Regulatory Capital, Earnings, and Taxes. Journal of Accounting Research 33, 263-291.
Cornett, M. M., Li, L., Tehranian, H., 2013. The performance of banks around the receipt and repayment of TARP funds: Over-achievers versus under-achievers. Journal of Banking & Finance 37, 730–746.
42
Daske, H., Hail, L., Leuz, C., Verdi, R., 2013. Adopting a Label: Heterogeneity in the Economic Consequences around Voluntary IAS Adoptions. Journal of Accounting Research 51, 495–547.
De Jonghe, O., Öztekin, Ö., 2015. Bank capital management: International evidence. Journal of Financial Intermediation 24, 154–177.
European Central Bank, 2009. Financial Stability Review December 2009. Availabe at https://www.ecb.europa.eu/pub/pdf/other/financialstabilityreview200912en.pdf.
European Central Bank, 2010. The Great Financial Crisis. Lessons for Financial Stability and Monetary Policy. Available at http://www.ecb.europa.eu/pub/pdf/other/greatfinancialcrisisecbcolloquiumpapademos201203en.pdf.
Fiechter, P., 2011. Reclassification of Financial Assets under IAS 39: Impact on European Banks' Financial Statements. Accounting in Europe 8, 49–67.
Financial Times, October 20th 2008, Changes threaten confidence in accounts.
Gallemore, J., 2016. Bank Financial Reporting Opacity and Regulatory Intervention. Available at https://papers.ssrn.com/sol3/papers.cfm?abstract_id=2838541.
Goldberg, L. G., Hudgins, S. C., 2002. Depositor discipline and changing strategies for regulating thrift institutions. Journal of Financial Economics 63, 263–274.
Gow, I. D., Ormazabal, G., Taylor, D. J., 2010. Correcting for Cross-Sectional and Time-Series Dependence in Accounting Research. The Accounting Review 85, 483–512.
Hirtle, B. 2014. Bank Holding Company Dividends and Repurchases during the Financial Crisis. FRB of New York Staff Report No. 666. Available at https://papers.ssrn.com/sol3/papers.cfm?abstract_id=2423384.
House of Commons, 2008. Banking Crisis: Oral Evidence by Sir David Tweedie, Paul Boyle and Michael Izza taken before the Treasury Committee on Tuesday, November 11. London, HC 144–I.
Howieson, B., 2011. GFC or KFC?: How Standard Setters were Battered and Fried. Australian Accounting Review 21, 3–13.
Huizinga, H., Laeven, L. 2010. Bank Valuation and Regulatory Forbearance During a Financial Crisis. European Banking Center Discussion Paper No. 2009-17. Available at https://papers.ssrn.com/sol3/papers.cfm?abstract_id=1434359.
Kim, M.-S., Kross, W., 1998. The impact of the 1989 change in bank capital standards on loan loss provisions and loan write-offs. Journal of Accounting and Economics 25, 69–99.
Kok, C., Schepens, G. 2013. Bank Reactions after Capital Shortfalls. National Bank of Belgium Working Paper No. 250. Available at https://papers.ssrn.com/sol3/papers.cfm?abstract_id=2369800.
Laux, C., Leuz, C., 2009. The crisis of fair-value accounting: Making sense of the recent debate. Accounting, Organizations and Society 34, 826–834.
Laux, C., Leuz, C., 2010. Did Fair-Value Accounting Contribute to the Financial Crisis? Journal of Economic Perspectives 24, 93–118.
43
Leuz, C., Nanda, D., Wysocki, P., 2003. Earnings management and investor protection: An international comparison. Journal of Financial Economics 69, 505–527.
Leuz, C., Verrecchia, R. E., 2000. The Economic Consequences of Increased Disclosure. Journal of Accounting Research 38, 91–124.
Lim, C. Y., Lim, C. Y., Lobo, G. J., 2013. IAS 39 reclassification choice and analyst earnings forecast properties. Journal of Accounting and Public Policy 32, 342–356.
Maynes, E., Rumsey, J., 1993. Conducting event studies with thinly traded stocks. Journal of Banking & Finance 17, 145–157.
Moyer, S. E., 1990. Capital adequacy ratio regulations and accounting choices in commercial banks. Journal of Accounting and Economics 13, 123–154.
Muller III, K. A., Riedl, E. J., 2002. External Monitoring of Property Appraisal Estimates and Information Asymmetry. Journal of Accounting Research 40, 865–881.
Ng, J., Roychowdhury, S., 2014. Do loan loss reserves behave like capital? Evidence from recent bank failures. Review of Accounting Studies 19, 1234–1279.
Paananen, M., Renders, A., Shima, K. M., 2012. The Amendments of IAS 39: Determinants of Reclassification Behavior and Capital Market Consequences. Journal of Accounting, Auditing & Finance 27, 208–235.
Panetta, F., Angelini, P., Albertazzi, U., Columba, F., Cornacchia, W., Di Cesare, A., Pilati, A., Salleo, C., Santini, G., 2009. Financial Sector Pro-Cyclicality: Lessons from the Crisis. Available at https://papers.ssrn.com/sol3/papers.cfm?abstract_id=1479499.
Petrovic, A., Tutsch, R., 2009. National Rescue Measures in Response to the Current Financial Crisis. Available at http://zentral-bank.eu/pub/pdf/scplps/ecblwp8.pdf.
Plantin, G., Sapra, H., Shin, H. S., 2008. Marking-to-Market: Panacea or Pandora's Box? Journal of Accounting Research 46, 435–460.
Ryan, S. G., 2008. Accounting in and for the Subprime Crisis. The Accounting Review 83, 1605–1638.
Ryan, S., 2007. Financial Instruments and Institutions, second ed. John Wiley & Sons, Inc., Hoboken, NJ.
Sefcik, S. E., Thompson, R., 1986. An approach to statistical inference in cross-sectional models with security abnormal returns as dependent variable. Journal of Accounting Research 24, 316–334.
Shen, C.-H., Chih, H.-L., 2005. Investor Protection, Prospect Theory, and Earnings Management: An International Comparison of the Banking Industry. Journal of Banking & Finance 29, 2675–2697.
Skinner, D., 2008. The rise of deferred tax assets in Japan: The role of deferred tax accounting in the Japanese banking crisis. Journal of Accounting and Economics 46, 218–239.
Spiegel, M. M., Yamori, N., 2007. Market price accounting and depositor discipline: The case of Japanese regional banks. Journal of Banking & Finance 31, 769–786.

44
Spooner, A., 2007. Fair Value and Financial Instruments, in: Walton, P. (Ed.), The Routledge Companion to Fair Value and Financial Reporting. Routledge, London, 370–384.
Stolz, S. M., Wedow, M., 2010. Extraordinary Measures in Extraordinary Times: Public Measures in Support of the Financial Sector in the EU and the United States. Bundesbank Series 1 Discussion Paper No. 2010, 13. Available at https://www.econstor.eu/bitstream/10419/37071/1/631858768.pdf.
Veall, M. R., Zimmermann, K. F., 1996. Pseudo-R2 measures for some common limited dependent variable models. Journal of Economic Surveys 10, 241–259.
Wooldridge, J. M. 2010. Econometric Analysis of Cross Section and Panel Data, second ed. MIT Press, Cambridge, MA.
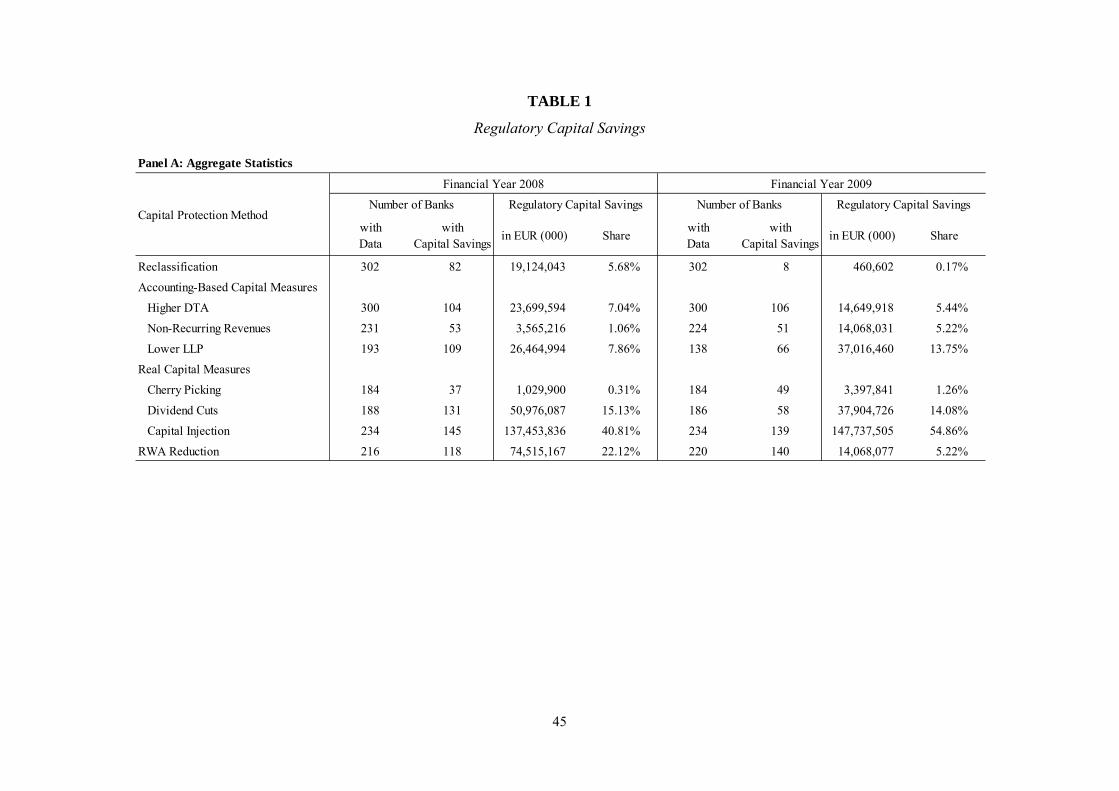
45
TABLE 1
Regulatory Capital Savings
Panel A: Aggregate Statistics
withData
withCapital Savings
in EUR (000) SharewithData
withCapital Savings
in EUR (000) Share
Reclassification 302 82 19,124,043 5.68% 302 8 460,602 0.17%
Accounting-Based Capital Measures
Higher DTA 300 104 23,699,594 7.04% 300 106 14,649,918 5.44%
Non-Recurring Revenues 231 53 3,565,216 1.06% 224 51 14,068,031 5.22%
Lower LLP 193 109 26,464,994 7.86% 138 66 37,016,460 13.75%
Real Capital Measures
Cherry Picking 184 37 1,029,900 0.31% 184 49 3,397,841 1.26%
Dividend Cuts 188 131 50,976,087 15.13% 186 58 37,904,726 14.08%
Capital Injection 234 145 137,453,836 40.81% 234 139 147,737,505 54.86%
RWA Reduction 216 118 74,515,167 22.12% 220 140 14,068,077 5.22%
Capital Protection Method
Financial Year 2008 Financial Year 2009
Number of Banks Regulatory Capital Savings Number of Banks Regulatory Capital Savings
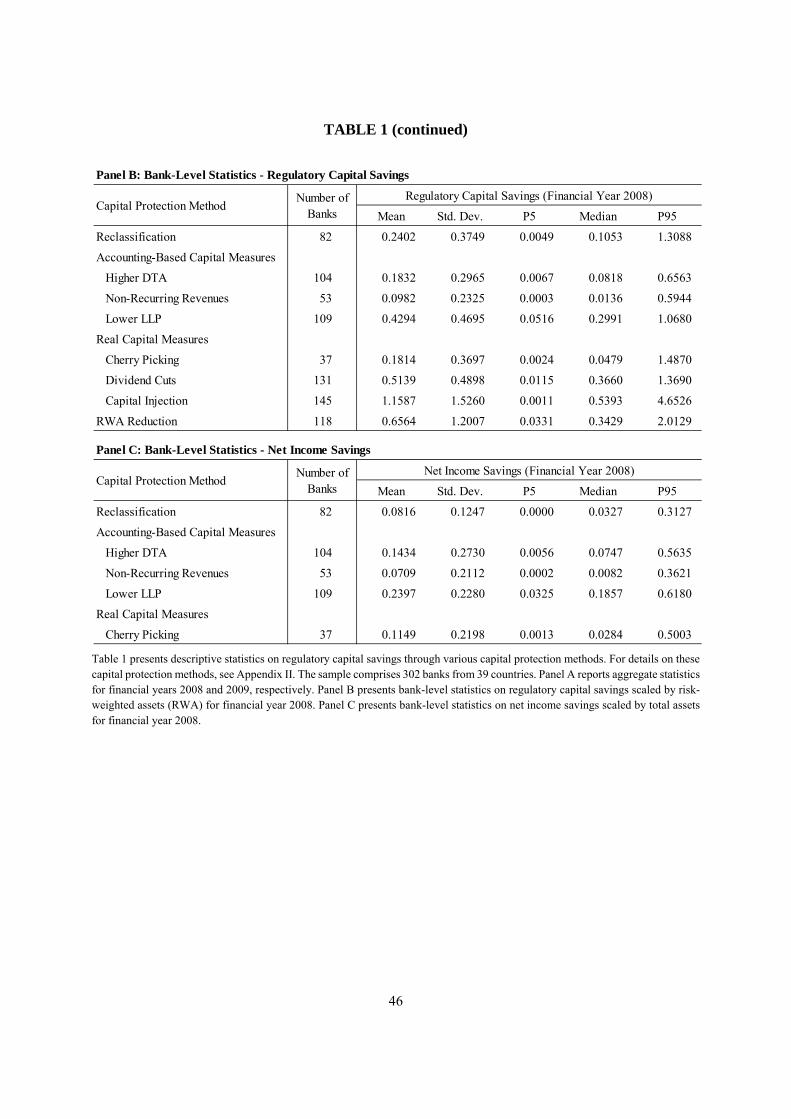
46
TABLE 1 (continued)
Table 1 presents descriptive statistics on regulatory capital savings through various capital protection methods. For details on these capital protection methods, see Appendix II. The sample comprises 302 banks from 39 countries. Panel A reports aggregate statistics for financial years 2008 and 2009, respectively. Panel B presents bank-level statistics on regulatory capital savings scaled by risk-weighted assets (RWA) for financial year 2008. Panel C presents bank-level statistics on net income savings scaled by total assets for financial year 2008.
Panel B: Bank-Level Statistics - Regulatory Capital Savings
Mean Std. Dev. P5 Median P95
Reclassification 82 0.2402 0.3749 0.0049 0.1053 1.3088
Accounting-Based Capital Measures
Higher DTA 104 0.1832 0.2965 0.0067 0.0818 0.6563
Non-Recurring Revenues 53 0.0982 0.2325 0.0003 0.0136 0.5944
Lower LLP 109 0.4294 0.4695 0.0516 0.2991 1.0680
Real Capital Measures
Cherry Picking 37 0.1814 0.3697 0.0024 0.0479 1.4870
Dividend Cuts 131 0.5139 0.4898 0.0115 0.3660 1.3690
Capital Injection 145 1.1587 1.5260 0.0011 0.5393 4.6526
RWA Reduction 118 0.6564 1.2007 0.0331 0.3429 2.0129
Regulatory Capital Savings (Financial Year 2008)Capital Protection Method
Number of Banks
Panel C: Bank-Level Statistics - Net Income Savings
Mean Std. Dev. P5 Median P95
Reclassification 82 0.0816 0.1247 0.0000 0.0327 0.3127
Accounting-Based Capital Measures
Higher DTA 104 0.1434 0.2730 0.0056 0.0747 0.5635
Non-Recurring Revenues 53 0.0709 0.2112 0.0002 0.0082 0.3621
Lower LLP 109 0.2397 0.2280 0.0325 0.1857 0.6180
Real Capital Measures
Cherry Picking 37 0.1149 0.2198 0.0013 0.0284 0.5003
Capital Protection MethodNumber of
Banks
Net Income Savings (Financial Year 2008)

47
TABLE 2
Variable Definitions
Panel A: Variables in Determinants Analysis (Table 4)
Variable Definition
Reclassification Indicator variable equal to one if the bank reclassifies trading or AFS assets in accordance with IAS 39 in financial year 2008, and zero otherwise. Source: own data
Regulatory Capital Restriction Difference between the minimum tier 1 capital ratio in the bank’s home country and the bank’s tier 1 capital ratio at the end of financial year 2008 (adjusted for reclassification effects) in percentage points. Source: own data, see also Appendix I
Local GAAP Regulation Indicator variable equal to one if the bank’s regulatory capital is determined based on local GAAP, and zero otherwise. Source: own data
Accounting-Based Capital Measures Indicator variable equal to one if the bank uses accounting-based capital measures (higher DTA, non-recurring revenues or lower LLP) to increase its tier 1 capital in financial year 2008, and zero otherwise. The variable is equal to zero for banks with missing data. Source: own data
Higher DTA Indicator variable equal to one if the bank recognizes higher deferred tax assets (DTA) to increase its tier 1 capital in financial year 2008, and zero otherwise. The variable is equal to zero for banks with missing data. Source: own data
Non-Recurring Revenues Indicator variable equal to one if the bank recognizes non-recurring revenues to increase its tier 1 capital in financial year 2008, and zero otherwise. The variable is equal to zero for banks with missing data. Source: own data
Lower LLP Indicator variable equal to one if the bank recognizes lower loan loss provisions (LLP) to increase its tier 1 capital in financial year 2008, and zero otherwise. The variable is equal to zero for banks with missing data. Source: own data
Real Capital Measures Indicator variable equal to one if the bank uses real capital measures (cherry picking, dividend cuts or capital injections) to increase its tier 1 capital in financial year 2008, and zero otherwise. The variable is equal to zero for banks with missing data. Source: own data
Cherry Picking Indicator variable equal to one if the bank sells “cherry picked” assets with unrealized gains to increase its tier 1 capital in financial year 2008, and zero otherwise. The variable is equal to zero for banks with missing data. Source: own data
Dividend Cuts Indicator variable equal to one if the bank cuts dividend payments to increase its tier 1 capital in financial year 2008, and zero otherwise. The variable is equal to zero for banks with missing data. Source: own data
Capital Injections Indicator variable equal to one if the bank uses capital injections to increase its tier 1 capital in financial year 2008, and zero otherwise. The variable is equal to zero for banks with missing data. Source: own data
RWA Reduction Indicator variable equal to one if the bank reduces its risk-weighted assets (RWA) to increase its tier 1 capital ratio in financial year 2008, and zero otherwise. The variable is equal to zero for banks with missing data.

48
Source: own data
Earnings Quality Relative magnitude of accruals calculated as the bank’s median ratio of yearly absolute accruals to absolute cash flows from operations over financial years 1990 to 2007. We use pre-tax income before loan loss provisions as a bank-specific proxy for cash flows from operations. We convert the variable into ranks with higher ranks representing higher reporting quality and scale the ranks on a range of -1 and 0. Source: BvD BankScope
% FV Assets Proportion of financial assets that are eligible for reclassification calculated as the sum of the book values of trading and AFS assets scaled by the book value of total assets at the end of financial year 2008 (adjusted for reclassification effects). Source: own data
Zero Earnings Threshold Indicator variable equal to one if net income before reclassifications in financial year 2008 is negative, and zero otherwise. Source: own data
∆ Customer Deposits Indicator variable equal to one if the change in the bank’s customer deposits (scaled by total liabilities) between financial years 2007 and 2008 is lower than the sample median, and zero otherwise. Source: BvD Bankscope
IIF Membership Indicator variable equal to one if the bank is a member of the International Institute of Finance, and zero otherwise. Source: IIF
AFS Reclassification Indicator variable equal to one if the bank reclassifies AFS assets in accordance with IAS 39 in financial year 2008, and zero otherwise. Source: own data
% AFS Assets Proportion of AFS financial assets that are eligible for reclassification calculated as the sum of the book values of AFS assets scaled by the book value of total assets at the end of financial year 2008 (adjusted for reclassification effects). Source: own data
AFS Prudential Filter Proportion of the revaluation reserves (accumulated unrealized gains and losses) from AFS debt securities that is excluded from the determination of tier 1 capital. The variable is measured at the country level (including tax adjustments). We make the following adjustments to account for firm-specific circumstances: (1) We use the sign of the bank’s revaluation reserves to choose the relevant filter in countries where accumulated unrealized fair value gains and losses are treated asymmetrically. (2) We set the filter to 100% if the bank does not use IFRS in the calculation of its regulatory capital. (3) In countries where the filter is determined instrument-by-instrument, we use the filter for accumulated losses. Source: own data, see also Appendix I
Panel B: Variables in Return Analysis (Tables 5 and 6)
Variable Definition
Abnormal Return – 13/14 October 2008
Coefficient estimate resulting from bank-specific time-series regressions of daily log-returns on the DJ STOXX 1800 market index and event dummies for October 13 and 14, 2008. The regressions are estimated over the period October 1, 2008 to December 31, 2008. Source: Thomson Reuters Datastream
Expected Reclassification (Probit Model)
Indicator variable equal to one if the fitted probability of the reclassification determinants model in Table 4 is higher than 0.5, and zero otherwise.
Source: own data
Expected Reclassification (Perfect Foresight)
Indicator variable equal to one if the bank reclassifies trading or AFS assets in accordance with IAS 39 in financial year 2008, and zero otherwise. Source: own data

49
Regulatory Capital Restriction (Median Split)
Indicator variable equal to one if the difference between the minimum tier 1 capital ratio in the bank’s home country and the bank’s tier 1 capital ratio at the end of financial year 2008 (adjusted for reclassification effects)) is below the sample median, and zero otherwise.
Source: own data, see also Appendix I
Abnormal Return – Bank Announcements
Cumulative prediction error from the market model over the announcement window [0, +1],
For reclassifying banks, day 0 is zero is day of the reclassification announcement.
For non-reclassifying banks, day 0 is the day of the first earnings announcement following the official announcement of the amendment to IAS 39 in October 2008.
The market model is estimated with daily log-returns for the intervals [-60, -11] and [+11, +60] relative to day 0 using the DJ STOXX 1800 as the market index
Source: Thomson Reuters Datastream, own data for banks’ announcement dates
Reclassification Indicator variable equal to one if the bank reclassifies trading or AFS assets in accordance with IAS 39 in financial year 2008, and zero otherwise. Source: own data
Regulatory Capital Effect (Continuous)
Percentage point difference between the tier 1 capital ratio as reported and the tier 1 capital ratio excluding reclassification effects at the end of financial year 2008.
This variable is equal to zero for non-reclassifying banks
Source: own data
Regulatory Capital Effect (Dummy > 50 BP)
Indicator variable equal to one if the difference between the tier 1 capital ratio as reported and the tier 1 capital ratio excluding reclassification effects is higher than 50 basis points at the end of financial year 2008, and zero otherwise.
This variable is equal to zero for non-reclassifying banks
Source: own data
Earnings Surprise Indicator variable equal to one if the announced earnings number is higher than the most recent average analyst forecast before the announcement, and zero otherwise.
If the reclassification announcement does not coincide with an earnings announcement, the variable is equal to zero
Source: I/B/E/S, own data
Panel C: Variables in Spread Analysis (Table 7)
Variable Definition
Log(Bid-Ask Spread) Natural logarithm of the median of the daily closing bid-ask spreads over the respective bank-week.
Source: Thomson Reuters Datastream
Post-Reclassification
Indicator variable measured at the bank-week level:
For reclassifying banks, the variable is equal to one for all reclassification weeks starting with the first week during which the respective bank announced reclassifications, and zero otherwise.
For non-reclassifying banks, the variable is equal to zero throughout the sample period.
Source: own data
Complete Disclosure Time-invariant indicator variable for each individual bank:
For reclassifying banks, the variable is equal to one if the bank discloses all six items required by IFRS 7, para. 12A, in the footnotes to its financial statements for financial year 2008, and zero otherwise.
For non-reclassifying banks, the variable is equal to zero throughout the sample period.

50
Source: own data
Regulatory Capital Effect (Median Split)
Time-invariant indicator variable for each individual bank:
For reclassifying banks, the variable is equal to one if the difference between tier 1 capital as reported and tier 1 capital excluding reclassification effects is above the median across reclassifying banks in our sample at the end of financial year 2008, and zero otherwise.
For non-reclassifying banks, the variable is equal to zero throughout the sample period.
Source: own data
Log(Share Turnover) Natural logarithm of the average daily share turnover (i.e., trading volume in units divided by the number of outstanding shares) over the respective bank-week.
Source: Thomson Reuters Datastream
Log(Market Value) Natural logarithm of the median of the daily closing market value of outstanding equity in million Euros over the respective bank-week.
Source: Thomson Reuters Datastream
Log(Return Variability) Natural logarithm of the standard deviation of daily stock returns over the respective bank-week.
Source: Thomson Reuters Datastream
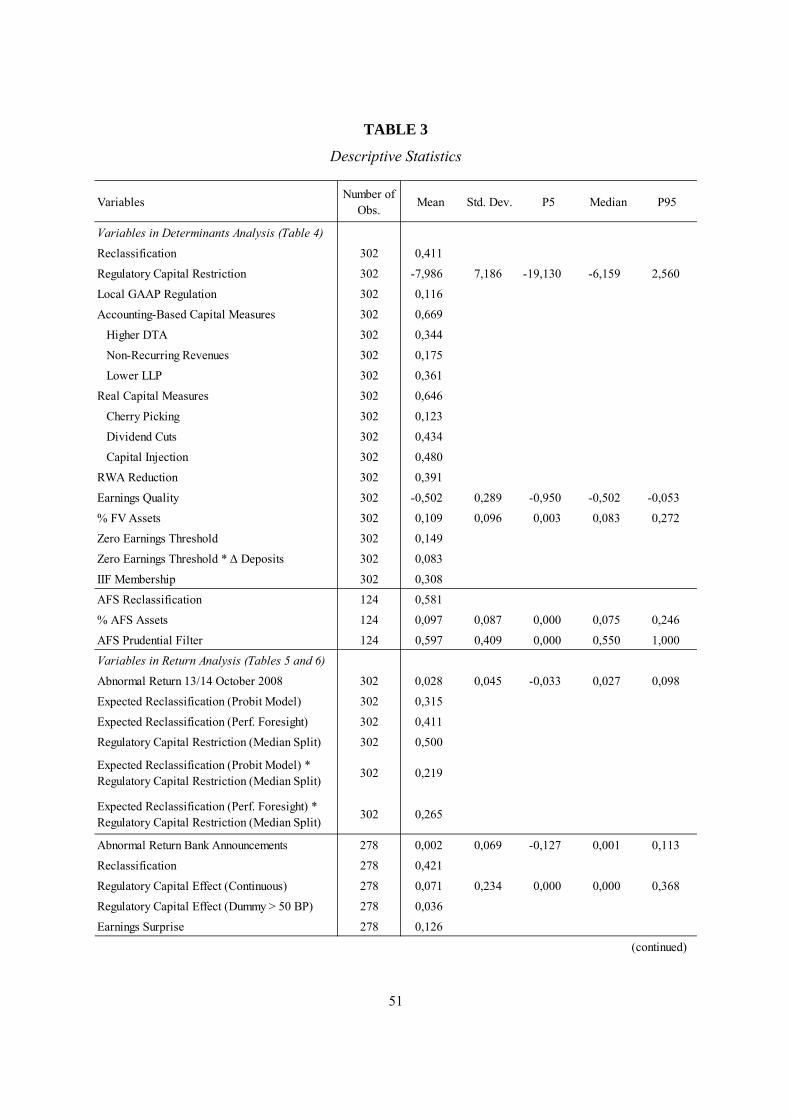
51
TABLE 3
Descriptive Statistics
VariablesNumber of
Obs.Mean Std. Dev. P5 Median P95
Variables in Determinants Analysis (Table 4)
Reclassification 302 0,411
Regulatory Capital Restriction 302 -7,986 7,186 -19,130 -6,159 2,560
Local GAAP Regulation 302 0,116
Accounting-Based Capital Measures 302 0,669
Higher DTA 302 0,344
Non-Recurring Revenues 302 0,175
Lower LLP 302 0,361
Real Capital Measures 302 0,646
Cherry Picking 302 0,123
Dividend Cuts 302 0,434
Capital Injection 302 0,480
RWA Reduction 302 0,391
Earnings Quality 302 -0,502 0,289 -0,950 -0,502 -0,053
% FV Assets 302 0,109 0,096 0,003 0,083 0,272
Zero Earnings Threshold 302 0,149
Zero Earnings Threshold * Δ Deposits 302 0,083
IIF Membership 302 0,308
AFS Reclassification 124 0,581
% AFS Assets 124 0,097 0,087 0,000 0,075 0,246
AFS Prudential Filter 124 0,597 0,409 0,000 0,550 1,000
Variables in Return Analysis (Tables 5 and 6)
Abnormal Return 13/14 October 2008 302 0,028 0,045 -0,033 0,027 0,098
Expected Reclassification (Probit Model) 302 0,315
Expected Reclassification (Perf. Foresight) 302 0,411
Regulatory Capital Restriction (Median Split) 302 0,500
Expected Reclassification (Probit Model) *Regulatory Capital Restriction (Median Split)
302 0,219
Expected Reclassification (Perf. Foresight) *Regulatory Capital Restriction (Median Split)
302 0,265
Abnormal Return Bank Announcements 278 0,002 0,069 -0,127 0,001 0,113
Reclassification 278 0,421
Regulatory Capital Effect (Continuous) 278 0,071 0,234 0,000 0,000 0,368
Regulatory Capital Effect (Dummy > 50 BP) 278 0,036
Earnings Surprise 278 0,126
(continued)
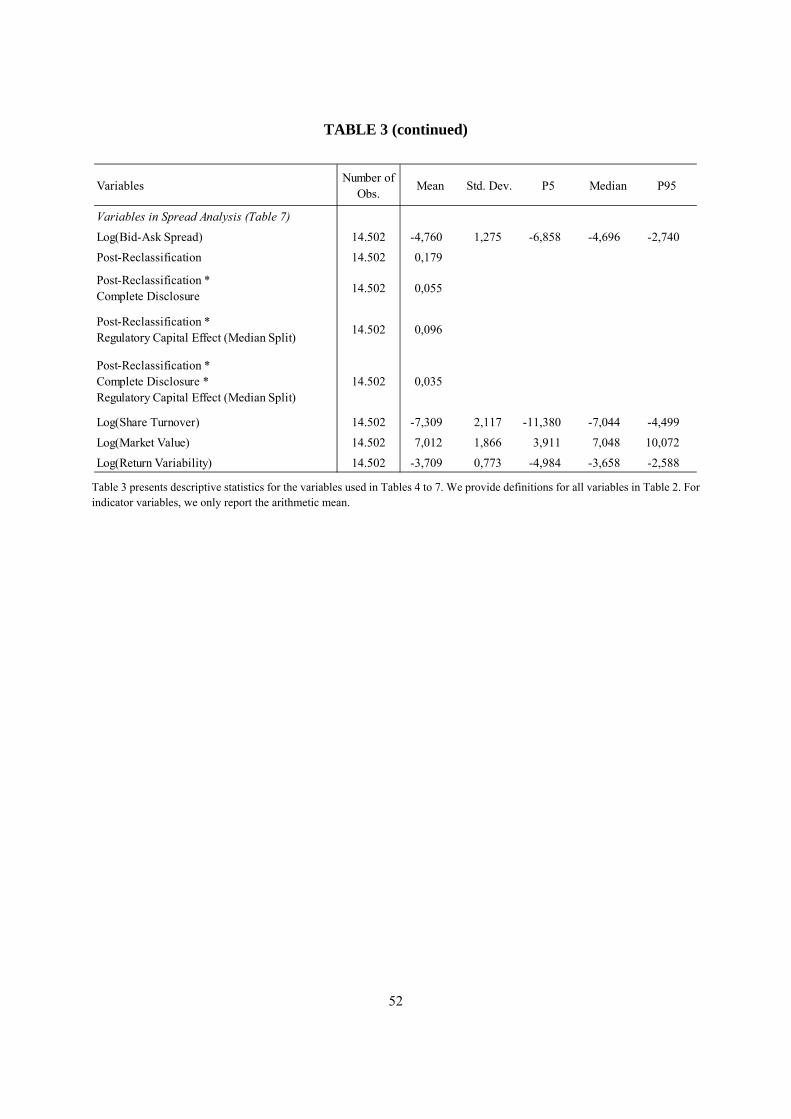
52
TABLE 3 (continued)
Table 3 presents descriptive statistics for the variables used in Tables 4 to 7. We provide definitions for all variables in Table 2. For indicator variables, we only report the arithmetic mean.
VariablesNumber of
Obs.Mean Std. Dev. P5 Median P95
Variables in Spread Analysis (Table 7)
Log(Bid-Ask Spread) 14.502 -4,760 1,275 -6,858 -4,696 -2,740
Post-Reclassification 14.502 0,179
Post-Reclassification *Complete Disclosure
14.502 0,055
Post-Reclassification *Regulatory Capital Effect (Median Split)
14.502 0,096
Post-Reclassification *Complete Disclosure *Regulatory Capital Effect (Median Split)
14.502 0,035
Log(Share Turnover) 14.502 -7,309 2,117 -11,380 -7,044 -4,499
Log(Market Value) 14.502 7,012 1,866 3,911 7,048 10,072
Log(Return Variability) 14.502 -3,709 0,773 -4,984 -3,658 -2,588
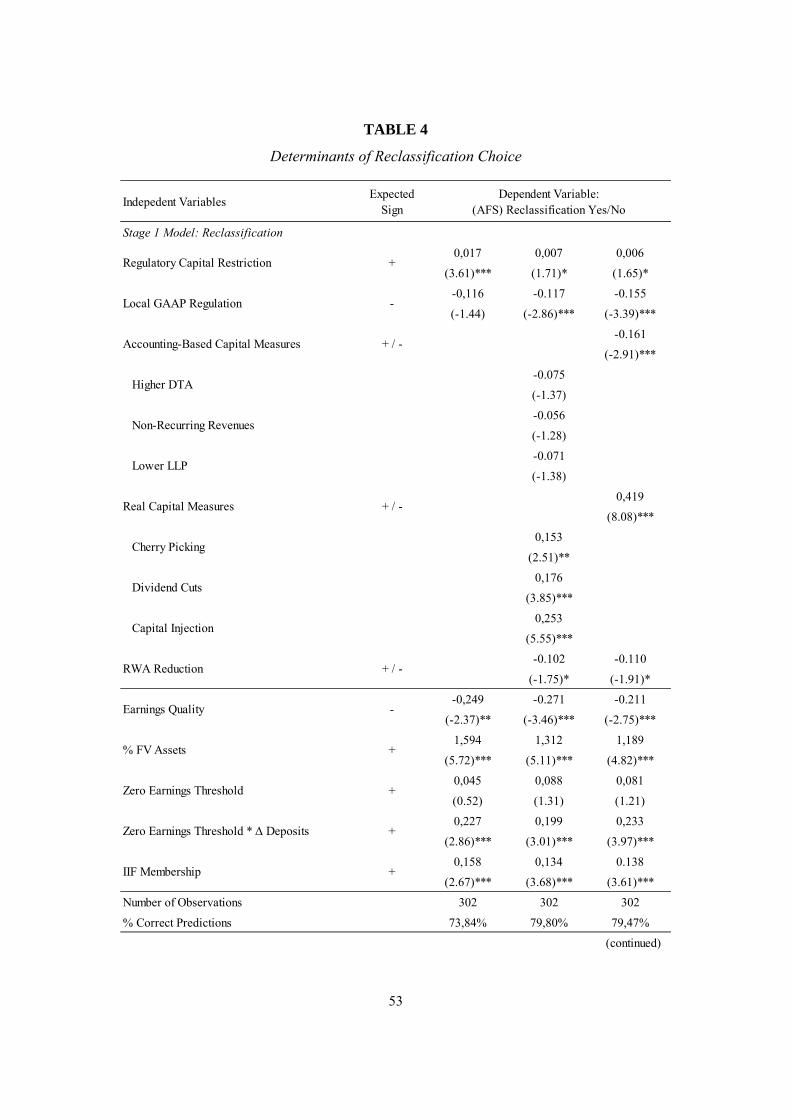
53
TABLE 4
Determinants of Reclassification Choice
Indepedent VariablesExpected
Sign
Stage 1 Model: Reclassification
0,017 0,007 0,006
(3.61)*** (1.71)* (1.65)*
-0,116 -0.117 -0.155
(-1.44) (-2.86)*** (-3.39)***
-0.161
(-2.91)***
-0.075
(-1.37)
-0.056
(-1.28)
-0.071
(-1.38)
0,419
(8.08)***
0,153
(2.51)**
0,176
(3.85)***
0,253
(5.55)***
-0.102 -0.110
(-1.75)* (-1.91)*
-0,249 -0.271 -0.211
(-2.37)** (-3.46)*** (-2.75)***
1,594 1,312 1,189
(5.72)*** (5.11)*** (4.82)***
0,045 0,088 0,081
(0.52) (1.31) (1.21)
0,227 0,199 0,233
(2.86)*** (3.01)*** (3.97)***
0,158 0,134 0.138
(2.67)*** (3.68)*** (3.61)***
302 302 302
% Correct Predictions 73,84% 79,80% 79,47%
(continued)
IIF Membership +
Number of Observations
% FV Assets +
Zero Earnings Threshold +
Zero Earnings Threshold * Δ Deposits +
Dividend Cuts
Capital Injection
RWA Reduction + / -
Earnings Quality -
Cherry Picking
Dependent Variable:(AFS) Reclassification Yes/No
Regulatory Capital Restriction +
Local GAAP Regulation -
Accounting-Based Capital Measures + / -
Higher DTA
Non-Recurring Revenues
Lower LLP
Real Capital Measures + / -

54
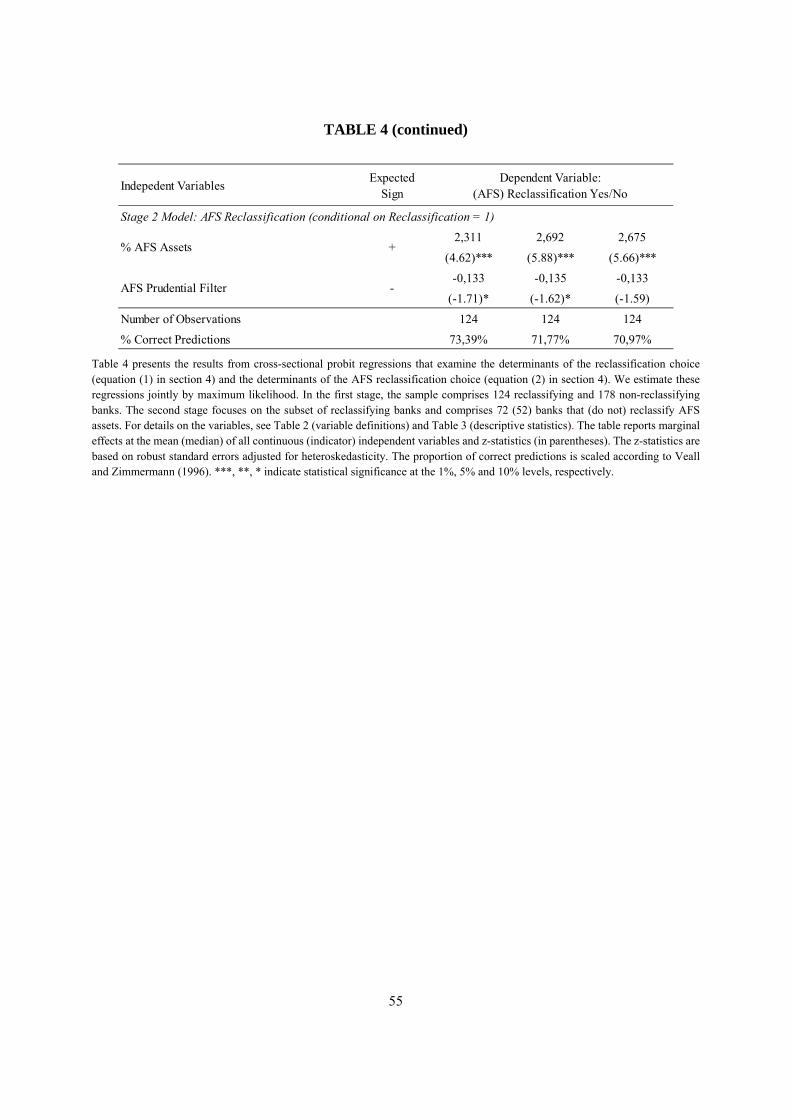
55
TABLE 4 (continued)
Table 4 presents the results from cross-sectional probit regressions that examine the determinants of the reclassification choice (equation (1) in section 4) and the determinants of the AFS reclassification choice (equation (2) in section 4). We estimate these regressions jointly by maximum likelihood. In the first stage, the sample comprises 124 reclassifying and 178 non-reclassifying banks. The second stage focuses on the subset of reclassifying banks and comprises 72 (52) banks that (do not) reclassify AFS assets. For details on the variables, see Table 2 (variable definitions) and Table 3 (descriptive statistics). The table reports marginal effects at the mean (median) of all continuous (indicator) independent variables and z-statistics (in parentheses). The z-statistics are based on robust standard errors adjusted for heteroskedasticity. The proportion of correct predictions is scaled according to Veall and Zimmermann (1996). ***, **, * indicate statistical significance at the 1%, 5% and 10% levels, respectively.
Indepedent VariablesExpected
Sign
Stage 2 Model: AFS Reclassification (conditional on Reclassification = 1)
2,311 2,692 2,675
(4.62)*** (5.88)*** (5.66)***
-0,133 -0,135 -0,133
(-1.71)* (-1.62)* (-1.59)
124 124 124
% Correct Predictions 73,39% 71,77% 70,97%
AFS Prudential Filter -
Number of Observations
Dependent Variable:(AFS) Reclassification Yes/No
% AFS Assets +
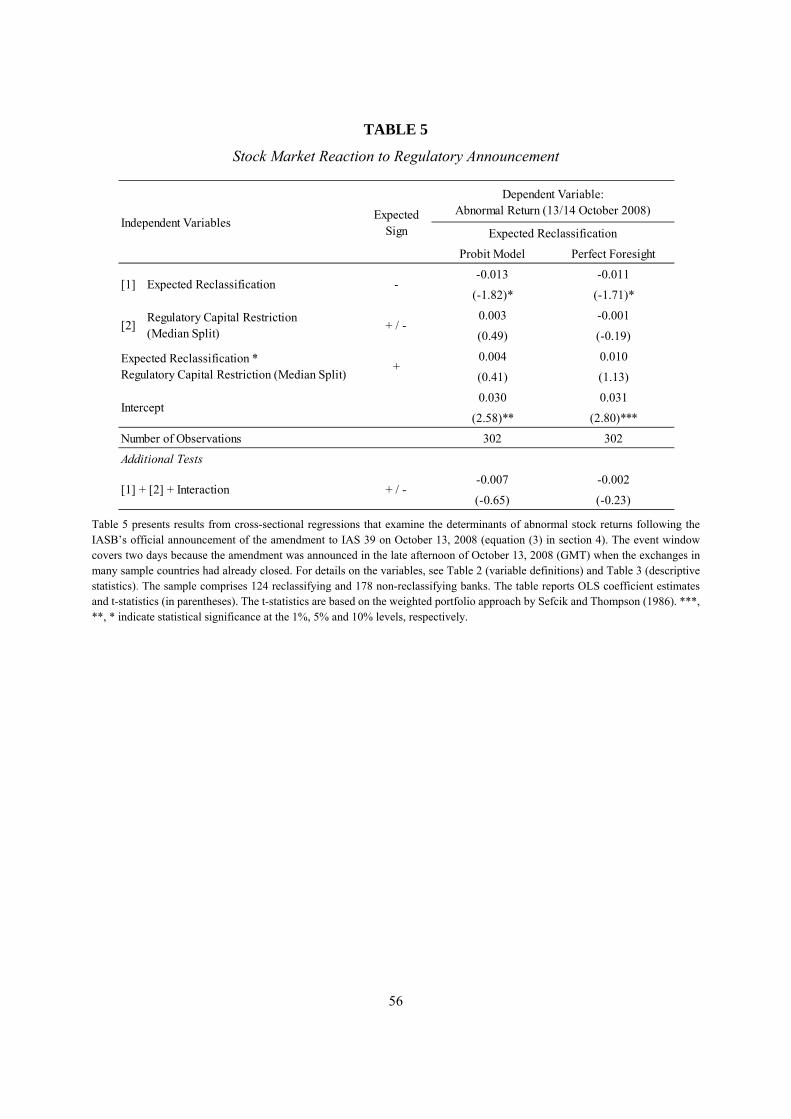
56
TABLE 5
Stock Market Reaction to Regulatory Announcement
Table 5 presents results from cross-sectional regressions that examine the determinants of abnormal stock returns following the IASB’s official announcement of the amendment to IAS 39 on October 13, 2008 (equation (3) in section 4). The event window covers two days because the amendment was announced in the late afternoon of October 13, 2008 (GMT) when the exchanges in many sample countries had already closed. For details on the variables, see Table 2 (variable definitions) and Table 3 (descriptive statistics). The sample comprises 124 reclassifying and 178 non-reclassifying banks. The table reports OLS coefficient estimates and t-statistics (in parentheses). The t-statistics are based on the weighted portfolio approach by Sefcik and Thompson (1986). ***, **, * indicate statistical significance at the 1%, 5% and 10% levels, respectively.
Probit Model Perfect Foresight
-0.013 -0.011
(-1.82)* (-1.71)*
0.003 -0.001
(0.49) (-0.19)
0.004 0.010
(0.41) (1.13)
0.030 0.031
(2.58)** (2.80)***
302 302
Additional Tests
-0.007 -0.002
(-0.65) (-0.23)
Independent VariablesExpected
Sign
Dependent Variable:Abnormal Return (13/14 October 2008)
Expected Reclassification
[1] Expected Reclassification -
Number of Observations
[1] + [2] + Interaction + / -
[2]Regulatory Capital Restriction(Median Split)
+ / -
Expected Reclassification *Regulatory Capital Restriction (Median Split)
+
Intercept
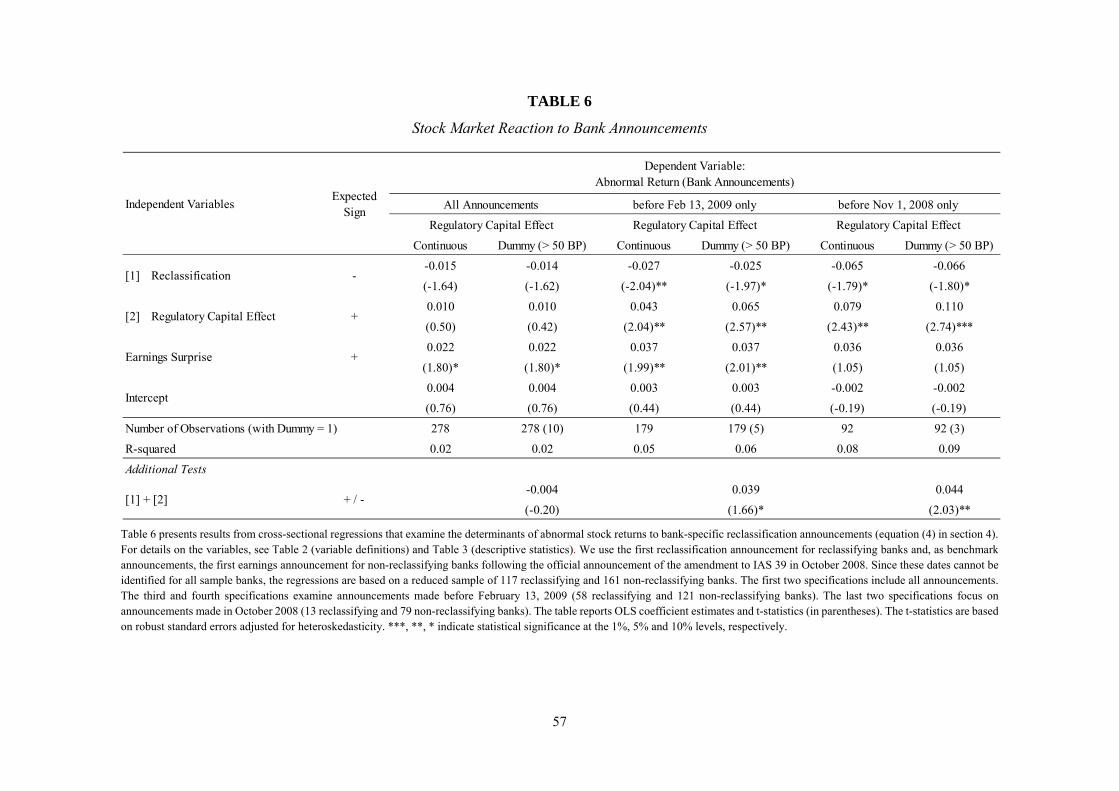
57
TABLE 6
Stock Market Reaction to Bank Announcements
Table 6 presents results from cross-sectional regressions that examine the determinants of abnormal stock returns to bank-specific reclassification announcements (equation (4) in section 4). For details on the variables, see Table 2 (variable definitions) and Table 3 (descriptive statistics). We use the first reclassification announcement for reclassifying banks and, as benchmark announcements, the first earnings announcement for non-reclassifying banks following the official announcement of the amendment to IAS 39 in October 2008. Since these dates cannot be identified for all sample banks, the regressions are based on a reduced sample of 117 reclassifying and 161 non-reclassifying banks. The first two specifications include all announcements. The third and fourth specifications examine announcements made before February 13, 2009 (58 reclassifying and 121 non-reclassifying banks). The last two specifications focus on announcements made in October 2008 (13 reclassifying and 79 non-reclassifying banks). The table reports OLS coefficient estimates and t-statistics (in parentheses). The t-statistics are based on robust standard errors adjusted for heteroskedasticity. ***, **, * indicate statistical significance at the 1%, 5% and 10% levels, respectively.
Continuous Dummy (> 50 BP) Continuous Dummy (> 50 BP) Continuous Dummy (> 50 BP)
-0.015 -0.014 -0.027 -0.025 -0.065 -0.066
(-1.64) (-1.62) (-2.04)** (-1.97)* (-1.79)* (-1.80)*
0.010 0.010 0.043 0.065 0.079 0.110
(0.50) (0.42) (2.04)** (2.57)** (2.43)** (2.74)***
0.022 0.022 0.037 0.037 0.036 0.036
(1.80)* (1.80)* (1.99)** (2.01)** (1.05) (1.05)
0.004 0.004 0.003 0.003 -0.002 -0.002
(0.76) (0.76) (0.44) (0.44) (-0.19) (-0.19)
Number of Observations (with Dummy = 1) 278 278 (10) 179 179 (5) 92 92 (3)
0.02 0.02 0.05 0.06 0.08 0.09
Additional Tests
-0.004 0.039 0.044
(-0.20) (1.66)* (2.03)**[1] + [2] + / -
Earnings Surprise +
Intercept
R-squared
[1] Reclassification -
[2] Regulatory Capital Effect +
Independent VariablesExpected
Sign
Dependent Variable:Abnormal Return (Bank Announcements)
All Announcements before Feb 13, 2009 only before Nov 1, 2008 only
Regulatory Capital Effect Regulatory Capital Effect Regulatory Capital Effect
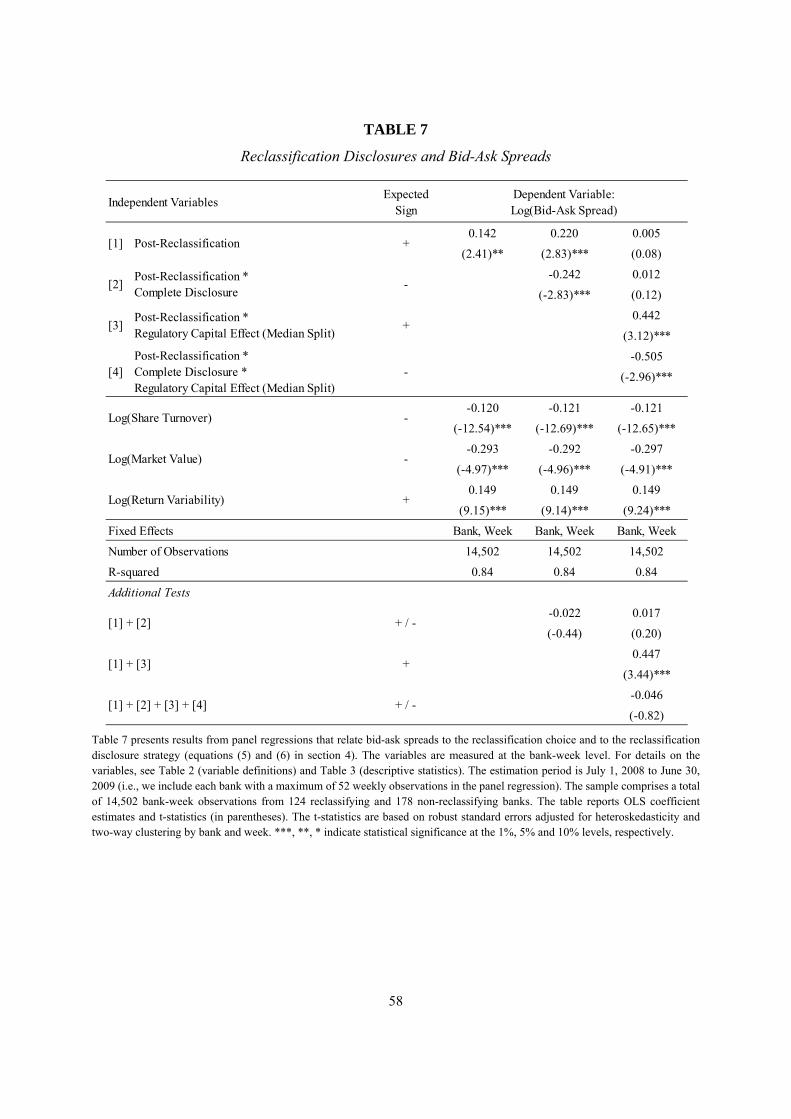
58
TABLE 7
Reclassification Disclosures and Bid-Ask Spreads
Table 7 presents results from panel regressions that relate bid-ask spreads to the reclassification choice and to the reclassification disclosure strategy (equations (5) and (6) in section 4). The variables are measured at the bank-week level. For details on the variables, see Table 2 (variable definitions) and Table 3 (descriptive statistics). The estimation period is July 1, 2008 to June 30, 2009 (i.e., we include each bank with a maximum of 52 weekly observations in the panel regression). The sample comprises a total of 14,502 bank-week observations from 124 reclassifying and 178 non-reclassifying banks. The table reports OLS coefficient estimates and t-statistics (in parentheses). The t-statistics are based on robust standard errors adjusted for heteroskedasticity and two-way clustering by bank and week. ***, **, * indicate statistical significance at the 1%, 5% and 10% levels, respectively.
ExpectedSign
0.142 0.220 0.005
(2.41)** (2.83)*** (0.08)
-0.242 0.012
(-2.83)*** (0.12)
0.442
(3.12)***
-0.505
(-2.96)***
-0.120 -0.121 -0.121
(-12.54)*** (-12.69)*** (-12.65)***
-0.293 -0.292 -0.297
(-4.97)*** (-4.96)*** (-4.91)***
0.149 0.149 0.149
(9.15)*** (9.14)*** (9.24)***
Bank, Week Bank, Week Bank, Week
14,502 14,502 14,502
0.84 0.84 0.84
Additional Tests
-0.022 0.017
(-0.44) (0.20)
0.447
(3.44)***
-0.046
(-0.82)
[2]Post-Reclassification *Complete Disclosure
-
Independent VariablesDependent Variable:Log(Bid-Ask Spread)
[1] Post-Reclassification +
[3]Post-Reclassification *Regulatory Capital Effect (Median Split)
+
[4]Post-Reclassification *Complete Disclosure *Regulatory Capital Effect (Median Split)
-
Log(Share Turnover) -
Log(Market Value) -
Log(Return Variability) +
[1] + [2] + [3] + [4] + / -
Fixed Effects
Number of Observations
R-squared
[1] + [2] + / -
[1] + [3] +