decec s o suppo t syste o ate esou cesision support system ...tp7)/07-eng..m..nanseer.pdf ·...
TRANSCRIPT

Decision Support System for Water Resources ec s o Suppo t Syste o ate esou cesPlanning for Mahaweli River Basins
NKM Nanseer

OverviewOverview
• Introduction to Mahaweli System
• Major Components in Water Resources Planning j p g
• Decision Support System – Why?
W t A il bilit D d d Oth F t i M h li• Water Availability, Demand and Other Features in MahaweliBasin
d l d l• Setting up and Simulating Model
• Multi Criteria Analysis and Prioritizing Projects
• Environmental Flow
• Climate ChangeClimate Change

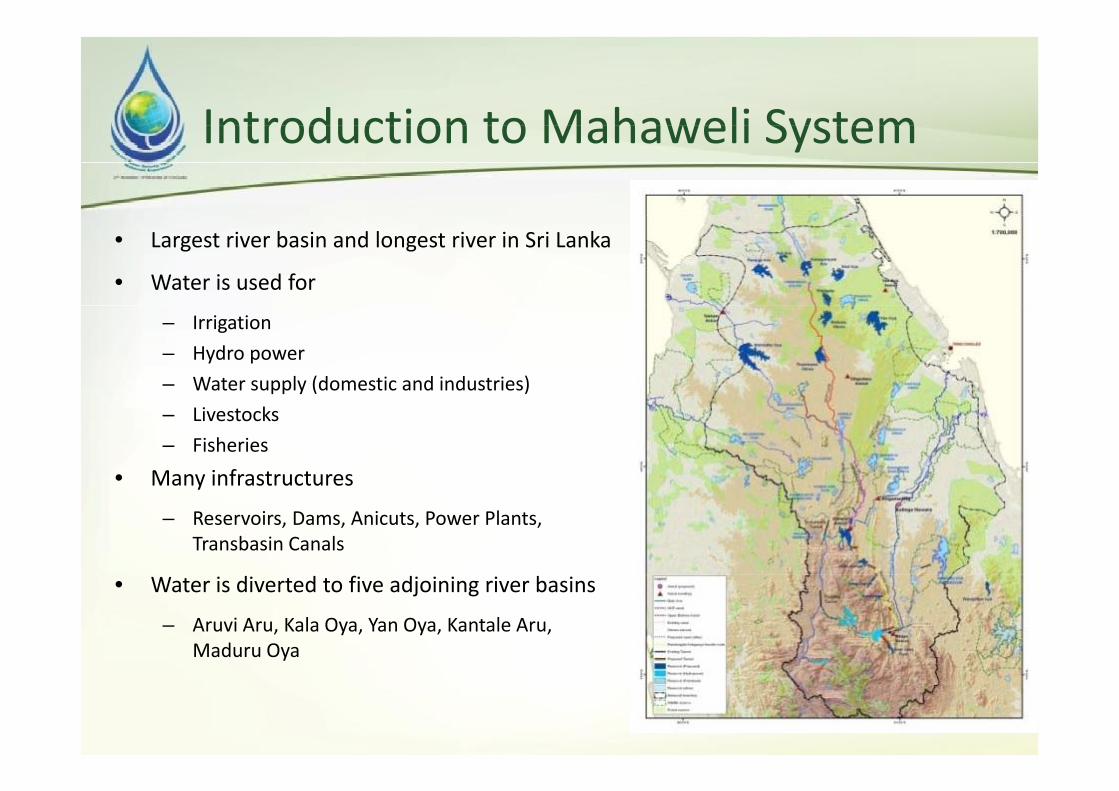
Introduction to Mahaweli SystemIntroduction to Mahaweli System
• Largest river basin and longest river in Sri Lanka
• Water is used for
– Irrigation– Hydro power– Water supply (domestic and industries)– Livestocks– Fisheries
• Many infrastructures Many infrastructures
– Reservoirs, Dams, Anicuts, Power Plants, Transbasin Canals
• Water is diverted to five adjoining river basins
– Aruvi Aru, Kala Oya, Yan Oya, Kantale Aru, Maduru Oya
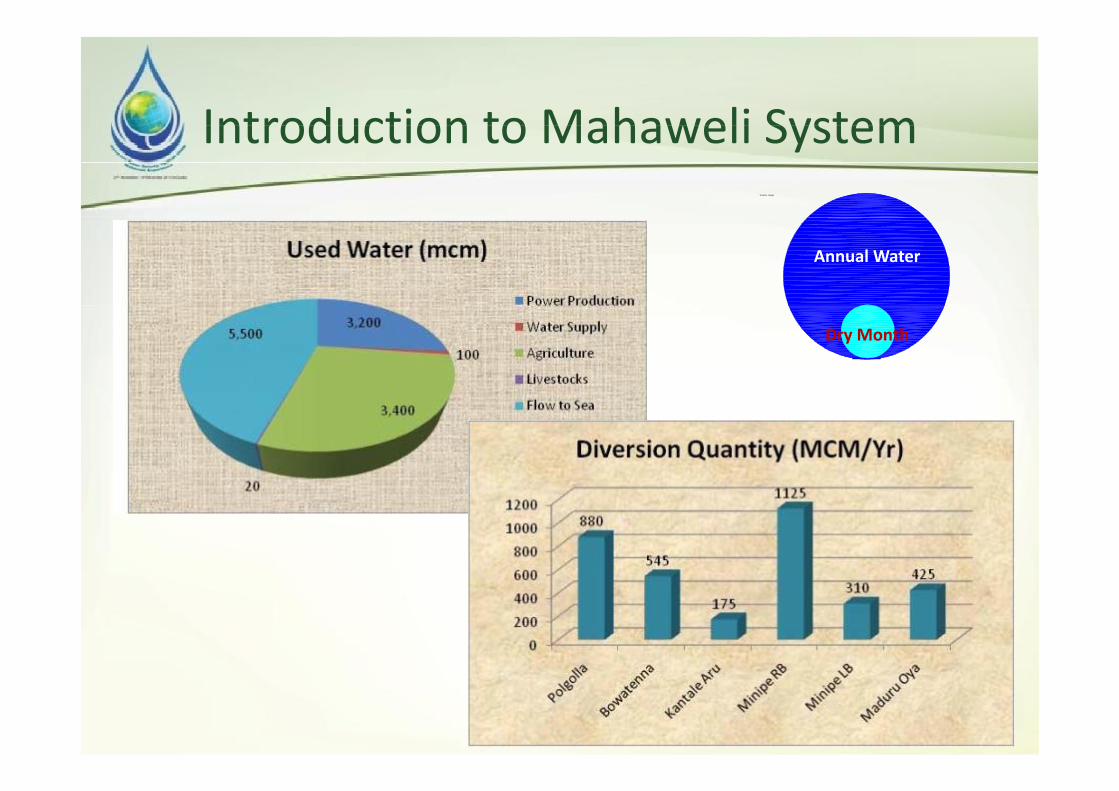
Introduction to Mahaweli SystemIntroduction to Mahaweli SystemWalawe Ganga
Annual Water
Dry Month


Major Components in Water Resources Pl iPlanning
Water Availability
• Surface Water
• Ground Water
• Irrigation (major medium and minor)
Water Users and Their Demand
• Irrigation (major, medium and minor)
• Hydropower
• Water Supply
• Environment…….
Water Allocation for Optimum Usage
• It is not just maximum use of water or water resources
• Economical social environmental and political benefit should be
Water Allocation for Optimum Usage
• Economical, social, environmental and political benefit should be considered

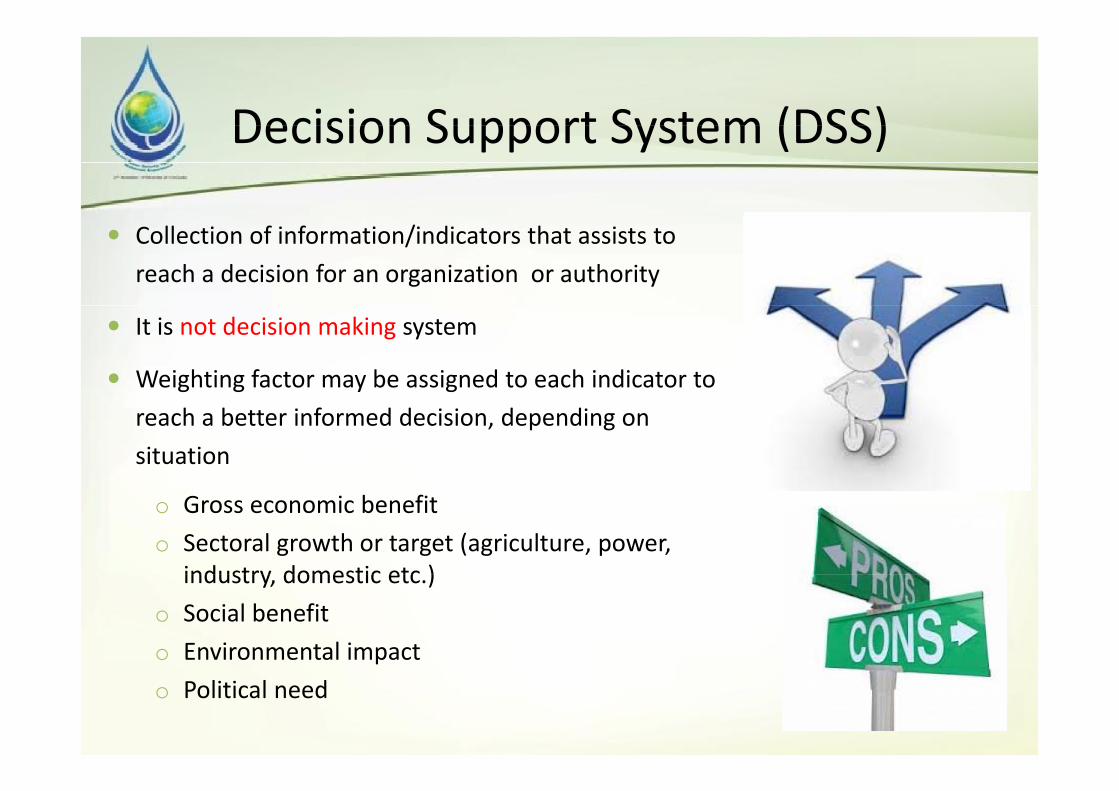
Decision Support System (DSS)Decision Support System (DSS)
Collection of information/indicators that assists to reach a decision for an organization or authority
It is not decision making system
Weighting factor may be assigned to each indicator to reach a better informed decision, depending on situation
o Gross economic benefito Sectoral growth or target (agriculture, power,
industry domestic etc )industry, domestic etc.)o Social benefito Environmental impacto Political need

Decision Support System (DSS)Decision Support System (DSS)
Steps in Decision Support System
o Build databases
Identify problems issues & optionso Identify problems, issues & options
o Design system or establish models
o Identify potential improvements
l lo Develop & evaluate management scenarios
o Present results to decision‐makers

Decision Support System (DSS)Decision Support System (DSS)
DATA BASES
SPATIAL DATAINTERFACE
DECISION‐MAKERS
HISTORICAL DATA MAPS
PLOTS
PROCESS MODELS/METHODS
HYDROLOGYTABLES
ENVIRONMENTALANIMATION
SOCIO‐ECONOMIC

Features of Mahaweli Basin from Data Base
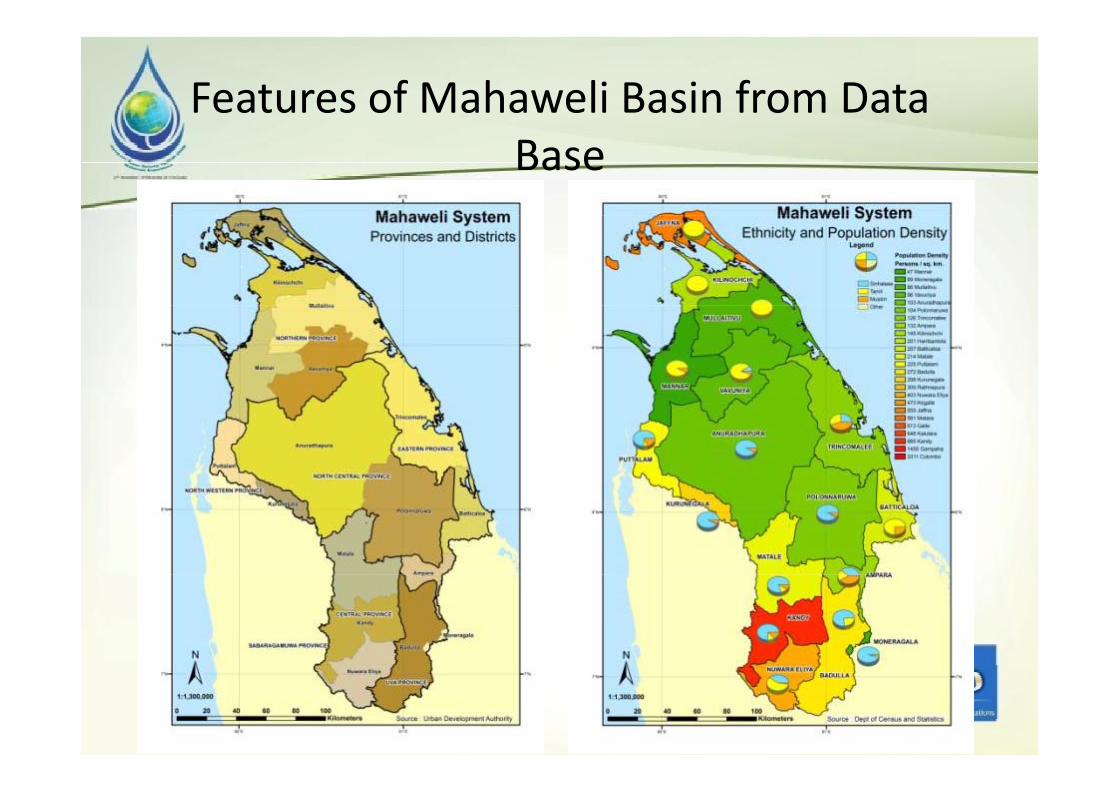
Features of Mahaweli Basin from Data Base
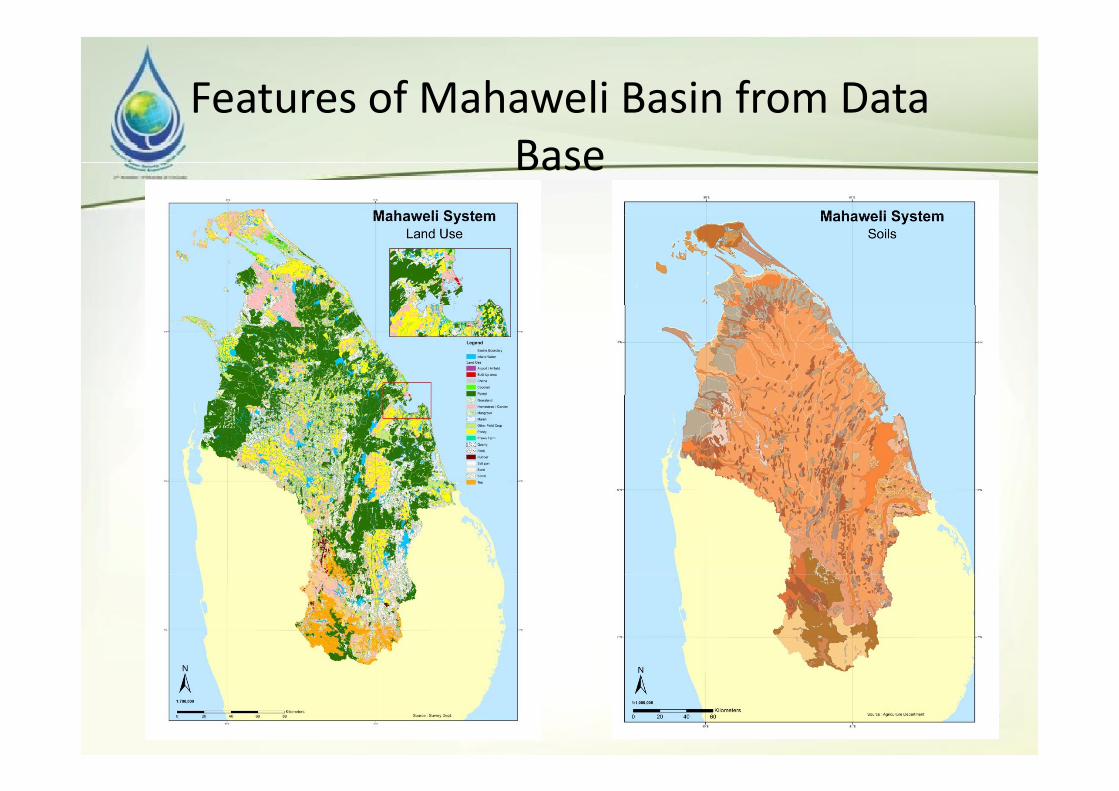
Features of Mahaweli Basin from Data Base
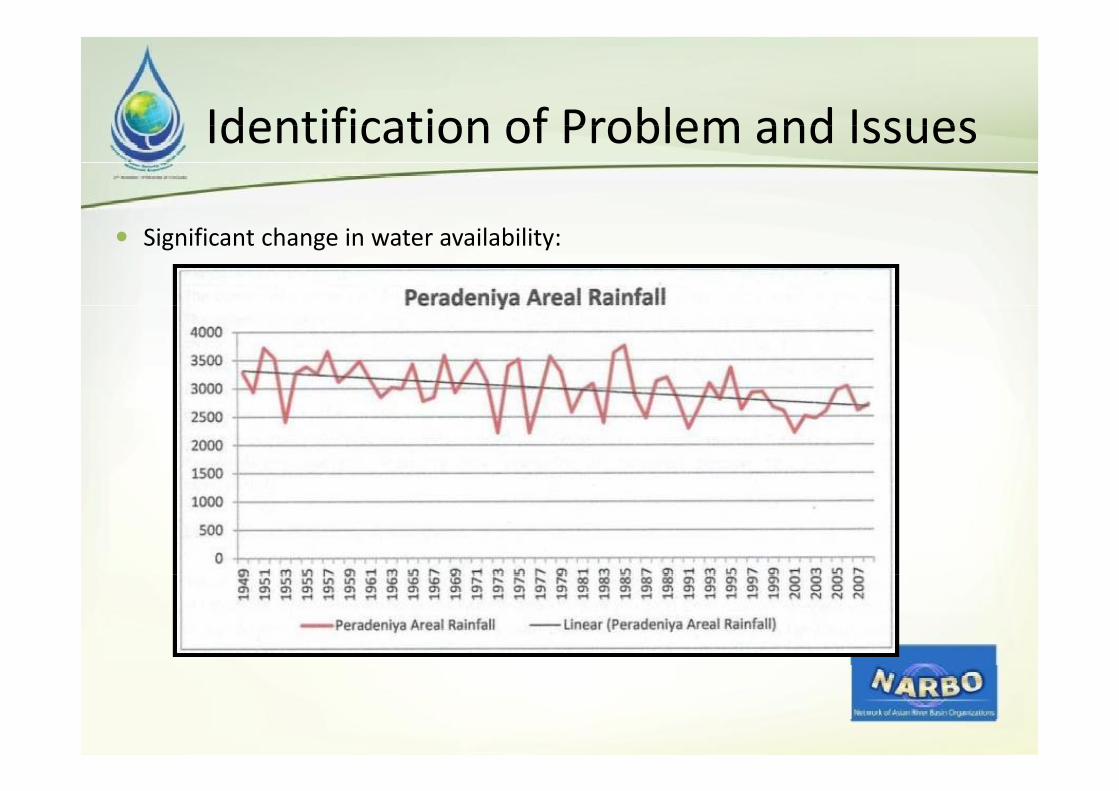
Identification of Problem and IssuesIdentification of Problem and Issues
Significant change in water availability:
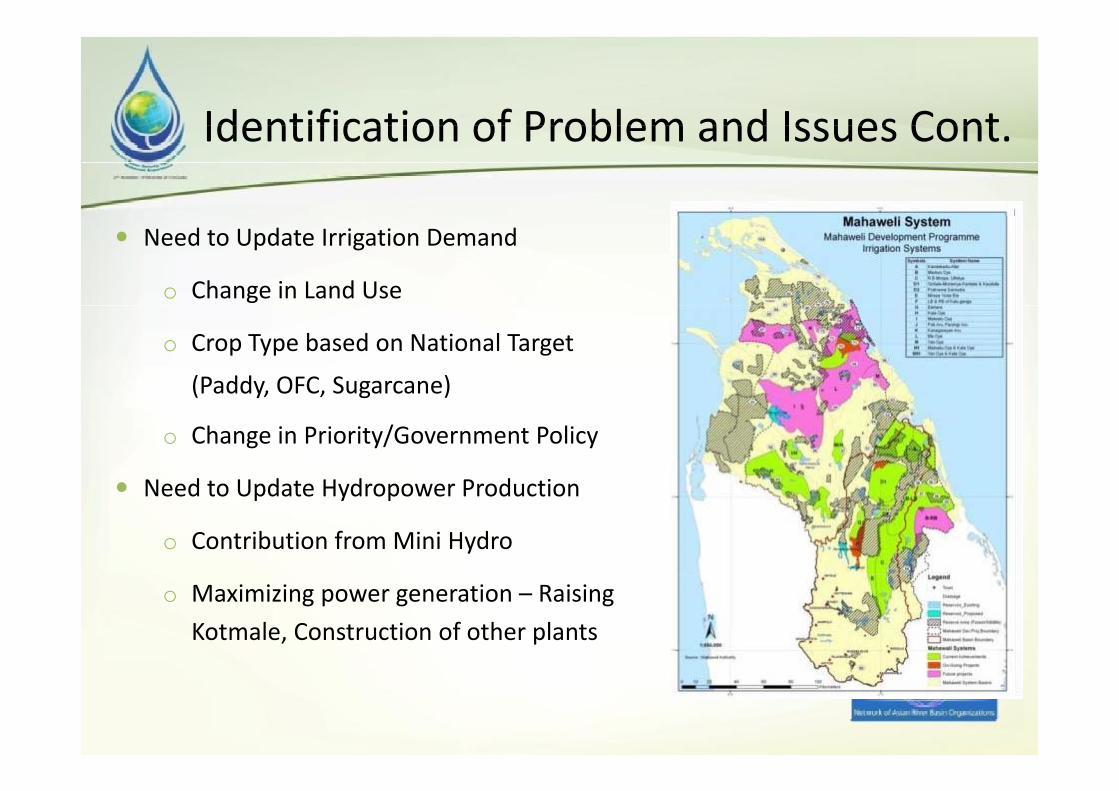
Identification of Problem and Issues ContIdentification of Problem and Issues Cont.
Need to Update Irrigation Demand
o Change in Land Use
o Crop Type based on National Target
(Paddy, OFC, Sugarcane)( y, , g )
o Change in Priority/Government Policy
Need to Update Hydropower Production Need to Update Hydropower Production
o Contribution from Mini Hydro
o Maximizing power generation – Raising Kotmale, Construction of other plants
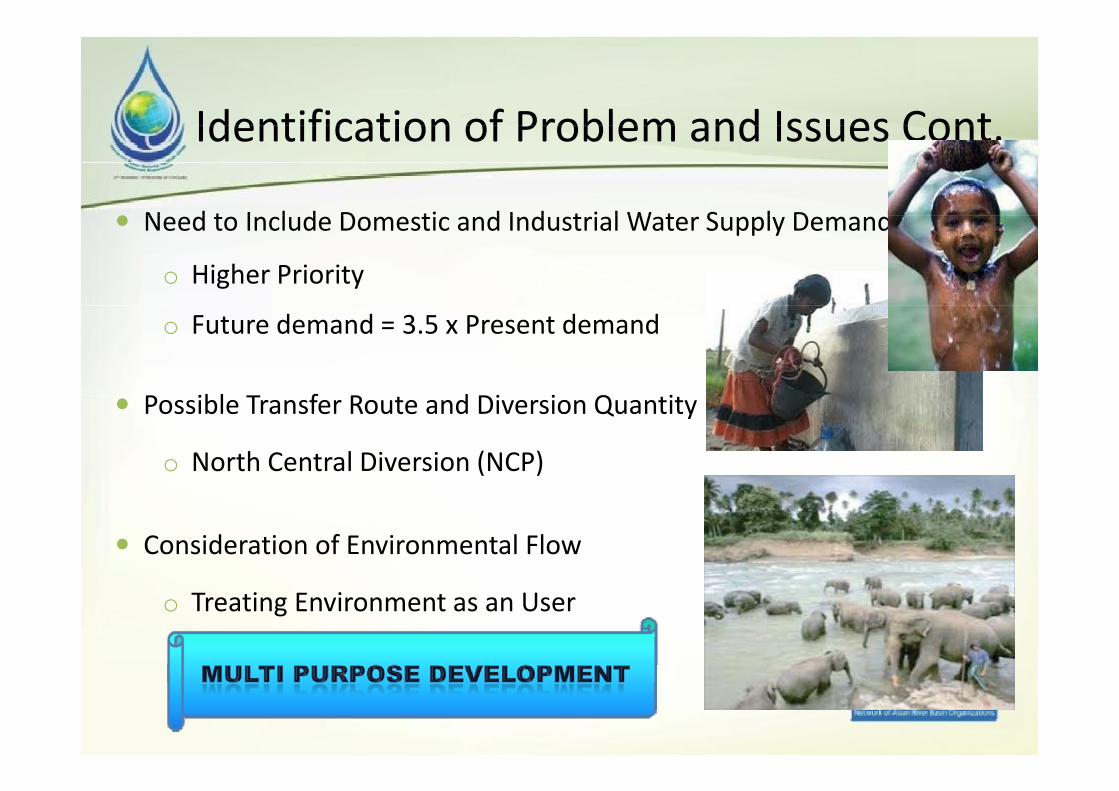
Identification of Problem and Issues ContIdentification of Problem and Issues Cont.
N d t I l d D ti d I d t i l W t S l D d Need to Include Domestic and Industrial Water Supply Demand
o Higher Priority
o Future demand = 3.5 x Present demand
P ibl T f R d Di i Q i Possible Transfer Route and Diversion Quantity
o North Central Diversion (NCP)
Consideration of Environmental Flow
o Treating Environment as an User


Model EstablishmentModel Establishment
M d l S t Model Setup
o GIS based model
o For basins that would be benefited from Mahaweli
o Sub catchments at important locations (> 60)
d fo Demands for Water Users
Irrigation (major & minor) Hydropower Water supply (domestic & industrial)
I f t to Infra‐structures
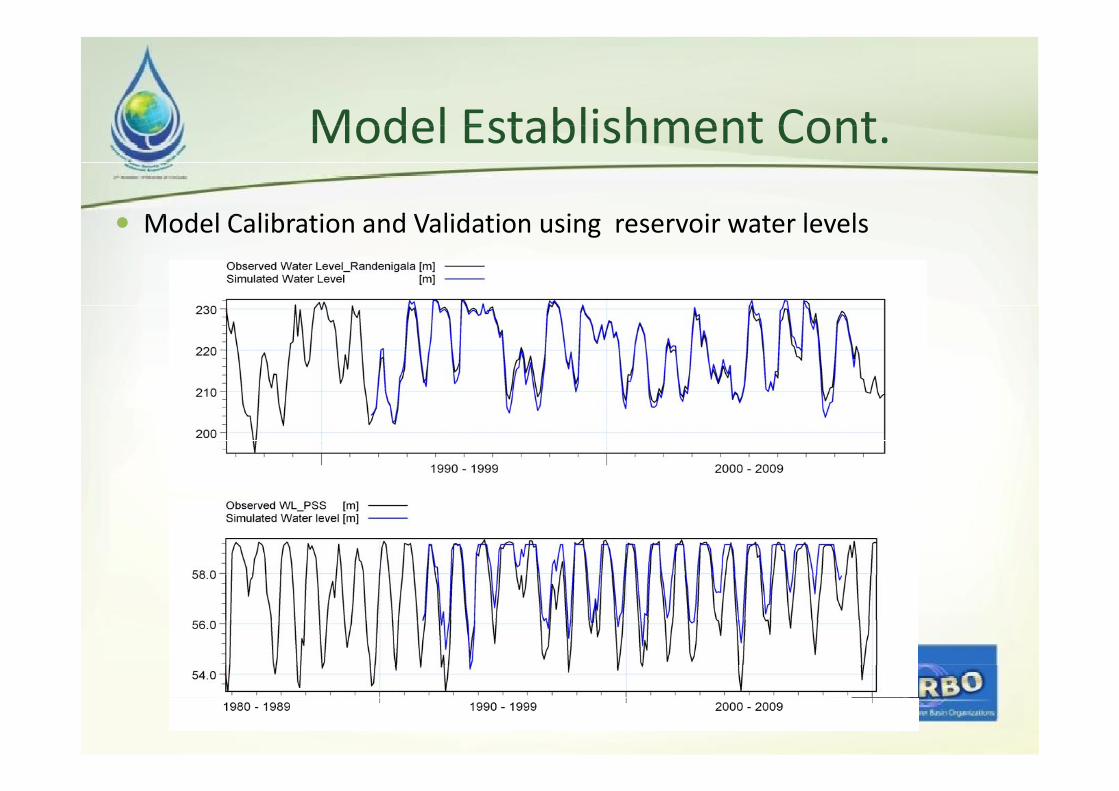
Model Establishment ContModel Establishment Cont.
M d l C lib ti d V lid ti i i t l l Model Calibration and Validation using reservoir water levels

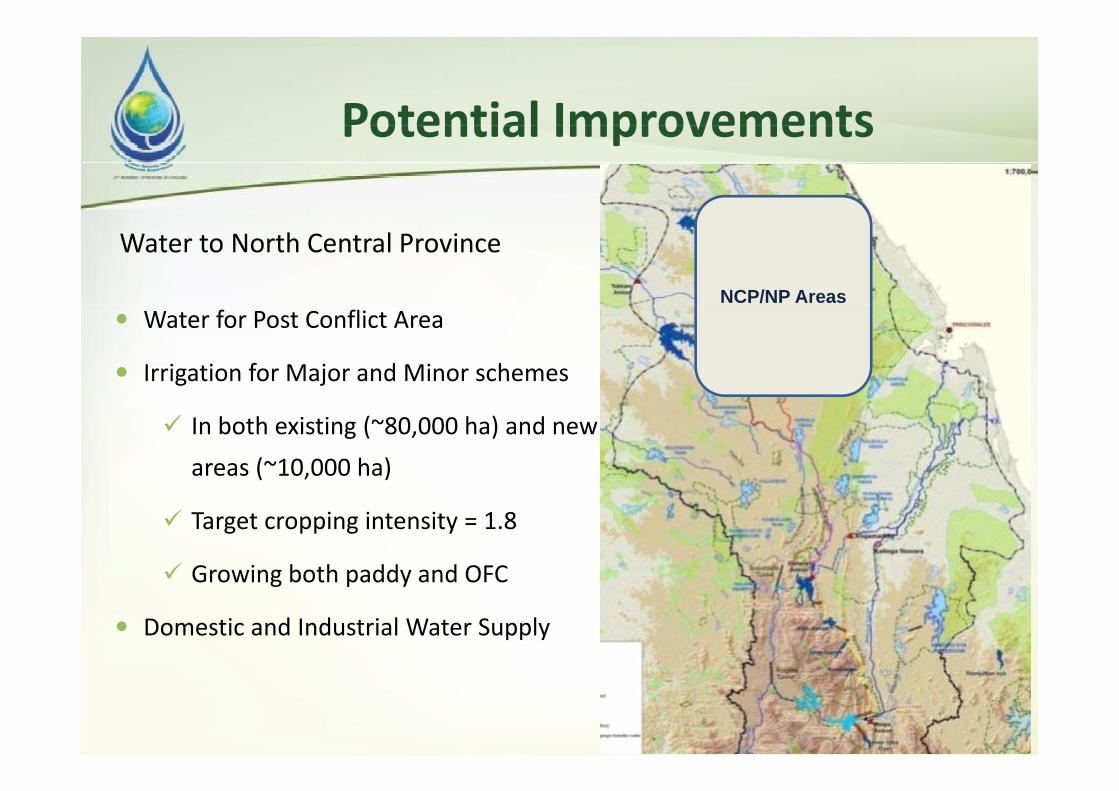
Potential ImprovementsPotential Improvements
Water to North Central Province
NCP/NP Areas Water for Post Conflict Area
Irrigation for Major and Minor schemes
In both existing (~80,000 ha) and new areas (~10,000 ha)
Target cropping intensity = 1.8
Growing both paddy and OFC Growing both paddy and OFC
Domestic and Industrial Water Supply
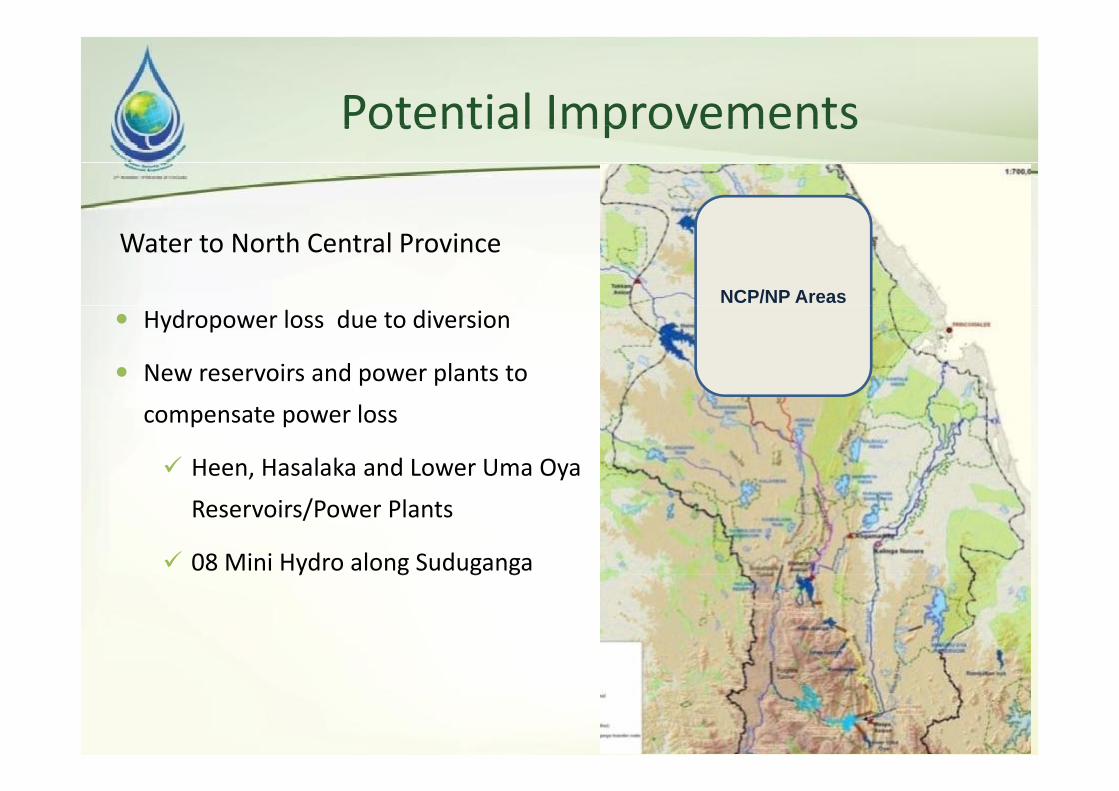
Potential ImprovementsPotential Improvements
Water to North Central Province
NCP/NP Areas Hydropower loss due to diversion
New reservoirs and power plants to compensate power loss
Heen, Hasalaka and Lower Uma Oya
Reservoirs/Power Plants
08 Mini Hydro along Sudugangay g g g
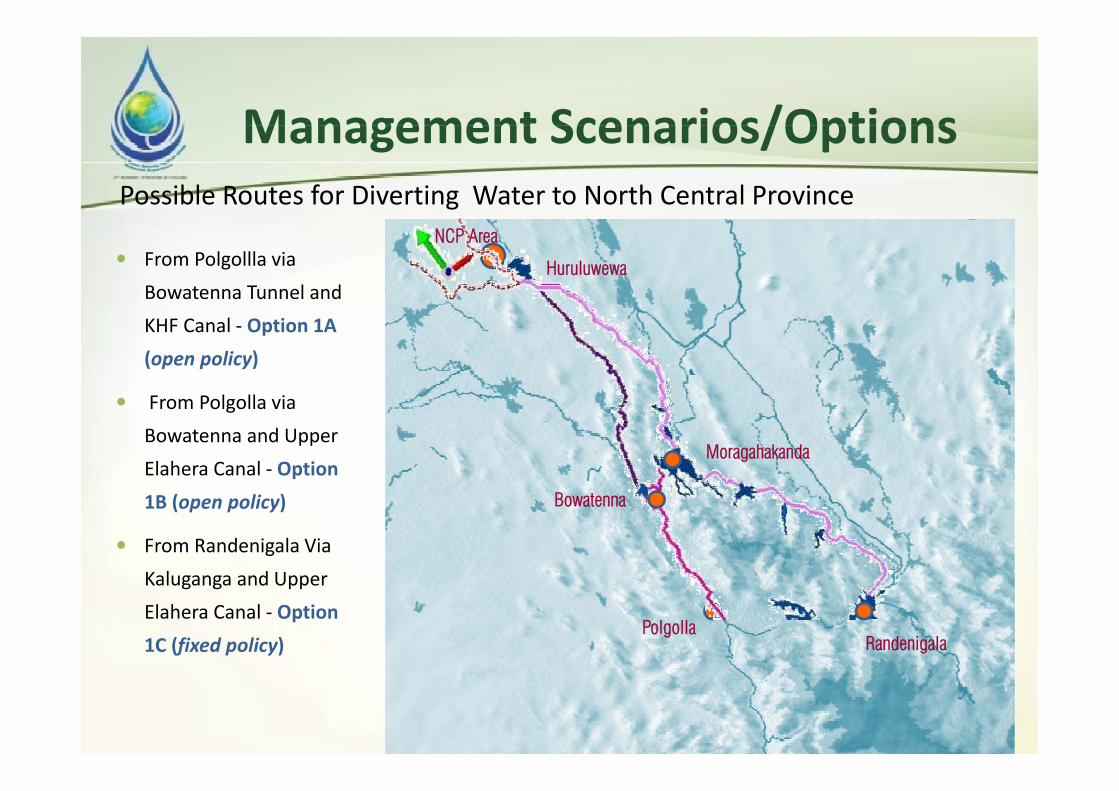
Management Scenarios/OptionsManagement Scenarios/OptionsPossible Routes for Diverting Water to North Central Province
From Polgollla via Bowatenna Tunnel and
NCP Area
Huruluwewa
KHF Canal ‐ Option 1A (open policy)
F P l ll i From Polgolla via Bowatenna and Upper Elahera Canal ‐ Option
Moragahakanda
1B (open policy)
From Randenigala Via K l d U
Bowatenna
Kaluganga and Upper Elahera Canal ‐ Option 1C (fixed policy)
PolgollaRandenigala

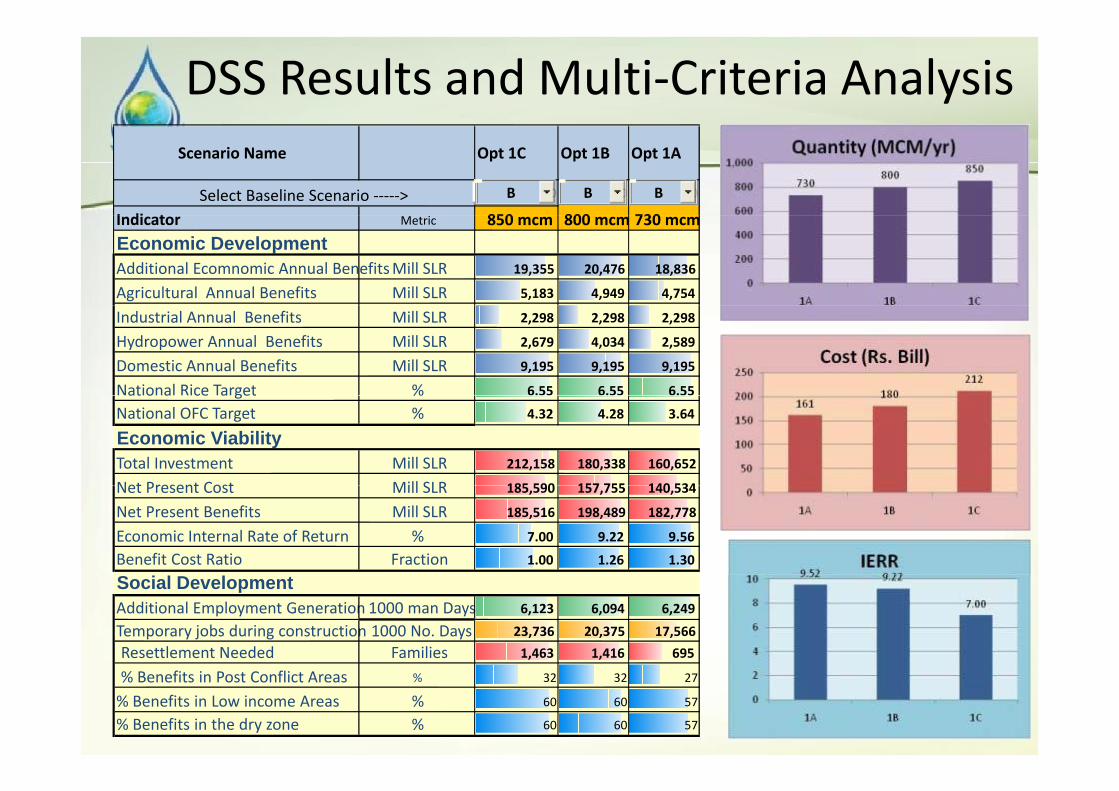
DSS Results and Multi‐Criteria AnalysisScenario Name Opt 1C Opt 1B Opt 1A
0 0 0
I di t i 850 800 730Select Baseline Scenario ‐‐‐‐‐> B B B
Indicator Metric 850 mcm 800 mcm 730 mcmEconomic DevelopmentAdditional Ecomnomic Annual BenefitsMill SLR 19,355 20,476 18,836
Agricultural Annual Benefits Mill SLR 5,183 4,949 4,754
Industrial Annual Benefits Mill SLR 2,298 2,298 2,298
Hydropower Annual Benefits Mill SLR 2,679 4,034 2,589
Domestic Annual Benefits Mill SLR 9,195 9,195 9,195
National Rice Target % 6.55 6.55 6.55at o a ce a get %National OFC Target % 4.32 4.28 3.64
Economic ViabilityTotal Investment Mill SLR 212,158 180,338 160,652
Net Present Cost Mill SLR 185 590 157 755 140 534Net Present Cost Mill SLR 185,590 157,755 140,534
Net Present Benefits Mill SLR 185,516 198,489 182,778
Economic Internal Rate of Return % 7.00 9.22 9.56
Benefit Cost Ratio Fraction 1.00 1.26 1.30
Social DevelopmentAdditional Employment Generation 1000 man Days 6,123 6,094 6,249
Temporary jobs during construction 1000 No. Days 23,736 20,375 17,566Resettlement Needed Families 1,463 1,416 695
% Benefits in Post Conflict Areas % 32 32 27
% Benefits in Low income Areas % 60 60 57
% Benefits in the dry zone % 60 60 57

DSS Results and Multi‐Criteria AnalysisSS Results and Multi Criteria Analysis


Project PrioritizationEconomic Development Unit Value
Additional Ecomnomic Annual Benefit Mill SLR 12,138
Agricultural Annual Benefits Mill SLR 6,164
Industrial Annual Benefits Mill SLR (0)
It is a rational method to prioritize project considering
Industrial Annual Benefits Mill SLR (0)
Hydropower Annual Benefits Mill SLR 374
Domestic Annual Benefits Mill SLR 5,600
National Rice Target % 3.22
National OFC Target % 10 91p p j gbenefits and impacts
Indicators score value range for
National OFC Target % 10.91
Economic ViabilityTotal Investment Mill SLR 133,155
Net Present Cost Mill SLR 116,480 Indicators, score , value range for
scores, weight age for indicators to be decided collectively by
Net Present Benefits Mill SLR 116,360
Economic Internal Rate of Return % 6.99
Benefit Cost Ratio Fraction 1.00
Social Developmentto be decided collectively by decision makers
Exercise could be repeated at set
Additional Employment Generation 1000 man Days 9,465
Temporary jobs during construction 1000 Number Days 18,864 Resettlement Needed Families 976
% Benefits in Post Conflict Areas % 16 Exercise could be repeated at set
interval with updated data and information
% Benefits in Low income Areas % 81.9
% Benefits in the dry zone % 50
Environmental SustainabilityRivers Violating Target, by % of numbe % 77.40information. g g yLength of reaches violating target Km 1566.11
Average Modification in classes ‐ 2.62
Maximum Modification in classes 7

Project Prioritization Cont.jWEIGHTS, SCORE AND RANGES
Score
Weight Item Unit 5 4 3 2 1
6.0 Agricultural Annual Benefits Mill SLR 5,000 2,500 1,000 250 25
4.0 Industrial Annual Benefits Mill SLR 5,000 2,500 1,000 250 25
6.0 Hydropower Annual Benefits Mill SLR 5,000 2,500 1,000 250 25
10.0 Domestic Annual Benefits Mill SLR 5,000 2,500 1,000 250 252.0 National Rice Target % 5 4 3 2 16.0 National OFC Target % 5 4 3 2 16.0 National OFC Target % 5 4 3 2 1
10.0 Total Investment Mill SLR 10,000 25,000 50,000 75,000 100,000
10.0 Economic Internal Rate of Return % 12 9 7 6 5Additional Employment 1000 man
4.0 Generation Days 2,000 1,000 500 100 25
20.0 Resettlement Needed No.Families 25 100 500 1000 2000
6.0 % Benefits in Post Conflict Areas % 80 60 40 20 10
4.0 % Benefits in Low income Areas % 80 60 40 20 104.0 % Benefits in the dry zone % 80 60 40 20 10
8.0Avg Modification Classes_Environment No 2 3 4 5 6
0.0 Government Policy % 100 80 60 20 10
0.0 Other Benefit Mill SLR 5,000 2,500 200 50 10
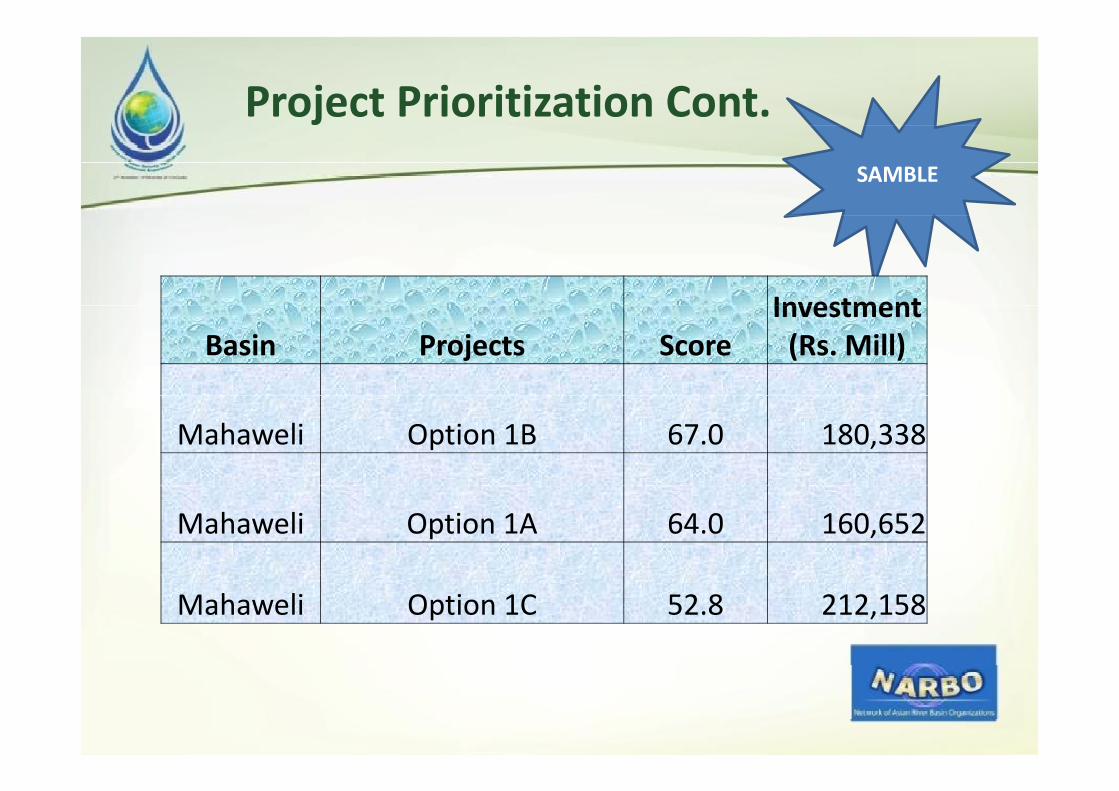
Project Prioritization Cont.SAMBLE
InvestmentBasin Projects Score
Investment (Rs. Mill)
Mahaweli Option 1B 67.0 180,338
Mahaweli Option 1A 64.0 160,652
Mahaweli Option 1C 52.8 212,158

Environmental Flow
“Environmental Flows” implies a range of Environmental Flows implies a range of flows and not just “a minimum flow”
Represent the flows needed to maintain Represent the flows needed to maintain ecosystems in the basin for both present and projected future developmentp j p
Do not seek to restore poor water quality caused by anthropogenic pollution – this y p g pshould be dealt with at source
We have very little “hard” ecological data y gin the basins
Approach by IWMI was adoptedApproach by IWMI was adopted
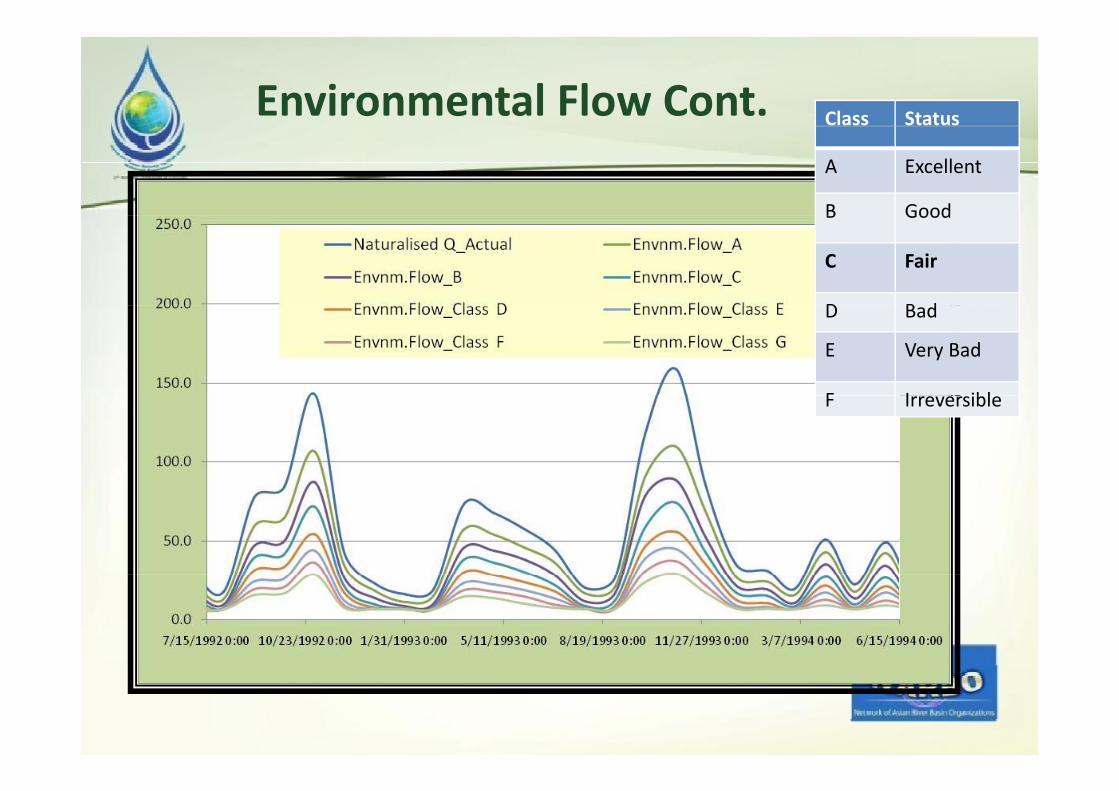
Environmental Flow Cont. Class Status
A Excellent
B GoodB Good
C Fair
D B dD Bad
E Very Bad
F I iblF Irreversible

Impact on Environmental Flowp
• Class C considered – Disturbed habitats but basic ecosystem functions are still intactClass C considered Disturbed habitats but basic ecosystem functions are still intact
• Tested for Option 1B/1C
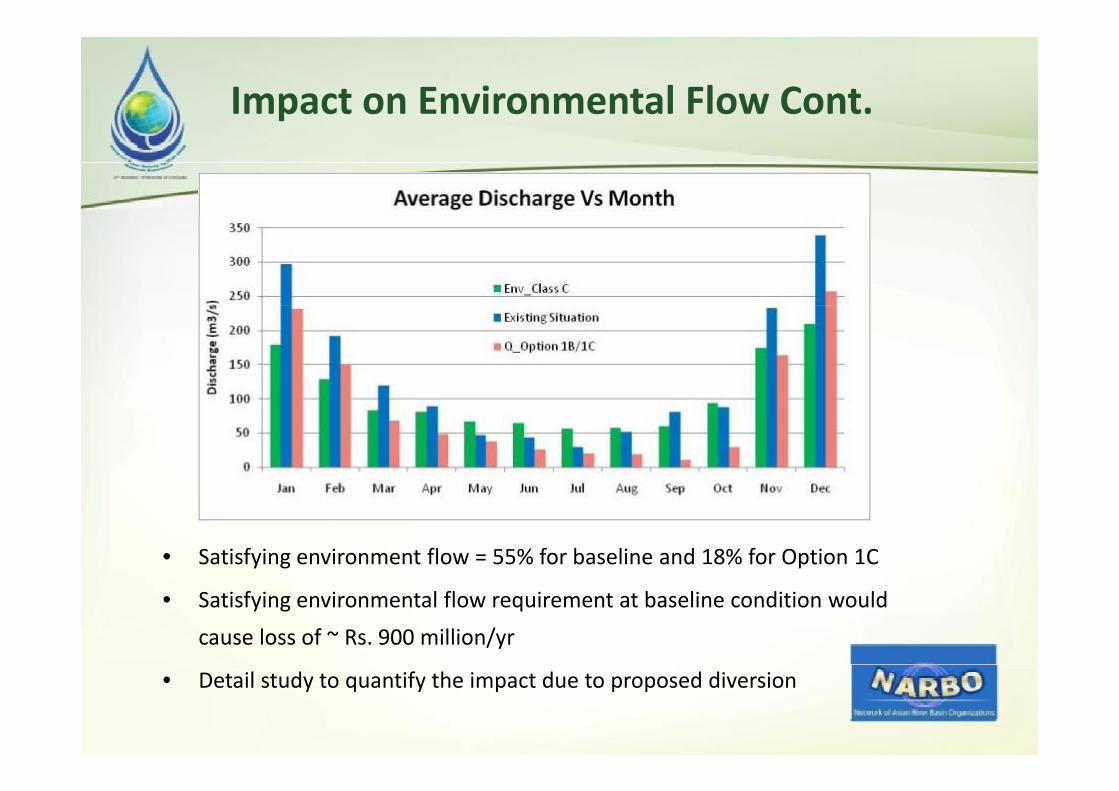
Impact on Environmental Flow Cont.
• Satisfying environment flow = 55% for baseline and 18% for Option 1C
• Satisfying environmental flow requirement at baseline condition would cause loss of ~ Rs. 900 million/yr
• Detail study to quantify the impact due to proposed diversion


Climate Change
• Positive change during Yala and Negative• Positive change during Yala and Negative change in Maha
M h Ch
Item Severe Moderate
Rainfall 17% 9%
• Maha Change
Rainfall 17% 9%
Evaporation 3.5% 3%
Irrg.Requirments 23% 13%g q % %
• Change predicted in 2050s
• Rainfall will increase in Nov and decrease in Jan & Feb. Hence, chanage is towards the late stage of crop growth

Climate Change Cont.Climate Change Cont.
• Irrigation to major, medium and minor schemes are mostly through reservoirs or t ktanks.
• Early planting , use of shorter durtaion dd d di it ill i i thpaddy and crop diversity will minize the
impact
D t il l i M d i A ti• Detail analysis on Mundeni Aru option shows losss of ~0.6% of Net Return due to climate change (~45% of increase into climate change ( 45% of increase in irrigation demand)
• Impact could be quantified for theImpact could be quantified for the selected proposals if it is necessary

ConclusionsConclusions
Updating Water Resources Plan for Mahaweli Basins is highly required at this stage and DSS is a robust tool for itrequired at this stage and DSS is a robust tool for it
DSS could be designed to look into economic, social,
environmental and other benefits or impact due to
existing/proposed projects
Both technical staffs and decision‐makers could use DSS toBoth technical staffs and decision makers could use DSS to
arrive at Optimum Development Plan that would lead to
brighter future for Sri Lankag
