decision analysis part 1 graduate program in business information systems aslı sencer
TRANSCRIPT
Decision AnalysisPart 1
Graduate Program in Business Information Systems
Aslı Sencer
Analytical Decision Making
Can Help Managers to: Gain deeper insight into the nature of
business relationships Find better ways to assess values in such
relationships; and See a way of reducing, or at least
understanding, uncertainty that surrounds business plans and actions
2
Steps to Analytical DM
Define problem and influencing factors Establish decision criteria Select decision-making tool (model) Identify and evaluate alternatives using
decision-making tool (model) Select best alternative Implement decision Evaluate the outcome
3
Models
Are less expensive and disruptive than experimenting with the real world system
Allow operations managers to ask “What if” types of questions
Are built for management problems and encourage management input
Force a consistent and systematic approach to the analysis of problems
Require managers to be specific about constraints and goals relating to a problem
Help reduce the time needed in decision making
4
Limitations of the Models
They may be expensive and time-consuming to develop and test
Often misused and misunderstood (and feared) because of their mathematical and logical complexity
Tend to downplay the role and value of nonquantifiable information
Often have assumptions that oversimplify the variables of the real world
5
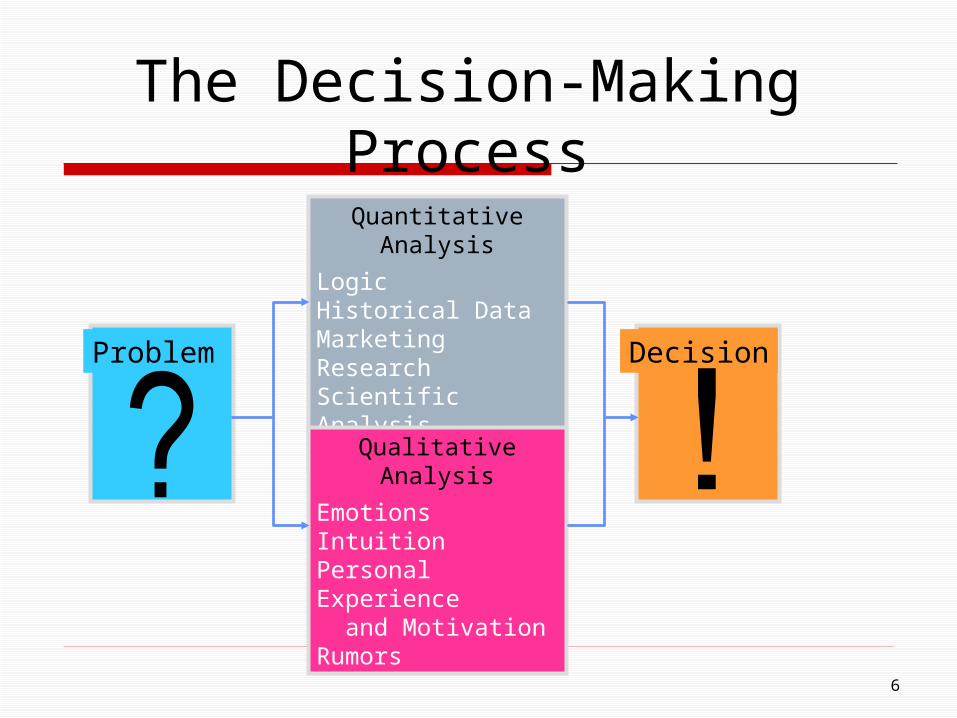
The Decision-Making Process
Problem Decision
Quantitative Analysis
LogicHistorical DataMarketing ResearchScientific AnalysisModeling
Qualitative Analysis
EmotionsIntuitionPersonal Experience and MotivationRumors
6
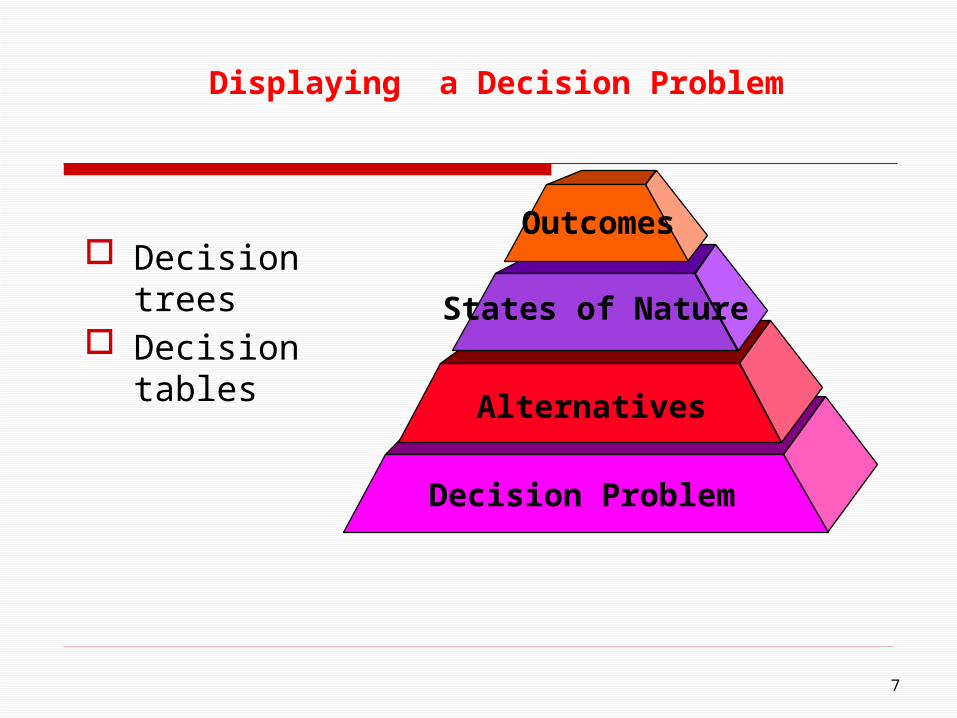
Decision trees Decision
tables
Decision Problem
Alternatives
States of Nature
Outcomes
Displaying a Decision Problem
7
Types of Decision Models
Decision making under uncertainty Decision making under risk Decision making under certainty
8
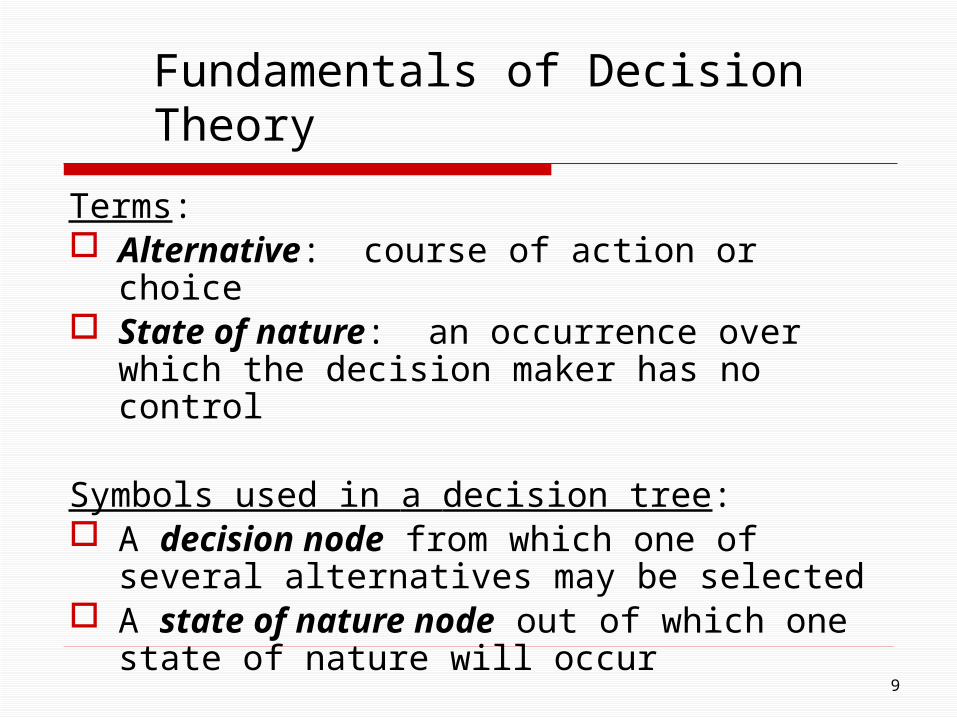
Fundamentals of Decision Theory
Terms: Alternative: course of action or choice State of nature: an occurrence over
which the decision maker has no control
Symbols used in a decision tree: A decision node from which one of several
alternatives may be selected A state of nature node out of which one
state of nature will occur
9

Decision Table
States of Nature
Alternatives State 1 State 2
Alternative 1 Outcome 1 Outcome 2
Alternative 2 Outcome 3 Outcome 4
10
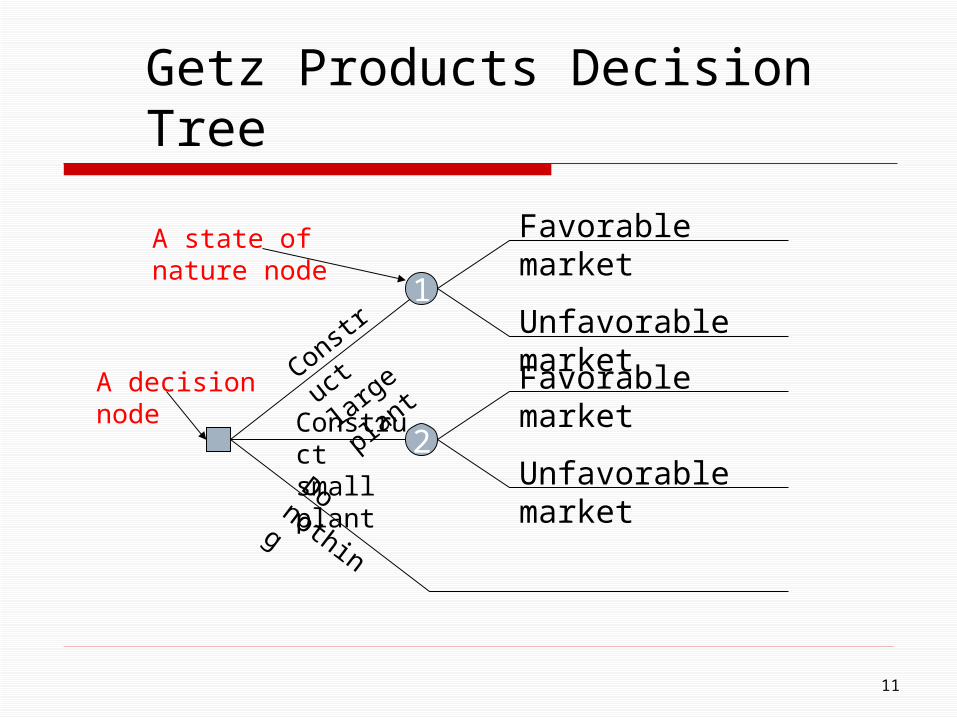
Getz Products Decision Tree
1
2Unfavorable market
Unfavorable market
Favorable market
Favorable market
Construct small plant
Construct
large plant
Do nothing
A decision node
A state of nature node
11
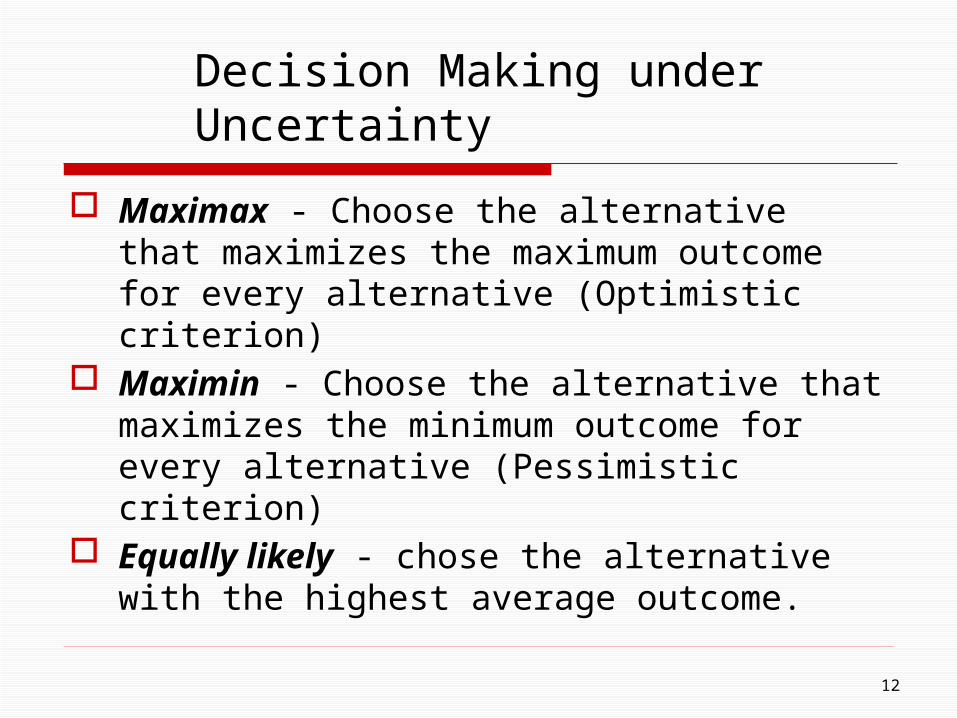
Decision Making under Uncertainty
Maximax - Choose the alternative that maximizes the maximum outcome for every alternative (Optimistic criterion)
Maximin - Choose the alternative that maximizes the minimum outcome for every alternative (Pessimistic criterion)
Equally likely - chose the alternative with the highest average outcome.
12
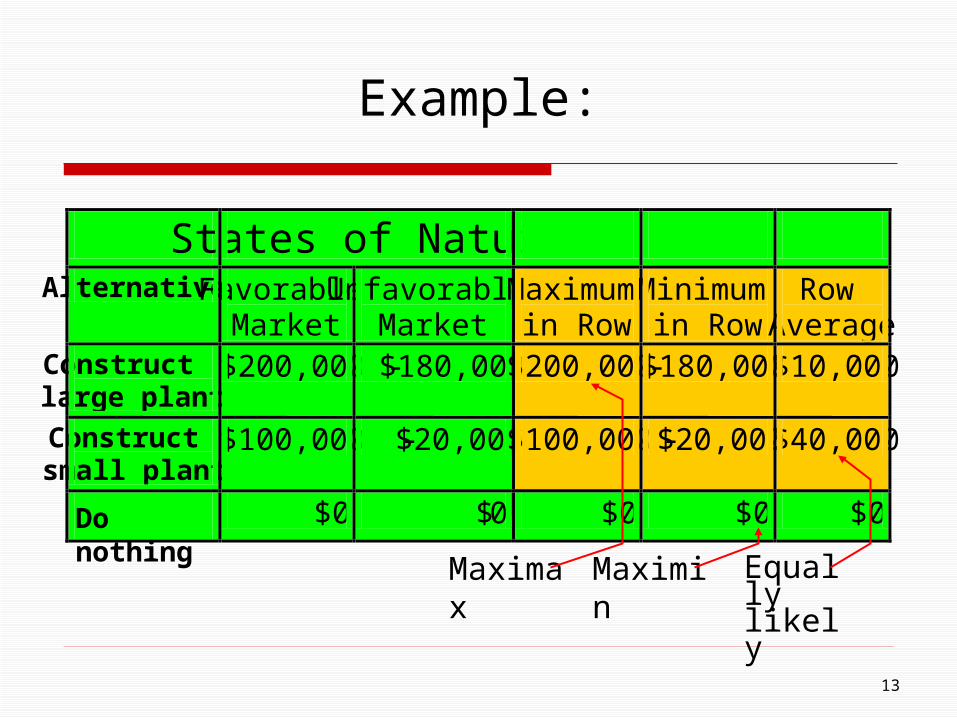
Example:
States of Nature Alternatives Favorable
Market Unfavorable
Market Maximum
in Row Minimum in Row
Row Average
Construct large plant
$200,000 -$180,000 $200,000 -$180,000 $10,000
Construct small plant
$100,000 -$20,000 $100,000 -$20,000 $40,000
$0 $0 $0 $0 $0 Maximax Maximin Equally
likely
Do nothing
13
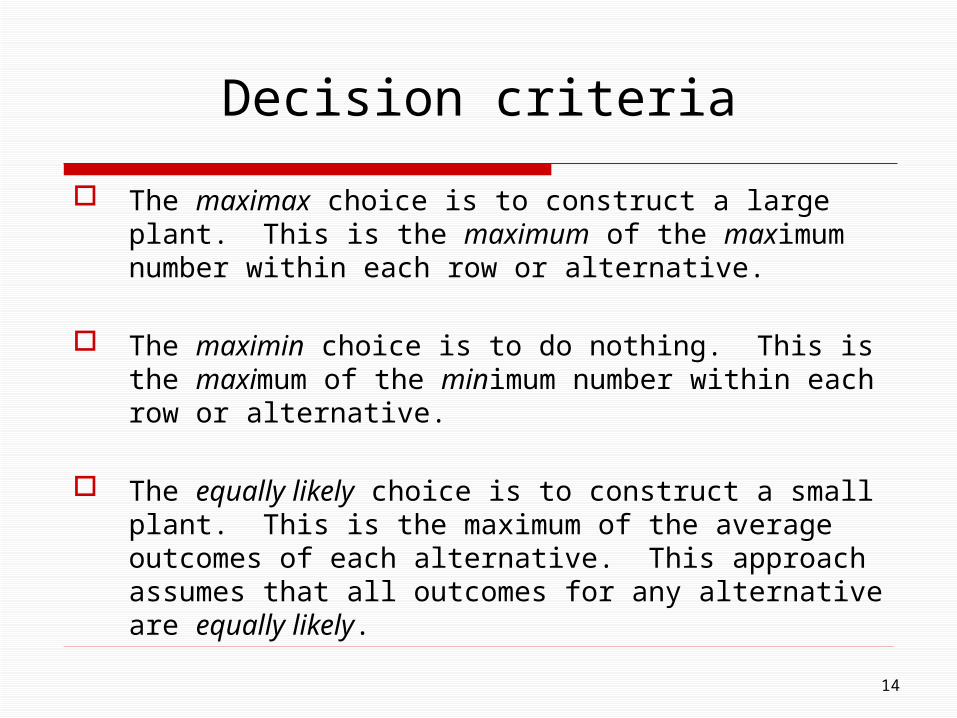
Decision criteria
The maximax choice is to construct a large plant. This is the maximum of the maximum number within each row or alternative.
The maximin choice is to do nothing. This is the maximum of the minimum number within each row or alternative.
The equally likely choice is to construct a small plant. This is the maximum of the average outcomes of each alternative. This approach assumes that all outcomes for any alternative are equally likely.
14
Decision Making under Risk
Probabilistic decision situation States of nature have probabilities of
occurrence
Maximum Likelihood Criterion Maximize Expected Monitary Value
(Bayes Decision Rule)
15
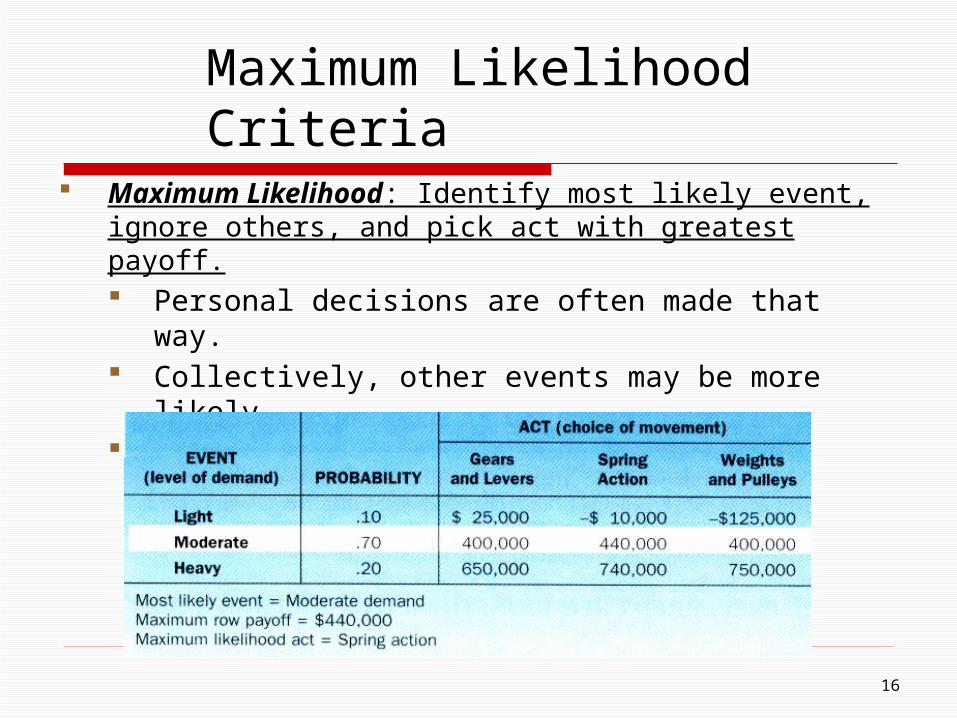
Maximum Likelihood Criteria
Maximum Likelihood: Identify most likely event, ignore others, and pick act with greatest payoff. Personal decisions are often made that way. Collectively, other events may be more likely. Ignores lots of information.
16
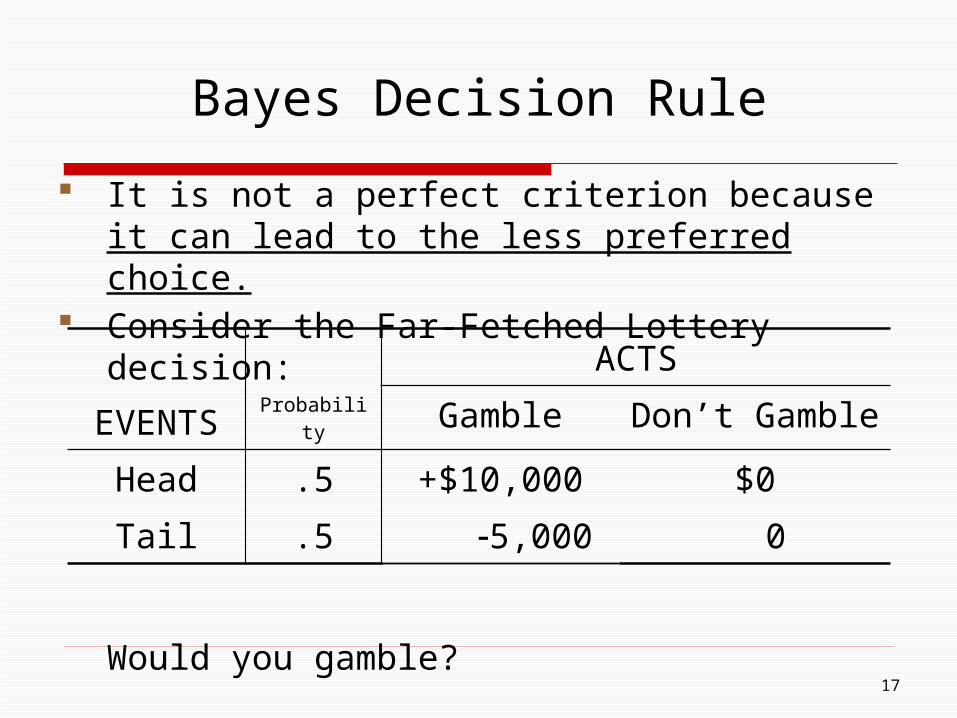
Bayes Decision Rule
It is not a perfect criterion because it can lead to the less preferred choice.
Consider the Far-Fetched Lottery decision:
Would you gamble?
EVENTS Probability
ACTS
Gamble Don’t Gamble
Head .5 +$10,000 $0
Tail .5 -5,000 0
17

The Far-Fetched Lottery Decision
Most people prefer not to gamble! That violates the Bayes decision rule. But the rule often indicates preferred choices even
though it is not perfect.
EVENTSProba-bility
ACTS
Gamble Don’t Gamble
Payoff × Prob. Payoff × Prob
Head .5 +$5,000 $0
Tail .5 -2,500 0
Expected Payoff: $2,500 $0
18
N
j jiji PXAEMV1
)(
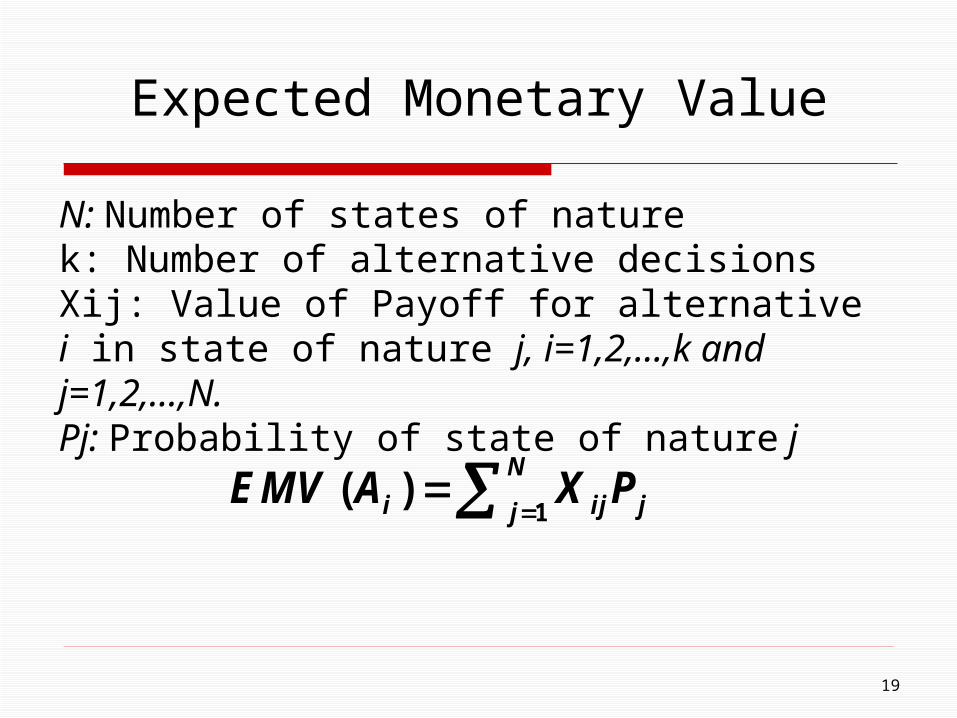
Expected Monetary Value
N: Number of states of naturek: Number of alternative decisionsXij: Value of Payoff for alternative i in state of nature j, i=1,2,...,k and j=1,2,...,N.Pj: Probability of state of nature j
19
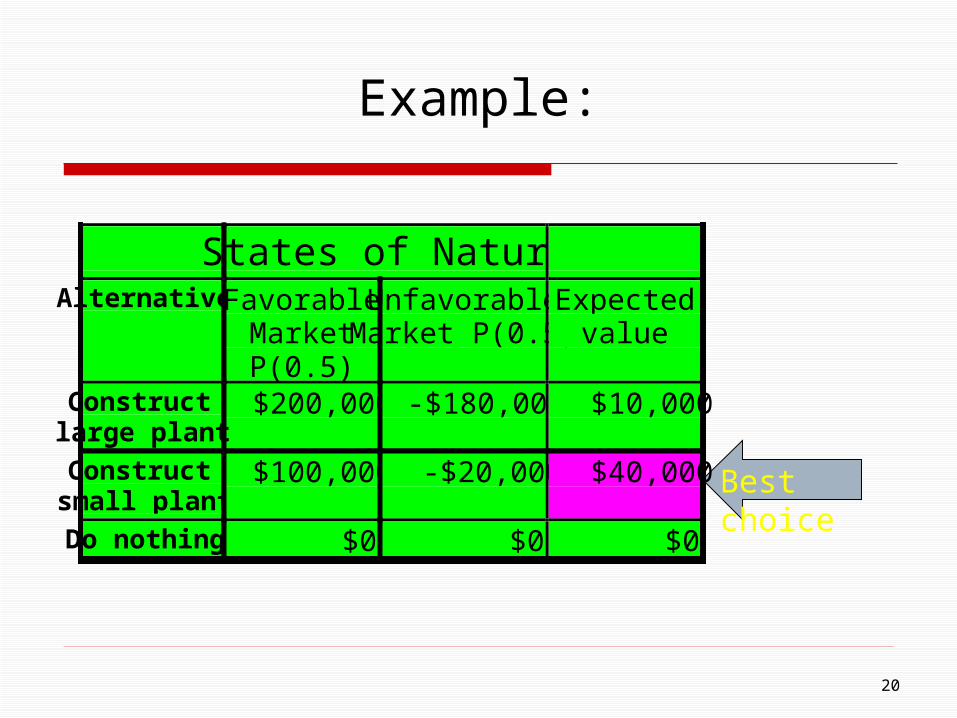
Example:
States of NatureAlternatives Favorable
MarketP(0.5)
UnfavorableMarket P(0.5)
Expectedvalue
Construct $200,000 -$180,000 $10,000
Constructsmall plant
$100,000 -$20,000 $40,000
Do nothing $0 $0 $0
Best choice
large plant
20
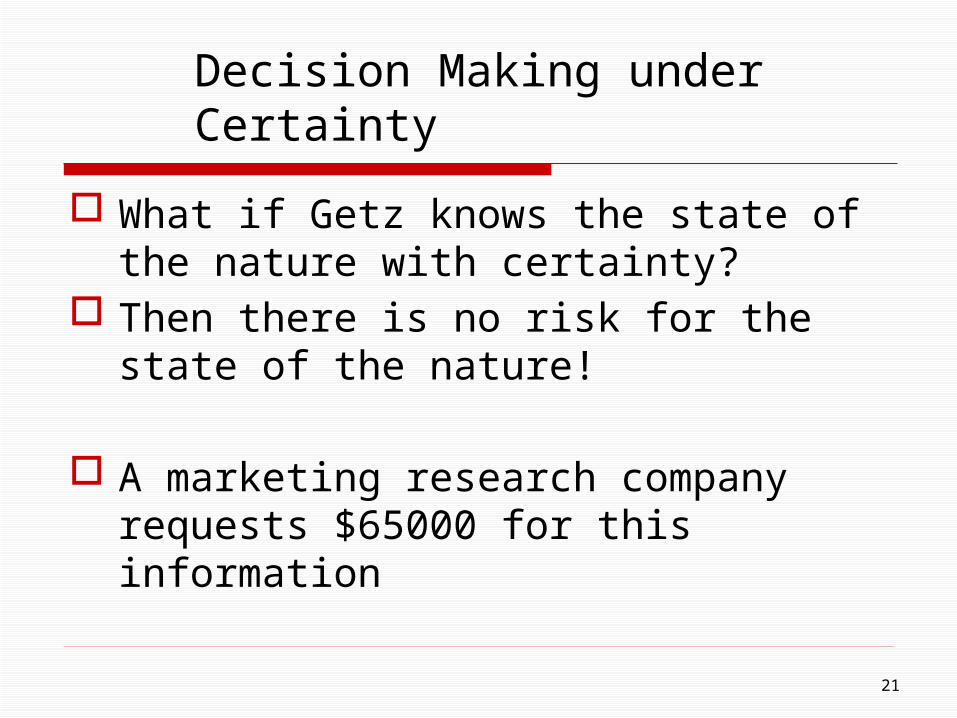
Decision Making under Certainty
What if Getz knows the state of the nature with certainty?
Then there is no risk for the state of the nature!
A marketing research company requests $65000 for this information
21
Questions:
Should Getz hire the firm to make this study?
How much does this information worth?
What is the value of perfect information?
22
Expected Value With Perfect Information (EVPI)
jP.}){
N
1jiji X(Max
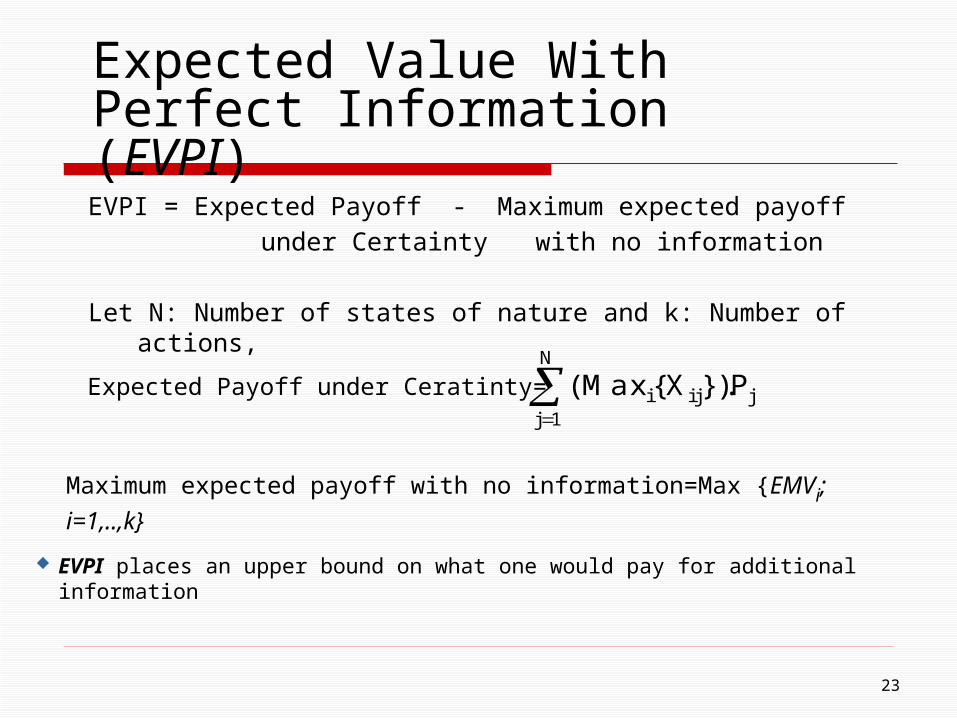
EVPI = Expected Payoff - Maximum expected payoff under Certainty with no information
Let N: Number of states of nature and k: Number of actions,
EVPI places an upper bound on what one would pay for additional information
Maximum expected payoff with no information=Max {EMVi; i=1,..,k}
23
Expected Payoff under Ceratinty=

Example: Expected Value of Perfect Information
State of NatureAlternative
Probabilities
Construct alarge plantConstruct a small plant
Do nothing
200,000 -$180,000
$0
Favorable Market ($)
Unfavorable Market ($)
0.50 0.50
EMV
$40,000$100,000 -$20,000
$0 $0
$10,000
24
Expected Value of Perfect Information
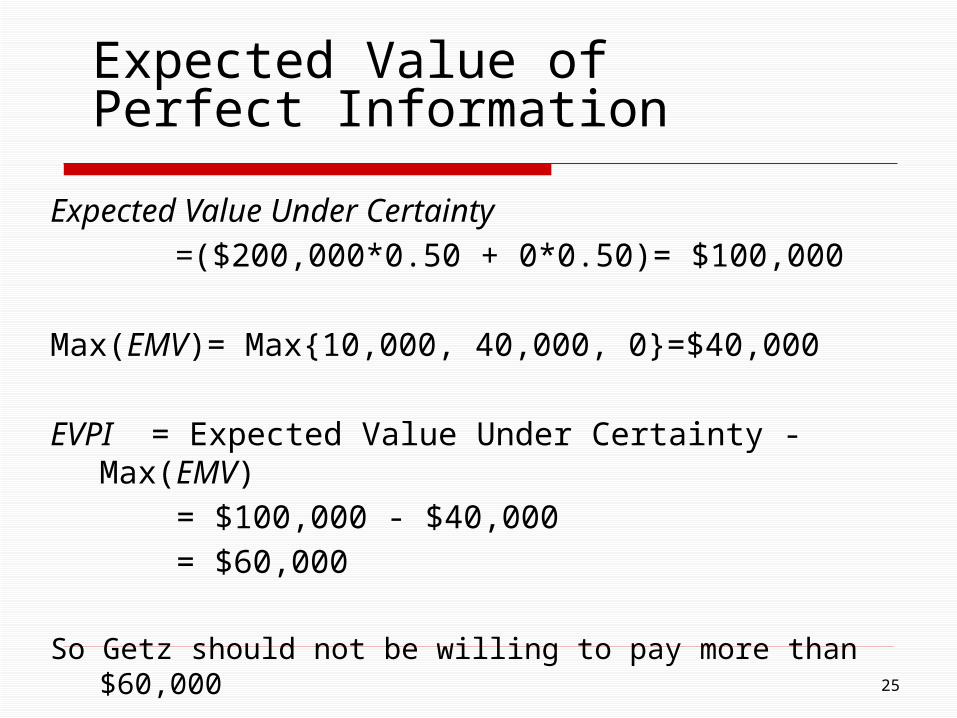
Expected Value Under Certainty =($200,000*0.50 + 0*0.50)= $100,000
Max(EMV)= Max{10,000, 40,000, 0}=$40,000
EVPI = Expected Value Under Certainty - Max(EMV) = $100,000 - $40,000 = $60,000
So Getz should not be willing to pay more than $60,000
25

Ex: Toy Manufacturer
How to choose among 4 types of tippi-toes?
Demand for tippi-toes is uncertain:Light demand: 25,000 units (10%)Moderate demand: 100,000 units (70%)Heavy demand: 150,000 units (20%)
26
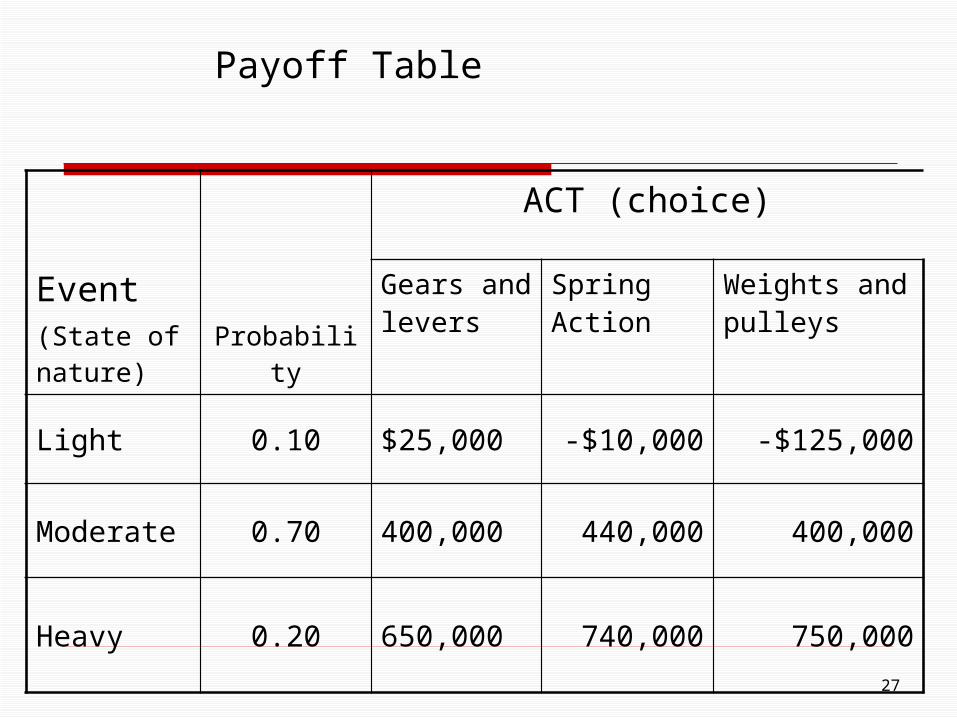
Event(State of nature) Probability
ACT (choice)
Gears and levers
Spring Action
Weights and pulleys
Light 0.10 $25,000 -$10,000 -$125,000
Moderate 0.70 400,000 440,000 400,000
Heavy 0.20 650,000 740,000 750,000
Payoff Table
27
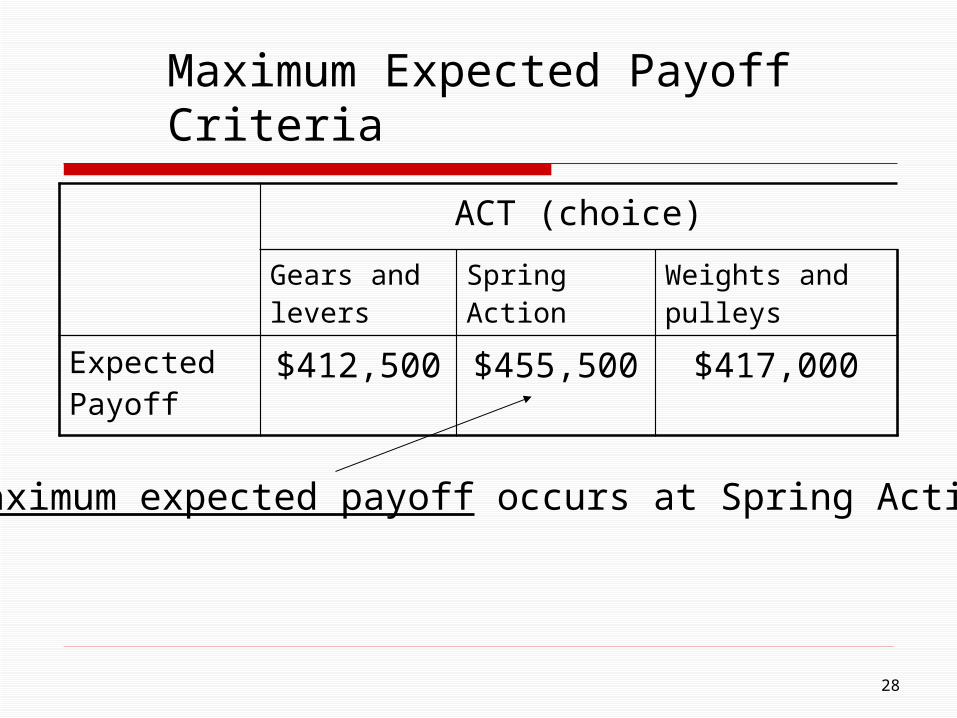
Maximum Expected Payoff Criteria
ACT (choice)
Gears and levers
Spring Action
Weights and pulleys
Expected Payoff
$412,500 $455,500 $417,000
Maximum expected payoff occurs at Spring Action!
28
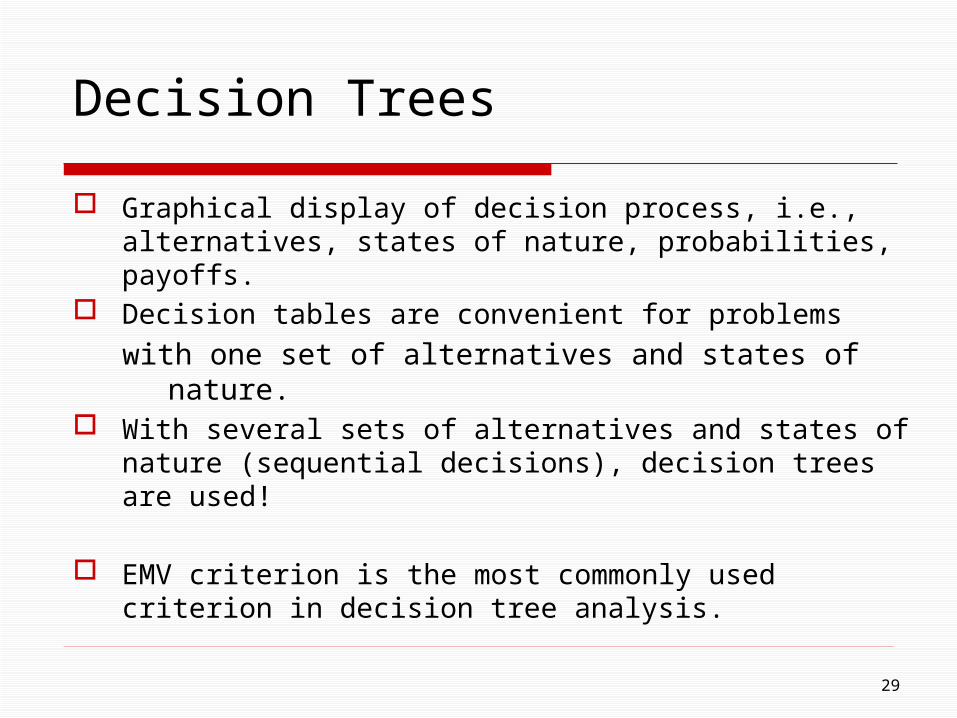
Graphical display of decision process, i.e., alternatives, states of nature, probabilities, payoffs.
Decision tables are convenient for problems
with one set of alternatives and states of nature. With several sets of alternatives and states of nature
(sequential decisions), decision trees are used!
EMV criterion is the most commonly used criterion in decision tree analysis.
Decision Trees
29
Softwares for Decision Tree Analysis
DPL Tree Plan Supertree
Analysis with less effort.Full color presentations for managers
30
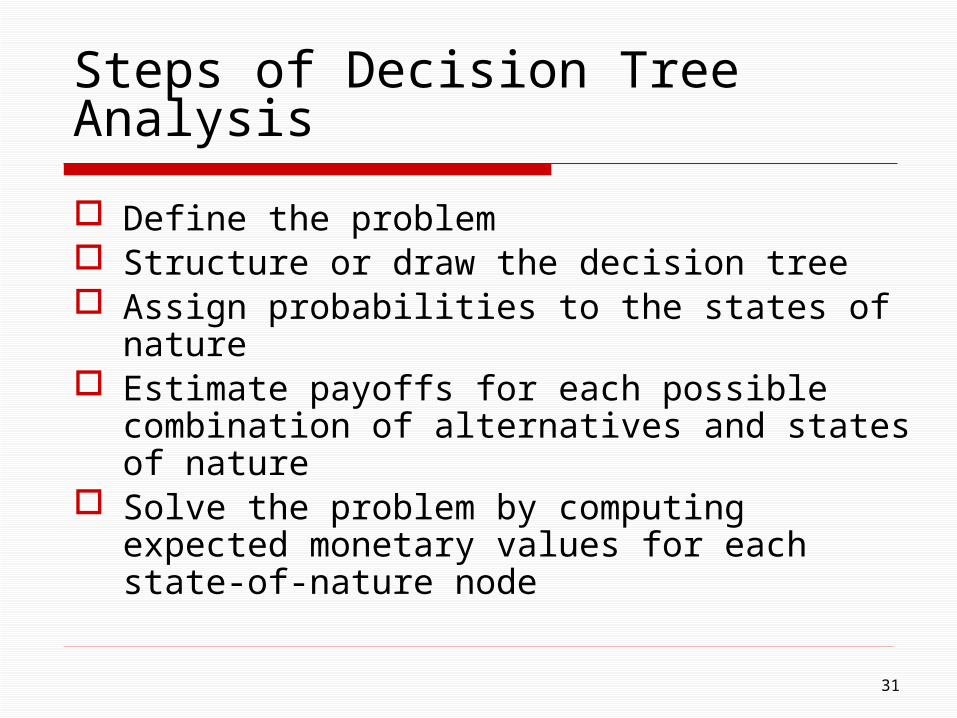
Steps of Decision Tree Analysis
Define the problem Structure or draw the decision tree Assign probabilities to the states of nature Estimate payoffs for each possible
combination of alternatives and states of nature
Solve the problem by computing expected monetary values for each state-of-nature node
31
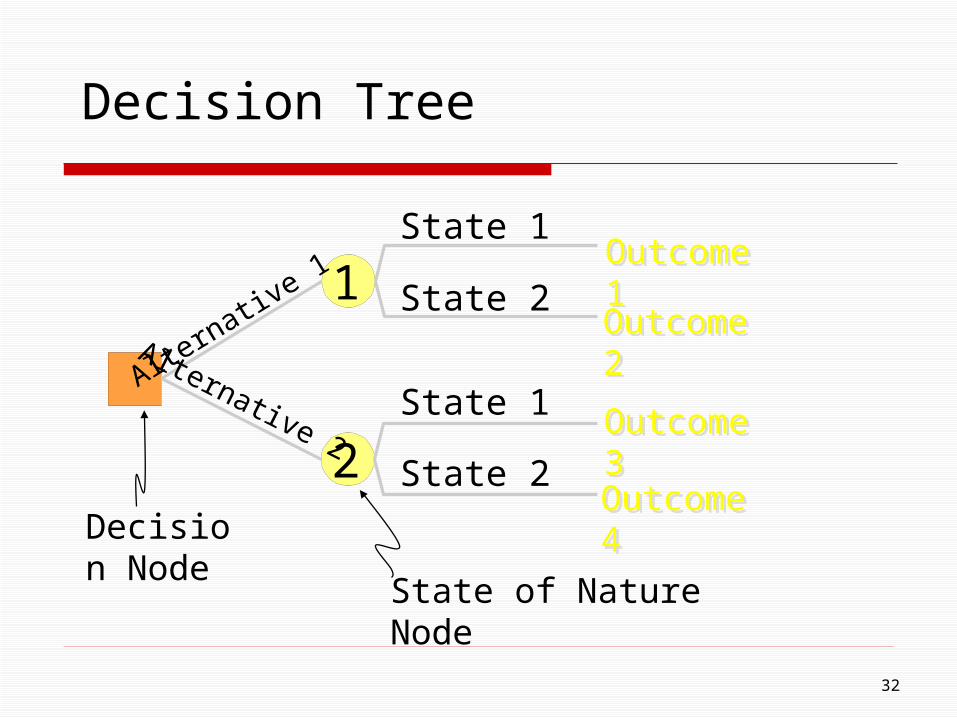
Decision Tree
1
2
State 1
State 2
State 1
State 2
Alternative 1
Alternative 2
Decision Node
Outcome 1Outcome 1
Outcome 2Outcome 2
Outcome 3Outcome 3
Outcome 4Outcome 4
State of Nature Node
32
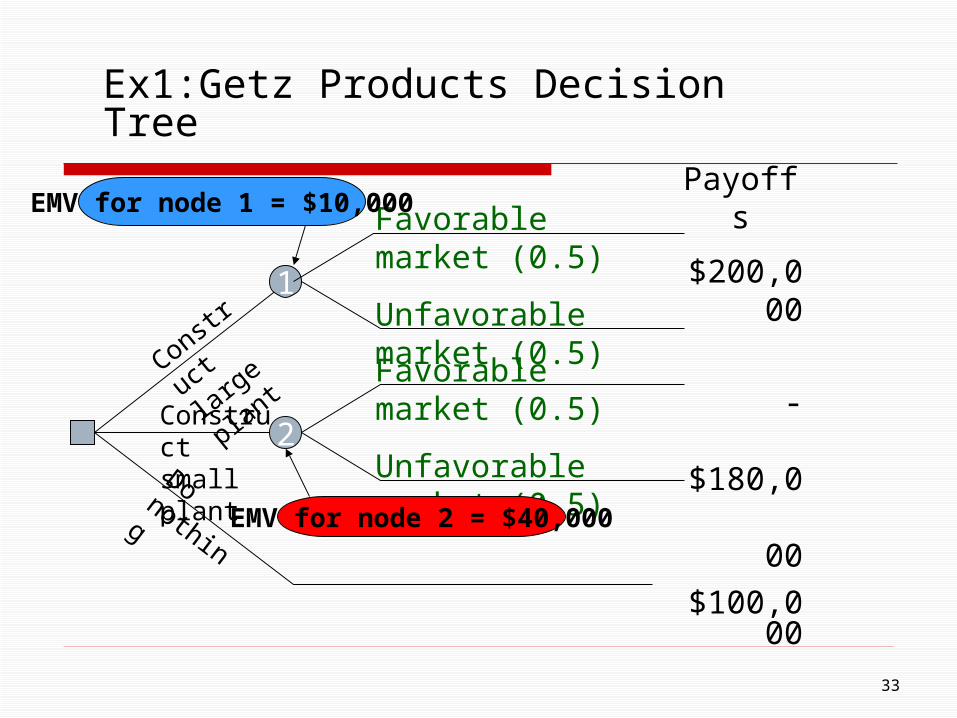
Ex1:Getz Products Decision Tree
Payoffs
$200,000
-$180,000$100,000
-20,000
0
1
2Unfavorable market (0.5)
Unfavorable market (0.5)
Favorable market (0.5)
Favorable market (0.5)
Construct small plant
Construct
large plant
Do nothing EMV for node 2 = $40,000
EMV for node 1 = $10,000
33
A More Complex Decision Tree
Let’s say Getz Products has two sequential decisions to make:
Conduct a survey for $10000? Build a large or small plant or not
build?
34
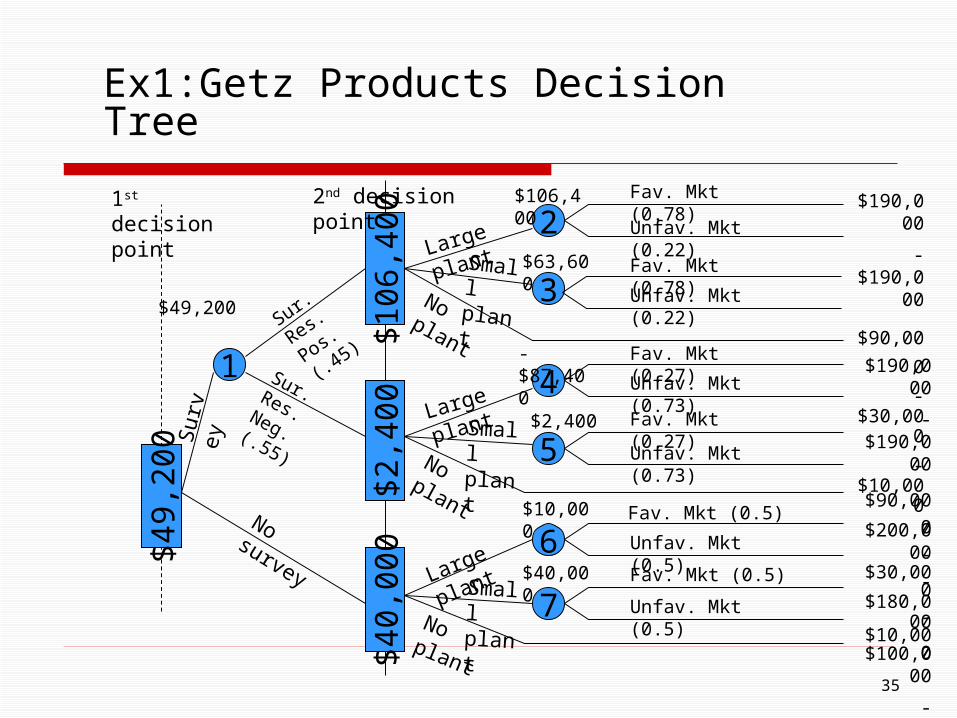
Ex1:Getz Products Decision Tree
1 4
7
$49,
200
$106
,400
$40,
000
$2,4
00
2
3
5
6
$190,000
-$190,000
$90,000
-$30,000
-$10,000
$190,000
-$190,000
$90,000-$30,000-$10,000
$200,000
-$180,000
$100,000
-$20,000$0
Surv
ey
No survey
Large plant
Small plantNo plant
Large plant
Small plantNo plant
Large plant
Small plantNo plant
Fav. Mkt (0.78)
Fav. Mkt (0.78)
Fav. Mkt (0.27)
Fav. Mkt (0.27)
Fav. Mkt (0.5)
Fav. Mkt (0.5)
Unfav. Mkt (0.22)
Unfav. Mkt (0.22)
Unfav. Mkt (0.73)
Unfav. Mkt (0.73)
Unfav. Mkt (0.5)
Unfav. Mkt (0.5)
$106,400
$63,600
-$87,400
$2,400
$10,000
$40,000
Sur. Res. Neg. (.55)
Sur. Res.
Pos. (.45)
1st decision point
2nd decision point
$49,200
35
Resulting Decision
EMV of conducting the survey=$49,200 EMV of not conducting the survey=$40,000So Getz should conduct the survey!
If the survey results are favourable, build large plant.If the survey results are infavourable, build small plant.
36
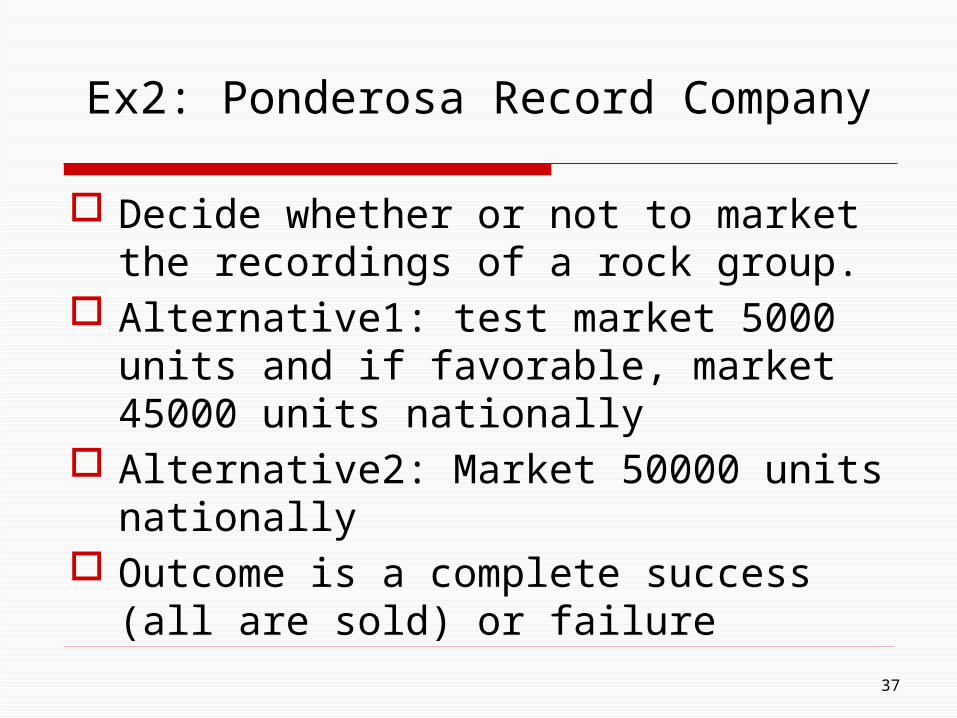
Ex2: Ponderosa Record Company
Decide whether or not to market the recordings of a rock group.
Alternative1: test market 5000 units and if favorable, market 45000 units nationally
Alternative2: Market 50000 units nationally
Outcome is a complete success (all are sold) or failure
37
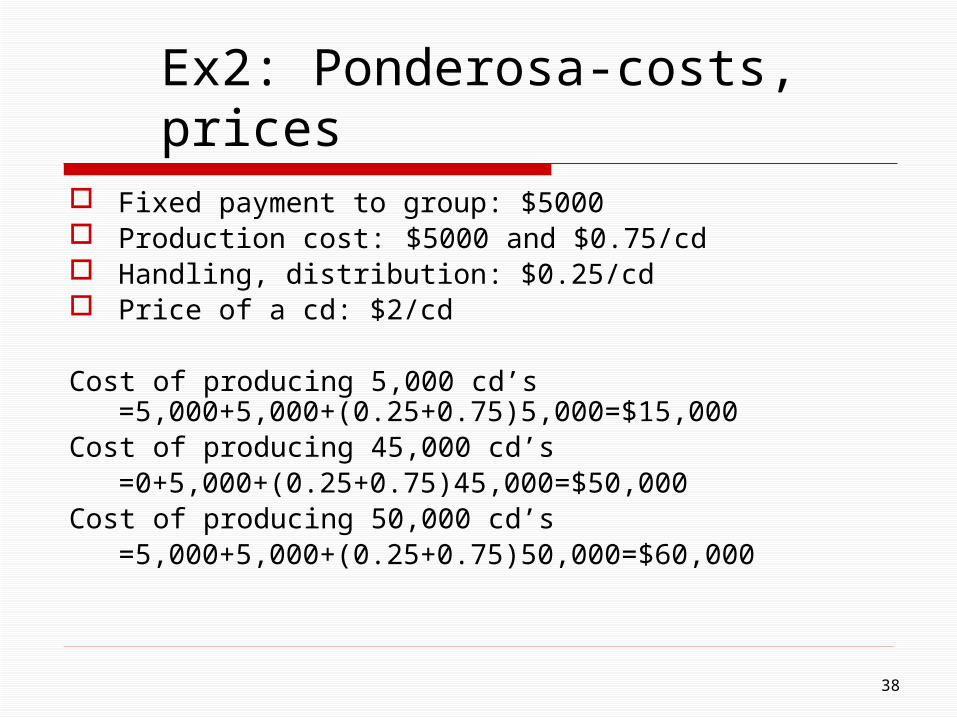
Ex2: Ponderosa-costs, prices
Fixed payment to group: $5000 Production cost: $5000 and $0.75/cd Handling, distribution: $0.25/cd Price of a cd: $2/cd
Cost of producing 5,000 cd’s =5,000+5,000+(0.25+0.75)5,000=$15,000
Cost of producing 45,000 cd’s=0+5,000+(0.25+0.75)45,000=$50,000
Cost of producing 50,000 cd’s=5,000+5,000+(0.25+0.75)50,000=$60,000
38
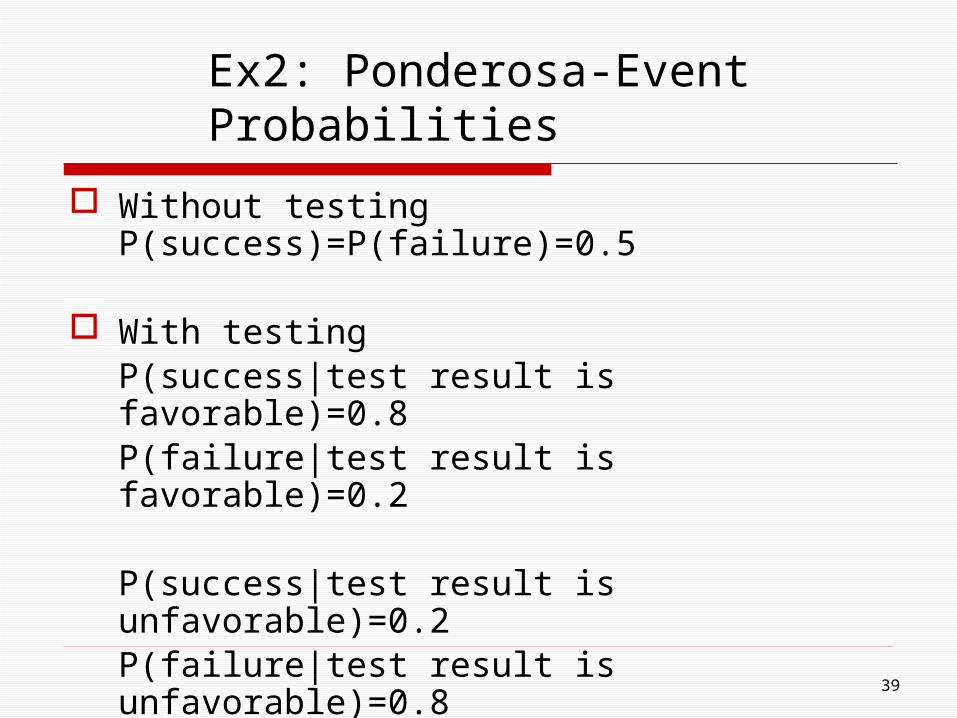
Ex2: Ponderosa-Event Probabilities
Without testing P(success)=P(failure)=0.5
With testingP(success|test result is favorable)=0.8P(failure|test result is favorable)=0.2
P(success|test result is unfavorable)=0.2P(failure|test result is unfavorable)=0.8
39
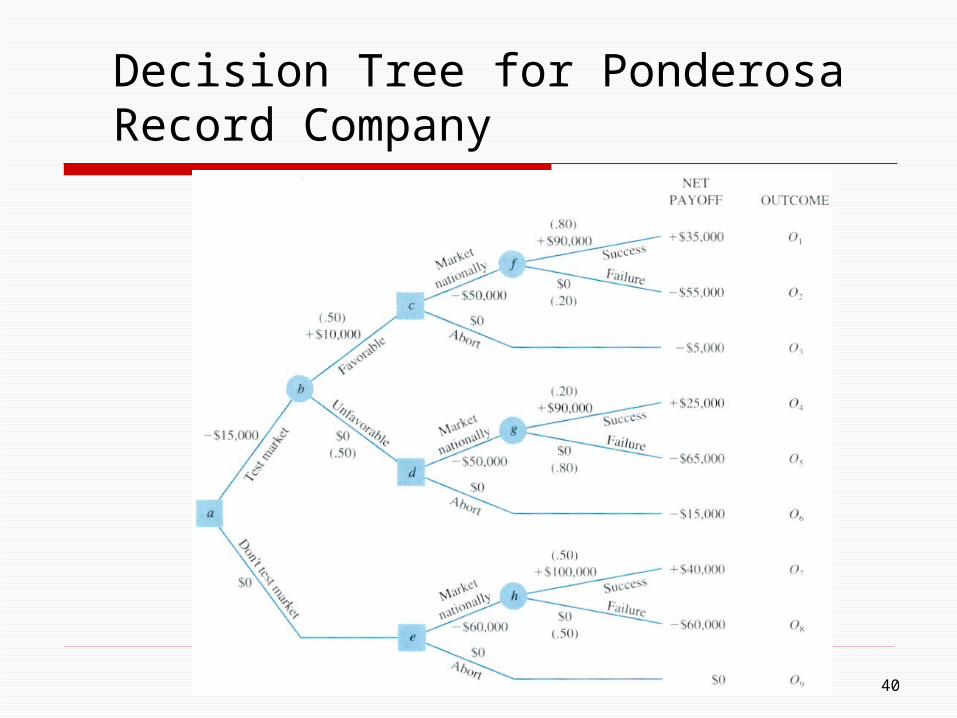
Decision Tree for Ponderosa Record Company
40

Backward Approach
41
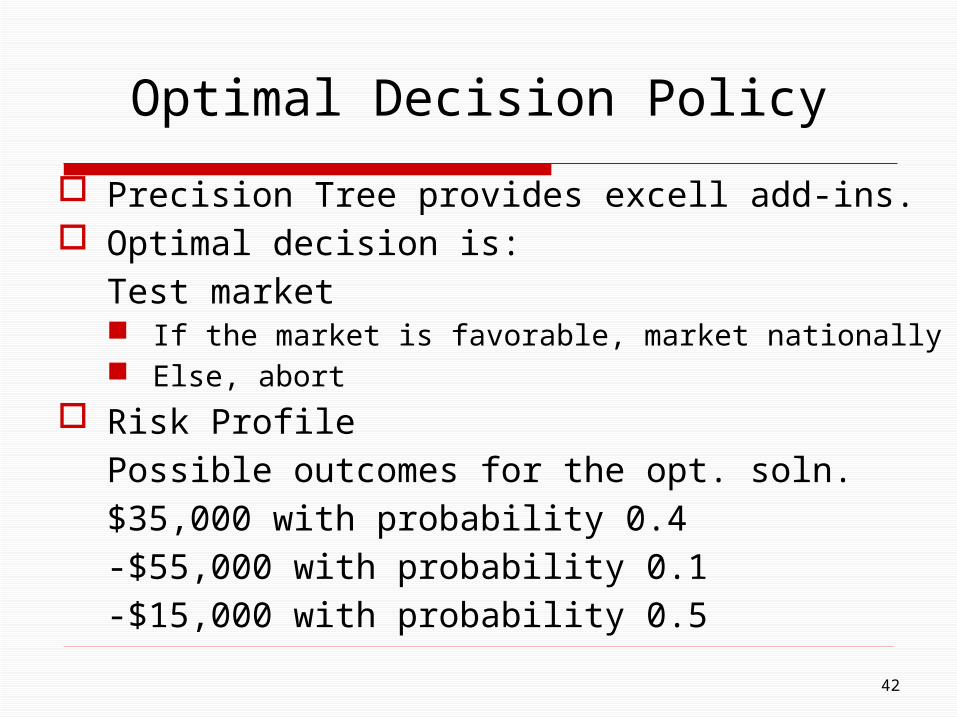
Optimal Decision Policy
Precision Tree provides excell add-ins. Optimal decision is:
Test market If the market is favorable, market nationally Else, abort
Risk Profile Possible outcomes for the opt. soln.$35,000 with probability 0.4-$55,000 with probability 0.1-$15,000 with probability 0.5
42
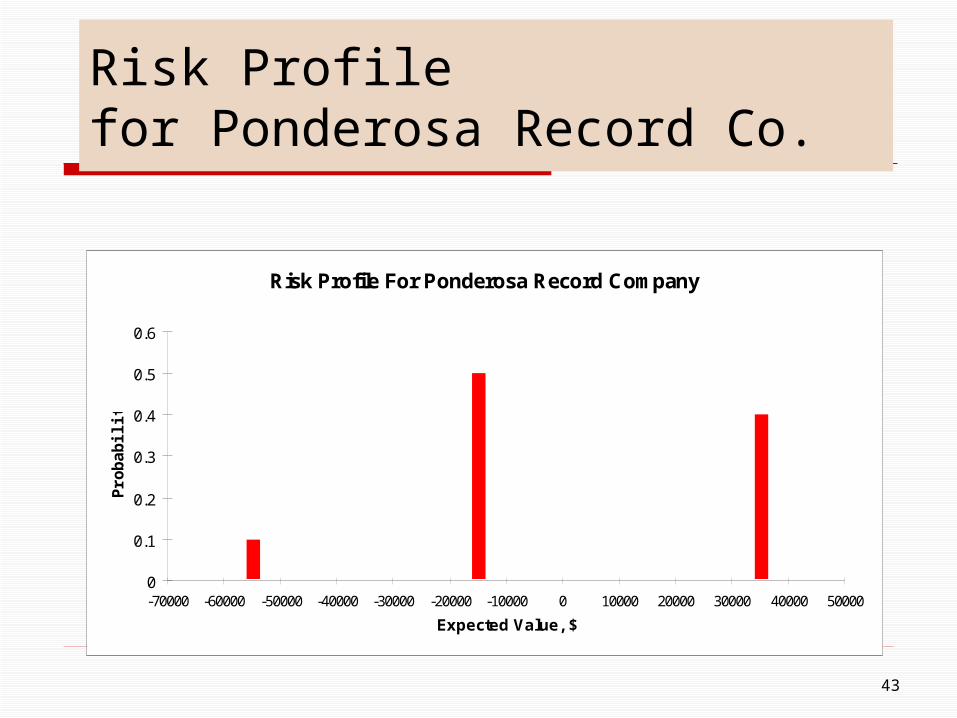
Risk Profilefor Ponderosa Record Co.
Risk Profile For Ponderosa Record Company
0
0.1
0.2
0.3
0.4
0.5
0.6
-70000 -60000 -50000 -40000 -30000 -20000 -10000 0 10000 20000 30000 40000 50000
Expected Value, $
Pro
ba
bil
ity
43
Sensitivity Analysis
The optimal solution depends on many factors. Is the optimal policy robust?
Question:-How does $1000 payoff change with respect
to a change in success probability (0.8 currently)? earnings of success ($90,000 currently)? test marketing cost ($15,000 currently)?
44

Application Areas of Decision Theory
Investments in research and developmentplant and equipmentnew buildings and structures
Production and Inventory controlAggregate PlanningMaintenanceScheduling, etc.
45
References
Lapin L.L., Whisler W.D., Quantitative Decision Making, 7e, 2002.
Heizer J., Render, B., Operations Management, 7e, 2004.
Render, B., Stair R. M., Quantitative Analysis for Management, 8e, 2003.
Anderson, D.R., Sweeney D.J, Williams T.A., Statistics for Business and Economics, 8e, 2002.
Taha, H., Operations Research, 1997.
46