decision-making in eaps - bernie mccann
DESCRIPTION
TRANSCRIPT

Bernie McCann, PhD, CEAPEAPA Annual World Conference
Session # 1020-1b-390
Baltimore, MD, USA
October 20, 2012
Decision-making in EAPs:
Purchaser & Client Perspectives

Presentation Materials
1 page summary available in today’s session
PowerPoint slide show is available online: www.linkedin.com/in/berniemccannphd or
www.eapassn.org/onDemand Both summary & slide show are available by email;
please provide business card or email request to [email protected]

Study Rationale EAPs have become an important component of contemporary
behavioral healthcare for millions of working Americans and their families (>200 million per Oss, 2011).
Although current treatments for substance use disorders and depression are considered highly successful, uptake rates are low. Reasons include ineffective diagnosis, stigma, and suboptimal behavioral health benefit coverage (SAMHSA, 2011).
This study sought to better understand how various factors may impact EAPs as a gateway to behavioral health treatment.

Theory Organizational studies provides the overall theoretical
basis for the study of work organizations, which can then be investigated by their actions, processes, and by the behavior of their members.
Additionally, theoretical frameworks of Institutionalism, Resource Dependency and Organizational Ecology were utilized to provide insights about employers’ and enrollees’ demand for EAP features and services.

Defining Study TermsDemand: In economic terms, a desire to possess goods or services
EA Purchaser: Parent work organization which contracts for EAPs
Enrollees: Workers & dependents eligible for EAP services
Session allowance: Number of EAP sessions offered to enrollees
Workplace activities: On site orientations, presentations, trainings, etc.
Significant: Statistically ‘accurate’ findings (i.e., p ≥ 0.05)
Association: When found between factors, does not prove causation.
Alcohol Use Disorders: Alcohol abuse or dependence in past year
Major Depressive Episode: Episode of major depression in past year

Research Questions1. What factors may influence employers’ demand
for various service features in an EAP contract?
2. Do these same factors influence employers’ demand for EAP worksite activities?
3. Do these same factors influence enrollees’ demand for EAP counseling services?
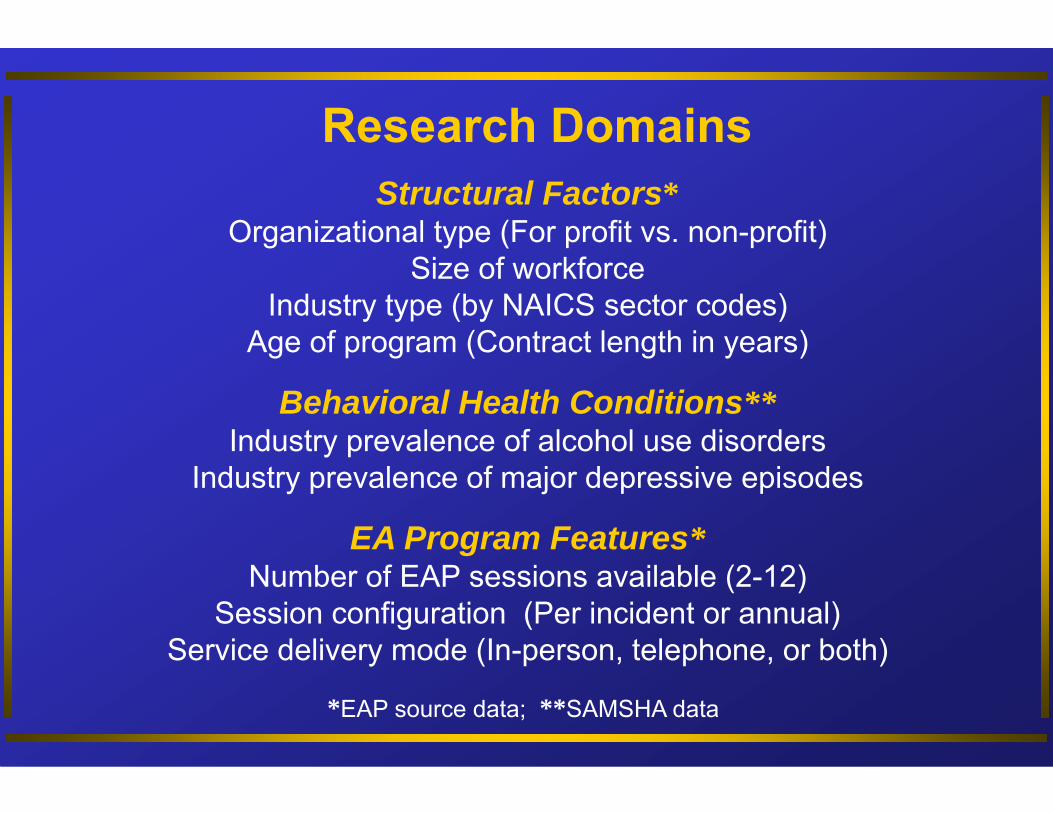
Research DomainsStructural Factors*
Organizational type (For profit vs. non-profit)Size of workforce
Industry type (by NAICS sector codes)Age of program (Contract length in years)
Behavioral Health Conditions**Industry prevalence of alcohol use disorders
Industry prevalence of major depressive episodes
EA Program Features*Number of EAP sessions available (2-12)
Session configuration (Per incident or annual)Service delivery mode (In-person, telephone, or both)
*EAP source data; **SAMSHA data

Demand for Worksite Activities
Factors in Demand for EAP Services
Employer EAP Purchasing Decisions
Structural & Environmental
Factors
Prevalence of Behavioral Health
Conditions
Enrollee Demand for EAP services

Study Sample - 490 employer purchasers from a major US EAP/managed behavioral health provider in 12 mo. period
Agriculture, Forestry, Fishing & Hunting 0.4%Mining 1.8%Utilities 1.0%Construction 1.6%Manufacturing 16.1%Wholesale Trade 2.0%Retail Trade 3.9%Transportation & Warehousing 2.2%Information 6.5%Finance & Insurance 8.0%Real Estate, Rental & Leasing 1.6%Professional, Scientific & Technical Services 12.7%Mgmt of Comp & Entr; Admin & Supp, Waste Mgmt & Remed Svcs 1.6%Educational Services 3.7%Health Care & Social Assistance 9.4%Arts, Entertainment & Recreation 0.6%Accommodations & Food Services 2.7%Other Services 1.8%Public Administration 22.2%

Study Sample – 490 EmployersEmployer Type
Non-profit For profit
Workforce Size
1 to 99 100 to 499 500 to 999 1000 +
64.3%35.7%
11%
23.7%
37.1%
28.2%

Study Sample – 490 EmployersSession Allowance
2-3 sessions 4-5 sessions6-8 sessions 10-12 sessions
2.2%
42.4%
19.5%35.9%
Age of Contract
1-3 years 4-6 years7-9 years 10-15 years16-29 years
28.8%25.5%
20.2%
19.5% 7.3%

Service Delivery Type
Telephone only Both optionsIn-person only
91.1%
Study Sample – 490 EmployersSession Configuration
Annual Limit Per-incident/issue
92.2%
8.3%
0.6%
7.8%

Predictions: Employer Choices in EAPs
Regulatory, social, and environmental pressures such as higher workplace safety risks, higher public accountability, extent of workforce behavioral health disorders will influence employers to provide a more generous EAP benefit.
If true, these variables: Employer type, Workforce size, Industry, Length of EAP contract, and Worker prevalence rates of behavioral health conditions by industry will be associated with statistically significant differences in employer choices of EA program features.

Methods: Employer Choices in EAP FeaturesStudy methods were designed to test 1) the null hypothesis (no differences) and, 2) determine differences among employers for:
1) choice of EAP session allowances (3 - 12 sessions)
2) choice of EAP session configuration (sessions per incident/issue vs. annual session limit)
3) choice of EAP service delivery (telephone only, in-person only, or both)
Methodologies: t-tests, ANOVA, Chi-square, Post-hoc & Regression

Findings: Employer Choices in EAP Features
+ = As predicted; ̶ = Against predicted; N/S = Not significant
Large workforce (vs. medium vs. small) = More generous EAP benefit
EAP feature ANOVA Post hoc Regression
Session allowance +Session configuration + ̶ +
Service delivery + ̶ +
Non-profit employer (vs. forprofit) = More generous EAP benefit
EAP feature ANOVA Chi-Square Regression
Session allowance +Session configuration + ̶ +
Service delivery N/S + ̶

Discussion: Employer Choices by Org Type & Workforce Size
Findings indicate that differences in employer decisions regarding EAP features were positively associated with organizational type and workforce size, this suggests these choices may be based on organizational resource dependency considerations.
The prediction that non-profit and larger employers offer a more generous EAP benefit was largely confirmed, although evidence regarding employer choice of service delivery option was mixed.

Findings: Employer choices by Age of EAP contract
+ = As predicted; ̶ = Against predicted
Older EAP contract (vs. younger) = More generous EAP benefit
EAP feature ANOVA Post hoc,Chi-Square Regression
Session allowance +Session configuration + + ̶
Service delivery + + ̶
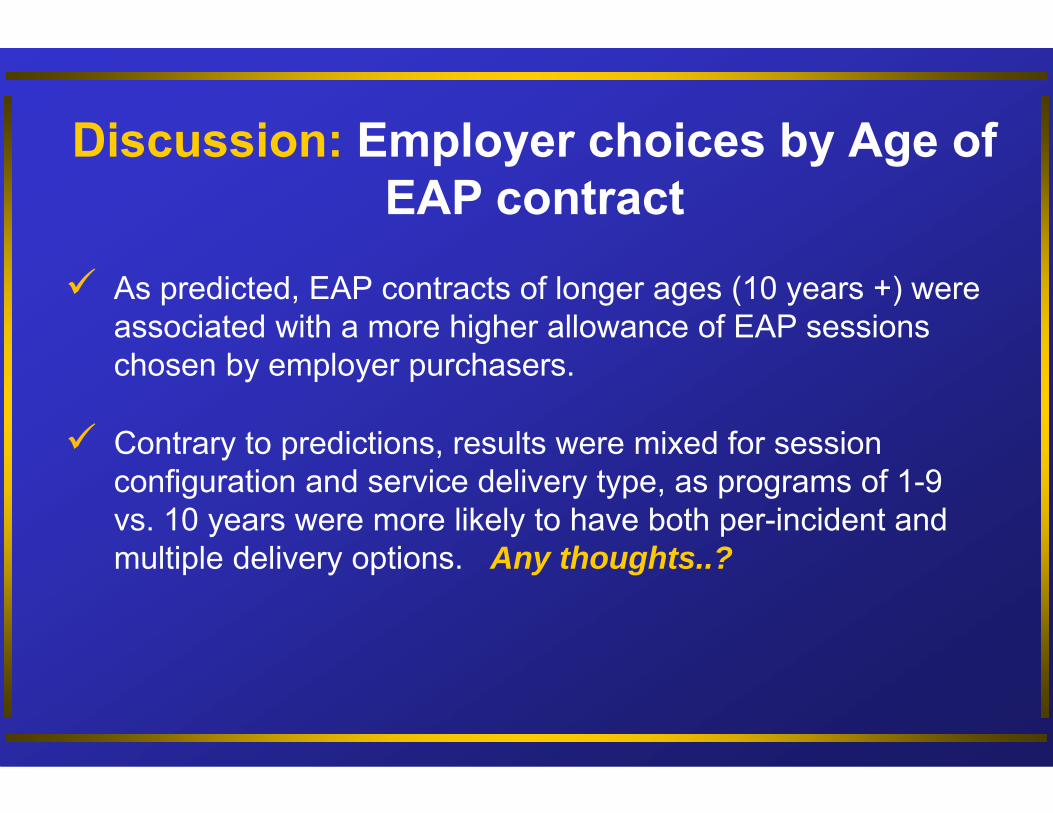
Discussion: Employer choices by Age of EAP contract
As predicted, EAP contracts of longer ages (10 years +) were associated with a more higher allowance of EAP sessions chosen by employer purchasers.
Contrary to predictions, results were mixed for session configuration and service delivery type, as programs of 1-9 vs. 10 years were more likely to have both per-incident and multiple delivery options. Any thoughts..?

Findings: Employer choices by Industry Risk
+ = As predicted; ̶ = Against predicted; N/S = Not significant
5 High safety risk and 3 high public accountability industries (vs. 11 low risk) = More generous EAP benefit
EAP feature ANOVA Post hoc,Chi-Square Regression
Session allowance +Session configuration + +/- ̶Service delivery type N/S
High safety risk = Mining, Utilities, Construction, Transportation & Manufacturing
High public accountability = Government, Education, Healthcare

Discussion: Industry Type & Risk
Overall, differences in employer decisions for session allowance were positively associated with industry sectors (data not shown); indicating this EAP feature may be subject to industry-specific employer needs.
Similarly, for employer decisions of high risk/accountability vs. low risk industries, employers with higher risks were positively associated as offering a greater number of EAP sessions.
Results of employers’ choice of session configuration by industry type and high vs. low risk industries were mixed, thus some influence of structural and environmental factors on employer choices is likely present, but not conclusively.

Past Year Alcohol Use Disorders by Industry, Annual %Agriculture, Forestry, Fishing & Hunting 9.4%Mining 15.2%Utilities 8.6%Construction 15.0%Manufacturing 9.1%Wholesale Trade 12.4%Retail Trade 9.6%Transportation & Warehousing 8.2%Information 5.9%Finance & Insurance 9.8%Real Estate & Rental & Leasing 10.4%Professional, Scientific & Technical Services 9.0%Mgmt of Comp & Entp; Admin & Sup, Waste Mgmt & Remed Svcs 12.0%Educational Services 5.0%Health Care & Social Assistance 5.8%Arts, Entertainment & Recreation 12.3%Accommodations & Food Services 15.7%Other Services 7.8%Public Administration 6.1%Total, all industries 9.5%

Past Year Major Depressive Episode by Industry, Annual %Agriculture, Forestry, Fishing & Hunting 6.2%Mining 4.4%Utilities 2.5%Construction 5.2%Manufacturing 6.1%Wholesale Trade 4.9%Retail Trade 8.2%Transportation & Warehousing 5.9%Information 8.7%Finance & Insurance 8.2%Real Estate & Rental & Leasing 6.8%Professional, Scientific & Technical Services 6.7%Mgmt of Comp & Entp; Admin & Sup, Waste Mgmt & Remed Svcs 9.6%Educational Services 7.6%Health Care & Social Assistance 9.4%Arts, Entertainment & Recreation 8.6%Accommodations & Food Services 9.6%Other Services 7.5%Public Administration 7.0%Total, all industries 7.4%

Findings: Employer choices by Behavioral Health Conditions
+ = As predicted; - = Against predicted; N/S = Not significant
High (vs. low) industry worker prevalence rate of AUDs = More generous EAP benefit
EAP feature ANOVA Post hoc,Chi-Square Regression
Session allowance N/S ̶Session configuration + ̶
Service delivery N/S
High (vs. low) industry worker prevalence rate of MDEs = More generous EAP benefit
EAP feature ANOVA Post hoc,Chi-Square Regression
Session allowance + N/S
Session configuration N/S
Service delivery N/S

Discussion: Employer choices by Behavioral Health Conditions
Alcohol use disorders (AUD) – Results indicate higher industry rates of AUDs are associated with a tendency to offer a per incident sessions, however regression (OLS) results of session allowance indicate that for every increase of 1 in the AUD prevalence rate, the number of EAP sessions drops by .073. Any thoughts..?
Major depressive episodes (MDE) – Results of employer decisions regarding session allowance and industry rates of MDEs are mixed, indicating slight evidence for the prediction that purchasers in these industries may choose a higher number of sessions.

Employer Demand for EAP Worksite Activities
Demand for Worksite Activities
YES NO
58.3%
Of the 490 employers in the sample, 286 reported EAP worksite activities. Again using same six variables, e.g.,
• Organizational type• Workforce size• Industry type• Length of EAP contract• Behavioral health conditions
We now ask: Are there differences in demand for EAP worksite activities among employers?
41.7%

Findings: Demand for Worksite Activities
0 0.2 0.4 0.6 0.8 1
Manufacturing
Prog Age3-9
Wkforce100-999
Wkforce1-99
For Profit
Odds ratios for significant variables (all others N/S; n = 286)
Ref: Non-profit (p= .01*)
Ref: Wkforce1000+ (p= <.0005***)
Ref: Prog age10+ (p= .009**)
Ref: Government (p= .01*)

Discussion: Demand for EAP Worksite Activity
As predicted, non-profit employers’ demand for EAP worksite activities was nearly double that of for profits’. Also as predicted, employers with longer EAP contracts showed greater demand for EAP worksite activities.
Contrary to predictions, larger (1000+) employers’ demand for worksite activities was substantially greater than smaller (1-99) and medium-sized (99-999) workforces. Any thoughts..?
Non-significant findings regarding high risk vs. low risk industries and for behavioral health conditions preclude any conclusions about these factors.

Predictions: Enrollee Demand for EAP Clinical Services
Enrollees in non-profits, smaller workforces, with EAPs of longer contract length, and higher prevalence rates of behavioral health conditions will demonstrate higher demand for EAP clinical services.
For industries with higher risks for workplace safety and more public accountability - this effect will “trickle down” through the workplace environment and demonstratehigher enrollee demand for EAP clinical services.

Study Sample: Enrollees The total number of eligible employees represented in the sample
was 687,958 with median of 139 employees per employer.
The total number of eligible members (employees, spouses and dependents) represented in the sample was 961,122 with a median of 178 members per employer EAP benefit population.
The following equations were used to create measures for employee and member demand:
Aggregated number of employee EAP clinical authorizations/employer
Aggregated number of employees/employer
Aggregated number of member EAP clinical authorizations/employer
Aggregated number of members/employer

Methods: Enrollee Demand for EAP Clinical Services
To determine differences among aggregated employer enrollee population for EAP clinical authorizations (Number of authorizations/Employer enrollee population), I used the same six variables, e.g.,• Organizational type• Workforce size• Industry type• Length of EAP contract• Behavioral health conditions
Methodologies: t-tests, ANOVA, Post-hoc & Regression (OLS)

Findings: Demand for EA Clinical ServicesNon-profit workforce(vs. for profit) = More demand for EA clinical services
Enrollee group ANOVA Regression
Employees + +Members + +
Smaller workforce (vs. med. vs. larger) = More demand for EA clinical services
Enrollee group ANOVA Post hoc Regression
Employees + + +Members + + +
Older (vs. younger) program = More demand for EA clinical services
Enrollee group ANOVA Post hoc Regression
Employees + + ̶Members + + ̶
+ = As predicted; - = Against predicted

Discussion: Enrollee Demand for EA Clinical Services by Employer Type,
Workforce Size, and EAP Contract Length
As predicted, greater demand for EAP clinical services was positively associated with enrollees in non-profit workforces, small and mid-size workforces than in larger-sized workforces.
Contrary to prediction, greater enrollee demand was present in workforces with shorter EAP contract rather than longer contract lengths. Any thoughts..?

Findings: Enrollee Demand for Clinical Services by Industry Type and Risk
High risk (vs. low risk) industries = More demand for clinical services
Enrollee group ANOVA Post hoc,Chi-Square Regression
Employees + + +Members + + +
Demand for EAP clinical services by industry type
Enrollee group ANOVA Post hoc
Employees + +Members + +

Discussion: Enrollee EAP Clinical Service Demand by Industry Type
ANOVA and Post-hoc tests reveal significant differences in rates of enrollee demand for EAP sessions in eight industries with high workplace safety and public accountability risk vs. those eleven with lower risk.
As predicted, enrollee demand for EAP sessions increased in workplaces in industries with either a high risk for workplace safety or high risk of public accountability vs. enrollees in those with lower risks.
High safety risk = Mining, Utilities, Construction, Transportation & Manufacturing
High public accountability = Government, Education, Healthcare

Findings: Enrollee Demand for Clinical Services by Behavioral Health Condition
High (vs. low) Industry MDEprevalence rate
Enrollee group ANOVA Post hoc Regression
Employees N/S
Members N/S
High (vs. low) Industry AUDprevalence rate
Enrollee group ANOVA Post hoc Regression
Employees + + ̶Members + + ̶
+ = As predicted; - = Against predicted; N/S = Not significant
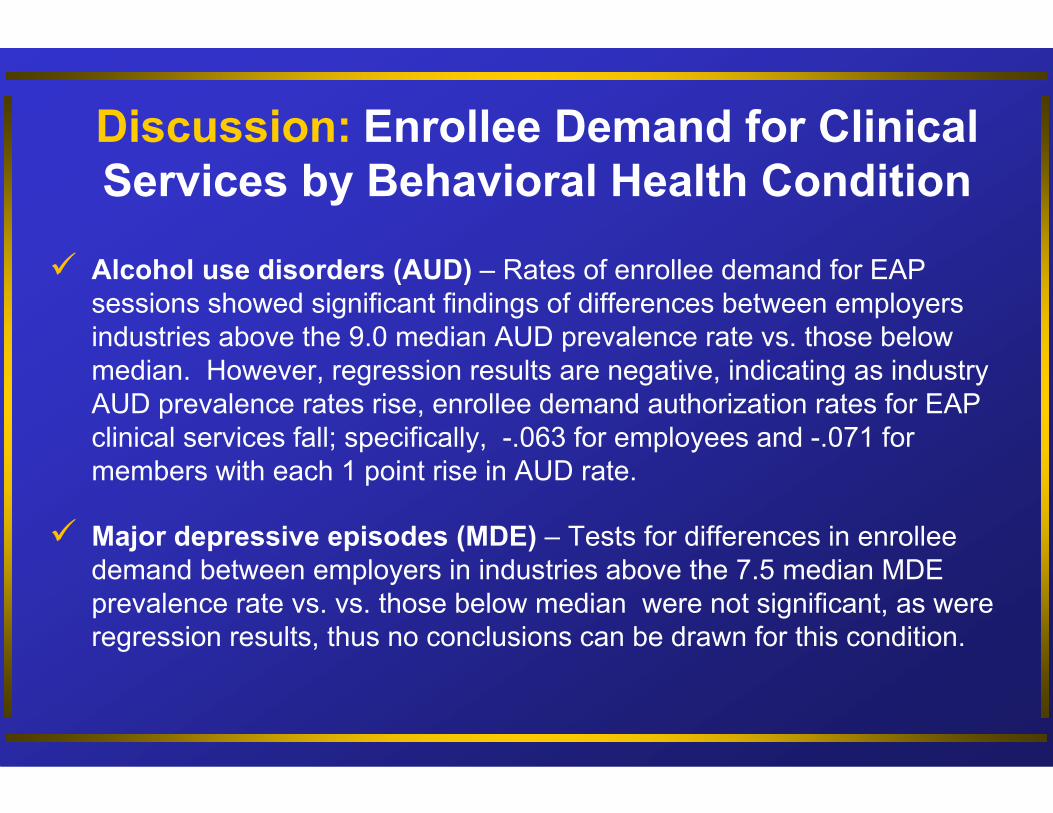
Discussion: Enrollee Demand for Clinical Services by Behavioral Health Condition
Alcohol use disorders (AUD) – Rates of enrollee demand for EAP sessions showed significant findings of differences between employers industries above the 9.0 median AUD prevalence rate vs. those below median. However, regression results are negative, indicating as industry AUD prevalence rates rise, enrollee demand authorization rates for EAP clinical services fall; specifically, -.063 for employees and -.071 for members with each 1 point rise in AUD rate.
Major depressive episodes (MDE) – Tests for differences in enrollee demand between employers in industries above the 7.5 median MDE prevalence rate vs. vs. those below median were not significant, as were regression results, thus no conclusions can be drawn for this condition.

EAP Practice Implications One clear finding is that significant and predictable differences exist among
employers regarding: 1) choices about the nature of EAP benefits offered to enrollees; 2) in demand for EAP-provided worksite activities; and, 3) that significant and predictable differences exist in enrollee demand for EAP clinical services.
These findings advise that the employer market for EAPs is quite diverse, and that a bona-fide organizational analysis combined with purchaser/client education regarding any findings is a good practice when proposing an EAP for a particular work organization.
Cautions in applying “cookie cutter” approaches to providing EAP services for diverse work populations. Potential risks may be low/poor utilization rates by enrollees, and a subsequent premature cancellation or disinterest in EA services by a work organization.

Behavioral Healthcare Policy Implications
Findings suggest that the diversity of purchasers in the marketplace is reflected in differing choices of EAP service features and enrollee demand for EAP counseling. Thus, these influences should be considered when benefits consultants, human resource staff and MBHOs design and implement behavioral health care coverage.
A primary motivation for including prevalence rates of alcohol use disorders and depression as dependent variables is the well-documented need for increasing identification of and access to treatment for these conditions. While the results for these two variables were less than conclusive -- it appears the variance in prevalence rates among enrollee populations is worthy of consideration when designing and implementing behavioral health care coverage.
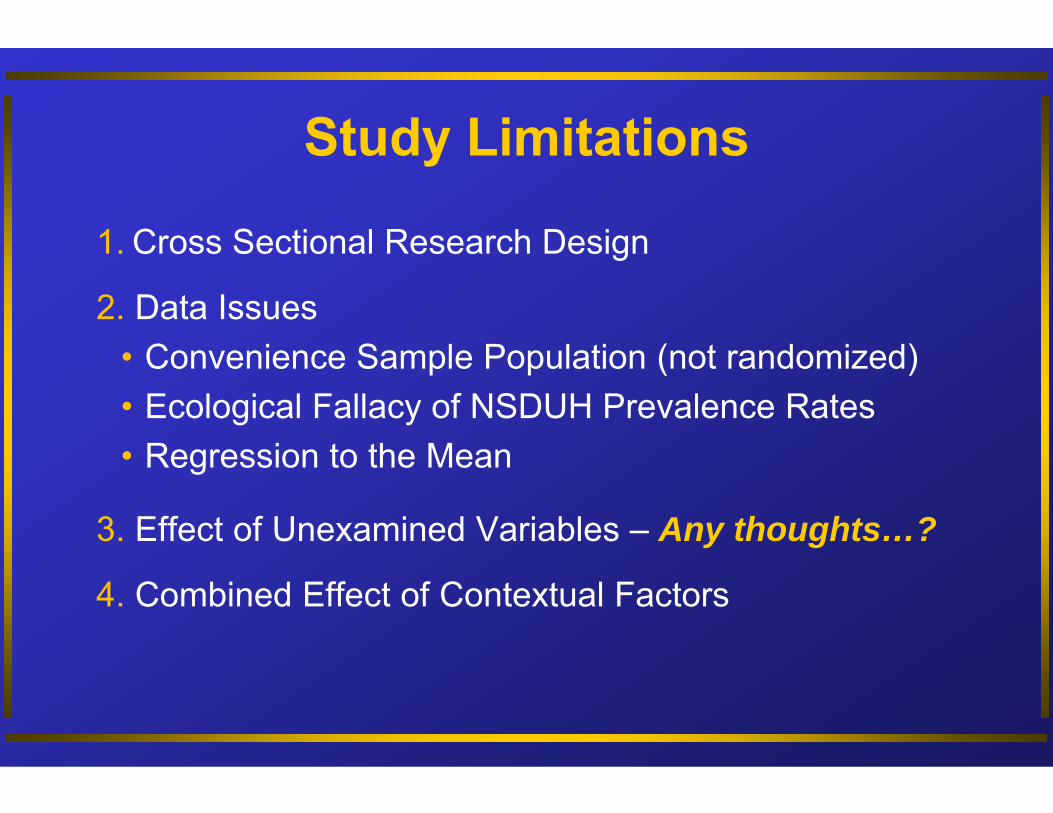
Study Limitations
1. Cross Sectional Research Design
2. Data Issues• Convenience Sample Population (not randomized)• Ecological Fallacy of NSDUH Prevalence Rates• Regression to the Mean
3. Effect of Unexamined Variables – Any thoughts…?
4. Combined Effect of Contextual Factors

Questions or Comments..?
Thank you for your attention