decommissioning insight report 2013oilandgasuk.co.uk/wp-content/uploads/2015/05/op082.pdf · ·...
TRANSCRIPT

OIL & GAS UKDECOMMISSIONINGINSIGHT 2013

OIL & GAS UK DECOMMISSIONING INSIGHT 2013
page 3
Contents
1 Foreword 4
2. Key Findings 6
3. Introduction 8
3.1 The Decommissioning Process 8
3.2 Survey Development and Methodology 9
3.3 ClassificationofExpenditure 10
3.4. The Oil and Gas Supply Chain 12
4 Results of the 2013 Decommissioning Survey 13
4.1 Regional Analysis 13
4.2 HistoricalComparisonofData 14
4.3 ForecastExpenditurebyDecommissioning Component 15
4.3.1 Operator Project Management 16
4.3.2 Facility Running/Owners’ Costs 17
4.3.3WellsAbandonment 18
4.3.4MakingSafeandTopsidePreparation 21
4.3.5 Removal 22
4.3.6PipelinesandMattressDecommissioning 26
4.3.7TopsidesandSubstructureRecycling 28
4.3.8SiteRemediationandMonitoring 29
Appendix WorkBreakdownStructureDefinitions 30

OIL & GAS UK DECOMMISSIONING INSIGHT 2013
page 4
1 Foreword
Oil & Gas UK’S Decommissioning Insight is the leading industry forecast for decommissioning on the UKContinentalShelf(UKCS).Producedannuallyoverthelastfouryears,thepublicationprovidesaforecastof regional decommissioning activity and expenditure over the next decade. Working with data from Oil&GasUK’smembership,the2013reportbuildsontheforecastsof27operatorscurrentatthetimeofthe survey.
WithintheUK,theoffshoreoilandgasindustryisthelargest investingsectorandthelargestcontributortonationalgrossvalueadded(GVA)amongtheindustrialsectorsoftheeconomy.Oil&GasUK’sEconomic Report 2013revealsthatthereisstillasignificantresourceof15to24billionbarrelsofoilequivalent(boe)forfurtherrecoveryfromtheUKCS,indicatingastrongfuturefordomesticoilandgasproduction.Furthermore,ifthecurrentrateofinvestmentissustained,theUKCShasthepotentialtosatisfycloseto50percentoftheUK’soilandgasdemandin20201.
Duetoimprovedrecoverytechniques,divestmentofassetsandthemaintenanceofinfrastructureforfutureopportunities,decommissioningprogrammesarethereforeflexibleinnatureandsubjecttochangeinforecast.Furthermore,itisexpectedthattheextensionstothetaxallowancesin2012andtherecentintroductionoftheDecommissioningReliefDeed,acontractbetweengovernmentandindustryguaranteeingcertaintyoffuturetaxreliefondecommissioningcosts,willhelptosustaintherecordlevelsofinvestmentforecastthisyearof£13.5billion.PushingbackdecommissioningwillkeepoilandgasproductionattheforefrontoftheUK energy agenda.
However, the 2013 decommissioning survey indicates that a handful of large decommissioning projectsare well underway and will be delivered in the next five to seven years. Experience gained from theseflagshipprojectswillprovidevaluableinsightfortheindustryasit learnshowtodecommissionfieldsinacosteffectiveandefficientmanner.Forexample,projectslistedontheDepartmentofEnergyandClimateChange’spathfinderwebsiteincludeBrae,Brent,MurchisonandMiller2. It is important that the lessons learnt fromtheseactivitiescontinuetobesharedacrosstheindustryasthiswillencouragedevelopmentofnewtechnologies and lead to streamlined processes.
TheworldclassBritishoilandgassupplychain,nowreportedtocontribute£27billionayeartotheeconomy3,supportsoilandgasproductionactivities.Forthissamesupplychain,decommissioningoffersbothagrowingbusinessopportunityandasignificantchallenge.
1Allreferencesin2013money,Oil&GasUKEconomic Report2013: http://www.oilandgasuk.co.uk/2013-economic-report.cfm
2SeetheDepartmentofEnergyandClimateChangePathfinderwebsiteat https://www.og.decc.gov.uk/pathfinder/decommissioningindex.html
3SeeErnst&Young’s2012 Oil Field Services Reportat:http://www.ey.com/Publication/vwLUAssets/Review_of _the_UK_oilfield_services_industry_2012/$FILE/EY_Review_of _the_UK_oilfield_services_industry_2012.pdf

OIL & GAS UK DECOMMISSIONING INSIGHT 2013
page 5
The 2013 Decommissioning Insightforecaststhatatotalof£10.4billionistobespentondecommissioningassets(excludingonshoreterminals)ontheUKCSfrom2013to2022.Thisdecommissioningactivity,however,representsasmallproportionoftheoverallmarket;thecurrentinventorywillbedecommissionedoverthenext40to50years,andbeyondforanyassetsstilltobedeveloped.Asaburgeoningsector,decommissioningtherefore provides a platform for innovation, cost reduction and increased efficiency and could reapsubstantialbenefitfromcollaboration.
WetrustyoufindthisdocumentaninformativeandusefulguidetodecommissioningactivityontheUKCS.
Oonagh WerngrenOperationsDirectorOil & Gas UK

OIL & GAS UK DECOMMISSIONING INSIGHT 2013
page 6
2 Key Findings
• From2013throughto2040,£31.5billionisforecasttobespentondecommissioningexistingassets.Newinvestmentinprobabledevelopmentswouldadd£3.5billiontothetotal,althoughmuchofthiswillbeincurredafter20404.Thisreportcapturesathirdofthisforecastforexistingassets.
• The 2013 decommissioning survey has been expanded to capture decommissioning spend overthenextdecadeto2022andto includeadditionalcategoriesofactivity.Twenty-sevenoperatorsresponded to the call for data on decommissioning expenditure and activity between 2013 and2022.Thisisanincreasedsamplesizeonsurveyscarriedoutinpreviousyearsandprovidesabetterrepresentationforforecasts.
• The 2013 survey has captured a greater mix of complex projects due to the expanded surveytimeframe. However, uncertainty may increase for forecasts beyond the five to seven year timeframe(post-2019)duetothechangingnatureofdecommissioningprogrammes.
• Total forecast expenditure on decommissioning from 2013 to 2022 is £10.4 billion5. Forty-fourpercentofthisexpenditureistobemadeinthenorthernNorthSeaat£4.6billion.
• Over 2,300 kilometres of pipeline, infrastructure from 74 fields, more than 70 subsea projectsandover130installationsarescheduledfordecommissioningoverthenextdecade.Thisincludesfloating,production,storageandoffloadingvessels(FPSOs),smallnormallyunmannedplatformsinthesouthernNorthSea,andlargeintegratedfacilitiesinthecentralandnorthernNorthSea.
• Manyofthedecommissioningprogrammescapturedinthissurveyareconsideredtobeintheearlyscoping stages.
• Wells plugging and abandonment is the largest category of expenditure totalling £4.5 billion. Thisrepresents43percentofthetotalforecastdecommissioningexpenditurefrom2013to2022.
• Over800wellsarescheduledforpluggingandabandonmentinthistimeperiod.Nearly480ofthesewellsareinthecentralandnorthernNorthSeaofwhichnearly60percentareplatformwells.
• InthecentralandnorthernNorthSea,theaverageforecast forwellspluggingandabandonmentexpenditure is £4.8 million per platform well, £10.1 million per subsea development well and £8millionpersubseaexplorationandappraisalwell.
• InthesouthernNorthSeaandIrishSea,theaverageforecastforwellspluggingandabandonmentexpenditureis£3.5millionperplatformwelland£6.6millionpersubseawell.
4Allreferencesin2013money,Oil&GasUKEconomic Report 2013: http://www.oilandgasuk.co.uk/2013-economic-report.cfm
5Thisfigureexcludes£300million(£10.7billiontotal)ofdataprovidedforonshoreterminalexpenditureandanyoperator data provided as lump sums.
OIL & GAS UK DECOMMISSIONING INSIGHT 2013
page 7
• Removal of topsides, substructure and subsea infrastructure totals 21 per cent of the overalldecommissioning expenditure at £2.2 billion.Nearly 470,000 tonnes ofmaterial are expected toberemovedbetween2013and2022,withactivitypeakingatmorethan60,000tonnesin2017inthecentralandnorthernNorthSea.Topsideremovalaccountsfor13percentofthetotalforecastmarketexpenditureatover£1.3billion.
• In thecentral andnorthernNorthSea, theaverage forecastexpenditureof removing topsides is£4,100pertonneandforsubstructures(jackets)£4,300pertonne.InthesouthernNorthSeaandIrishSea,theforecastsaverage£3,600and£5,700fortopsidesandsubstructures,respectively.
• Elevenpercent(nearly£1.2billion)ofthetotaldecommissioningexpenditureisforecasttobespentonfacilityrunningandowners’costs.Assetsneedtobewellmaintainedforaprolongedperiodtoenableeffectivedecommissioning.
• Over 405,000 tonnes of material are expected to be transported onshore for dismantling andprocessingbetween2013and2022,withdemandforUKdisposalyardspeakingin2018whenover80,000tonnesofmaterialareforecasttocomeonshorefromthecentralandnorthernNorthSea.
• Acomparisonofforecastdatafromthe2011,2012and2013Decommissioning Insights indicates a consistencyinthenear-termdecommissioningforecastsandsomesmoothingofexpenditure.
• Decommissioningexpertise isconsideredtobeavailablewithin theUKsupplychain,butwithoutsignificantactivityinthisareathesupplychainhasnotbeenfullytested.Itisexpectedthatsomeadjustmentwillberequiredasactivityincreasesandcompetitionforresourcesmaybeexperiencedinsomeareaswithoilandgasproduction.

OIL & GAS UK DECOMMISSIONING INSIGHT 2013
page8
3 Introduction
Fiscalchange,technologicaladvancesandhighoilandgaspriceshaveledtoarecordlevelofinvestmentof£13.5billionbeingforecastin2013.NewoffshoredevelopmentsandtherejuvenationofexistingassetswillhelptosignificantlyextendthefieldlifeoftheUKContinentalShelf(UKCS)andmaydelaydecommissioninginfavourofredevelopment.
Fornew investment in existingassetson theUKCS, theBrownFieldAllowance (BFA) introduced in2012reducesthemarginaltaxratebyupto32percentforfiveyearsonthemorecostlyopportunities.Earlierin2013,EnQuest’sThistleoilfielddevelopmentsecuredaBFA,enablinganewphaseoflate-lifeassetextensionwhichisexpectedtocreate1,000newjobsacrosstheUKsupplychainandsignificantlyincreaseproduction.Talisman Sinopec’s Montrose Area Redevelopment is another clear example of the impact of the BFA.Theprogrammeof£1.6billionofcapital investment isexpectedtoyieldanadditional100millionboeofproduction,extendingfieldlifeanddelayingdecommissioninguntil2030.
Furthermore,theDecommissioningReliefDeedisexpectedtodelaydecommissioningforsomeprojects.Thisuniquecontractbetweengovernmentandindustryprovidescertaintyoffuturetaxreliefondecommissioningcostson theUKCS, enabling companies tomove their decommissioning liabilities to apost-taxbasis andreleaseadditionalfundsforfurtherinvestmentinoilandgasproduction,forthebenefitoftheeconomyandenergy security.
Nonetheless,despitethecurrentgrowthofthedomesticoilandgasindustry,decommissioningisasignificantandinevitablestageinthelifeofafield.TheOil&GasUK Economic Report 2013 detailsthatfrom2013throughto2040,£31.5billion isforecasttobespentondecommissioningexistingassets,withnewinvestment inprobabledevelopmentsadding£3.5billiontothistotal6.Thisreportisbasedontheresultsobtainedintheannualdecommissioning surveyandprovidesdetailsof theoperators’expectations fordecommissioningactivityandexpenditurefrom2013throughto2022,revealingtotal forecastexpenditureof£10.4billion7 during this period.
3.1 The Decommissioning ProcessFollowinganupdateoftheDecommissioning Cost Estimating Guidelines8byOil&GasUK’sDecommissioningEfficientExecutionWorkGroup,the2013surveyhasbeenmodelledaroundanewWorkBreakdownStructure(WBS),whichprovidesadetailedbreakdownofthevariouscomponentsofthedecommissioningprocess.Thisreportdiscussesthesecomponents,withthethreelargestareasofforecastexpenditurebeingwells,topsideremovalandfacilityrunningandowners’costs.
Figure1rightillustrateshowthe2011and2013structuresmapinrelationtoeachother.Definitionsforthe2013WBSarelistedintheAppendix.
6Allreferencesin2013money,Oil&GasUKEconomic Report 2013: http://www.oilandgasuk.co.uk/2013-economic-report.cfm
7Thisfigureexcludes£300million(£10.7billiontotal)ofdataprovidedforonshoreterminalexpenditureandanyoperator data provided as lump sums.
8 See the Decommissioning Cost Estimating Guidelinesat: http://www.oilandgasuk.co.uk/publications/publications.cfm

OIL & GAS UK DECOMMISSIONING INSIGHT 2013
page 9
Figure 1: Mapping of the 2011 and 2013 Work Breakdown Structures (The components drawn verti cally represent those where expenditure and acti vity
span the enti re decommissioning process)
3.2 Survey Development and MethodologyThe 2013 Decommissioning Insightbuildsonthesurveyscarriedoutin2011and2012.FollowingrequestsfromthesupplychainandsupportfromtheOil&GasUKDecommissioningMarketInsightWorkGroup,thesurveyhasbeenexpandedtocapturedecommissioningactivityandexpendituredataoverthenexttenyears.
Toprovidebothoperatorsandcontractorswithaggregatedinformationonnear-termprojectsontheUKCS,Oil&GasUKsurveyedoperatorsbetweenMayandAugust2013ontheirdecommissioningactivitiesandexpenditureforecastsfrom2013to2022.Theinformationpresentedinthefollowingsectionsissolelybasedonthedataasidentifiedatthetimeofthesurveyandcollectedonanon-attributableandaggregatedbasis.Regionalanalysishasbeencarriedoutlookingatthedataintwogroupings:thecentralandnorthernNorthSea and the southern North Sea and Irish Sea.
Source:Oil&GasUK

OIL & GAS UK DECOMMISSIONING INSIGHT 2013
page 10
Operatorswere asked to provide data on expenditure per year for 21 different cost categories, such assubstructureremovalandpipeline‘makingsafe’.Theincreasednumberofcategoriessincethe2012surveyenableseasiermappingofthedatatothenewWBSoutlinedinFigure1.Thetypeofassetdictateswhichofthese categories operators responded to.
Operators were also asked to quantify physical decommissioning activity, such as tonnes of subseainfrastructuretoberemovedornumbersofwellstoplugandabandon.
Thesurveyhasbeenexpandedtoincludethefollowingactivitydata:• Numberandlengthofpipelinetobedecommissioned,subdividedintotrunklines(diametergreater
than 16 inches and longer than 18 kilometres), other pipelines (any pipeline outwith trunk linecriteria)andumbilicals
• Lengthofpipelinetobemadesafe• Numberoftopsidemodulestobeprepared• Thebreakdownofsubsea infrastructuretoberemoved intomattressesand’other infrastructure’
suchasmanifoldsandsubseaisolationvalves(SSIV)
Decommissioning Forecast 2013 to 2022Theextendedtimeframeofthe2013surveycapturesdataoverthenextdecade.Itisconsideredthatforecastsintheshortterm,fivetosevenyearsfromnow,areconsistentwiththe2011and2012dataintheirreflectionofactivityandexpenditure.However,post-2019theremaybeanincreaseinuncertaintyintheforecasts.Withtheflexibilityofdecommissioningprogrammesandanincreasedfocusonthelifeextensionofexistingassets,thelandscapeofthemarketpost-2019isexpectedtochangewhenforecastsarerevisitednearerthistime.
Whileitispossibletocomparedataacross2011,2012and2013,itisimportanttonotethat,asoutlinedinsection3.1,the2013surveyismodelledonthenewWBS.
Results fromthe2013surveyarebelievedtorepresent87percentof themarket from2013to2022,soestimatescontainedinthisreportareconservative.The2013surveywelcomedparticipationfromoperatorswho had not previously submitted data. Expenditure captured in this survey represents only a third offorecastdecommissioningactivityprojectedto2040andthereforesignificantactivityisexpectedoutsideofthesurveytimeframe. 3.3 ClassificationofExpenditureTheforecastspendpresentedinthefollowingsectionsofthisreportisasimpleaggregationofexpenditureprovidedbyoperatorsinthesurveyresponses.Oil&GasUKhasnotappliedanyadditionaltreatmenttothefiguressubmitted.
Forecastingdecommissioningexpenditureattheoutsetofaprojectischallengingduetomanyuncertaintiesandlinkedactivitiesinfluencingexpenditure.Asdecommissioningprojectsarenotsubjecttothesametimepressures as development projects, there ismoreflexibility in the executiontiming,within integrity andsafetyconstraints.

OIL & GAS UK DECOMMISSIONING INSIGHT 2013
page 11
The Association for the Advancement of Cost Engineering (AACE) has developed a set of guidelines9 to applyestimateclassificationtoprojectedcosts.Inthissurvey,operatorswereaskedtoprovideanestimateclassfortheirproject,whichisdeterminedbythelevelof‘projectdefinition’withconsiderationofasetofsecondarycharacteristics.ThefiveestimateclassesintheCostEstimateClassificationMatrixareshownin Figure2below.
Figure 2: Extract from the AACE Cost Estimation Classification Matrix
PrimaryCharacteristic SecondaryCharacteristic
EstimateClass LevelofProjectDefinition (expressedas%ofcompletedefinition)
EndUsageTypicalPurposeofEstimate
MethodologyTypicalEstimatingMethod
ExpectedAccuracyRange Typical VariationinLowand High Range
Class 5 0%to2% Concept screening Capacityfactored,parametricmodels,judgement or analogy
L:-20%to-50%H:+30%to+100%
Class 4 1%to15% Studyorfeasibility Equipmentfactoredorparametric models
L:-15%to-30%H:+20%to+50%
Class 3 10%to40% Budgetauthorisationorcontrol
Semi-detailedunit costs with assemblylevellineitems
L:-10%to-20%H:+10%to+30%
Class 2 30%to70% Controlorbid/tender
Detailed unit costswithforceddetailedtakeoff
L:-5%to-15%H:+5%to+20%
Class 1 50%to100% Checkestimateorbid/tender
Detailed unit cost with detailed takeoff
L:-3%to-10%H:+3%to+15%
Over 70 per cent of the survey respondents classified their expenditure using theAACECost EstimationClassification Matrix. Nearly 60 per cent of them reported class 4 for their projects, with more than 30percentreportingclass5.Thissuggeststhatthemajorityofprojectsareintheearlyscopingstages.
In comparison to the 2012 Decommissioning Insight, twice asmany projectswere classified as 4 and 5. Thisreflectsthegreatermixofcomplexprojectscapturedbyalargersurveysamplesize.ThefewprojectsstatingAACEclass1or2havecessationofproduction(COP)datesinthepastandwouldbeexpectedtobenearingcompletionoftheirdecommissioningprogrammes.
9FurtherinformationontheAdvancementofCostEstimating(AACE)classificationschemeisavailableat http://www.costengineering.eu/Downloads/articles/AACE_CLASSIFICATION_SYSTEM.pdf
OIL & GAS UK DECOMMISSIONING INSIGHT 2013
page 12
3.4 The Oil and Gas Supply ChainDecommissioningisagrowingmarketfortheUKoilandgassupplychainthroughtheproducinglifeoftheUKCSandbeyond.Some475 installations,5,000wells10andover27,000kilometresofpipeline (includingumbilicals,risersandspools,etc)willeventuallyneedtobedecommissioned11.Thisfiguredoesnotincludeanyfuturedevelopments.Asanemergingchallenge,decommissioningthereforerequiresacomplexbalanceofresearch,planning,engineeringexpertiseandstakeholderconsideration.
By using many of the same supply chain services employed during development offshore projects, itis believed that the required expertise for decommissioning is currently available within the UK oil andgas industry. However, while Oil & Gas UK forecasts that capital investment in developments will reach £13.5billionthisyear,theannualaverageforecastexpenditurefordecommissioningissmallerincomparisonat£1billionperyearoverthenextdecade.Theremaythereforebecompetitionforresourceswithinthesupplychain,suchasforrigs,vesselsandskilledlabour.Thechallengeoffindingsufficientskilledpersonnelisalready well documented.
Furthermore,althoughthecapabilityandexpertisetocarryoutdecommissioningisavailableintheUK,thecapacityofthesupplychainhasyettobefullytestedwithincreasedvolumesofdecommissioningactivity.Thisismostlikelytoresultinthespreadingofactivityovertimetoallowforappropriateadjustment.Inlightoffiscalincentives,increasedinvestmenttoextendfieldlifemaydelayfuturedecommissioningprojectsandwill,inturn,provideadditionaltimeforthisadjustmentandreducecompetitionwithinthesupplychain.
Overall, thedecommissioningsectorhasstrongpotential tobenefit fromcollaborationandensuringthatthelearningsfromcurrentandcompletedprojectsareabsorbedbytheindustry,improvingknowledgeandrefiningforecasts.Asdecommissioninggrowsworldwidethereispotentialforaglobalmarkettodevelop.
10 See Oil & Gas UK Economic Report 2013at: http://www.oilandgasuk.co.uk/2013-economic-report.cfm
11 See the Oil & Gas UK Decommissioning of Pipelines Report at: http://www.oilandgasuk.co.uk/publications/publications.cfm

OIL & GAS UK DECOMMISSIONING INSIGHT 2013
page 13
4 Results of the 2013 Decommissioning Survey
Thefollowingresultsreflectoperators’forecastsofexpenditureondecommissioningofUKCSassetsforeachyearfrom2013to2022,totalling£10.4billion.Thisanalysisdoesnotincludetheadditional£300millionofoperatorspendattributedtoonshoreterminalsanddataprovidedaslumpsumvalues.
Theanalysishasbeen split into two regional groupings: the central and thenorthernNorthSeaand thesouthernNorthSeaandtheIrishSea.TheoperatordatahavebeenaggregatedandanalysedbasedonthecomponentsoftheWBSdetailedinFigure1,focusingonthelargestareasofexpenditure.Somehistoricalcomparisonofdatahasbeenperformedandaveragecostsexamined.
4.1 Regional AnalysisOf the total £10.4 billion, Figure 3 below shows that 44 per cent (£4.6 billion) of the decommissioningexpenditurewillbeconcentratedinthenorthernNorthSeaoverthenexttenyears.Afurther32percent(£3.3billion)willbespentinthecentralNorthSea,andtheremaining24percent(£2.5billion)inthesouthernNorth Sea and Irish Sea.
The greater proportion of expenditure in the central and northern North Sea reflects the complexityandsizeofprojects intheseregions,althoughdecommissioning isexpectedtobeexecutedearlier inthe southern North Sea.
Annualexpenditurerisesovertheten-yearperiodfromjustunder£600millionin2013andpeaksatover£1.4billionin2017.Followinganotherpeakin2019,thistrendreversesandexpendituredeclines,restingatapproximately£800millionin2022.Thismaybeattributedtouncertaintytowardstheendofthedecade.
From2013to2017,theregionalsplitindecommissioningandtheriseinexpenditureisconsistentwiththe2012 Oil & Gas UK Decommissioning Insight. Figure 3: Total Forecast Decommissioning Expenditure on the UKCS by Year and Region from 2013 to 2022
0
200
400
600
800
1,000
1,200
1,400
1,600
2013 2014 2015 2016 2017 2018 2019 2020 2021 2022
Fore
cast
Exp
endi
ture
(£ M
illio
n)
Year
Northern North Sea Central North Sea Southern North Sea Irish Sea
Source: Oil & Gas UK
Increased Uncertainty in ForecastsFigure 3
OIL & GAS UK DECOMMISSIONING INSIGHT 2013
page 14
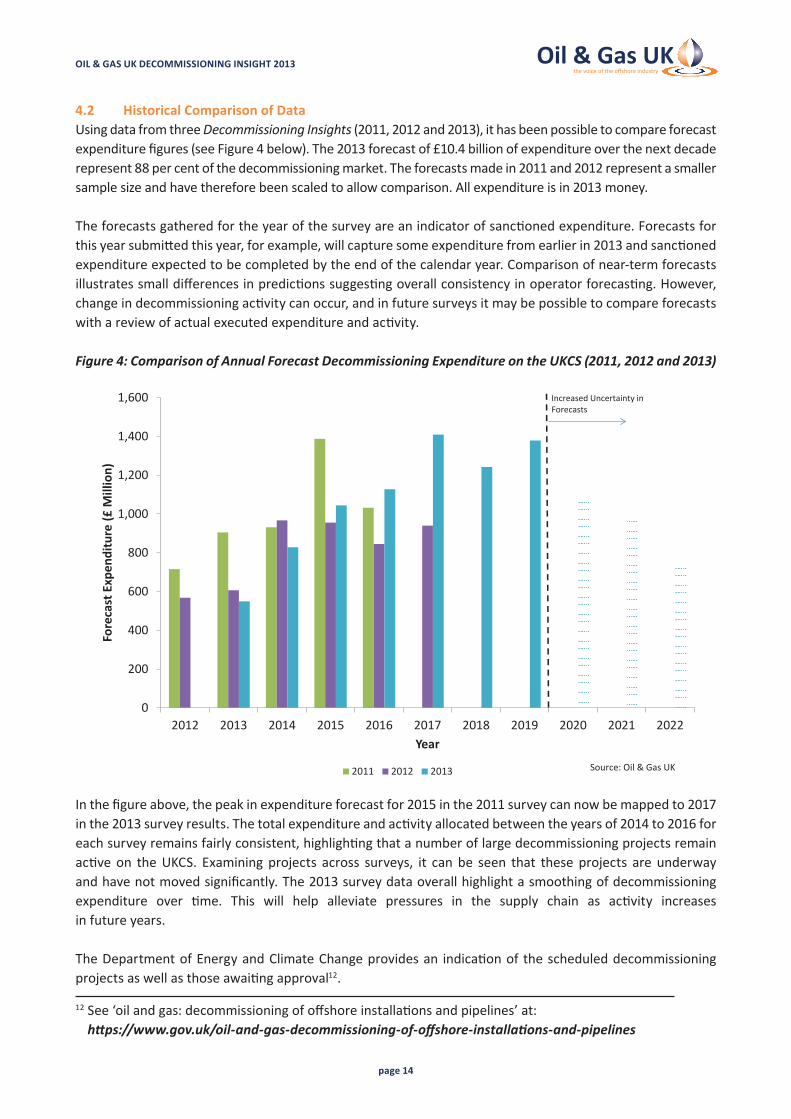
4.2 Historical Comparison of DataUsingdatafromthreeDecommissioning Insights(2011,2012and2013),ithasbeenpossibletocompareforecastexpenditurefigures(seeFigure4below).The2013forecastof£10.4billionofexpenditureoverthenextdecaderepresent88percentofthedecommissioningmarket.Theforecastsmadein2011and2012representasmallersamplesizeandhavethereforebeenscaledtoallowcomparison.Allexpenditureisin2013money.
Theforecastsgatheredfortheyearofthesurveyareanindicatorofsanctionedexpenditure.Forecastsforthisyearsubmittedthisyear,forexample,willcapturesomeexpenditurefromearlierin2013andsanctionedexpenditureexpectedtobecompletedbytheendofthecalendaryear.Comparisonofnear-termforecastsillustratessmalldifferencesinpredictionssuggestingoverallconsistencyinoperatorforecasting.However,changeindecommissioningactivitycanoccur,andinfuturesurveysitmaybepossibletocompareforecastswithareviewofactualexecutedexpenditureandactivity. Figure 4: Comparison of Annual Forecast Decommissioning Expenditure on the UKCS (2011, 2012 and 2013)
Inthefigureabove,thepeakinexpenditureforecastfor2015inthe2011surveycannowbemappedto2017inthe2013surveyresults.Thetotalexpenditureandactivityallocatedbetweentheyearsof2014to2016foreachsurveyremainsfairlyconsistent,highlightingthatanumberoflargedecommissioningprojectsremainactiveon theUKCS. Examiningprojects across surveys, it canbe seen that theseprojects areunderwayandhavenotmovedsignificantly.The2013surveydataoverallhighlightasmoothingofdecommissioningexpenditure over time. This will help alleviate pressures in the supply chain as activity increases infutureyears.
TheDepartmentofEnergyandClimateChangeprovidesan indicationof thescheduleddecommissioningprojectsaswellasthoseawaitingapproval12.
0
200
400
600
800
1,000
1,200
1,400
1,600
2012 2013 2014 2015 2016 2017 2018 2019 2020 2021 2022
Fore
cast
Exp
endi
ture
(£ M
illio
n)
Year
2011 2012 2013 Source: Oil & Gas UK
Increased Uncertainty in ForecastsFigure 4
12See‘oilandgas:decommissioningofoffshoreinstallationsandpipelines’at: https://www.gov.uk/oil-and-gas-decommissioning-of-offshore-installations-and-pipelines
OIL & GAS UK DECOMMISSIONING INSIGHT 2013
page 15
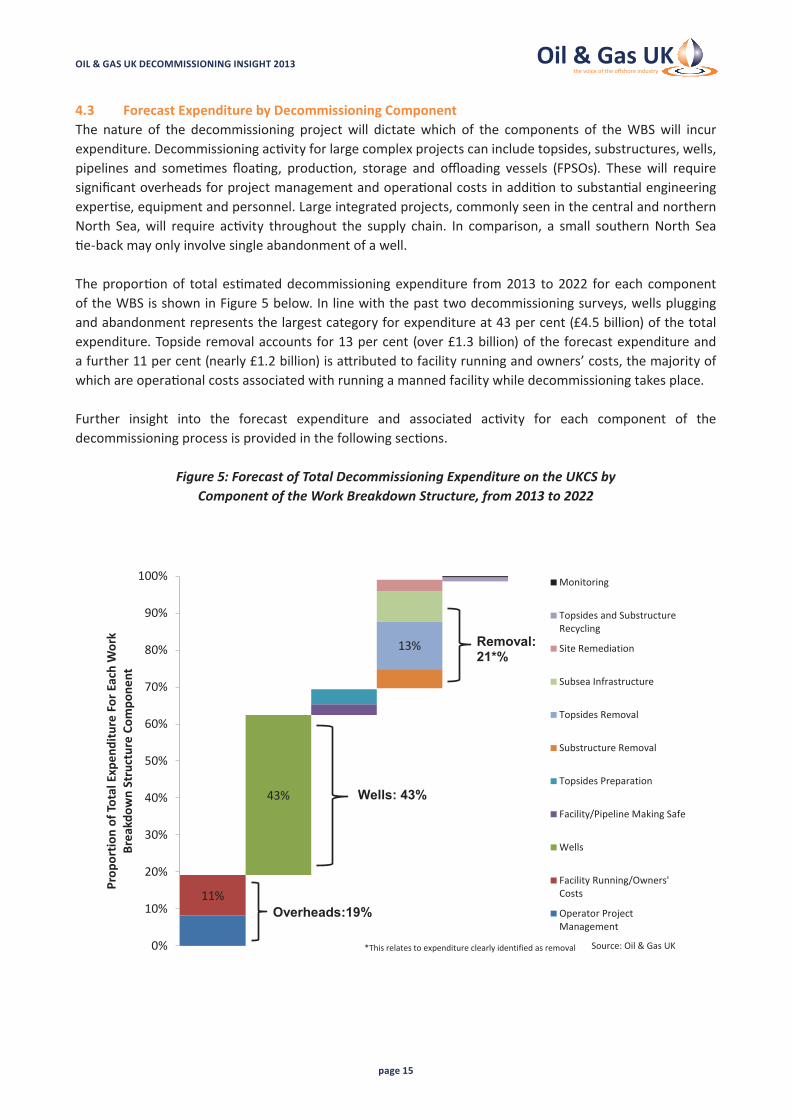
4.3 Forecast Expenditure by Decommissioning ComponentThe nature of the decommissioning projectwill dictatewhich of the components of theWBSwill incurexpenditure.Decommissioningactivityforlargecomplexprojectscanincludetopsides,substructures,wells,pipelines and sometimes floating, production, storage and offloading vessels (FPSOs). Thesewill requiresignificantoverheadsforprojectmanagementandoperationalcostsinadditiontosubstantialengineeringexpertise,equipmentandpersonnel.Largeintegratedprojects,commonlyseeninthecentralandnorthernNorth Sea,will require activity throughout the supply chain. In comparison, a small southernNorth Sea tie-backmayonlyinvolvesingleabandonmentofawell.
Theproportionof totalestimateddecommissioningexpenditure from2013 to2022 foreachcomponentoftheWBSisshowninFigure5below.Inlinewiththepasttwodecommissioningsurveys,wellspluggingandabandonmentrepresentsthelargestcategoryforexpenditureat43percent(£4.5billion)ofthetotalexpenditure.Topsideremovalaccountsfor13percent(over£1.3billion)oftheforecastexpenditureandafurther11percent(nearly£1.2billion)isattributedtofacilityrunningandowners’costs,themajorityofwhichareoperationalcostsassociatedwithrunningamannedfacilitywhiledecommissioningtakesplace.
Further insight into the forecast expenditure and associated activity for each component of thedecommissioningprocessisprovidedinthefollowingsections.
Figure 5: Forecast of Total Decommissioning Expenditure on the UKCS by Component of the Work Breakdown Structure, from 2013 to 2022
11%
43%
13%
0%
10%
20%
30%
40%
50%
60%
70%
80%
90%
100%
Prop
ortio
n of
Tota
l Exp
endi
ture
For
Eac
h W
ork
Brea
kdow
n St
ruct
ure
Com
pone
nt
Monitoring
Topsides and SubstructureRecycling
Site Remediation
Subsea Infrastructure
Topsides Removal
Substructure Removal
Topsides Preparation
Facility/Pipeline Making Safe
Wells
Facility Running/Owners'Costs
Operator ProjectManagement
Source: Oil & Gas UK
Overheads:19%
Wells: 43%
Removal:21*%
*This relates to expenditure clearly identified as removal
Figure 5
OIL & GAS UK DECOMMISSIONING INSIGHT 2013
page 16
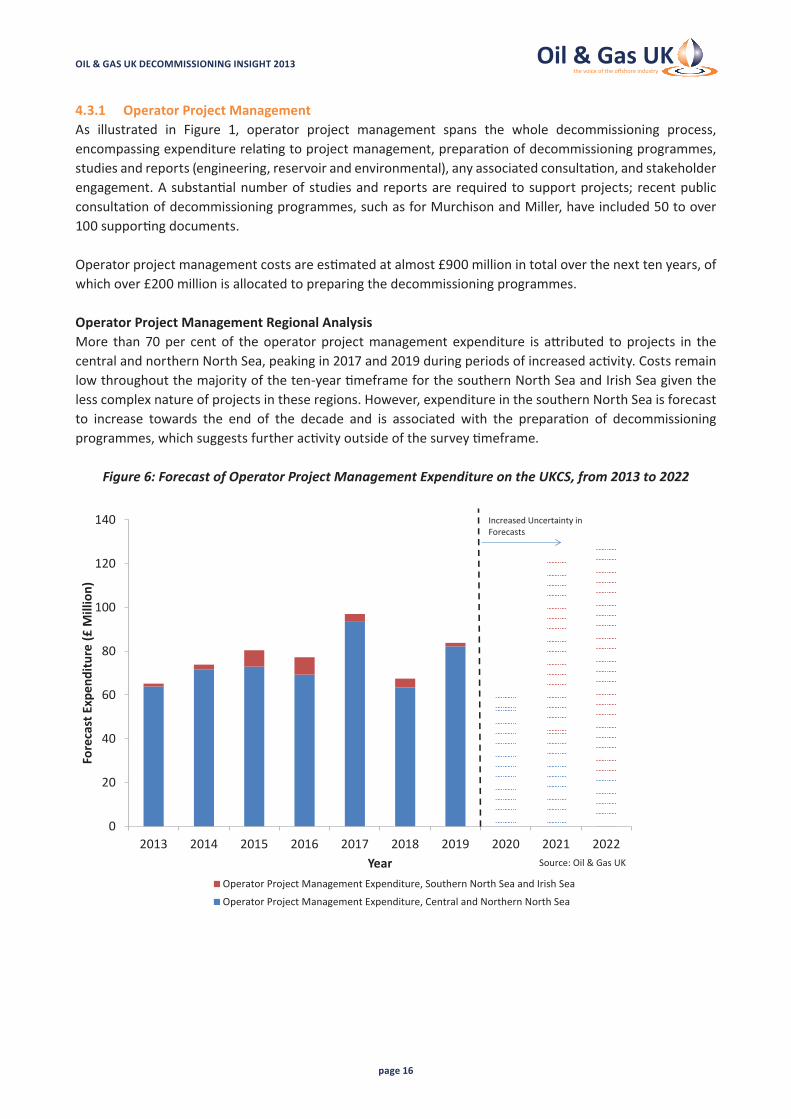
4.3.1 Operator Project ManagementAs illustrated in Figure 1, operator project management spans the whole decommissioning process,encompassingexpenditurerelatingtoprojectmanagement,preparationofdecommissioningprogrammes,studiesandreports(engineering,reservoirandenvironmental),anyassociatedconsultation,andstakeholderengagement.Asubstantialnumberofstudiesandreportsarerequiredtosupportprojects; recentpublicconsultationofdecommissioningprogrammes,suchasforMurchisonandMiller,haveincluded50toover100supportingdocuments.
Operatorprojectmanagementcostsareestimatedatalmost£900millionintotaloverthenexttenyears,ofwhichover£200millionisallocatedtopreparingthedecommissioningprogrammes.
Operator Project Management Regional AnalysisMore than70per centof theoperatorprojectmanagement expenditure is attributed toprojects in thecentralandnorthernNorthSea,peakingin2017and2019duringperiodsofincreasedactivity.Costsremainlowthroughoutthemajorityoftheten-yeartimeframeforthesouthernNorthSeaandIrishSeagiventhelesscomplexnatureofprojectsintheseregions.However,expenditureinthesouthernNorthSeaisforecastto increase towards the end of the decade and is associated with the preparation of decommissioningprogrammes,whichsuggestsfurtheractivityoutsideofthesurveytimeframe.
Figure 6: Forecast of Operator Project Management Expenditure on the UKCS, from 2013 to 2022
0
20
40
60
80
100
120
140
2013 2014 2015 2016 2017 2018 2019 2020 2021 2022
Fore
cast
Exp
endi
ture
(£ M
illio
n)
YearOperator Project Management Expenditure, Southern North Sea and Irish Sea
Operator Project Management Expenditure, Central and Northern North Sea
Source: Oil & Gas UK
Increased Uncertainty in Forecasts

OIL & GAS UK DECOMMISSIONING INSIGHT 2013
page 17
4.3.2 Facility Running/Owners’ CostsExpenditureallocatedtofacilityrunningandowners’costsencompassestheoperationalexpensesincurredpostcessationofproduction(COP)throughtocompletionofdecommissioning.Thisinvolvesmanagingthefacilitybothasapre-normallyunmannedinstallation(pre-NUI)andnormallyunmannedinstallation(NUI),withexpenditureonlogistics(aviationandmarine),anoperationsteam,thedeckcrew,powergeneration,platformservices,integritymanagement(inspectionandmaintenance)andspecialistservices.
Forapre-NUI,approximately95percentof theproductionstaffarestill requiredas theoperatorworkstowardsmakingthe facilityhydrocarbonfree.Oncethe facility isunmanned(NUI)andpositively isolatedfromhydrocarbons,therearelowerlevelsofactivityasidefromintegrityandmaintenancevisits.
Figure7belowillustratestheforecastannualexpenditureforfacilityrunningandowners’costswhichrisessignificantly from 2014 to 2017, suggesting that a large number of assets are entering decommissioningatthistime.
Withnearly£1.2billion forecastoverthenext tenyears, thiscategorymakesup11percentof thetotaldecommissioning expenditure in this timeframe and the costs can be almost wholly attributed to theoperationalexpensesincurredwhilstrunningapre-NUIfacility.
OperatorscanreducethesecostsbycarryingoutsomedecommissioningactivityduringthedownturnofproductionandthereforeacceleratingthepathwaytothefacilitybecominganNUI.Overall,assetsneedtobewellmaintainedforaprolongedperiodtoenablethemtobedecommissionedeffectively.
Figure 7: Forecast Expenditure for Facility Running and Owners’ Costs on the UKCS – Pre-NUI and NUI, from 2013 to 2022
0
50
100
150
200
250
2013 2014 2015 2016 2017 2018 2019 2020 2021 2022
Fore
cast
Exp
endi
ture
(£ M
illio
n)
Year
Facility Running/Owners' Costs Pre-NUI Expenditure NUI Expenditure
Source: Oil & Gas UK
Increased Uncertainty in Forecasts

OIL & GAS UK DECOMMISSIONING INSIGHT 2013
page18
0
100
200
300
400
500
600
700
800
900
1,000
0
10
20
30
40
50
60
70
80
90
100
2013 2014 2015 2016 2017 2018 2019 2020 2021 2022
Fore
cast
Exp
endi
ture
(£ M
illio
n)
Num
ber o
f Plu
gged
& A
band
oned
Wel
ls
YearSubsea Development Wells Subsea E&A Wells Platform Wells Total Wells P&A Expenditure
Source: Oil & Gas UK
Increased Uncertainty in Forecasts
Figure 8
4.3.3 Wells Abandonment The plugging and abandonment (P&A) of wells on the UKCS is carried out in accordance with industryguidelines13. The process of well P&A can be challenging and may involve intervention, the removal of down-holeequipment(suchasproductiontubingandpackers),andwellscaledecontaminationtreatment.Italsorequiresremovalofthewellheadandconductortothreemetresbelowtheseabed.
Over 800 wells are scheduled for decommissioning over the next decade, representing 16percentofthesome5,000wellsthatwillneedP&AintotalontheUKCSfromthecurrentinventory.Atacostof£4.5billion,wellsP&Aisthelargestcomponent(43percent)ofdecommissioningexpenditureontheUKCSoverthenexttenyears.
Wells Plugging and Abandonment in the Central and Northern North SeaNearly70percentoftheforecastwellsP&AexpenditureisinthecentralandnorthernNorthSea,equatingto £3.1 billion. Almost 480 wells are scheduled for decommissioning in these regions, of which nearly 60percentareplatformwells.Theactivityisconcentratedfrom2013to2019,withsignificantpeaksin2015,2017and2019,whenover80wellsperyeararescheduledforP&A.
Figure 8: Forecast of the Number of Wells to be Plugged and Abandoned by Type and Total Annual Expenditure in the Central and Northern North Sea, from 2013 to 2022
(expenditure indicated in purple and scale on the right hand axis)
13 See the Guidelines for the Suspension and Abandonment of Wellsat:http://www.oilandgasuk.co.uk/publications/viewpub.cfm?frmPubID=447
OIL & GAS UK DECOMMISSIONING INSIGHT 2013
page 19
AswellsP&Aactivitycontinuestoriseandindustrysharesitsexperiencesandlearnings,itisexpectedthatthe forecastingandefficiencyofexecutionwill improve.Overall, theaverage forecastwellabandonmentcostshavechangedsince2012anditisconsideredthattheaveragesreportedinthe2013surveyaremorerepresentativeduetolearningfromrecentwellP&Aexperience,thelargersamplesizeandtheexpandedtimeframecoveredbythisyear’ssurvey.Theactualcostofeachwellisdependentonawiderangeoffactors,suchaswaterdepth,weather,welltype,complexityandage.
TheaverageforecastcostforP&AofawellinthecentralandnorthernNorthSeais£4.8millionforaplatformwell,£10.1millionforasubseadevelopmentwelland£8millionforasubseaexplorationandappraisal(E&A)well.
Although the average cost per subsea development well has decreased by almost £5 million per well,comparedtothe2012forecast,theP&Aofthesewellsremainsthemostexpensive,predominantlyduetocostlyriginterventionandtheinflationofdayrates.
E&Awells,meanwhile, canbepluggedandabandoned routinelyby vessel but in some cases require rigintervention.The£4.5millionriseinaverageforecastabandonmentcostsforE&Awellscomparedto2012maybeduetoincreasedinterventioncostsforthemorecomplexwellscapturedinthisexpandedsurvey.
Wells Plugging and Abandonment in the Southern North Sea and Irish SeaIn the Southern North Sea and Irish Sea, the forecast expenditure for wells P&A totals £1.4 billion from 2013 to2022 (seeFigure9overleaf),encompassingapproximately330wells,over80per centofwhichareplatformwells.ThemajorityofthisactivityandexpenditureisassociatedwithprojectsinthesouthernNorthSea.
Thelevelofactivityfrom2013to2017isconsistentwiththe2012Decommissioning Insightbuttheextendedtimeframeofthisyear’ssurveynowrevealsaforecastofincreasedactivityfrom2020to2022.Incomparisontothe2012forecast,asmallamountofsmoothingofactivitycanbeseenbetween2013and2018.
TheaveragecostofwellsP&AinthesouthernNorthSeaandIrishSeais£3.5millionperplatformwellandapproximately£6.6millionpersubseawell.DuetothesmallnumberofE&Awellscapturedinthisstudy,theaveragecostofE&Asubseawellabandonmenthasnotbeencalculatedseparately.ThenatureofgaswellsinthesouthernNorthSeaandIrishSeaoftenmeanswellsP&Aiseasiertoperform,althoughrighireis oftenrequired.
Theactualcostofeachwellisdependentonawiderangeoffactorssuchaswaterdepth,weather,welltype,complexityandage.

OIL & GAS UK DECOMMISSIONING INSIGHT 2013
page 20
Figure 9: Forecast of the Number of Wells to be Plugged and Abandoned by Type and Total Annual Expenditure in the Southern North Sea and Irish Sea, from 2013 to 2022
(expenditure indicated in purple and scale on the right hand axis)
Wells Plugging and Abandonment Supply ChainOil & Gas UK’s Economic Report 2013forecastsariseinE&Adrillingoverthenextthreeyearswithactivitypeakingin201414.Roughly85percentofexplorationwellsand100percentofappraisalwellstobedrilledthisyearhavesecuredfirmrigslots.IfthecurrentforecastsforwellsP&AandE&Aactivitiesremain,significantcompetitionforrigsmaythereforebeexpected,althoughthe2013decommissioningsurveydidnotquerywhetherrigspacehadbeenallocatedforwellsP&Aactivity.Furthermore,althoughP&Aofmanyplatformwellscanbeachievedusingexistingequipmentontheplatform,upgradeofthesefacilitiesmayberequired.SomesmoothingofwellsP&Aactivityoverthenextdecadeisthereforeexpectedduetotheavailabilityandcompetitionforequipment,rigs,vesselsandskilledcrews.
DatafromCDA’sDEALdatabase15showsthatover6,000wellboreshavebeenpluggedandabandonedontheUKCStodateand34wellboreshavebeenpluggedandabandonedfromJanuarytoSeptember2013.
0
100
200
300
400
500
600
0
10
20
30
40
50
60
70
80
2013 2014 2015 2016 2017 2018 2019 2020 2021 2022
Fore
cast
Exp
endi
ture
(£ M
illio
n)
Num
ber o
f Plu
gged
& A
band
oned
Wel
ls
Year
Subsea Development Wells Subsea E&A Wells Platform Wells Total Wells P&A Expenditure
Source: Oil & Gas UK
Increased Uncertainty in ForecastsFigure 9
14 See Oil & Gas UK’s Economic Report 2013at:http://www.oilandgasuk.co.uk/2013-economic-report.cfm15CDA’sDEALdatabasecanbeaccessedat:https://www.ukdeal.co.uk/dp/jsp/PleaseLoginDeal.jsp

OIL & GAS UK DECOMMISSIONING INSIGHT 2013
page 21
4.3.4 MakingSafeandTopsidePreparationPriortothephysicalremovalofafacility itmustfirstbepreparedforremoval in linewithenvironmentaland safety considerations. The ‘making safe’ of both facilities and pipelines includes cleaning, draining,engineeringandwastemanagement.Thereafter,thetopsides,processandutilitiesmodulesareseparatedandappropriateengineering,suchastheinstallationofliftpoints,cantakeplacetoenableremoval.
Overthenexttenyears,‘makingsafe’isforecasttocost£300millionintotalwithtopsidepreparationequatingtoover£420million.Thisincludesnearly840kilometresofpipelinesandnearly280topsidemodules.Apeakofactivitycanbeseenbetween2015to2018whichcorrespondswithaperiodofhighremovalactivityandincreasedremovalexpenditure.Removalactivityisdiscussedinsection4.3.5.
MakingSafeandTopsidePreparationRegionalAnalysisThetopsidespreparationandfacility‘makingsafe’costsdetailedinthisreportarelargelyconcentratedonthecentralandnorthernNorthSea,asthesouthernNorthSeahasalargenumberofsmallsatellitefacilitiesorNUIswhichrequirelessofsuchactivity.Pipeline‘makingsafe’expenditure,meanwhile,ismarkedlyhigherin the southern North Sea and Irish Sea.
Figure 10: Forecast of ‘Making Safe’ and Topside Preparation Expenditure on the UKCS, from 2013 to 2022
0
20
40
60
80
100
120
140
2013 2014 2015 2016 2017 2018 2019 2020 2021 2022
Fore
cast
Exp
endi
ture
(£ M
illio
n)
Year
Facilities Making SafeCosts, Southern North Seaand Irish Sea
Pipeline Making SafeCosts, Southern North Seaand Irish Sea
Topside PreparationCosts, Southern North Seaand Irish Sea
Facilities Making SafeCosts, Central andNorthern North Sea
Pipeline Making SafeCosts, Central andNorthern North Sea
Topsides PreparationCosts, Central andNorthern North Sea
Source: Oil & Gas UK
Increased Uncertainty in Forecasts
Figure 10

OIL & GAS UK DECOMMISSIONING INSIGHT 2013
page 22
4.3.5 RemovalRemovalencompassestheremovaloftopsides,substructuresandsubseainfrastructure.Priortoremoval,detailedstudiesandengineeringtakeplacetosupportthestructuralseparationandchosenremovalmethod.Beyondthecostsassociatedwithphysicalremoval,thiscomponentalsoincludesexpenditureattributedtotransportationandonshoreload-in.
Topsideremovalcaninvolvere-engineeringandcuttingoftopsidemodules.Mostcommonlytopsideremovalis achieved by the piece-small, reverse-installation or single-liftmethods. Smaller substructures, such asthosecommontothesouthernNorthSea,canberemovedinasingleliftandtransportedonshoreviabargeorliftvessel.Largersubstructuresmayrequiresectioningintomanageablepiecesandmultipleremovallifts.
Theremovalofsubstructures,topsidesandsubseainfrastructureaccountsfor21percent(£2.2billion)ofthetotaldecommissioningexpenditureontheUKCSfrom2013to2022.Pipelineandmattressdecommissioningcostshavebeenaddressedseparatelyinsection4.3.6.
Removal in the Central and Northern North SeaMorethan70percent(£1.6billion)ofthistotalexpenditureonremovalwillbeconcentratedinthecentraland northern North Seawhere £1.1 billion is forecast to be spent on topside removal, £270million onsubstructureremovalandalmost£240millionontheremovalofsubseainfrastructure.ItshouldbenotedthatsomeoperatorshaveprovidedexpenditureandtonnagevaluesforFPSOdecommissioningwithinthesubstructurecategory.
Figure 11: Forecast of Topside, Substructure and other Subsea Infrastructure Removal Tonnage and Expenditure in the Central and Northern North Sea, from 2013 to 2022
(expenditure indicated in purple and scale on the right hand axis)
0
50
100
150
200
250
300
350
400
0
10,000
20,000
30,000
40,000
50,000
60,000
70,000
2013 2014 2015 2016 2017 2018 2019 2020 2021 2022
Fore
cast
Exp
endi
ture
(£ M
illio
n)
Tota
l Ton
nage
to b
e Re
mov
ed
YearSubsea Infrastructure Substructure Topside Total Removal Expenditure
Source: Oil & Gas UKSource: Oil & Gas UK
Increased Uncertainty in Forecasts

OIL & GAS UK DECOMMISSIONING INSIGHT 2013
page 23
Thepatternofhighactivityandincreasingexpenditurefrom2015to2017reportedlastyearhasalsobeenreflectedinthisyear’sforecasts.Althoughtonnagehasincreasedmarginally,similarexpenditureforecastsare reported.
Removalexpenditureoverthenexttenyears inthecentralandnorthernNorthSeapeaksbetween2015and2018,atthesametimeasthe‘makingsafe’andtopsidepreparationactivity.Over200,000tonnesofmaterialisscheduledforremovalinthisperiodonaccountofalimitednumberoflargeintegratedplatformprojects.Someslightdiscrepancyinmappingactivitytoexpenditurecanbeseenduetotheabilitytospreadthecostdatabutnotactivityoverthetimeframe.Topsideremovalcostsarequitevariableandwillbegreatlyinfluencedbythetype,sizeandcomplexityofthemodulesbeingremoved.
Overall, from2013to2022,nearly340,000tonnesare toberemoved in thecentralandnorthernNorthSea.Thisincludesover230topsidemodules(270,000tonnes),approximately53,000tonnesofsubstructure,morethan9,000tonnesofothersubseainfrastructure,suchasmanifoldsandsubseaisolationvalves(SSIV),andover7,000tonnesofmattresses.Thesignificantvolumesoftopsidematerialtoberemovedwillrequirea variety of removal methods to be employed and, depending on the integrity of the asset, significantengineeringmayberequired.Assubstructureremovalpeaksbetween2016and2018,alargedemandforheavyliftvesselsisexpected.
Baseduponthesurveyresults,theaveragetopsidemoduleweighsapproximately1,100tonnesandcosts£4,100per tonne to remove.Thesefigures closelyalignwith the2012average removal forecasts. Jacketremoval(notincludingFPSOsubstructureremovalcostsortonnage)isforecasttocost£4,300pertonnetoremove,ahigherfigurethanpreviouspredictions.Thelargersamplesizehasprovidedmorerepresentativeforecastsforremovalaveragespertonne.Actualremovalcostsaredependentonawidevarietyoffactors,suchaslocation,weather,previousexperienceandageofinstallation.

OIL & GAS UK DECOMMISSIONING INSIGHT 2013
page 24
Removal in the Southern North Sea and Irish SeaIn the southern North Sea and Irish Sea, the forecast for removal expenditure is almost £600 million (seeFigure12below)andaccountsfor75,000tonnesoftopsides,46,000tonnesofsubstructureandnearly3,000tonnesofsubseainfrastructure.Afurther6,000tonnesofmattresseswillalsoberemovedbutarenotaccountedforintheremovalexpenditure.
Theaveragetopsidemodule in thesouthernNorthSeaand IrishSeaweighsapproximately1,000tonnesandcostsjustover£3,600pertonnetoremove.Jacketremovalforecasts(notincludingFPSOsubstructureremovalcostsortonnage)total£5,700pertonne.Actualremovalcostsaredependentonawidevarietyoffactorssuchaslocation,weather,previousexperienceandageofinstallation.
InthesouthernNorthSea,platformsarecommonlyremovedinonepieceandinthe2013surveyoperatorswere asked to include topside and substructure costs in the substructure cost category if a removalis expected to be by single lift. Removal activity in this region runs from 2013 through to 2022. In thistimeframe,almost40,000tonnesoftopsidesandsubstructuresareexpectedtoberemovedin2020alone. Thispeakrelatestolessthan10individualprojects.Comparisonwiththe2012surveyillustratesaspreadingofactivityinthenearterm.
Figure 12: Topside, Substructure and Other Subsea Infrastructure Removal from the Southern North Sea and Irish Sea, from 2013 to 2022
(expenditure indicated in purple and scale on the right hand axis)
0
50
100
150
200
250
0
5,000
10,000
15,000
20,000
25,000
30,000
35,000
40,000
45,000
2013 2014 2015 2016 2017 2018 2019 2020 2021 2022
Fore
cast
Exp
endi
ture
(£ M
illio
n)
Tota
l Ton
nage
to b
e Re
mov
ed
YearSubsea Infrastructure Substructure Topsides Total Removal Expenditure
Source: Oil & Gas UK
Increased Uncertainty in ForecastsFigure 12

OIL & GAS UK DECOMMISSIONING INSIGHT 2013
page 25
Removal Supply ChainEachremovalmethodhasitsownindividualmeritsandprojectcompatibility.Ifdecommissioningactivityistoriseasforecasted,thisoffersopportunitiesandchallengesforthesupplychaintoexpandliftcapacity.Forexample,newsingle-liftvesselswithconsiderableliftcapacityareduetoenterthemarket.
At present, the largest single lift achievedon theUKCSduringdecommissioningusing a heavy lift vesselwasfortheremovaloftheFriggTCP2modulesupportframeat8,500tonnes.Someheavyliftvesselsareequippedwithtandemcranesallowingatotalcranecapacityinexcessof14,000tonnes,however,removalisdictatedbythegeometryoftheliftandtheintegrityoftheinstallation,whichmeansmultipleliftsareoftenrequired16.Atpresent therearea limitednumberofheavy liftvessel companieswithcapacity to liftandtransport such tonnage.
Dataonthelimitednumberofplatformssuccessfullydecommissionedupuntil2011revealsthatthemajorityoftopsideweightliftedhasbeenrestrictedtobelow5,000tonnes.Almostathirdoftopsideweightremovedwaslessthan500tonnesandtwothirdsofsubstructureremovalhasoccurredinthesouthernNorthSeaforsubstructuresbelow1,000tonnes.Forecastswouldthereforesuggestthatthesupplychainwillneedtobecomeaccustomedtotheremovaloflargerweightsandvolumesasdecommissioningactivityincreases.
Furthermore,astudyoffabricationactivityofUKoilandgasstructureshasshownthatmanysteelstructuresrangingfrom4,000toover20,000tonneshavebeenapprovedfor fabricationbetween2008and201317.Manyofthesestructuresareforecasttobereadyforproductionbetweennowand2017,whichisexpectedtocreatesignificantcompetitionforheavyliftvesselsduringpeakperiodsofinstallationandremovalactivity,particularlyasthereisnotanestablishedservicebaseofheavyliftvesselsspecificallyfordecommissioning.Theflexibilityoftimingindecommissioningprogrammeswill,nevertheless,allowthesupplychaintoadapttothisdemand.Itisbeneficialtominimisethedecommissioningprogrammeschedule,becausethelongeraninstallationremainsinpre-NUI,thehigherthefacilityrunningcostsandoveralloutlays.
16SeeOil&GasUK’spublicationonThe Decommissioning of Steel Piled Jackets in the North Sea Region (October2012)at:http://www.oilandgasuk.co.uk/cmsfiles/modules/publications/pdfs/OP074.pdf17 See Oil & Gas UK’s Economic Report 2013at:http://www.oilandgasuk.co.uk/2013-economic-report.cfm

OIL & GAS UK DECOMMISSIONING INSIGHT 2013
page 26
4.3.6 PipelineandMattressDecommissioningPipelinesareintegraltofieldlifeextensionandfuturedevelopmentopportunitiesanditisofbenefittotheUKCSbasinthatmajorpipelinesaredecommissionedlater.Thedecommissioningofpipelinesandmattressescanoccuratseveralstages,includingwellsP&A,‘makingsafe’andremoval.
Thisyear,pipelinedatahavebeengatheredforthekilometresandnumberoftrunklines,‘otherpipelines’andumbilicals,alongsidethenumberofmattresses.Forthissurvey,’otherpipelines‘areclassifiedasthosewhichfalloutwiththetrunklinkcriteriaofmorethan16inchesindiameterandinexcessof18kilometresinlength.
It shouldbenotedthatas this is thefirstyear that this informationhasbeengathereda limitednumberofoperatorshaveprovidedonlythenumberandnotthelengthofpipelines.Improvementstothesurveyformatwillbeconsideredinfutureyears.
From2013to2022,forecastssuggestover2,300kilometres(nearlyninepercentofthetotalpipelinelengthontheUKCS)isscheduledfordecommissioninginthenextdecade. PipelineandMattressDecommissioningintheCentralandNorthernNorthSeaIn the central and northern North Sea, decommissioning of pipelines and mattresses is estimated to costover £400 million from 2013 to 2022. Over the ten-year period, nearly 40 trunk lines (130 kilometres), 115 ‘other pipelines’ (420 kilometres), 87 umbilicals (250 kilometres) and almost 900mattresses have beenidentifiedfordecommissioningintheseregions,withsignificantexpenditurefrom2019to2022.Theseforecastswouldsuggestthatpipelinedecommissioningwilloccurtowardsthelatterendofdecommissioningprogrammes.Thepeakin2019canbeattributedtoatleasttenpipelinedecommissioningprojects.
Despite having a similar number of pipelines as the southernNorth Sea, the decommissioning of ‘otherpipelines’ in thecentralandnorthernNorthSea isconsiderablymoreexpensive.Thiswouldsuggest thatmorecomplexworkisrequiredtodecommissionpipelinesinthisarea.
Figure 13: Forecast of Pipeline and Mattress Decommissioning Expenditure in the Central and Northern North Sea, from 2013 to 2022
0
20
40
60
80
100
120
140
2013 2014 2015 2016 2017 2018 2019 2020 2021 2022
Fore
cast
Exp
endi
ture
(£ M
illio
n)
YearMattresses Umbilicals Other Pipelines Trunk Lines
Increased Uncertainty in Forecasts
Source: Oil & Gas UK

OIL & GAS UK DECOMMISSIONING INSIGHT 2013
page 27
PipelineandMattressDecommissioningintheSouthernNorthSeaandIrishSeaDecommissioningofpipelinesandmattressesinthesouthernNorthSeaandIrishSeatotalsover£100millionfrom 2013 to 2022. In this region, four trunk lines (64 kilometres), 116 other pipelines (1,300 kilometres),21 umbilicals (150 kilometres) and over 2,100 mattresses have been scheduled for decommissioning. Thereisafairlyconsistentforecastannualexpenditurefrom2014to2022,averagingaround£12millionperyear.
Aconsiderablylargerlengthof‘otherpipelines’aretobedecommissionedinthesouthernNorthSeaandIrishSea,andmattressdecommissioningexpenditureandactivityisalsoconsiderablyhigherinthesouthernNorthSea.Due to themobilenatureof the seabed in this region,additionalmattressesare required forpipelinestabilisation.
A largenumberof satellitedevelopmentsandNUIplatformscharacterise thesouthernNorthSea.Thesedevelopmentswillhavevariouspipelinesassociatedwiththemandthenumberof ‘otherpipelines’tobedecommissionedisroughlysimilartothenumberofplatforms.ThissuggeststhatinthesouthernNorthSeatheremovalofpipelinesoccursatthesametimeasfacilitydecommissioning.
Figure 14: Forecast of Pipeline and Mattress Decommissioning Expenditure in the Southern North Sea and Irish Sea, from 2013 to 2022
0
5
10
15
20
25
2013 2014 2015 2016 2017 2018 2019 2020 2021 2022
Fore
cast
Exp
endi
ture
(£ M
illio
n)
YearMattresses Umbilicals Other Pipelines Trunk Lines
Increased Uncertainty in Forecasts
Source: Oil & Gas UK

OIL & GAS UK DECOMMISSIONING INSIGHT 2013
page28
4.3.7 Topsides and Substructure RecyclingTopsideandsubstructurerecyclingaspartofthedecommissioningprocesscapturesactivityandexpenditurerelatedtotheonshorecleaningandhandlingofhazardouswaste,deconstruction,reuse,recycle,disposalandwastemanagementaccounting.
Following thewaste hierarchy, reuse, recycling and onshore disposal are preferred options to dealwithdisused offshore structures. Once the structures are brought onshore the dismantling and processing ishandledbyspecialistlicensedsites.
Reuseisdefinedasanyactivitythatlengthensthelifeofanitemwhilestillbeingusedforitsoriginalpurposeandcanoftenbeconfusedwith recycling,which is the reprocessingofan item intoanewrawmaterial.Althoughmore challenging, reuse often proves to be particularly cost efficient and can help to addressthe challengeofwastedisposal. Thedecision to reuse, recycleor dispose to landfill canoftenbedrivenbyanumberofcommonfactorsincludingtheamountofmaintenancerequired,orprevalenceofobsoletetechnologyandtheamountofhazardousmaterialonanasset.
Topsidesaremadefromavarietyofmaterialsandmaycontainhazardoussubstances.Thesafedismantlingandwastemanagementoftopsidestructurescanposeagreaterchallengethanthemanagementofsubstructureswhicharepredominantlymadeofsteelandcanbeprocessedandrecycled.Recentdecommissioningprojectsdemonstratehighlevelsofreuseandrecyclingat95percentofallrecoveredmaterial18.ExamplesofreuseandrecyclingofmaterialfromtheUKCSincludePerenco’sreuseoftopsidesfromtheirsouthernNorthSeaWellandplatformforanewdevelopmentinWestAfricaandtheuseofNorthWestHutton’saccommodationmoduleasanofficefacilityatadisposalyard.
In the 2013 decommissioning survey, topside and substructure recycling activity has been captured astotalonshoretonnagevolumes,includingsubseainfrastructure.£120millionisforecasttobespentonthetransport, process andmanagementof thesematerials in thenextdecadeandover405,000 tonnesareexpectedtocomeonshore.Seventy-fivepercentofthisactivitywilloccurfromprojectsinthecentralandnorthernNorthSea.Forallregionsthepatternoftonnagecomingonshorecorrespondsto,orfollows,periodsofremovalactivity.
Thechosenoffshoreremovalmethodhasimplicationsforonshoredisposal,asthesizeofvessel,aswellastheweightanddimensionsofthematerialremoved,willdictatewheredisposalcantakeplace.AninformalstudyofdisposalyardsillustratedthatthereareanumberofstrategicallylocatedUKonshoredisposalyards.Manyofthesehavethefacilities,space,equipmentandexpertisetodealwithlargevolumesandweightsofdecommissionedmaterial,withsomealsohavingthecapabilitytoexpandshouldthemarketdictatethis.However,itisclearthattheyardscurrentlyexperiencesporadicdecommissioningactivityandthereforethismarkethasyet tobe fully tested.Someyardsmayalsoundertakeboth fabricationanddecommissioningactivities,whichmaycreatecompetitionforspace.
18SeeOil&GasUK’spublicationonThe Decommissioning of Steel Piled Jackets in the North Sea Region (October2012)at:http://www.oilandgasuk.co.uk/cmsfiles/modules/publications/pdfs/OP074.pdf

OIL & GAS UK DECOMMISSIONING INSIGHT 2013
page 29
Figure 15: Forecast of Onshore Tonnage from Decommissioned Structures from the UKCS, from 2013 to 2022 (expenditure indicated by purple and green and scale on right axis)
4.3.8 SiteRemediationandMonitoringSite remediation activities include pile management, decommissioned oil field debris clearance (witha500-metrezoneand200-metrepipelinecorridor)andover-trawlsurveys.
Expenditureforsiteremediationisforecastatatotalofover£300millioninthenextdecade,withactivitypeakingfrom2018to2020asremovalactivityiscompleted.
Monitoring is the final stage in the decommissioning process; operators are required to carry out post-decommissioningsurveysandmonitorthesitebeyondphysicaldecommissioning.Thespecificdetailsoftheprogrammeareagreedwiththeregulatoronaprojectbyprojectbasis.
In the 2012Decommissioning Insight, only £1.4millionwas reported for carrying outmonitoring as themajority of activity was outside the timeframe of that survey. In this year’s survey, a total forecast of £30millionhasbeencapturedgiventheextendedtimeframeasmonitoringactivitybeginsattheendstageofdecommissioningprojects.
NearlyallofthesiteremediationandmonitoringexpenditurecanbeattributedtothecentralandnorthernNorthSea.Lookingatprojectactivity in thesouthernNorthSeaand IrishSea, thisactivity isoutsidethetimeframeofthissurvey.
Figure 15
0
10
20
30
40
50
60
0
10,000
20,000
30,000
40,000
50,000
60,000
70,000
80,000
90,000
100,000
2013 2014 2015 2016 2017 2018 2019 2020 2021 2022
Fore
cast
Exp
endi
ture
(£ M
illio
n)
Ons
hore
Ton
nage
YearOnshore Tonnage, Southern North Sea and Irish Sea
Onshore Tonnage, Central and Northern North Sea
Topside and Substructure Onshore Recycling Costs, Southern North Sea and Irish Sea
Topside and Substructure Onshore Recycling Costs, Central and Northern North Sea
Increased Uncertainty in Forecasts
Source: Oil & Gas UK
Figure 15
OIL & GAS UK DECOMMISSIONING INSIGHT 2013
page 30
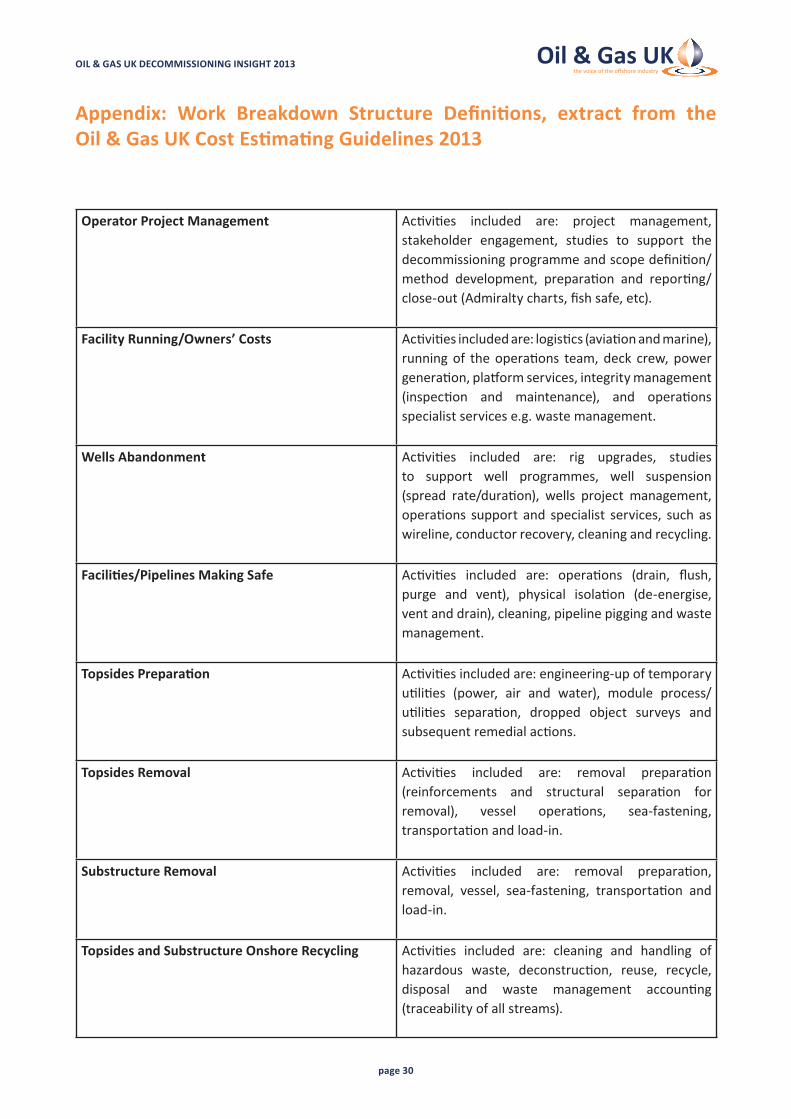
Appendix: Work Breakdown Structure Definitions, extract from the Oil&GasUKCostEstimatingGuidelines2013
Operator Project Management Activities included are: project management,
stakeholder engagement, studies to support thedecommissioningprogrammeandscopedefinition/method development, preparation and reporting/close-out(Admiraltycharts,fishsafe,etc).
Facility Running/Owners’ Costs Activitiesincludedare:logistics(aviationandmarine),runningof theoperations team,deck crew,powergeneration,platformservices,integritymanagement(inspection and maintenance), and operationsspecialist services e.g. waste management.
Wells Abandonment Activities included are: rig upgrades, studiesto support well programmes, well suspension(spread rate/duration), wells project management,operations support and specialist services, such aswireline,conductorrecovery,cleaningandrecycling.
Facilities/PipelinesMakingSafe Activities included are: operations (drain, flush,purge and vent), physical isolation (de-energise,ventanddrain),cleaning,pipelinepiggingandwastemanagement.
TopsidesPreparation Activitiesincludedare:engineering-upoftemporaryutilities (power, air and water), module process/utilities separation, dropped object surveys andsubsequentremedialactions.
Topsides Removal Activities included are: removal preparation(reinforcements and structural separation forremoval), vessel operations, sea-fastening,transportationandload-in.
Substructure Removal Activities included are: removal preparation,removal, vessel, sea-fastening, transportation andload-in.
Topsides and Substructure Onshore Recycling Activities included are: cleaning and handling ofhazardous waste, deconstruction, reuse, recycle,disposal and waste management accounting(traceabilityofallstreams).

OIL & GAS UK DECOMMISSIONING INSIGHT 2013
page 31
SubseaInfrastructure(pipelines,umbilicals) Activities included are: vessel preparation forsubsea end-state (remove, trench, rock-dump), sea-fastening and transportation, load-in, subseaproject management, waste managementaccounting(traceabilityofallstreams).
SiteRemediation Activities included are: pile management, oil fielddebris clearance (500-metre zone and 200-metrepipelinecorridor)andover-trawlsurveys.
Monitoring Activitiesincludedare:navigationaids,maintenanceand monitoring programme for any facilities thatremain.
Note:Althoughlogistics(aviationandmarine)areonlyitemisedhereforfacilityrunning/operatorcoststheyshouldbeassignedtoeachstage,asappropriate.

OIL & GAS UK DECOMMISSIONING INSIGHT 2013
page 32
Notes


www.oilandgasuk.co.uk
Oil&GasUK(Aberdeen)2nd FloorTheExchange262 Market StreetAberdeenAB115PJ
Tel:01224577250
Oil&GasUK(London)6thFloorEastPortland House BressendenPlaceLondon SW1E5BH
Tel:02078022400 [email protected]
ISBN1903004128©2013TheUKOilandGasIndustryAssociationLimited,tradingasOil&GasUK.