decreased brain venous vasculature visibility on
TRANSCRIPT

RESEARCH ARTICLE Open Access
Decreased brain venous vasculature visibility onsusceptibility-weighted imaging venography inpatients with multiple sclerosis is related tochronic cerebrospinal venous insufficiencyRobert Zivadinov1,2*, Guy U Poloni1, Karen Marr1, Claudiu V Schirda1, Christopher R Magnano1, Ellen Carl1,Niels Bergsland1, David Hojnacki2, Cheryl Kennedy1, Clive B Beggs3, Michael G Dwyer1 andBianca Weinstock-Guttman2
Abstract
Background: The potential pathogenesis between the presence and severity of chronic cerebrospinal venousinsufficiency (CCSVI) and its relation to clinical and imaging outcomes in brain parenchyma of multiple sclerosis(MS) patients has not yet been elucidated. The aim of the study was to investigate the relationship between CCSVI,and altered brain parenchyma venous vasculature visibility (VVV) on susceptibility-weighted imaging (SWI) inpatients with MS and in sex- and age-matched healthy controls (HC).
Methods: 59 MS patients, 41 relapsing-remitting and 18 secondary-progressive, and 33 HC were imaged on a 3TGE scanner using pre- and post-contrast SWI venography. The presence and severity of CCSVI was determinedusing extra-cranial and trans-cranial Doppler criteria. Apparent total venous volume (ATVV), venous intracranialfraction (VIF) and average distance-from-vein (DFV) were calculated for various vein mean diameter categories: < .3mm, .3-.6 mm, .6-.9 mm and > .9 mm.
Results: CCSVI criteria were fulfilled in 79.7% of MS patients and 18.2% of HC (p < .0001). Patients with MS showeddecreased overall ATVV, ATVV of veins with a diameter < .3 mm, and increased DFV compared to HC (all p <.0001). Subjects diagnosed with CCSVI had significantly increased DFV (p < .0001), decreased overall ATVV andATVV of veins with a diameter < .3 mm (p < .003) compared to subjects without CCSVI. The severity of CCSVI wassignificantly related to decreased VVV in MS (p < .0001) on pre- and post-contrast SWI, but not in HC.
Conclusions: MS patients with higher number of venous stenoses, indicative of CCSVI severity, showedsignificantly decreased venous vasculature in the brain parenchyma. The pathogenesis of these findings has to befurther investigated, but they suggest that reduced metabolism and morphological changes of venous vasculaturemay be taking place in patients with MS.
BackgroundMultiple sclerosis (MS) is considered a chronic, autoim-mune, inflammatory disease of the central nervous system(CNS) characterized by inflammation, demyelination, axo-nal loss, and neurodegeneration [1].Thin, linear periventricular white matter (WM) lesions
(Dawson’s fingers) present in the initial stages of MS are
often oriented around the long axis of central veins [2].Histopathological studies have confirmed the close rela-tionship between inflammatory MS lesions and venouscerebral microvasculature, suggesting that the primaryinflammatory process in MS regionalizes around bloodvessels, with acute lesions showing lymphocytic perivas-cular infiltration, hypercellularity, macrophage infiltra-tion and intra-macrophage myelin debris [3].Early MR venography (MRV) studies suggest that a
substantial number of MS lesions are crossed by well* Correspondence: [email protected] Neuroimaging Analysis Center, University at Buffalo, Buffalo, NY, USAFull list of author information is available at the end of the article
Zivadinov et al. BMC Neurology 2011, 11:128http://www.biomedcentral.com/1471-2377/11/128
© 2011 Zivadinov et al; licensee BioMed Central Ltd. This is an Open Access article distributed under the terms of the CreativeCommons Attribution License (http://creativecommons.org/licenses/by/2.0), which permits unrestricted use, distribution, andreproduction in any medium, provided the original work is properly cited.

defined central veins [4]. These findings have been con-firmed and extended by recent ultra-high-field 7T MRIstudies which showed that a majority of MS lesions areassociated with centrally coursing veins [5-7]. Closeexamination revealed well defined central veins sur-rounded by subtle abnormalities in signal intensities in astrict perivenous fashion, with vascular wall involvement[7,8].Susceptibility-weighted imaging (SWI) venography can
directly image cerebral veins using deoxyhemoglobin asan intrinsic contrast agent and, therefore, allows directand non-invasive assessment of venous blood oxygena-tion saturation and visualization of the venous struc-tures [9]. A recent pre-contrast SWI venography studyshowed significantly reduced periventricular WMvenous vasculature visibility (VVV) in relapsing-remit-ting (RR) MS patients as compared to healthy control(HC) subjects [10].The hypothesis that MS might be related to venous
pathology has been considered in the past [3,11-13].Recently, a condition called chronic cerebrospinalvenous insufficiency (CCSVI) has been proposed andreported with high frequency in MS [14,15]. CCSVI isdescribed as a vascular condition characterized byanomalies of the main extra-cranial cerebrospinalvenous routes that interfere with normal blood outflowof brain parenchyma in patients with MS [14-16]. Thepathogenesis between the presence and severity ofCCSVI and its relation to clinical and imaging outcomesin brain parenchyma of MS patients has not yet beenelucidated. In two recent pilot studies, by using perfu-sion-weighted imaging (PWI) and cerebrospinal fluid(CSF) imaging, we showed that there are drainage pro-blems in patients with MS associated with presence andseverity of CCSVI [17,18].Therefore, the aim of this study was to extend our
preliminary results by investigating the relationshipbetween the presence and severity of CCSVI and alteredVVV in the brain parenchyma on pre- and post-contrastSWI venography in patients with MS and in HC.
MethodsThis study was part of the Combined Trans-cranial andExtra-cranial Venous Doppler (CTEVD) study [19] thatinvestigated the prevalence of CCSVI in patients withMS, clinically isolated syndrome (CIS), other neurologi-cal diseases (OND), and healthy controls (HC), usingspecific proposed Doppler criteria [14].Fifty-nine (59) consecutive MS patients [41 RR and 18
secondary-progressive (SP)], and 33 age- and sex-matched consecutive HC were enrolled in this sub-study. Inclusion criteria were: RR or secondary-progres-sive (SP) disease course for MS patients, [20] age 18 to65 years, Expanded Disability Status Scale (EDSS) [21] 0
to 6.5, and undergoing MRI scan with SWI venography.Exclusion criteria were: presence of relapse and steroidtreatment in the 30 days preceding study entry for allpatients, pre-existing medical conditions known to beassociated with brain pathology (e.g., cerebrovasculardisease, positive history of alcohol abuse, etc.), contrain-dication for having a contrast agent injected for MRIexamination, history of cerebral congenital vascular mal-formations, or pregnancy.Participants underwent a clinical and MRI examina-
tion and trans-cranial and extra-cranial Doppler scansof the head and neck. Doppler personnel were blindedto the subjects’ status [19]. In particular, subjects werespecifically instructed not to reveal their disease statusduring the Doppler examination. OND and CIS patientswere not part of this CTEVD SWI venography sub-study, but were used as part of the overall population toensure blinding in the CTEVD study. The MRI evalua-tors were completely blinded to subject’s disease, clinicaland CCSVI status.The study was approved by the local Institutional
Review Board and informed consent was obtained fromall subjects.
Doppler evaluationThe Doppler exam was performed using Esaote-Bio-sound MyLabGOLD25 ultrasound machine equippedwith 2.5 and 7.5-10 MHz transducers and motorizedchair capable of tilting from 0° to 90°. All study exami-nations were performed by the same Doppler technolo-gist. We examined Doppler parameters that detect 5anomalous venous hemodynamic (VH) criteria affectingcerebrospinal venous return, as previously described[14]. These include: 1) reflux in the IJV and/or in theVV assessed in both sitting and supine postures, 2)reflux in the deep cerebral veins (DCV), 3) B-modedetection of annuli, webs, septa, flaps or stenosis in theIJV, 4) absence of an ECD signal in the IJV and/or inthe VV, even after forced deep breaths, and 5) presenceof a negative difference in the cross sectional area of theIJV. More specific information is provided elsewhere[19].Each subject was assigned a total VH criteria score
which was calculated by counting the number of criteriathat the subject fulfilled. A subject was consideredCCSVI-positive, if ≥2 VH criteria were fulfilled, as pre-viously proposed [14]. We also calculated the venoushemodynamic insufficiency severity score (VHISS) [18].The overall VHISS score is defined as a weighted sumof the scores contributed by each individual VH criter-ion. The formula for VHISS calculations was: VHISS =VHISS1 + VHISS2 + VHISS3 + VHISS4 + VHISS5. TheVHISS score is an ordinal measure of the overall extentand number of VH flow pattern anomalies, with a
Zivadinov et al. BMC Neurology 2011, 11:128http://www.biomedcentral.com/1471-2377/11/128
Page 2 of 15

higher value of VHISS indicating a greater severity ofVH flow pattern anomalies. The minimum possibleVHISS value is 0 and the maximum 16.
MRI acquisition and analysisAll subjects were examined on a 3 Tesla GE SignaExcite HD 12.0 Twin Speed 8-channel head coil scanner(General Electric, Milwaukee, WI).SWI data was collected in all patients using a 3-
Dimensional (3D) flow-compensated GRE (GradientRecalled Echo) sequence with 64 locs/slab, 2 mmthick, a 512 × 192 matrix, FOV = 25.6 cm × 19.2 cm(512 × 256 matrix with in plane phase FOV = 0.75),for an in-plane resolution of 0.5 mm × 1 mm. Otheracquisition parameters were: flip angle FA = 12, echoand repetition times (TE and TR) TE/TR = 22/40 ms,for an acquisition time AT = 8:46 min:sec. k-spacedata, as saved by the scanner (p-files) was saved andtransferred to an offline Linux workstation for postprocessing using in-house developed software writtenin Matlab (MathWorks Inc.). Forty-eight of the 59(81.4%) MS patients and 7 of 33 (21.1%) HC enrolledin the study obtained a second SWI scan after a singledose intravenous bolus of 0.1 mMol/Kg Gadolinium(Gd)-DTPA 10 min after injection. In order to testreproducibility and obtain preliminary data on our pre-and post-contrast experiment in HC, it was originallydecided that 20-25% of the HC cohort be included inthe contrast study. Additional MRI sequences acquiredincluded 2D multi-planar dual fast spin-echo (FSE)proton density (PD) and T2-weighted image (WI),Fluid-Attenuated Inversion-Recovery (FLAIR), 3D highresolution (HIRES) T1-WI using a fast spoiled gradientecho (FSPGR) with magnetization-prepared inversionrecovery (IR) pulse and spin echo (SE) T1-WI bothwith and without a single dose intravenous bolus of0.1 mMol/Kg Gd-DTPA 5 min after injection (in 48MS patients). The relevant parameters were as follows:for dual FSE PD/T2, echo and repetition times (TEand TR) TE1/TE2/TR = 9/98/5300 ms, flip angle (FA)= 90°, echo train length ETL = 14; for FLAIR, TE/TI/TR = 120/2100/8500 ms (inversion time, TI), FA =90°, ETL = 24; for SE T1-WI, TE/TR = 16/600 ms, FA= 90; for 3D HIRES T1-WI, TE/TI/TR = 2.8/900/5.9ms, FA = 10°. The 3D HIRES T1-WI scan was usedfor brain volume segmentation.
SWI reconstructionThe k-space data, as saved by the scanner, include apreliminary zero filling in the z-direction. This is a stan-dard feature of the sequence as implemented by themanufacturer and is not modifiable at the level of thegraphical interface of the scanner. Data for each channel
was reconstructed by zero-filling each slab location(slice) to 768 × 576, to produce images with an interpo-lated resolution of 0.33 mm × 0.33 mm. To ensureproper composition of multi-channel data for the mag-nitude and phase images, a channel re-centering andnormalization process was employed, as previouslydescribed [22,23]. Following channel recombination, themagnitude image was processed using the non-para-metric non-uniform intensity normalization program N3[23,24]. Phase images were high-pass filtered using a192 × 144 Hanning window for vein analysis, as sug-gested by Haacke et al. [25] The high-pass filtered phaseimage was used to generate a phase mask, as previouslydescribed [23,25]. SWI images were obtained by multi-plying the phase mask four times onto the inhomogene-ity-corrected magnitude image. SWI venograms weregenerated by performing a minimum Intensity Projec-tion (mIP) over 5 2-mm thick sections and moving themIP stack by one slice at a time.
Vein extractionQuantification of SWI venous blood voxels was per-formed by extracting the venous structures of the brainfrom pre- and post-contrast SWI data using an in-house-developed segmentation method. The main com-ponent of the method is the vesselness filter describedby Sato et al., [26] based on the second order informa-tion from the SWI mIP, represented by the Hessianmatrix (the 3 × 3 matrix generated by the second deri-vatives of the image intensities in three spatial direc-tions). By analyzing the eigenvalues (lj) of the Hessian,a likeliness function was defined to distinguish tubularstructures (vessels) from non-tubular structures (e.g.,background noise, brain parenchyma, cerebrospinalfluid). The Hessian is calculated at a particular spatialscale that is varied to detect vessels of different dia-meters. The eigenvalues (lj) of the Hessian, sorted byincreasing magnitude (|l1| < |l2| < |l3|), describe thelocal second order structure in an image; for instance, ifl2 and l3 have a high value and l1 is low, it means thatthe image intensity is constant or almost constant in asingle direction only and changing rapidly in perpendi-cular directions, indicative of a tubular-like structure.The likeliness function was constructed to enhance darktubular structures based on the eigenvalues and threetuning parameters: (a) defining the scale (s), varied todetect vessels of different diameter, (b) defining the“level of vesselness” (a1), quantitatively specifying thequalitative relation |l1| < < |l2| & |l3| characterizingtubular structures (Figure 1), and (c) restoring vesselcontinuity in fragmented parts (a2), where a highernoise level might result in fragmenting the curvilinearstructures (Equation 1).
Zivadinov et al. BMC Neurology 2011, 11:128http://www.biomedcentral.com/1471-2377/11/128
Page 3 of 15

f (λ1, λ2) =
⎧⎪⎪⎨⎪⎪⎩
exp(
− λ21
2(α1λc)2
)λ1 ≤ 0, λc �= 0
exp(
− λ21
2(α2λc)2
)λ1 > 0, λc �= 0
(1)
The values chosen for the aforementioned parameterswere driven by those suggested by Sato et al., [26] asthey are tuned to the size of the structures of interestand the image voxel size: 0.2 < s < 2, a1 = 0.5, a2 = 2.One of the primary results of the paper by Sato et al.[26] is showing the stability of the results with respectto variations of these parameters around the reportedvalues.Multi-scale filter approach segmentation steps are
represented in Figure 2. To assess the performance ofthe vesselness filter with respect to signal to noise ratio(SNR), the filter output was thresholded and overlaid
onto the original mIP data for visual inspection of thesegmentation process. Visual comparison with mIPimages confirmed that the line-filter had high detectionsensitivity with respect to small vessels, vessel continu-ity, and the reduction of noise and artifacts, both pre-and post-contrast injection. Note that, in order to obtainoptimal 3D projections of the datasets, the brain wasextracted (i.e., the skull was removed) by using the FSL-brain extraction tool [27].Apparent total venous volume (ATVV) measurement
for total vein vasculature was performed in milliliters(ml) and the relative venous intracranial fraction (VIF)was calculated by normalization with respect to theintracranial volume as calculated by the FSL-brainextraction tool, to correct for head size (Figure 3).The size of individual veins was measured in mm,
and 4 groups were created according to their mean
Figure 1 Three-dimensional scatter plot of the eigenvalues of the Hessian matrix. The voxels belonging to linear structures are those forwhich |l2| and |l3| are negative while |l1| is close to zero, resulting in the cluster in the bottom part of the plot.
Zivadinov et al. BMC Neurology 2011, 11:128http://www.biomedcentral.com/1471-2377/11/128
Page 4 of 15

diameters: < .3 mm, .3-.6 mm, .6-.9 mm and > .9 mm.Classification of the vessels in the four size classeswas performed by iterative erosion and dilation of thevein extraction map slice by slice. As a first step, anupsampled map was generated, doubling the numberof voxels in each direction in the axial plane (from768 × 576 to 1536 × 1152); consequently, at eachiteration of the erosion and dilation process the ves-sels size was reduced or increased, respectively, by avoxel unit. By eroding and dilating the vessel maskand taking the difference from the original vesselmask, the linear structures that were a size smallerthan the original voxel size (< .3 mm) were left (Figure3). Iterating this process up to 4 times produced clas-sification of the linear structures in the diameterclasses < .3 mm, .3-.6 mm, .6-.9 mm and > .9 mm. Atevery iteration, a size filter was applied in order toavoid discontinuities in every size-class map due tolocal inhomogeneities or higher noise level. As a mIPimage is used for the underlying processing, the veinvolume measurements, while correlating with theactual vein volume in the brain, tend to increase veinvisibility in the brain over other structures. In particu-lar, this approach enhances the visibility of smallerveins over larger ones, as the former are projected
over multiple neighboring slices, while the latter tendto be projected on themselves.Each vein extraction map was verified by an experi-
enced neuroimager, and any misclassifications weremanually corrected.As a last step, starting from the vein extraction maps,
voxel-wise minimum distance from vein (DFV) mapswere calculated, defined as the distance of each voxelfrom the closest voxel classified as belonging to a vein;in such maps longer distance indicates lower local veindensity (Figure 3). The average value of this map wascalculated over the whole brain, providing an average-distance-from-vein score.Interclass correlation coefficient (ICC) values for all
vein extraction indices were calculated on a set of 5 HCand 5 MS patients that were scanned twice over a oneweek period, both on pre- and post-contrast SWIimages.
SWI pre- and post-contrast experimentIt has been reported that SWI venography can befurther enhanced through the injection of a contrastagent, producing increased sensitivity and image quality[28,29]. The amount of accumulated phase, and there-fore contrast, is proportional to the concentration of thecontrast agent [25]. We previously reported in a pilotstudy that contrast-enhanced SWI significantly increasesthe number and volume of signal hypointensities onSWI venography in T2 lesions and in normal appearingWM (Figure 4) [30]. In order to investigate the SWIVVV parameter differences between pre- and post-con-trast SWI additionally, 48 MS patients and 7 HC under-went both sequences in this study.
Lesion and atrophy analysesT2 hyperintense, T1 hypointense and gadolinium lesionvolumes (LVs) were outlined using a semi-automatededge-detection contouring-thresholding technique [31].Global and regional brain atrophy was determined
with corrections for T1-hypointensity misclassificationusing an in-house developed in-painting program, onthe 3D T1 weighted scans using SIENAX version 2.6., asdescribed previously [32].
Statistical analysesStatistical analyses were performed using the StatisticalPackage for Social Sciences (SPSS, version 16.0). Fordescriptive statistics and estimates of CCSVI prevalenceand its severity, t-tests, Fisher’s exact tests and theMann-Whitney rank sum U-test were used. Given thatnot all VVV indices were normally distributed, weemployed non-parametric statistics. SWI venographydifferences between groups were assessed using theMann-Whitney rank sum U-test. Differences between
Figure 2 Multi-scale filter approach segmentation steps arepresented by: a) recovery of line structures of various widths,b) Hessian eigenvalues (i.e., linear intensity minima) removal ofthe effects of non-linear structures and recovery of the originalstructures as described by Sato et al., [26]c) removal of theeffects of non-uniformity of contrast material, noise andartifacts, and d) 3-dimensionality
Zivadinov et al. BMC Neurology 2011, 11:128http://www.biomedcentral.com/1471-2377/11/128
Page 5 of 15

Figure 3 The images display minimum projection (mIP) (horizontal upper row), apparent total venous volume (ATVV) (horizontalmiddle upper row), ATVV with a diameter < .3 mm (horizontal middle lower row) and average distance from voxel (DFV) map(horizontal lower row) for a healthy control (HC) (vertical left column), relapsing-remitting (RR) (vertical middle column) andsecondary progressive (SP) (vertical right column) multiple sclerosis patients. The images of ATVV and ATVV with a diameter < .3 mmdisplay the differences between HC, RR and SP MS patients [please note decreased ATVV (represented in light blue for ATVV and light green forATVV with a diameter < .3 mm)] especially in the ventricular, periventricular white matter, deep gray matter and cortical structures between HCand MS patients, but no difference between RR and SP MS patients. The DFV maps show the differences between HC, RR and SP MS patients(please note that the green color represents distance closer to the veins, whereas the yellow and orange colors represent longer distance to theveins). RR and SP MS show more yellow and orange color compared to HC.
Zivadinov et al. BMC Neurology 2011, 11:128http://www.biomedcentral.com/1471-2377/11/128
Page 6 of 15
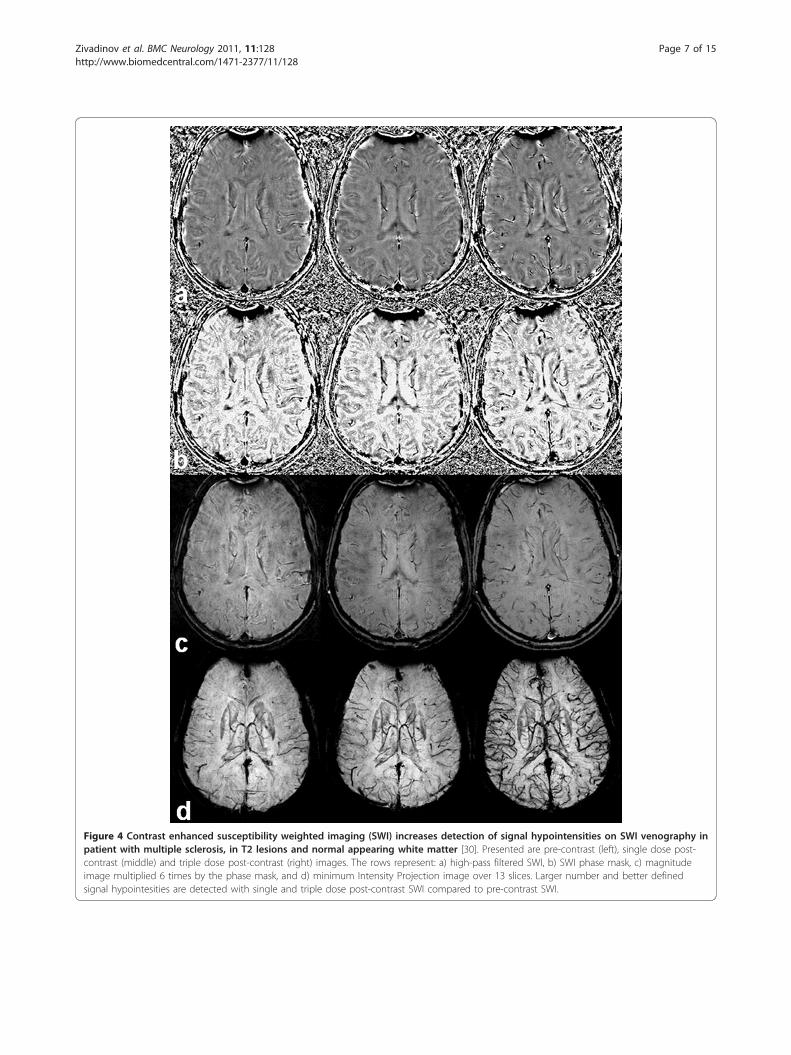
Figure 4 Contrast enhanced susceptibility weighted imaging (SWI) increases detection of signal hypointensities on SWI venography inpatient with multiple sclerosis, in T2 lesions and normal appearing white matter [30]. Presented are pre-contrast (left), single dose post-contrast (middle) and triple dose post-contrast (right) images. The rows represent: a) high-pass filtered SWI, b) SWI phase mask, c) magnitudeimage multiplied 6 times by the phase mask, and d) minimum Intensity Projection image over 13 slices. Larger number and better definedsignal hypointesities are detected with single and triple dose post-contrast SWI compared to pre-contrast SWI.
Zivadinov et al. BMC Neurology 2011, 11:128http://www.biomedcentral.com/1471-2377/11/128
Page 7 of 15

pre- and post-contrast SWI VVV measures in individualMS patients were assessed using the Wilcoxon signedrank test. Correlation analysis between severity ofCCSVI (VHISS) and pre- and post-contrast VVV para-meters was performed using the Spearman rank correla-tion coefficient. The primary null hypothesis was thatthere is no association between CCSVI and MRI brainparenchyma vein pathology. As a robust test of thehypothesis that does not assume a relationship betweenCCSVI and brain parenchyma vein pathology, we exam-ined differences in MRI variables in the entire cohort ofsubjects with and without CCSVI. If significance wasfound, we performed the same comparison in individualdiagnostic subgroups and MS disease subtypes. Due tomultiple comparisons, only a nominal two-tailed p-value< .01 was considered statistically significant.
ResultsDemographic and clinical characteristicsTable 1 shows demographic, clinical and conventionalMRI characteristics of MS patients and HC. The mediannumber of days between Doppler and MRI examinationwas 3. There were no age or sex differences betweenMS patients and HC. As expected, the SP patients wereolder, had longer disease duration and higher EDSS (p <.0001). There were no significant demographic and clini-cal differences between those who participated in theSWI venography portion of the CTEVD study and thosewho did not. There were no significant age, sex, diseaseduration or conventional MRI characteristics differencesbetween the 48 MS patients and 7 HC who obtainedpre- or post-contrast SWI scans and the entire study
cohort. Of the 59 MS patients participating in the study,56 were on disease-modifying therapy.
Scan-rescan datasetICC was slightly higher for the post-contrast SWI seg-mentation VVV measures than for the pre-contrastmeasures (Table 2). All VVV measures showed highICC values and were significant (p < .003). The highestICC were shown for the ATVV (.0.891) with vein sizes> .6 mm being most reproducible. The VIF and DFVICC values ranged between 0.738 and 0.815.
CCSVI status assessmentAll subjects had the 5 VH criteria assessed. Table 3shows the CCSVI classifications by disease group and bydisease subtype. Prevalence of CCSVI was significantlyhigher in MS patients compared to HC (p < .0001). Themeasure of CCSVI severity (VHISS) was significantlyhigher in MS patients compared to HC (p < .0001).There was a higher prevalence of CCSVI in SP com-
pared to RRMS patients, but this difference did notreach significance.
Vein vasculature visibility assessmentTable 4 shows quantitative assessment of brain parench-yma pre- and post-contrast VVV according to diseasegroup and disease subtype. Patients with MS showeddecreased ATVV, ATVV of veins with a diameter < .3mm and increased DVF (all p < .0001). There was also atrend for lower VIF in MS patients (p = .049). Similarpre- and post-contrast VVV values were detected in 48MS patients who underwent both pre- and post-contrast
Table 1 Demographic and clinical characteristics in multiple sclerosis patients and healthy controls.
MS(n = 59)
HC(n = 33)
p RR(n = 41)
SP(n = 18)
p
Female gender, n (%) 43 (72.9) 20 (60.6) NS 28 (68.2) 15 (83.3) NS
Age in years, mean (SD) 44.6 (11) 41.3 (11.1) NS 40.5 (9.6) 53.8 (8.1) < .0001
Age at onset, mean (SD) 30.9 (9.8) —— — 30.6 (8.6) 31.7 (12.3) NS
Disease duration, mean (SD) 13.3 (10) — — 9.5 (5.7) 21.9 (12) < .0001
Expanded Disability Status Scale, mean (SD) median 3.2 (1) 2.5 — — 2.1 (0.9) 2.0 5.9 (1.1) 6.0 < .0001
T2 lesion volume, mean (SD) 12.8 (15.2) 2.3 (2.5) < .0001 8.9 (7.7) 21.9 (23) .0014
T1 lesion volume, mean (SD) 2.5 (6.5) — — 1.3 (2.8) 5.5 (10.6) .016
Gadolinium lesion volume, mean (SD) 0.07 (0.4) — — 0.1 (0.5) 0.01 (0.04) NS
Normalized brain volume, mean (SD) 1545.1 (107.3) 1642.4 (81.8) < .0001 1575.2 (94.5) 1476.4 (105.3) .002
Normalized gray matter volume, mean (SD) 828(97.2)
882.4 (112.8) .022 855.8(93.5)
764.774.5)
< .0001
Normalized white matter volume, mean (SD) 717.1(68.5)
725.6(72.6)
.018 719.5(73)
711.7 (58.3) NS
MS - Multiple Sclerosis; HC - Healthy Controls; RR - Relapsing-Remitting; SP - Secondary Progressive; EDSS - Expanded Disability Status Scale; NS - non significant
All volumes are expressed in milliliters.
The differences between the study groups were tested using the chi-square, Student’s t-test and the Mann-Whitney rank sum test.
Zivadinov et al. BMC Neurology 2011, 11:128http://www.biomedcentral.com/1471-2377/11/128
Page 8 of 15

SWI. However, in 7 HC who underwent pre- and post-contrast SWI, significantly increased ATVV and ATVVof veins were found, as well as DFV on post-contrastscans. Increased ATVV occurred in veins with a dia-meter < .3 mm and a trend for increased ATVV ofveins occurred in veins with a diameter < .3-.6 mm and.6-.9 mm.RRMS patients showed a trend for decreased pre-con-
trast ATVV, ATVV of veins with a diameter < .3 mmand VIF compared to SPMS (all p < .06). Similar post-contrast VVV values were found in 32 RR and 14 SPMS patients who underwent both pre- and post-contrastSWI (Table 4).
Presence of CCSVI and vein vasculature visibilityassessmentTable 5 shows quantitative brain parenchyma VVV inMS patients and HC, according to CCSVI status on pre-contrast SWI. Subjects diagnosed with CCSVI had sig-nificantly increased DFV (p < .0001), decreased ATVVand ATVV of veins with a diameter < .3 mm (p < .003)compared to subjects without CCSVI. There was also atrend for lower VIF (p = .044).
When only MS patients were investigated, significantlyincreased DFV (p = .01) and a trend for decreased VIF(p < .084) were found in subjects with CCSVI comparedto subjects without CCSVI on pre-contrast SWI. Thesedifferences were more pronounced in RRMS subjects,who showed significantly increased DFV (p = .009) anda trend for lower VIF (p = .07). Similar post-contrastVVV differences between MS patients with and withoutCCSVI were found in 48 MS patients. Significantlyincreased DFV (1.28 vs. 1, p = .01) and a trend fordecreased VIF (.061 vs. .066, p = .09) were found in MSpatients with CCSVI compared to subjects withoutCCSVI.No significant differences were observed between sub-
jects with and without CCSVI in HC.No significant differences were observed between sub-
jects with and without CCSVI for other MRI measures.
Severity of CCSVI and vein vasculature visibility and otherMRI measurement assessmentsTable 6 and Figure 5 show the association betweenseverity of CCSVI and quantitative assessment of brainparenchyma VVV on pre- and post-contrast SWI. InMS patients as a group, all quantitative brain parench-yma venous vascular indices, reflecting increaseddamage of venous vasculature, were significantly relatedto higher VHISS (p < .0001) on both pre- and post-con-trast images. The association was particularly strong inRR, but not significant in SP MS patients alone.No significant relationship was observed in HC
between VHISS and VVV indices.
DiscussionThis is the first study to investigate the associationbetween the presence and severity of CCSVI and venousvasculature in the brain parenchyma on SWI venogra-phy in patients with MS and in HC. There are threemain findings in this study: 1) first, by examining onlybrain parenchyma VVV, we found that MS patients arecompromised compared to HC. The novelty of our SWIapproach using pre- and post-contrast SWI venographyexperiment is that its suggests that the reduced venousvisibility in brain parenchyma of MS patients is not onlythe result of reduced metabolism, but may be affectedby possible morphological changes in venous vascula-ture. This was not shown previously by using post-con-trast SWI venography and only one previous study [10]showed similar qualitative (but not quantitative) pre-contrast SWI venography findings; 2) second, by quanti-tatively associating VVV with the presence or absence ofCCSVI, we found significantly increased pre-contrastDFV, decreased ATVV and ATVV of veins with a dia-meter < .3 mm, and a trend for decreased VIF in sub-jects presenting with CCSVI; 3) third, MS patients with
Table 2 Scan-rescan reproducibility in 5 multiple sclerosispatients and 5 healthy controls who underwent pre- andpost-contrast susceptibility-weighted imaging scan oneweek apart.
Pre-contrastSWIICC
Post-contrastSWIICC
ATVV for all vein sizes 0.891 < .001 0.912 < .001
ATVV with diameter < .3 mm 0.812 .002 0.825 .001
ATVV with diameter < .3-.6 mm 0.888 < .001 0.907 < .001
ATVV with diameter < .6-9 mm 0.923 < .001 0.941 < .001
ATVV with diameter > .9 mm 0.935 < .001 0.942 < .001
Venous intracranial fraction 0.791 .002 0.815 .001
Average distance from vein 0.738 .003 0.777 .002
ATVV - apparent total venous volume; mm - millimeters
Intraclass correlation coefficient and p values are presented.
Table 3 Presence and severity of CCSVI in multiplesclerosis patients and healthy controls.
MS(n = 59)
HC(n = 33)
p RR(n = 41)
SP(n = 18)
p
No CCSVI, n (%) 12 (21.3) 27 (81.8) < .0001 11 (26.8) 1 (5.6) NS
CCSVI, n (%) 47 (79.7) 6 (18.2) 30 (73.2) 17 (94.4)
VHISS, mean (SD) 4.9 (3.1) 1.5 (1.6) < .0001 5.2 (3.6) 4.2 (1.4) NS
CCSVI - chronic cerebrospinal venous insufficiency; VHISS - venoushemodynamic insufficiency score; MS - Multiple Sclerosis; HC - HealthyControls; RR - Relapsing-Remitting; SP - Secondary Progressive; NS - nonsignificant
The differences between the study groups were tested using Fisher’s exacttests and the Mann-Whitney rank sum test. All subjects had the 5 venoushemodynamic criteria correctly assessed.
Zivadinov et al. BMC Neurology 2011, 11:128http://www.biomedcentral.com/1471-2377/11/128
Page 9 of 15

higher number of venous stenoses, indicative of CCSVIseverity, showed significantly decreased VVV in thebrain parenchyma on both pre- and post-contrast SWI.The pathogenesis of these findings has to be furtherinvestigated, but they suggest that decreased venous vas-culature in brain parenchyma of MS patients is stronglyrelated to presence and severity of CCSVI. These find-ings are important for better understanding of the MSpathogenesis, and the current findings support results oftwo previous pilot hemodynamic imaging studies (usingPWI and CSF flow measurement) that showed that drai-nage problems in patients with MS are associated withpresence and severity of CCSVI [18,19]. By quantita-tively measuring the most important drainage pathwayfrom brain parenchyma to the periphery, which consistsof the veins themselves, we are confirming and extend-ing the validity of these previous preliminary findings.When MS patients’ subtypes were compared, the asso-
ciation between the severity of CCSVI and altered pre-and post-contrast SWI VVV was stronger in RR than inSPMS patients, and RRMS patients also presented witha trend for more altered pre- and post-contrast SWIVVV compared to the SP group. The significance of
these findings is unclear and should be further explored;however, it could indicate that VVV changes may occurvery early on in the MS disease process.This study did not explore the relationship between
SWI-VVV and markers of inflammation and demyelina-tion in patients with MS from the earliest clinical stages.It could be that the reduced venous visibility in brainparenchyma of MS patients, and consequently decreasedvenous vasculature, is secondary to the presence andseverity of inflammatory and demyelinating lesions thatare accumulating over time in MS patients. Further stu-dies using conventional and non-conventional MRImeasures are needed to determine how presence andseverity of intrinsic lesion damage relates to changes invenous vasculature. Therefore, the pathogenetic role ofour VVV findings should be interpreted with caution.The automated vein extraction segmentation approach
we have developed greatly diminishes the impact ofindividual operators. The algorithm was based on thevesselness filter described by Sato et al., [26], as this wasproven by the authors to be stable and highly reproduci-ble. The intrinsic advantage of this approach lies in itsmulti-dimensionality, allowing for the segmentation of
Table 4 Quantitative brain parenchyma venous vascular assessment in multiple sclerosis patients and healthy controlson pre- and post-contrast susceptibility-weighted images.
MS (n = 59)Pre-contrastMean (SD)
MS (n = 48)Post-contrastMean (SD)
HC (n = 33)Pre-contrastMean (SD)
HC (n = 7)Post-contrastMean (SD)
p-valuea p-valueb p-valuec p-valued
ATVV for all vein diameters 66.9 (16.6) 68.9 (15.1) 82.9 (17.4) 91.6 (18.1) < .0001 < .0001 NS .01
ATVV with diameter < .3 mm 45 (10) 48.9 (7.9) 53.8 (10.2) 61.3(7.7) < .0001 < .0001 NS .01
ATVV with diameter .3-.6 mm 15.5 (4.4) 16.3 (4.6) 17.4 (4.7) 21.2 (5.2) .068 .046 NS .018
ATVV with diameter .6-.9 mm 4.5 (1.8) 4.5 (2) 4.9 (2) 5.3 (2) NS NS NS .044
ATVV with diamater > .9 mm 1.9 (0.9) 1.9 (1.2) 2.1 (0.9) 2.3 (0.9) NS NS NS NS
Venous intracranial fraction 0.061(0.02)
0.062 (0.01) 0.067 (0.01) 0.069 (0.01) .049 .05 NS NS
Average distance from vein 1.24 (0.2) 1.23 (0.4) 1 (0.1) 0.94 (0.1) < .0001 < .0001 NS .018
RR (n = 41)Pre-contrastMean (SD)
RR (n = 32)Post-contrastMean (SD)
SP (n = 18)Pre-contrastMean (SD)
SP (n = 9)Post-contrastMean (SD)
p-valuee p-valuef
ATVV for all vein diameters 64.5 (18.7) 66.5 (17.2) 72.4 (8.3) 74.2 (6.2) .06 NS
ATVV with diameter < .3 mm 43.4 (11.1) 47.7 (8.5) 48.6 (7.1) 51.5 (5.9) .046 NS
ATVV with diameter .3-.6 mm 14.9 (5) 15.4 (5.2) 16.9 (2.1) 18.3 (2) NS .048
ATVV with diameter .6-.9 mm 4.2 (2.1) 4.2 (2.2) 5.2 (0.6) 5.2 (0.4) NS NS
ATVV with diamater > .9 mm 1.8 (1.1) 1.7 (1.4) 2.3 (0.5) 2.1 (0.4) NS NS
Venous intracranial fraction 0.058(0.02)
0.059(0.01)
0.068 (0.008) 0.068(0.008)
.025 .052
Average distance from vein 1.26 (0.2) 1.29 (0.4) 1.22 (0.2) 1.23 (0.2) NS NS
MS - Multiple Sclerosis; HC - Healthy Controls; RR - Relapsing-Remitting; SP - Secondary Progressive; NS - non significant; ATVV - apparent total venous volume
ATVV values are in milliliters and average distance from vein in millimeters.
p valuea - represents pre-contrast SWI VVV measure differences between MS patients and HC, p valueb - represents differences between MS patients post-contrast and HC pre-contrast SWI VVV measures, p valuec - represents pre- and post-contrast SWI VVV measure differences in MS patients, p valued - representspre- and post-contrast SWI VVV measure differences in HC controls, p valuee represents pre-contrast SWI VVV measure differences between RR and SP patients, pvaluef - represents post-contrast SWI VVV measure differences between RR and SP patients.
The differences between the study groups were tested using the Mann-Whitney rank sum test. The differences between pre-contrast and post-contrast SWI VVVmeasures in the same individuals were tested using the Wilcoxon signed rank test.
Zivadinov et al. BMC Neurology 2011, 11:128http://www.biomedcentral.com/1471-2377/11/128
Page 10 of 15

vessels of different sizes, the ability to recover continuityof the structures despite higher local noise levels, andmost of all the fact that it is not based on absolute sig-nal intensity (zero order information) but rather onintensity gradients surrounding each voxel (secondorder information), giving sensitivity to the shape of thestructures. The vesselness filter is integrated into theITK library (Insight Segmentation and RegistrationToolkit, http://www.itk.org/) and has been applied tovessel segmentation on various imaging techniques,including MRI, computerized tomography and opticalcomputerized tomography.The scan-rescan experiment data showed that SWI
venography VVV indices we measured are highly repro-ducible (Table 2). As expected, post-contrast SWI VVVmeasures showed slightly better reproducibility resultsthan pre-contrast measures. Of all different vein dia-meter ATVV measurements we performed, the veinswith larger diameter (> .3 mm) showed better reprodu-cibility than those < .3 mm. This is expected, as the seg-mentation outcome of veins < .3 mm will be mostinfluenced by image quality, movement-related partialvolume effects and image processing steps. These maybe related to different parameters, including image con-trast-to-noise ratio, unwrapping of phase images, filtercharacteristics (tuning parameters, threshold) of theHessian filter, motion artifacts, and change in SNR.However, we inspected all segmentation output of the
images visually. In addition, our reproducibility analysisdid not show that the potential change of these imagingparameters affected the reproducibility of results overone week. On the other hand, VIF and DFV displayed areduced reproducibility. For the VIF, the reason mostlikely lies in the intrinsic uncertainty in the estimationof the intra-cranial volume, which is used to normalizethe VVV across subjects. For the DFV instead, reducedreproducibility is the effect of the enhanced vein visibi-lity which characterizes the mIP maps.SWI is very sensitive in detecting signals from sub-
stances with magnetic susceptibilities that are differentfrom that of their neighbors. Consequently, SWI is ableto detect tissue iron in the form of ferritin, hemosiderinand deoxyhemoglobin, [25,33,34] and is sensitive to thevisualization of small veins in the brain [10]. SWI veno-graphy allows detailed visualization of cerebral veins inthe brain parenchyma without the use of an exogenouscontrast agent [9]. This is possible by exploiting the dif-ference in magnetic susceptibility properties betweenoxygenated and deoxygenated hemoglobin. The abun-dance of the paramagnetic deoxyhemoglobin moleculein the venous blood results in increased local magneticfield inhomogeneity, which in turn leads to spin dephas-ing and signal loss on SWI venography, resulting in
Table 5 Quantitative brain parenchyma venous vascularassessment in multiple sclerosis patients and healthycontrols, according to CCSVI status on pre-contrastsusceptibility-weighted images.
TotalCCSVI(n = 53)
Mean (SD)
Total NoCCSVI(n = 39)
Mean (SD)
p-value
ATVV for all vein diameters (ml) 67.2 (17.8) 78.3 (16.6) .003
ATVV with diameter < 0.3 mm(ml)
45.1 (11) 51 (9.4) .003
Venous intracranial fraction 0.059 (0.02) 0.067 (0.01) .044
Average distance from vein(mm)
1.25 (0.2) 1.1 (0.1) < .0001
MS CCSVI(n = 47)
MS No CCSVI(n = 12)
ATVV for all vein diameters (ml) 65.1 (17.1) 70 (8) NS
ATVV with diameter < 0.3 mm(ml)
44 (10.8) 47 (4.5) NS
Venous intracranial fraction 0.059 (0.02) 0.066 (0.01) .084
Average distance from vein(mm)
1.29 (0.2) 1.08 (0.02) .01
CCSVI - chronic cerebrospinal venous insufficiency; MS - Multiple Sclerosis; NS- non significant; ATVV - apparent total venous volume; ml - milliliters; mm -millimeters
The differences between the study groups were tested using the Mann-Whitney rank sum test.
Table 6 Relationship between the venous hemodynamicseverity score (VHISS) and quantitative brainparenchyma venous vasculature in multiple sclerosispatients on pre-and post-contrast susceptibility-weightedimages.
Pre-contrast MS(n = 59)
RR(n = 41)
SP(n = 18)
r p r p r p
ATVV for all vein diameters(ml)
-0.54 < .0001 -0.7 < .0001 -0.17 .500
ATVV with diameter < 0.3mm (ml)
-0.52 < .0001 -0.67 < .0001 -0.24 .340
Venous intracranial fraction -0.54 < .0001 -0.67 < .0001 -0.12 .653
Average distance from vein(mm)
0.64 < .0001 0.73 < .0001 0.21 .413
Post-contrast MS(n = 48)
RR(n = 36)
SP(n = 12)
r p r p r p
ATVV for all vein diameters(ml)
-0.46 < .0001 -0.47 < .0001 -0.23 .425
ATVV with diameter < 0.3mm (ml)
-0.48 < .0001 -0.53 < .0001 -0.14 .722
Venous intracranial fraction -0.57 < .0001 -0.6 < .0001 -0.28 .354
Average distance from vein(mm)
0.62 < .0001 0.72 < .0001 0.26 .324
MS - Multiple Sclerosis; RR - Relapsing-Remitting; SP - Secondary Progressive;ATVV - apparent total venous volume;
The relationship between VHISS and quantitative brain parenchyma venouswas explored using the Spearman rank correlation coefficient.
Zivadinov et al. BMC Neurology 2011, 11:128http://www.biomedcentral.com/1471-2377/11/128
Page 11 of 15

decreased VVV [10]. One of the key aims of this studywas to address whether the SWI venography VVV dif-ferences between MS patients and HC are only a resultof decreased oxygen utilization in MS patients (withcorrespondent decreased levels of venous deoxyhemo-globin), as previously proposed, [10] or if there werealso morphological changes in the small veins thatbecame atrophic and disappeared due to the MS diseaseprocess, possibly leading to permanent decrease of signalon SWI. Contrast-enhanced SWI significantly increasesthe visualization of number and volume of signalhypointensities on SWI venography [28,29] in T2 lesionsand in normal appearing WM (Figure 4), [30] and maybe an additional means of investigating whether SWIvenography differences between MS patients and HCare due only to hypometabolic status or whether mor-phological changes of veins may be taking place in MSpatients. 81.4% of the MS patients and 21.2% of HCincluded in this study underwent both pre- and post-contrast SWI sequence in order to further elucidate this
important question. We demonstrated a very similardecrease in brain parenchyma VVV on pre- and post-contrast SWI parameters we examined in MS patients,but significantly increased ATVV and ATVV of veinswith a diameter < .3 mm in HC was found, as expected(Table 4). The reduction of vascular visibility on pre-contrast SWI between MS patients and HC was pre-viously observed and attributed to hypometabolic statusin brain parenchyma of MS patients [10]. However, thepre- and post-contrast SWI venography experiment per-formed in the present study further extends understand-ing of this phenomenon and suggests that the reducedVVV in MS may be a combination of two main effects -reduced metabolism and morphological changes of thevenous vasculature. Further cross-sectional and longitu-dinal studies are needed to better elucidate this phe-nomenon. Subtraction technique approaches may beuseful for detecting whether the loss of signal occurs inthe same regions between pre- and post-contrast SWIvenography. In addition, region-specific analysis may
Figure 5 Scatter plots of the pre-contrast SWI venography measures and severity of the CCSVI (VHISS) in multiple sclerosis patients.
Zivadinov et al. BMC Neurology 2011, 11:128http://www.biomedcentral.com/1471-2377/11/128
Page 12 of 15

shed light regarding key areas that are involved. Visualanalysis performed in this study suggests that corticaland deep WM/GM regions may be the most affected(Figure 3).A hypoxia-like condition has been evidenced in
patients with MS [35,36]. It has been shown that hypo-perfusion of the brain parenchyma in MS patients mayprecede disease onset [37,38]. Abnormal perfusion pat-terns within normal appearing WM and GM weredemonstrated in MS patients [38-41]. Chronic inflam-matory events related to local blood congestion and sec-ondary hyperemia of the brain parenchyma areproposed as a cause of these hemodynamic abnormal-ities detected on perfusion MRI in patients with MS[39,42,43]. Whether reduced perfusion of the WM andGM in MS patients is a sign of vascular pathology,decreased metabolic demand [36] or precipitated hemo-dynamic changes in the extra-cranial venous pathways[17] is not clear at this time. We recently reported in apilot study a significant relationship between the severityof CCSVI and hypoperfusion in the brain parenchyma of16 MS patients, but not in 8 healthy controls [17].One of the key findings in this study is that MS
patients presenting with CCSVI (and with increasedseverity of CCSVI, as measured by VHISS) showeddecreased pre- and post-contrast VVV in brain parench-yma on SWI venography. These findings confirm resultsof earlier studies, [38-42] all of which observed signifi-cantly lower perfusion in the brain parenchyma of MSpatients compared with controls. It could be hypothe-sized that decreased venous outflow from the brain par-enchyma to the periphery would lead to increasedintracranial pressure and subsequent venous stasis, espe-cially of the small vein vasculature. Venous pressure wasnot measured in the current study; however, a recentstudy showed no increased intracranial venous pressurein MS patients [44]. Nevertheless, increased venouspressure in the subarachnoid space of MS patients can-not be excluded at this time. Several authors havehypothesized that reduced venous drainage outflow inMS may increase intra-capillary oncotic pressure, whichwould lead to decreased capillary permeability towardthe extra cellular compartment and consequent intra-tis-sue accumulation of toxic metabolites [12,45]. In thepresent study, the association between presence andseverity of CCSVI was particularly strong with VVVindices of small veins. We showed that there was atrend for differences between patients and controls forveins with a diameter < .6 mm. Hypoxia arising fromstasis in the veins might therefore induce morphologicalchanges which could result in occlusion and atrophy ofthese veins. Therefore, the most plausible explanation ofour findings would be that reduced outflow from small
vessels to the periphery–independent of whether it isprimary or secondary to CCSVI or inflammatory anddemyelinating lesions–leads to destruction of smallerveins and consequent loss of signal visibility on SWIvenography. The pathogenesis of this process remainsunanswered at this time and should be exploredtogether with dynamic of regional lesion accumulationover time.This loss of vasculature suggests that rerouting of the
intracranial venous blood flow is probably taking place.If CCSVI is secondary to various vascular, infective andinflammatory processes (this hypothesis could explainthe presence of CCSVI in HC), then the tendency to bechronic in its development may help explain the tem-poral dissociation between the loss of the VVV and nodevelopment of intracranial hypertension. In that con-text, hemodynamic compensatory mechanisms may playa key role. One such mechanism could relate to thedevelopment of extra-cranial collateral circulation[14,16] or altered CSF dynamics [17] that would com-pensate for altered primary outflow pathways.Some recent reports have presented evidence against
the CCSVI hypothesis in MS using Doppler and MRVassessments [46-51]. The conflicting reports of CCSVI-related venous abnormality prevalence findings betweendifferent studies using non-invasive and invasive imagingtechniques emphasize the urgent need for better under-standing of these anomalies. It is also important to placeCCSVI in the context of other known associations inMS, with the most well established MS risk factors andclinical and MRI outcomes. The current study providesimportant evidence that extra-cranial venous abnormal-ities may be related to intra-cranial brain parenchymareduced venous visibility. The dynamic of these findingsshould be further explored.There are a number of limitations to the present
study. One relates to the use of the proposed CCSVIcriteria, [14] which could be insufficient to adequatelydescribe the cerebral venous outflow due to the lack ofassessment of functional data on blood flow velocity andblood volume flow [46]. Evaluation of blood flow velo-city and blood volume flow may offer more completestatus of the cerebral venous outflow in relation todecreased brain parenchyma SWI VVV in patients withMS. Another limit of the study is related to its cross-sectional design and to the relatively small number ofsubjects studied, especially of HC and MS patients atthe early stage of the disease. Due to the nature of SWIphase imaging and associated “blooming” effects, ourmeasurements of venous volume are inherently relativerather than absolute. Finally, the validation of our VVVmethod should be performed against either simulationsor phantom measurements.
Zivadinov et al. BMC Neurology 2011, 11:128http://www.biomedcentral.com/1471-2377/11/128
Page 13 of 15

ConclusionIn conclusion, the current study provides an initial stepin better understanding of how decreased venous vascu-lature in brain parenchyma of MS patients may berelated to the pathogenesis of MS. Further studies needto confirm and elucidate our findings.
AcknowledgementsThe authors thank Eve Salczynski for technical assistance in the preparationof this manuscript.
Author details1Buffalo Neuroimaging Analysis Center, University at Buffalo, Buffalo, NY,USA. 2The Jacobs Neurological Institute, University at Buffalo, Buffalo, NY,USA. 3Centre for Infection Control and Biophysics, University of Bradford,Bradford, UK.
Authors’ contributionsRZ, GUP, KM, CVS, CRM, EC, NB, DH, CK, CBB, MGD, BWG have madesubstantial contributions to conception and design, or acquisition of data, oranalysis and interpretation of data. RZ, GUP, CBB, MGD, BWG have beeninvolved in drafting the manuscript, while KM, CVS, CRM, EC, NB, DH, CKrevised it critically for important intellectual content. All authors have givenfinal approval of the version to be published.
Competing interestsThe authors declare that they have no competing interests regarding studyin question. Robert Zivadinov received personal compensation from TevaNeuroscience, Biogen Idec, EMD Serono and Questcor Pharmaceuticals forspeaking and consultant fees. Dr. Zivadinov received financial support forresearch activities from Biogen Idec, Teva Neuroscience, Genzyme, Bracco,Questcor Pharmaceuticals and EMD Serono. Bianca Weinstock-Guttmanreceived personal compensation for consulting, speaking and serving on ascientific advisory board for Biogen& Idec, Teva Neuroscience and EMDSerono. Dr. Weinstock-Guttman also received financial support for researchactivities from NMSS, NIH, ITN, Teva Neuroscience, Biogen Idec, EMD Serono,and Aspreva. David Hojnacki has received speaker honoraria and consultantfees from Biogen Idec, Teva Pharmaceutical Industries Ltd., EMD Serono,Pfizer Inc, and Novartis. Guy U. Poloni, Karen Marr, Claudiu V. Schirda,Christopher R. Magnano, Ellen Carl, Niels Bergsland, Cheryl Kennedy, Clive B.Beggs and Michael G. Dwyer have nothing to disclose.
Received: 2 September 2011 Accepted: 19 October 2011Published: 19 October 2011
References1. Lassmann H, Bruck W, Lucchinetti CF: The immunopathology of multiple
sclerosis: an overview. Brain Pathol 2007, 17(2):210-218.2. Ge Y, Law M, Herbert J, Grossman RI: Prominent perivenular spaces in
multiple sclerosis as a sign of perivascular inflammation in primarydemyelination. AJNR Am J Neuroradiol 2005, 26(9):2316-2319.
3. Adams C: Perivascular iron deposition and other vascular damage inmultiple sclerosis. J Neurol Neurosurg Psychiatry 1988, 51:260-265.
4. Tan IL, van Schijndel RA, Pouwels PJ, van Walderveen MA, Reichenbach JR,Manoliu RA, Barkhof F: MR venography of multiple sclerosis. AJNR Am JNeuroradiol 2000, 21(6):1039-1042.
5. Ge Y, Zohrabian VM, Grossman RI: Seven-Tesla magnetic resonanceimaging: new vision of microvascular abnormalities in multiple sclerosis.Arch Neurol 2008, 65(6):812-816.
6. Hammond KE, Metcalf M, Carvajal L, Okuda DT, Srinivasan R, Vigneron D,Nelson SJ, Pelletier D: Quantitative in vivo magnetic resonance imagingof multiple sclerosis at 7 Tesla with sensitivity to iron. Ann Neurol 2008,64(6):707-713.
7. Tallantyre EC, Brookes MJ, Dixon JE, Morgan PS, Evangelou N, Morris PG:Demonstrating the perivascular distribution of MS lesions in vivo with 7-Tesla MRI. Neurology 2008, 70(22):2076-2078.
8. Tallantyre EC, Morgan PS, Dixon JE, Al-Radaideh A, Brookes MJ,Evangelou N, Morris PG: A comparison of 3T and 7T in the detection of
small parenchymal veins within MS lesions. Invest Radiol 2009,44(9):491-494.
9. Reichenbach JR, Venkatesan R, Schillinger DJ, Kido DK, Haacke EM: Smallvessels in the human brain: MR venography with deoxyhemoglobin asan intrinsic contrast agent. Radiology 1997, 204(1):272-277.
10. Ge Y, Zohrabian VM, Osa EO, Xu J, Jaggi H, Herbert J, Haacke EM,Grossman RI: Diminished visibility of cerebral venous vasculature inmultiple sclerosis by susceptibility-weighted imaging at 3.0 Tesla. JMagn Reson Imaging 2009, 29(5):1190-1194.
11. Putnam T, Adler A: Vascular architecture of the lesions of mutliplescelrosis. Arch Neurol Psychiatry 1937, 38:1-15.
12. Schelling F: Damaging venous reflux into the skull or spine: relevance tomultiple sclerosis. Med Hypotheses 1986, 21:141-148.
13. Putnam T: The pathogenesis of multiple sclerosis, a possible vascularfactor. N Engl J Med 1933, 209:786-790.
14. Zamboni P, Galeotti R, Menegatti E, Malagoni AM, Tacconi G, Dall’ara S,Bartolomei I, Salvi F: Chronic cerebrospinal venous insufficiency inpatients with multiple sclerosis. J Neurol Neurosurg Psychiatry 2009,80(4):392-399.
15. Zamboni P, Menegatti E, Galeotti R, Malagoni AM, Tacconi G, Dall’Ara S,Bartolomei I, Salvi F: The value of cerebral Doppler venoushaemodynamics in the assessment of multiple sclerosis. J Neurol Sci2009, 282(1-2):21-27.
16. Zamboni P, Galeotti R, Menegatti E, Malagoni AM, Gianesini S, Bartolomei I,Mascoli F, Salvi F: A prospective open-label study of endovasculartreatment of chronic cerebrospinal venous insufficiency. J Vasc Surg2009, 50(6):1348-1358, e1341-1343.
17. Zamboni P, Menegatti E, Weinstock-Guttman B, Dwyer MG, Schirda CV,Malagoni AM, Hojnacki D, Kennedy C, Carl E, Bergsland N, Magnano C,Bartolomei I, Salvi F, Zivadinov R: Hypoperfusion of brain parenchyma isassociated with the severity of chronic cerebrospinal venousinsufficiency in patients with multiple sclerosis: a cross-sectionalpreliminary report. BMC Med 2011, 9:22.
18. Zamboni P, Menegatti E, Weinstock-Guttman B, Schirda C, Cox JL,Malagoni AM, Hojanacki D, Kennedy C, Carl E, Dwyer MG, Bergsland N,Galeotti R, Hussein S, Bartolomei I, Salvi F, Zivadinov R: The severity ofchronic cerebrospinal venous insufficiency in patients with multiplesclerosis is related to altered cerebrospinal fluid dynamics. Funct Neurol2009, 24(3):133-138.
19. Zivadinov R, Marr K, Cutter G, Ramanathan M, Benedict RH, Kennedy C,Elfadil M, Yeh AE, Reuther J, Brooks C, Hunt K, Andrews M, Carl E,Dwyer MG, Hojnacki D, Weinstock-Guttman B: Prevalence, sensitivity, andspecificity of chronic cerebrospinal venous insufficiency in MS. Neurology2011, 77(2):138-144.
20. Lublin FD, Reingold SC: Defining the clinical course of multiple sclerosis:results of an international survey. National Multiple Sclerosis Society(USA) Advisory Committee on Clinical Trials of New Agents in MultipleSclerosis. Neurology 1996, 46(4):907-911.
21. Kurtzke JF: Rating neurologic impairment in multiple sclerosis: anexpanded disability status scale (EDSS). Neurology 1983, 33(11):1444-1452.
22. Hammond KE, Lupo JM, Xu D, Metcalf M, Kelley DA, Pelletier D, Chang SM,Mukherjee P, Vigneron DB, Nelson SJ: Development of a robust methodfor generating 7.0 T multichannel phase images of the brain withapplication to normal volunteers and patients with neurologicaldiseases. Neuroimage 2008, 39(4):1682-1692.
23. Zivadinov R, Heininen-Brown M, Schirda C, Bergsland N, Magnano C,Durfee J, Kennedy C, Carl E, Hagemeier J, Benedict R, Weinstock-Guttman B,Dwyer MG: Abnormal subcortical deep-gray matter susceptibility-weighted imaging filtered phase measurements in patients withmultiple sclerosis. A case-control study. Neuroimage 2012, 59(1):331-339.
24. Sled JG, Zijdenbos AP, Evans AC: A nonparametric method for automaticcorrection of intensity nonuniformity in MRI data. IEEE Trans Med Imaging1998, 17(1):87-97.
25. Haacke EM, Xu Y, Cheng YC, Reichenbach JR: Susceptibility weightedimaging (SWI). Magn Reson Med 2004, 52(3):612-618.
26. Sato Y, Nakajima S, Shiraga N, Atsumi H, Yoshida S, Koller T, Gerig G,Kikinis R: Three-dimensional multi-scale line filter for segmentation andvisualization of curvilinear structures in medical images. Med Image Anal1998, 2(2):143-168.
Zivadinov et al. BMC Neurology 2011, 11:128http://www.biomedcentral.com/1471-2377/11/128
Page 14 of 15

27. Smith SM, Zhang Y, Jenkinson M, Chen J, Matthews PM, Federico A, DeStefano N: Accurate, robust, and automated longitudinal and cross-sectional brain change analysis. Neuroimage 2002, 17(1):479-489.
28. Barth M, Nobauer-Huhmann IM, Reichenbach JR, Mlynarik V, Schoggl A,Matula C, Trattnig S: High-resolution three-dimensional contrast-enhanced blood oxygenation level-dependent magnetic resonancevenography of brain tumors at 3 Tesla: first clinical experience andcomparison with 1.5 Tesla. Invest Radiol 2003, 38(7):409-414.
29. Lin W, Mukherjee P, An H, Yu Y, Wang Y, Vo K, Lee B, Kido D, Haacke EM:Improving high-resolution MR bold venographic imaging using a T1reducing contrast agent. J Magn Reson Imaging 1999, 10(2):118-123.
30. Schirda C, Magnano C, Nayyar N, Cox J, Dwyer M, R Z: Contrast enhancedsusceptibility weighted imaging (SWI) increases detection of irondeposition in patients with multiple sclerosis. A pilot study. Neurology2009, 72(Suppl 3):P03.065, A139.
31. Zivadinov R, Rudick RA, De Masi R, Nasuelli D, Ukmar M, Pozzi-Mucelli RS,Grop A, Cazzato G, Zorzon M: Effects of IV methylprednisolone on brainatrophy in relapsing-remitting MS. Neurology 2001, 57(7):1239-1247.
32. Yeh E, Weinstock-Guttman B, Ramanathan M, Ramasamy D, Willis L, Cox J,Zivadinov R: MRI characteristics of children and adults with pediatric-onset multiple sclerosis. Brain 2009, 132(12):3392-3400.
33. Ge Y, Jensen JH, Lu H, Helpern JA, Miles L, Inglese M, Babb JS, Herbert J,Grossman RI: Quantitative Assessment of Iron Accumulation in the DeepGray Matter of Multiple Sclerosis by Magnetic Field Correlation Imaging.AJNR Am J Neuroradiol 2007, 28(9):1639-1644.
34. Haacke EM, Ayaz M, Khan A, Manova ES, Krishnamurthy B, Gollapalli L,Ciulla C, Kim I, Petersen F, Kirsch W: Establishing a baseline phasebehavior in magnetic resonance imaging to determine normal vs.abnormal iron content in the brain. J Magn Reson Imaging 2007,26(2):256-264.
35. D’Haeseleer M, Cambron M, Vanopdenbosch L, De Keyser J: Vascularaspects of multiple sclerosis. Lancet Neurol 2011, 10(7):657-666.
36. Trapp BD, Stys PK: Virtual hypoxia and chronic necrosis of demyelinatedaxons in multiple sclerosis. Lancet Neurol 2009, 8(3):280-291.
37. De Keyser J, Steen C, Mostert JP, Koch MW: Hypoperfusion of the cerebralwhite matter in multiple sclerosis: possible mechanisms andpathophysiological significance. J Cereb Blood Flow Metab 2008,28(10):1645-1651.
38. Varga AW, Johnson G, Babb JS, Herbert J, Grossman RI, Inglese M: Whitematter hemodynamic abnormalities precede sub-cortical gray matterchanges in multiple sclerosis. J Neurol Sci 2009, 282(1-2):28-33.
39. Adhya S, Johnson G, Herbert J, Jaggi H, Babb JS, Grossman RI, Inglese M:Pattern of hemodynamic impairment in multiple sclerosis: Dynamicsusceptibility contrast perfusion MR imaging at 3.0 T. Neuroimage 2006,33(4):1029-1035.
40. Ge Y, Law M, Johnson G, Herbert J, Babb JS, Mannon LJ, Grossman RI:Dynamic susceptibility contrast perfusion MR imaging of multiplesclerosis lesions: characterizing hemodynamic impairment andinflammatory activity. AJNR Am J Neuroradiol 2005, 26(6):1539-1547.
41. Inglese M, Adhya S, Johnson G, Babb JS, Miles L, Jaggi H, Herbert J,Grossman RI: Perfusion magnetic resonance imaging correlates ofneuropsychological impairment in multiple sclerosis. J Cereb Blood FlowMetab 2008, 28(1):164-171.
42. Law M, Saindane AM, Ge Y, Babb JS, Johnson G, Mannon LJ, Herbert J,Grossman RI: Microvascular abnormality in relapsing-remitting multiplesclerosis: perfusion MR imaging findings in normal-appearing whitematter. Radiology 2004, 231(3):645-652.
43. Wuerfel J, Paul F, Zipp F: Cerebral blood perfusion changes in multiplesclerosis. J Neurol Sci 2007, 259(1-2):16-20.
44. Meyer-Schwickerath R, Haug C, Hacker A, Fink F, Seidel D, Hartung HP,Haupts MR: Intracranial venous pressure is normal in patients withmultiple sclerosis. Mult Scler 2011.
45. Talbert DG: Raised venous pressure as a factor in multiple sclerosis. MedHypotheses 2008, 70(6):1112-1117.
46. Doepp F, Paul F, Valdueza JM, Schmierer K, Schreiber SJ: Nocerebrocervical venous congestion in patients with multiple sclerosis.Ann Neurol 2010, 68(2):173-183.
47. Krogias C, Schroder A, Wiendl H, Hohlfeld R, Gold R: ["Chroniccerebrospinal venous insufficiency” and multiple sclerosis: criticalanalysis and first observation in an unselected cohort of MS patients].Nervenarzt 2010, 81(6):740-746.
48. Sundstrom P, Wahlin A, Ambarki K, Birgander R, Eklund A, Malm J: Venousand cerebrospinal fluid flow in multiple sclerosis: A case-control study.Ann Neurol 2010, 68(2):255-259.
49. Wattjes MP, van Oosten BW, de Graaf WL, Seewann A, Bot JC, van denBerg R, Uitdehaag BM, Polman CH, Barkhof F: No association of abnormalcranial venous drainage with multiple sclerosis: a magnetic resonancevenography and flow-quantification study. J Neurol Neurosurg Psychiatry2011, 82(4):429-435.
50. Baracchini C, Perini P, Calabrese M, Causin F, Rinaldi F, Gallo P: No evidenceof chronic cerebrospinal venous insufficiency at multiple sclerosis onset.Ann Neurol 2011, 69(1):90-99.
51. Mayer CA, Pfeilschifter W, Lorenz MW, Nedelmann M, Bechmann I,Steinmetz H, Ziemann U: The perfect crime? CCSVI not leaving a trace inMS. J Neurol Neurosurg Psychiatry 2011, 82(4):436-440.
Pre-publication historyThe pre-publication history for this paper can be accessed here:http://www.biomedcentral.com/1471-2377/11/128/prepub
doi:10.1186/1471-2377-11-128Cite this article as: Zivadinov et al.: Decreased brain venous vasculaturevisibility on susceptibility-weighted imaging venography in patientswith multiple sclerosis is related to chronic cerebrospinal venousinsufficiency. BMC Neurology 2011 11:128.
Submit your next manuscript to BioMed Centraland take full advantage of:
• Convenient online submission
• Thorough peer review
• No space constraints or color figure charges
• Immediate publication on acceptance
• Inclusion in PubMed, CAS, Scopus and Google Scholar
• Research which is freely available for redistribution
Submit your manuscript at www.biomedcentral.com/submit
Zivadinov et al. BMC Neurology 2011, 11:128http://www.biomedcentral.com/1471-2377/11/128
Page 15 of 15