deep borehole emplacement mode hazard analysis revision...
TRANSCRIPT
SANDIA REPORT SAND2015-6645 Unlimited Release Printed August 7, 2015
Deep Borehole Emplacement Mode Hazard Analysis
Revision 0 S. David Sevougian, SNL
Prepared by Sandia National Laboratories Albuquerque, New Mexico 87185 and Livermore, California 94550
Sandia National Laboratories is a multi-program laboratory managed and operated by Sandia Corporation, a wholly owned subsidiary of Lockheed Martin Corporation, for the U.S. Department of Energy's National Nuclear Security Administration under contract DE-AC04-94AL85000.
Approved for public release; further dissemination unlimited.

Issued by Sandia National Laboratories, operated for the United States Department of Energy
by Sandia Corporation.
NOTICE: This report was prepared as an account of work sponsored by an agency of the
United States Government. Neither the United States Government, nor any agency thereof,
nor any of their employees, nor any of their contractors, subcontractors, or their employees,
make any warranty, express or implied, or assume any legal liability or responsibility for the
accuracy, completeness, or usefulness of any information, apparatus, product, or process
disclosed, or represent that its use would not infringe privately owned rights. Reference herein
to any specific commercial product, process, or service by trade name, trademark,
manufacturer, or otherwise, does not necessarily constitute or imply its endorsement,
recommendation, or favoring by the United States Government, any agency thereof, or any of
their contractors or subcontractors. The views and opinions expressed herein do not
necessarily state or reflect those of the United States Government, any agency thereof, or any
of their contractors.
Printed in the United States of America. This report has been reproduced directly from the best
available copy.
Available to DOE and DOE contractors from
U.S. Department of Energy
Office of Scientific and Technical Information
P.O. Box 62
Oak Ridge, TN 37831
Telephone: (865) 576-8401
Facsimile: (865) 576-5728
E-Mail: [email protected]
Online ordering: http://www.osti.gov/bridge
Available to the public from
U.S. Department of Commerce
National Technical Information Service
5285 Port Royal Rd.
Springfield, VA 22161
Telephone: (800) 553-6847
Facsimile: (703) 605-6900
E-Mail: [email protected]
Online order: http://www.ntis.gov/help/ordermethods.asp?loc=7-4-0#online

Deep Borehole Emplacement Mode Hazard Analysis, Revision 0 August 2015 iii
ACKNOWLEDGMENTS
Thanks go to Ernie Hardin for his guidance on this document, especially with regard to his input
on an appropriate set of end states. Also, thanks to Paul Eslinger for providing a preliminary
fault tree associated with the drill string emplacement mode.

Deep Borehole Emplacement Mode Hazard Analysis, Revision 0
iv August 2015
This page intentionally left blank
Deep Borehole Emplacement Mode Hazard Analysis, Revision 0 August 2015 v
TABLE OF CONTENTS
1. PURPOSE .......................................................................................................................................... 1
2. BACKGROUND ................................................................................................................................ 1
3. HAZARD ANALYSIS ....................................................................................................................... 3
3.1 Introduction .............................................................................................................................. 3 3.1.1 Top Events and Some Assumptions ............................................................................ 4 3.1.2 Categories of Failures and Errors ................................................................................ 5 3.1.3 Selection of Hazard Evaluation Technique ................................................................. 6
3.2 Event Tree Analysis Primer ..................................................................................................... 7
3.3 Fault Tree Analysis Primer ...................................................................................................... 9
3.4 Example of a Combined ETA and FTA ................................................................................. 12
3.5 Risk Analysis and ETA/FTA Software .................................................................................. 15
3.6 Reliability and Accident Databases ....................................................................................... 16
3.7 ETA/FTA for Wireline Emplacement Mode ......................................................................... 17 3.7.1 Internal Hazardous Events for Wireline Emplacement Mode .................................. 17 3.7.2 Fault Tree Analysis for Wireline Emplacement Mode ............................................. 19 3.7.3 Event Tree Analysis for Wireline Emplacement Mode ............................................ 19 3.7.4 Combined Event Tree/Fault Tree Analysis for Wireline Emplacement Mode ......... 20
3.8 ETA/FTA for Drill String Emplacement Mode ..................................................................... 30
4. REFERENCES ................................................................................................................................. 32
5. APPENDIX A: Active Component Reliability Data Sources Used in the YMP PCSA ................. 35
Deep Borehole Emplacement Mode Hazard Analysis, Revision 0
vi August 2015
LIST OF FIGURES
Figure 2-1. Hazard and Risk Identification and Analysis Methods. ............................................................ 2
Figure 3-1. Bow-tie diagram. ........................................................................................................................ 4
Figure 3-2. Stess-strength interference diagram. .......................................................................................... 6
Figure 3-3. Example event tree for a dust explosion. ................................................................................... 8
Figure 3-4. Basic symbols used in a fault tree. .......................................................................................... 11
Figure 3-5. Sample fault tree ...................................................................................................................... 11
Figure 3-6. Schematic of the Yucca Mountain Canister Transfer Machine................................................ 13
Figure 3-7. Example of a combined event tree and fault tree from the YMP PCSA. ................................. 14
Figure 3-8. Example fault tree from YMP PCSA, showing basic events, and feeding Transfer
Gate 36-60 in Figure 3-7. ................................................................................................................. 16
Figure 3-9. Electric cable head attachment step for the wireline emplacement mode. ............................... 18
Figure 3-10. Waste package lowering step for the wireline emplacement mode. ...................................... 18
Figure 3-11. Fault tree for “drop” top event during wireline emplacement. ............................................... 25
Figure 3-12. Fault tree for “stuck-in-hole” top event during wireline emplacement. ................................. 26
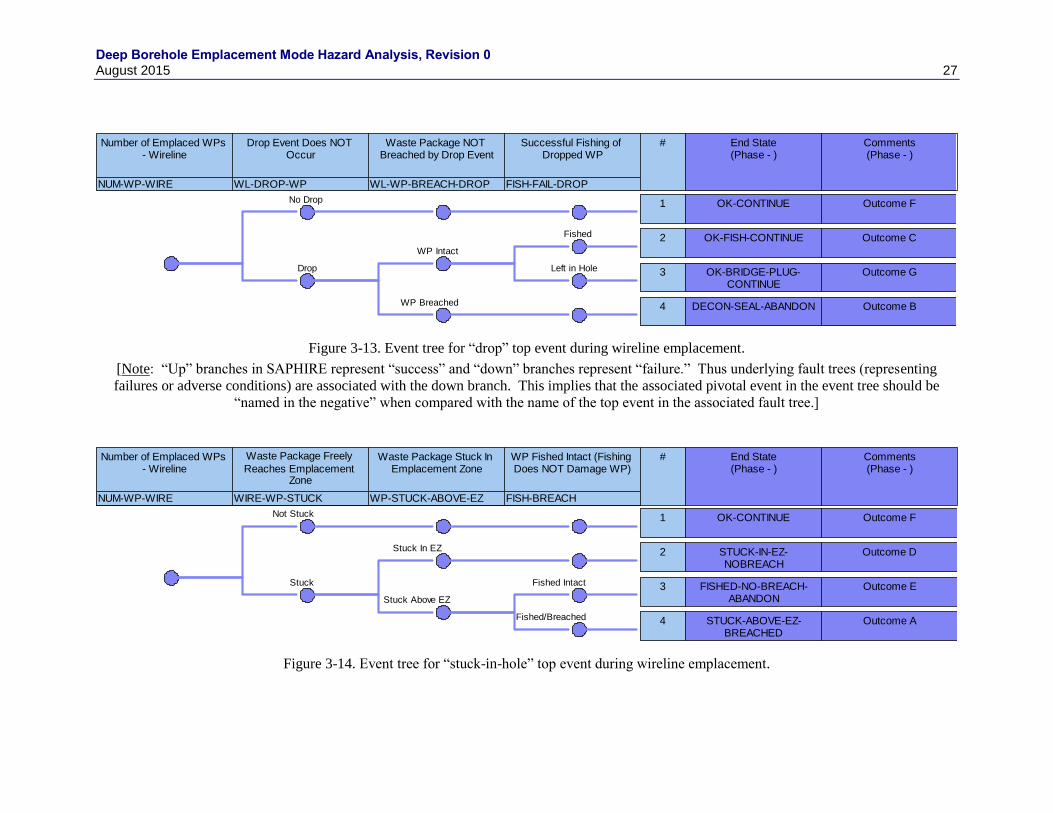
Figure 3-13. Event tree for “drop” top event during wireline emplacement ............................................... 27
Figure 3-14. Event tree for “stuck-in-hole” top event during wireline emplacement. ................................ 27
Figure 3-15. SAPHIRE-based combined event tree/fault tree analysis for the “drop” top event
during wireline emplacement. .......................................................................................................... 28
Figure 3-16. SAPHIRE-based combined event tree/fault tree analysis for the “stuck-in-hole” top
event during wireline emplacement. ................................................................................................. 29
Figure 3-17. Schematic of emplacement workover rig, basement, transport carrier, and shipping
cask in position for waste emplacement by drill string. ................................................................... 30
Figure 3-18. Fault tree for “loss-of-control” top event during drill string emplacement. ........................... 31

Deep Borehole Emplacement Mode Hazard Analysis, Revision 0 August 2015 vii
LIST OF TABLES
Table 3-1. Criteria for choosing the hazard evaluation (HE) method for Category2 nuclear
facilities. ...................................................................................................................................... 7
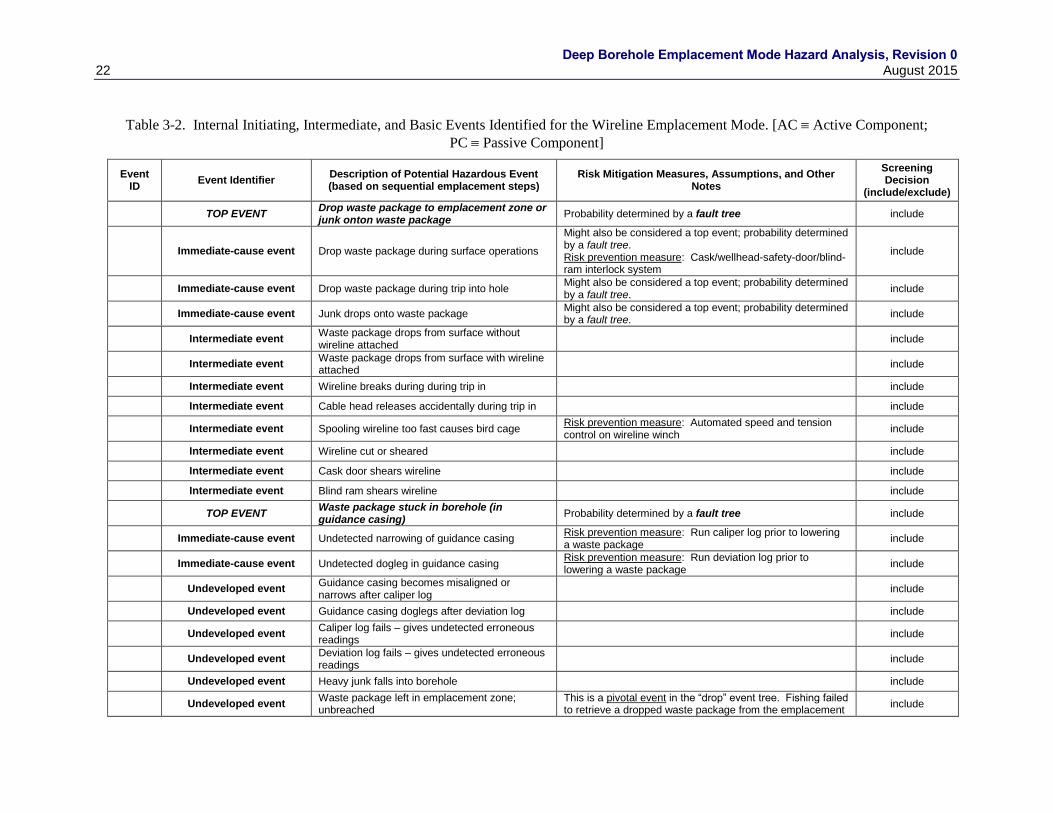
Table 3-2. Internal Initiating, Intermediate, and Basic Events Identified for the Wireline
Emplacement Mode .................................................................................................................... 22
Table 3-3. End States Identified for Hazardous Event Sequences Associated with the Wireline
Emplacement Mode .................................................................................................................... 24

Deep Borehole Emplacement Mode Hazard Analysis, Revision 0
viii August 2015
ACRONYMS
AIChE American Institute of Chemical Engineers
BOP Blow-out Preventer
DBEMHA Deep Borehole Emplacement Mode Hazard Analysis
DBFT Deep Borehole Field Test
DoD U.S. Department of Defense
DOE U.S. Department of Energy
ETA Event Tree Analysis
EU European Union
FMEA Failure Mode and Effects Analysis
FMECA Failure Mode, Effects, and Criticality Analysis
FTA Fault Tree Analysis
HAZOP Hazard and Operability Study
HOF Human and Organizational Factors
MUA Multi-attribute Utility Analysis
NE Office of Nuclear Energy
NRC U.S. Nuclear Regulatory Commission
PCSA Pre-closure Safety Analysis
PHA Preliminary Hazard Analysis
SAPHIRE System Analysis Programs for Hands-on Integrated Reliability Evaluations
SNF Spent Nuclear Fuel
SSC Structure, System, or Component
YMP Yucca Mountain Project
Deep Borehole Emplacement Mode Hazard Analysis, Revision 0 August 2015 1
1. PURPOSE
This letter report outlines a methodology and provides resource information for the Deep
Borehole Emplacement Mode Hazard Analysis (DBEMHA). The main purpose is identify the
accident hazards and accident event sequences associated with the two emplacement mode
options (wireline or drillstring), to outline a methodology for computing accident probabilities
and frequencies, and to point to available databases on the nature and frequency of accidents
typically associated with standard borehole drilling and nuclear handling operations. Risk
mitigation and prevention measures, which have been incorporated into the two emplacement
designs (see Cochran and Hardin 2015), are also discussed. A key intent of this report is to
provide background information to brief subject matter experts involved in the Emplacement
Mode Design Study. [Note: Revision 0 of this report is concentrated more on the wireline
emplacement mode. It is expected that Revision 1 will contain further development of the
preliminary fault and event trees for the drill string emplacement mode.]
2. BACKGROUND
A number of both qualitative and quantitative hazard and risk analysis methods are available for
assessing the probability/frequency of an accident and its consequences. For example,
Marhavilas et al. (2011) identified 18 methods reported in six risk analysis journals in the 2000-
2009 decade, based on a survey of over 400 peer-reviewed scientific papers. Matanovic et al.
(2014, Chapter 1), whose area of interest is the petroleum industry, added four additional
techniques to the Marhavilas’ list, as shown below in Figure 2-1. Neither list is exhaustive and
other hazard and risk analysis methods, e.g., Bayesian Belief Networks (BBN) (Rausand and
Hoyland 2004; Vinnem et al. 2012), or variations on methods (e.g., FMECA), as well as other
classification schemes for risk analysis methods (sometimes combined with decision analysis)
are given in the literature (e.g., Thaheem et al. 2012). The point is that many viable methods are
available to estimate and manage hazards and risk for a complex engineering project or key
aspects of the project.
Two main branches of risk analysis and assessment literature that are particularly relevant to the
Deep Borehole Field Test (DBFT) are those methods and studies used in the oil and gas industry
(e.g., Calixto 2013; Matanovic et al. 2014) and those used in the nuclear industry (DOE 2008,
Sec. 1.6.1; NRC 1998; NRC 1983; DOE 1997; CCPS 1992). In the oil and gas industry, hazard
and risk analysis is the most advanced for offshore exploration applications (Gran et al. 2012;
Andersen and Mostue 2012; Pitblado et al. 2011; BORA 2007; Vinnem et al. 2006), where
accidents typically evolve through a complex sequence of combined human errors/misjudgments
and mechanical failures, such as the hard-to-predict accident sequence that caused the blowout
on the Deepwater Horizon offshore drilling rig in the Gulf of Mexico (CSB 2014). In complex
operations, such as offshore drilling, it is not only individual component failures that are
responsible for accidents, but also their spatial and temporal relationships (e.g., different types of
equipment located on three or four levels of an offshore drilling platform—see Vinnem 2007,
Sec. 6.3.1.3). Complicating factors also include the effects of adverse weather, and unstable and
unknown conditions deep in the borehole, such as unknown locations of overpressured zones.

Deep Borehole Emplacement Mode Hazard Analysis, Revision 0
2 August 2015
With regard to the influence of human actions, Skogdalen and Vinnem (2012) noted: “As seen
in the Macondo blowout, most of the findings were related to Human and Organisational Factors
(HOFs), e.g. working practice, competence, communication, procedures and management.” In a
similar vein, human factors were responsible for the Fukushima accident, although not only
individual human actions but, also, collective organizational actions (NAIIC 2012): “We believe
that the root causes [of the TEPCO Fukushima Nuclear Power Plant accident] were the
organizational and regulatory systems that supported faulty rationales for decisions and actions,
rather than issues relating to the competency of any specific individual.” Any potential accident
sequences in the deep borehole disposal of high-level nuclear waste would also be expected to be
influenced by such human and organizational risk factors. Thus, the hazard identification and
analysis presented here for deep borehole disposal of nuclear waste is a combination of human-
error-initiated events (NRC 2000) and spontaneous equipment failure events.
Figure 2-1. Hazard and Risk Identification and Analysis Methods (after Matanovic et al. 2014, Fig. 5).

Deep Borehole Emplacement Mode Hazard Analysis, Revision 0 August 2015 3
3. HAZARD ANALYSIS
3.1 Introduction
A typical hazard/risk analysis and assessment involves five major steps (e.g., see NORSOK
2001, Fig. 2; DOE 2008, Sec. 1.6.1; Vinnem 2007, Sec. 5.1.1):
1. Hazard identification and event sequence construction (what can happen? – “causes”)
2. Consequence analysis (what are the consequences if it happens?)
3. Frequency/probability analysis (how likely is it to happen?, including uncertainty
ranges)
4. Risk evaluation (how bad is it? – product of frequency/probability and consequence)
5. Decision analysis (how should we proceed in light of the risk?)
Depending on the purpose of the analysis and the stage of the project, one or more of the above
steps may be emphasized. The first three steps are the primary focus of this letter report.
However, when risk is more of the focus, as expected later in the DBFT or in an actual disposal
project, more detail will be specified for Step 4. For example, Brandsaeter (2002, Table 1) splits
risk evaluation into two steps:
Step IV — risk evaluation (consists of two parts):
Step IV-A — risk assessment: assessing and expressing the likelihood of the
consequences and describing the quality of such estimates.
Step IV-B — risk comparison: comparing derived risk estimates to specified
guidelines/criteria/goals and describing the dependence of these estimates on
explicitly specified assumptions.
Between the cause (or threat) and the hazardous event (or accident), prevention measures are
usually included in the system design. For the DBFT, these are discussed by Cochran and
Hardin (2015), and include such things as interlock systems, redundant or back-up systems, and
factors-of-safety. If a hazardous event were to occur, risk mitigation measures (often called
“safety barriers”) would be important to limit adverse consequences to humans, the environment,
and the equipment. Radiological adverse consequences to humans or the environment would be
a key consideration in actual deep borehole emplacement operations but are not the focus of the
DBFT, since it will not involve actual nuclear materials. However, DBFT operations will
necessarily include some common prevention and mitigation measures, such as fire suppression
and mud surge systems.
The sequence from cause to hazardous event to consequences or effects, with appropriate
prevention and mitigation measures (i.e., safety barriers), is often depicted in the oil and gas
industry in the form of a “bow-tie” diagram and associated bow-tie analysis (e.g., Calixto 2014,
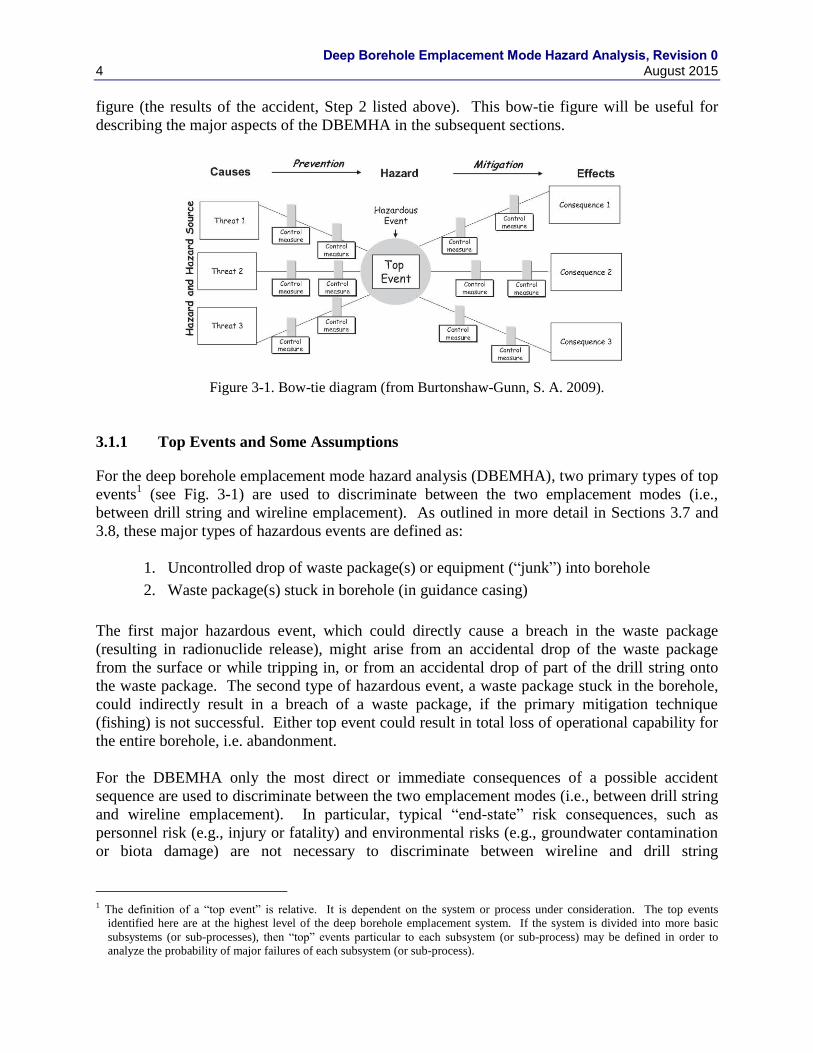
Sec. 6.6; Vinnem 2007, Fig. 5.1). Figure 3-1 shows the major components of a bow-tie diagram,
with the “top” or hazardous event in the center, cause analysis on the left side of figure (the
initiation of the accident, Step 1 listed above), and consequence analysis on the right side of the
Deep Borehole Emplacement Mode Hazard Analysis, Revision 0
4 August 2015
figure (the results of the accident, Step 2 listed above). This bow-tie figure will be useful for
describing the major aspects of the DBEMHA in the subsequent sections.
Figure 3-1. Bow-tie diagram (from Burtonshaw-Gunn, S. A. 2009).
3.1.1 Top Events and Some Assumptions
For the deep borehole emplacement mode hazard analysis (DBEMHA), two primary types of top
events1 (see Fig. 3-1) are used to discriminate between the two emplacement modes (i.e.,
between drill string and wireline emplacement). As outlined in more detail in Sections 3.7 and
3.8, these major types of hazardous events are defined as:
1. Uncontrolled drop of waste package(s) or equipment (“junk”) into borehole
2. Waste package(s) stuck in borehole (in guidance casing)
The first major hazardous event, which could directly cause a breach in the waste package
(resulting in radionuclide release), might arise from an accidental drop of the waste package
from the surface or while tripping in, or from an accidental drop of part of the drill string onto
the waste package. The second type of hazardous event, a waste package stuck in the borehole,
could indirectly result in a breach of a waste package, if the primary mitigation technique
(fishing) is not successful. Either top event could result in total loss of operational capability for
the entire borehole, i.e. abandonment.
For the DBEMHA only the most direct or immediate consequences of a possible accident
sequence are used to discriminate between the two emplacement modes (i.e., between drill string
and wireline emplacement). In particular, typical “end-state” risk consequences, such as
personnel risk (e.g., injury or fatality) and environmental risks (e.g., groundwater contamination
or biota damage) are not necessary to discriminate between wireline and drill string
1 The definition of a “top event” is relative. It is dependent on the system or process under consideration. The top events
identified here are at the highest level of the deep borehole emplacement system. If the system is divided into more basic
subsystems (or sub-processes), then “top” events particular to each subsystem (or sub-process) may be defined in order to
analyze the probability of major failures of each subsystem (or sub-process).
Deep Borehole Emplacement Mode Hazard Analysis, Revision 0 August 2015 5
emplacement. Simpler end-state consequences, i.e., damage to either the waste package or to the
borehole, are deemed sufficient to discriminate between the two emplacement modes. [See
Aven et al. 2007, Aven and Vinnem 2007, Sec. 6.4, and Vinnem 2007, Sec. 2.1 for a discussion
of typical primary risk categories—personnel risk; environmental risk; and asset risk (where
asset risk can be either material damage risk or production delay).]
Some other assumptions are made to simplify the hazard analysis, including:
Accident analysis begins subsequent to bolting of shipping cask to wellhead (i.e.,
handling activities prior to that do not discriminate between options)
Only internal events are considered for now (i.e., omit external events such as seismicity,
weather-related events, external fires, aircraft collisions, site-wide power failure etc.)
No malevolent human acts (such as purposely dropping a package, or terrorism)
No simultaneous initiating events (which is standard PRA practice because of low
probability and because either initiating event would cease operations)
No overpressure in the well (but the two design concepts allow for BOPs, since State
regulations are likely to mandate them).
3.1.2 Categories of Failures and Errors
Hazardous events (see Fig. 3-1) may result from either actions (e.g., human errors) or component
failures (e.g. battery failures, sensor failures) or a combination of these. There are two major
types of component or mechanical failures: passive component failures and active component
failures. For deep borehole emplacement operations, passive components include items such as
the waste package itself, the guidance casing, and passive BOP components (such as a crack or
bolt failure in a non-moving part). They are components which are acted upon, rather than being
active themselves. Active components for the DBEMHA will include such items as the electric
cable head release, the wireline winch, wireline sheave wheels, interlock systems, active BOP
components (hydraulics or electronics that operate the rams), batteries, diesel generators, and key
constituents of the workover rig lifting and lowering mechanisms, such as the drill line, the
winch, the hook, and rig motors. These are system components that are active in some way,
either by operating continuously throughout the mission or by having to “operate on demand”
when required (e.g., a back-up generator). Typically, one or more of the active components must
fail in order to cause some type of off-normal event that might damage a passive component (i.e.,
to exceed the design capacity of the passive component because of an excessive load).
Failure probabilities/frequencies for active components come from industry and governmental
reliability databases for electro-mechanical equipment, which are outlined in Section 3.6,
whereas failure probabilities for passive components must be determined by an engineering
calculation (fragility or damage analysis) using mechanistic models. The engineering calculation
compares the load or “demand” on a passive component (e.g., the impact force or stress) to the
capacity of the component (e.g., the ultimate tensile strength). Both the load and the capacity are
uncertain and are represented probabilistically with uncertainty distributions, which results in a
probability that the component fails (e.g., see BSC 2008c, Sec. 4.3.2.2 or NRC 2007). This
concept of interference between an uncertainty distribution for load (or stress) and an uncertainty
Deep Borehole Emplacement Mode Hazard Analysis, Revision 0
6 August 2015
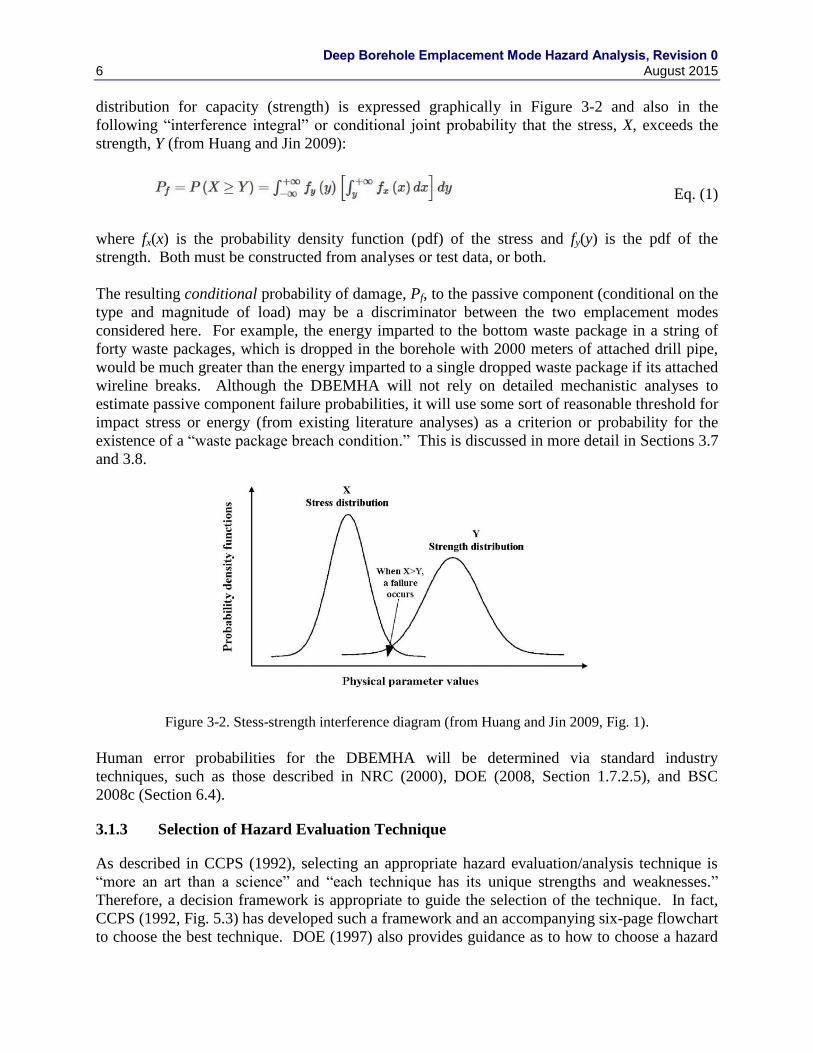
distribution for capacity (strength) is expressed graphically in Figure 3-2 and also in the
following “interference integral” or conditional joint probability that the stress, X, exceeds the
strength, Y (from Huang and Jin 2009):
Eq. (1)
where fx(x) is the probability density function (pdf) of the stress and fy(y) is the pdf of the
strength. Both must be constructed from analyses or test data, or both.
The resulting conditional probability of damage, Pf, to the passive component (conditional on the
type and magnitude of load) may be a discriminator between the two emplacement modes
considered here. For example, the energy imparted to the bottom waste package in a string of
forty waste packages, which is dropped in the borehole with 2000 meters of attached drill pipe,
would be much greater than the energy imparted to a single dropped waste package if its attached
wireline breaks. Although the DBEMHA will not rely on detailed mechanistic analyses to
estimate passive component failure probabilities, it will use some sort of reasonable threshold for
impact stress or energy (from existing literature analyses) as a criterion or probability for the
existence of a “waste package breach condition.” This is discussed in more detail in Sections 3.7
and 3.8.
Figure 3-2. Stess-strength interference diagram (from Huang and Jin 2009, Fig. 1).
Human error probabilities for the DBEMHA will be determined via standard industry
techniques, such as those described in NRC (2000), DOE (2008, Section 1.7.2.5), and BSC
2008c (Section 6.4).
3.1.3 Selection of Hazard Evaluation Technique
As described in CCPS (1992), selecting an appropriate hazard evaluation/analysis technique is
“more an art than a science” and “each technique has its unique strengths and weaknesses.”
Therefore, a decision framework is appropriate to guide the selection of the technique. In fact,
CCPS (1992, Fig. 5.3) has developed such a framework and an accompanying six-page flowchart
to choose the best technique. DOE (1997) also provides guidance as to how to choose a hazard
Deep Borehole Emplacement Mode Hazard Analysis, Revision 0 August 2015 7
evaluation technique, based on the complexity of the facility or project being evaluated. A brief
summary of their guidance criteria for a Nuclear Hazard Category 2 Facility (defined as a facility
with the potential for “significant on-site consequences,” which would apply to an operating
Deep Borehole Disposal facility) is tabulated in Table 3-1 below (DOE 1997, Sec. 4.1.2b).
Based on Table 3-1, and other precedence in the nuclear waste industry (e.g., NRC 1983,
Chapter 3), a combination of event tree analysis (ETA) and fault tree analysis (FTA) may be
accepted as an appropriate technique for this DBEMHA. Combined use of ETA and FTA is also
described in NRC (2000, see Sec. 10.3.1) and was used extensively in the Pre-closure Safety
Analyis (PCSA) for the Yucca Mountain Repository License Application (DOE 2008, Sec. 1.6
and 1.7). These two techniques are described below in Sections 3.2 and 3.3.
Table 3-1. Criteria for choosing the hazard evaluation (HE) method for Category2 nuclear
facilities (excerpted from DOE-STD-1027-92).
Type/Complexity of Facility Recommended Hazard Evaluation Method
Low-Complexity Checklist Analysis or other simple “Hazard Analysis”
Single-Failure Electro-Mechanical Systems
Failure Modes and Effects Analysis (FMEA)
Systems with Redundant Barriers or Requiring Multiple Failures
Event Tree Analysis (ETA)
Large, Moderately Complex Processes
Fault Tree Analysis (FTA)
Complex Fluid Processes Hazard and Operability Studies (HAZOP)
High Complexity Facilities Integrated Event Tree and Fault Tree Techniques (ETAs/FTAs)
3.2 Event Tree Analysis Primer
Event tree analysis (ETA) is a common hazard-analysis methodology for determining the
possible consequences of a hazardous event (e.g., Rausand and Hoyland 2004; CCPS 1992). As
described by CCPS (1992, Sec. 6.10), it is an inductive technique where the analyst begins with
an initiating event and develops the possible time sequences of subsequent events (“nodes,”
“branch points,” intermediate or “pivotal” events) that lead to various outcomes or end states
(consequences), accounting for both the successes and the failures of any associated safety
barriers as the accident progresses. Each event in the tree will be conditional on the occurrence
of the previous events in the event chain. In the bow-tie diagram shown in Figure 3-1, ETA
would begin with the hazardous event shown in the center of the diagram and work its way to the
right of the diagram to the final consequences or end states. Each of the control measures shown
on the right side of Figure 3-1 is a safety barrier or function that may or may not be successful.
The six major steps in an event tree analysis are well-established (e.g., Rausand and Hoyland
2004; CCPS 1992), with a simple illustrative example of an event tree given in Figure 3-3:
Deep Borehole Emplacement Mode Hazard Analysis, Revision 0
8 August 2015
1. Identification of an initiating event (hazard) that eventually leads to various types of
unwanted consequences (e.g., environmental spill, injury, fatality, etc.) of varying
degrees of severity
2. Identification of each of the safety barriers/functions/actions/processes/procedures that
are designed to mitigate the initiating event; a failure of a safety barrier results in an
“intermediate” or “pivotal” event in an accident sequence
3. Construction of the event tree, which begins with the initiating event and progresses
through a sequence of subsequent events, some (but not all) of which represent successes
or failures of the safety barriers—others simply represent “process steps”
4. Description of the resulting accident event sequences, or unique branch combinations in
the tree
5. Calculation of probabilities of intermediate events and frequencies of end states:
frequency of end state(s) = frequency of initiating event probability of each intermediate event Eq. (2)
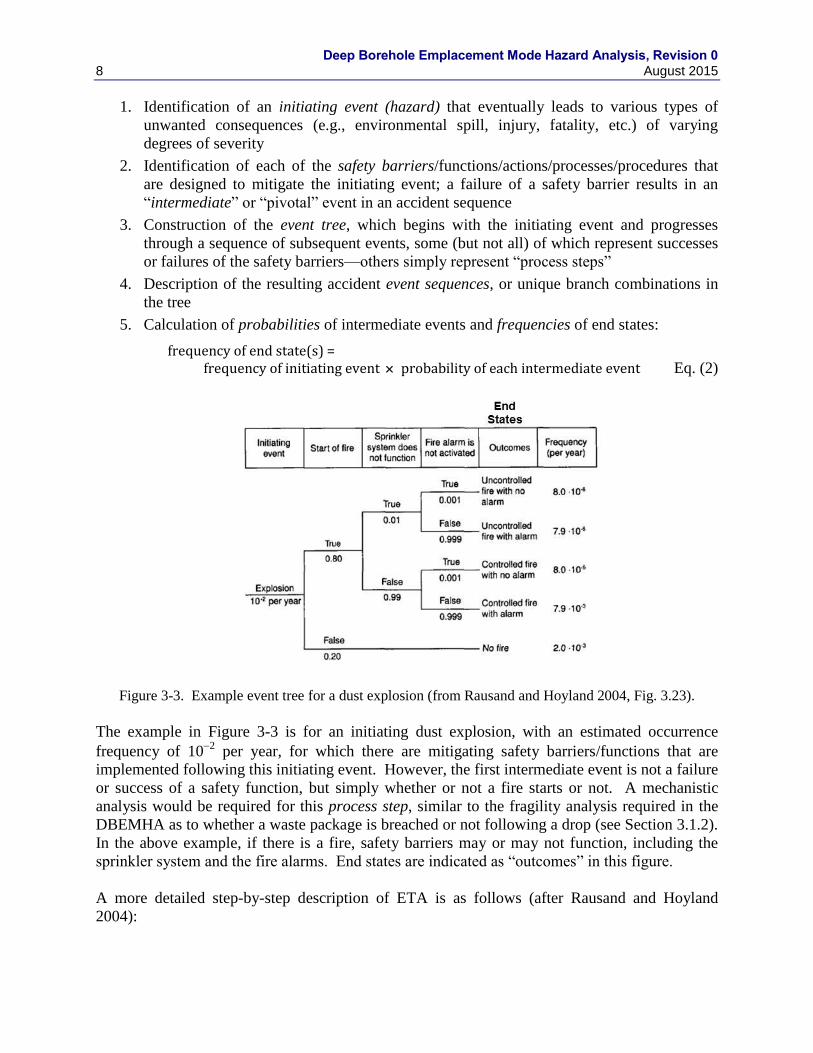
Figure 3-3. Example event tree for a dust explosion (from Rausand and Hoyland 2004, Fig. 3.23).
The example in Figure 3-3 is for an initiating dust explosion, with an estimated occurrence
frequency of 102
per year, for which there are mitigating safety barriers/functions that are
implemented following this initiating event. However, the first intermediate event is not a failure
or success of a safety function, but simply whether or not a fire starts or not. A mechanistic
analysis would be required for this process step, similar to the fragility analysis required in the
DBEMHA as to whether a waste package is breached or not following a drop (see Section 3.1.2).
In the above example, if there is a fire, safety barriers may or may not function, including the
sprinkler system and the fire alarms. End states are indicated as “outcomes” in this figure.
A more detailed step-by-step description of ETA is as follows (after Rausand and Hoyland
2004):

Deep Borehole Emplacement Mode Hazard Analysis, Revision 0 August 2015 9
Qualitative steps:
1) Identify initiating hazards, either internal or external, using FMEA, FMECA, PHA, or
HAZOP.
2) Identify safety barriers/functions, failure or success of which will be represented as the
occurrence of an intermediate (or pivotal) event, i.e., does the safety barrier operate
properly or not.
3) Construct event tree horizontally, left to right, with binary true/false or success/failure
branches for each event
4) Describe resulting event sequences: there is a one-to-one correspondence between each
end state and the event sequence that leads to that end state.
Quantitative steps:
5) Determine initiating event frequency, often based on industry or government databases
(see Section 3.6).
6) Estimate conditional probability of successful operation of each safety barrier or process
step in the event sequence (“conditional” because it likely depends on previous events in
the chain), i.e., the conditional probability of each intermediate event. Depending on the
definition of each particular intermediate event, a linked fault-tree analysis (or some other
type of reliability assessment, e.g., an engineering calculation, as discussed above) may
be needed to determine these intermediate-event probabilities.
7) Determine the frequency of each outcome or end state by multiplying the initiating event
frequency times the conditional probabilities of each branch in the event sequence
leading to that particular end state.
Similarly to the PCSA described in DOE (2008, Sections 1.6 and 1.7), the DBEMHA can be
divided into one evaluation to analyze internal initiating events and a separate evaluation to
analyze external initiating events. Internal initiating events are those that are internal to the
facility process and operations and are generally associated with equipment failures and human
actions. External initiating events are those that are external to the process or operations and can
include either human-induced events or naturally occurring events. Examples of external events
include aircraft crashes, loss of power, earthquakes, wind storms, and floods. For this first
iteration of the DBEMHA, external initiating events are not considered (see Sec. 3.1.1).
3.3 Fault Tree Analysis Primer
Fault tree analysis (FTA) is another standard technique for hazard analysis (e.g., Rausand and
Hoyland 2004; CCPS 1992; Vesely et al. 1981). As described by CCPS (1992, Sec. 6.9), it is a graphical model that illustrates combinations of failures that will cause one specific failure of
interest, called a top event. (FTA) is a deductive technique that uses Boolean logic symbols (i.e.,
AND gates, OR gates) to break down the causes of a top event into combinations or sequences of
basic equipment failures and human errors. FTA begins with the undesirable final state (“top
event” or “hazardous event” shown in Fig. 3-1) and works backwards (or from center to left in
Fig. 3-1), using deductive reasoning, through potential intermediate “fault” events (or failures)
and combinations of fault events that must occur to initiate the top event (CCPS 1992, Sec. 6.9),
until all the basic causes (“basic events”) have been established and the “boundary” of the
analysis is reached.

Deep Borehole Emplacement Mode Hazard Analysis, Revision 0
10 August 2015
In FTA a set of “basic events” (those that are reduced no further, at the lowest level of the fault
tree) that must occur or exist simultaneously to trigger the top event, is called a “cut set” (a
reference to graph theory)—see Rausand and Hoyland (2004, Sec. 3.6). A “minimal cut set” is a
smallest combination of basic events (component failures) which, if they all occur or exist
simultaneously, will cause the top event to occur. In all but the simplest fault tree, there can be
many minimal cut sets and usually a numerical algorithm is required to generate these sets and
then compute their probabilities (or frequencies, depending on the application—see Rausand and
Hoyland 2004, Sec. 4.4.3, Example 4.11). The five major steps in the analysis (Rausand and
Hoyland 2004) are
1. Definition of the problem and the boundary conditions, including definition of the top
event
2. Construction of the fault tree, backwards from “immediate cause events” (just below top
event) to a level of basic events or causes
3. Identification of minimal cut sets
4. Qualitative analysis of the fault tree
5. Quantitative analysis of the fault tree
Regarding the use of FTA, Vinnem (2007, Sec. 6.2.1) states: “The strength of the fault tree
technique is its ability to include both hardware failures and human errors, and thereby allow a
realistic representation of the steps leading to a hazardous event. This allows an holistic
approach to the identification of preventive and mitigative measures, and will result in attention
being focused on the basic causes of the hazardous event, whether due to hardware or
software….FTA is particularly well suited to the analysis of complex and highly redundant
systems.” In a combined ETA/FTA analysis (e.g., DOE 2008), such as used here for the
DBEMHA, FTA is used to estimate both the frequency of initiating events and the probability of
pivotal (or intermediate) events in the ETA event sequence (BSC 2008c, Sec. 4.3.2).
The basic symbols used in a fault tree are shown in Figure 3-4 (there are other symbols, too—see
Vesely et al. 1981 and CCPS 1992), and a generic fault tree is shown in Figure 3-5. A more
detailed example of a fault tree, taken from the Yucca Mountain Repository PCSA, is described
in Section 3.4.

Deep Borehole Emplacement Mode Hazard Analysis, Revision 0 August 2015 11
Figure 3-4. Basic symbols used in a fault tree (from Rausand and Hoyland 2004, Table 3.1).
Figure 3-5. Sample fault tree (from CCPS 1992, Figure 6.9).

Deep Borehole Emplacement Mode Hazard Analysis, Revision 0
12 August 2015
3.4 Example of a Combined ETA and FTA
As recommended in Section 3.1.3, a combination of ETA and FTA is deemed appropriate for
estimating hazards during deep borehole emplacement operations and for differentiating the risks
associated with the two emplacement options: wireline or drill string. This ETA/FTA analysis
will then feed a higher level decision analysis that includes other factors, such as costs (see
Hardin 2015), to result in a final decision regarding the optimal emplacement option.
This section provides a brief example of the combined use of event trees and fault trees in an
analogous hazard analysis, the Yucca Mountain Project Pre-closure Safety Analysis (YMP
PCSA), which constitutes the 4000-page Chapter 1 of the YMP Safety Analysis Report (SAR).
This PCSA provides many parallels for the DBEMHA. For example, it considers operational
events in the YM surface facilities that could damage a waste canister containing spent nuclear
fuel (SNF), due to a variety of possible electro-mechanical or human failures/errors. In deep
borehole emplacement, the concern is also with damage to a waste container (package)
containing nuclear waste.
The particular example shown here is for hazardous events associated with operation of the
Canister Transfer Machine (CTM) which operates within the Canister Transfer Room of the
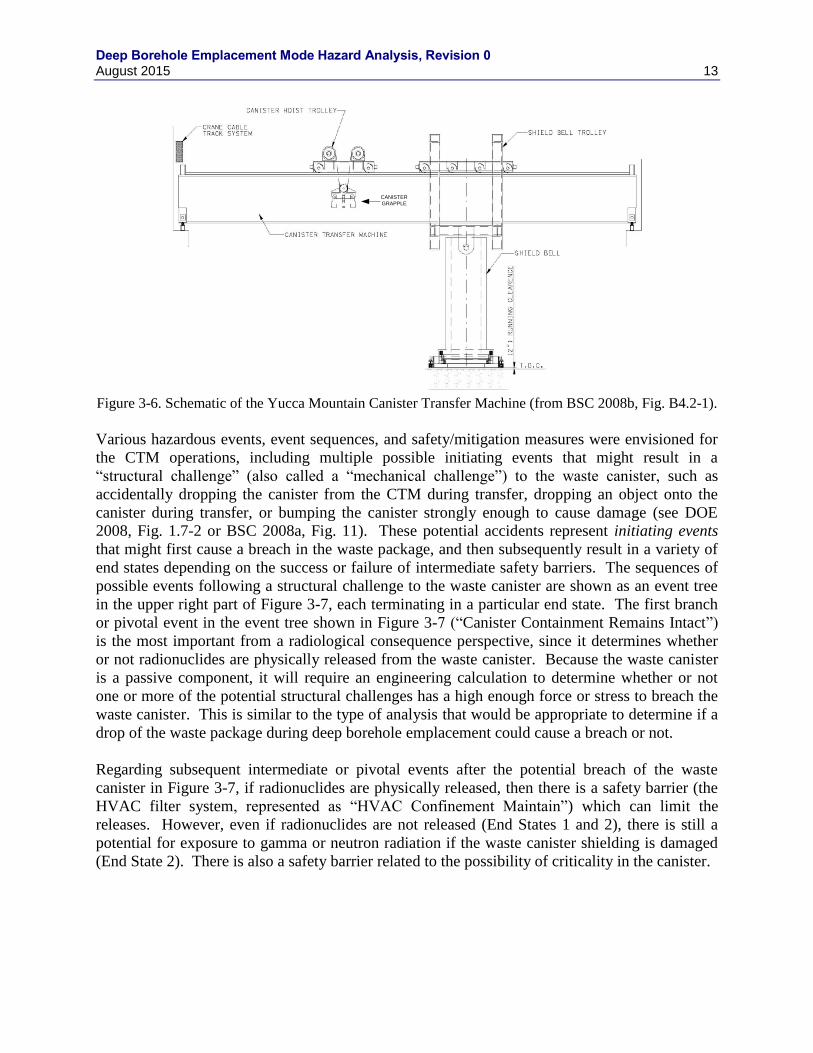
Canister Receipt and Closure Facility (CRCF). This machine’s purpose (see Figure 3-6) is to
transfer a waste canister from a shipping or transportation cask to a disposal waste package.
Basically, the CTM is a fixed overhead crane bridge with two sliding trolleys, one called the
shield bell trolley and another called the canister hoist trolley. The entire machine resides in the
Canister Transfer Room which is a second-floor room above two other rooms, the Cask
Unloading Room and the Waste Package Loading Room. There are two large holes in the floor
of the Canister Transfer Room, one above the Cask Unloading Room and one above the Waste
Package Loading Room. The CTM first lowers the (radiation) shield bell (see Fig. 3-6), which is
attached to the CTM via the shield bell trolley, onto the hole above the Cask Unloading Room.
Then the grapple beneath the canister hoist trolley is lowered through the shield bell to pull a
canister out of its transportation cask, up into the shield bell. Then the shield bell trolley moves
the shield bell with the canister inside over to the hole above the Waste Package Loading Room
where the grapple beneath the canister hoist trolley lowers the canister into the awaiting waste
package in the Waste Package Loading Room. Regarding the scale in Figure 3-6, the canister
hoist trolley (with the grapple hanging beneath it) was designed to lift and move a waste canister
whose dimensions were approximately 1.7 meters in diameter and 5 meters in length, such as the
transportation, disposal, and aging (TAD) canister used to transport commercial SNF from a
nuclear power plant to the geologic repository facility (DOE 2008, Sec. 1.5.1.1.1.2).
Deep Borehole Emplacement Mode Hazard Analysis, Revision 0 August 2015 13
Figure 3-6. Schematic of the Yucca Mountain Canister Transfer Machine (from BSC 2008b, Fig. B4.2-1).
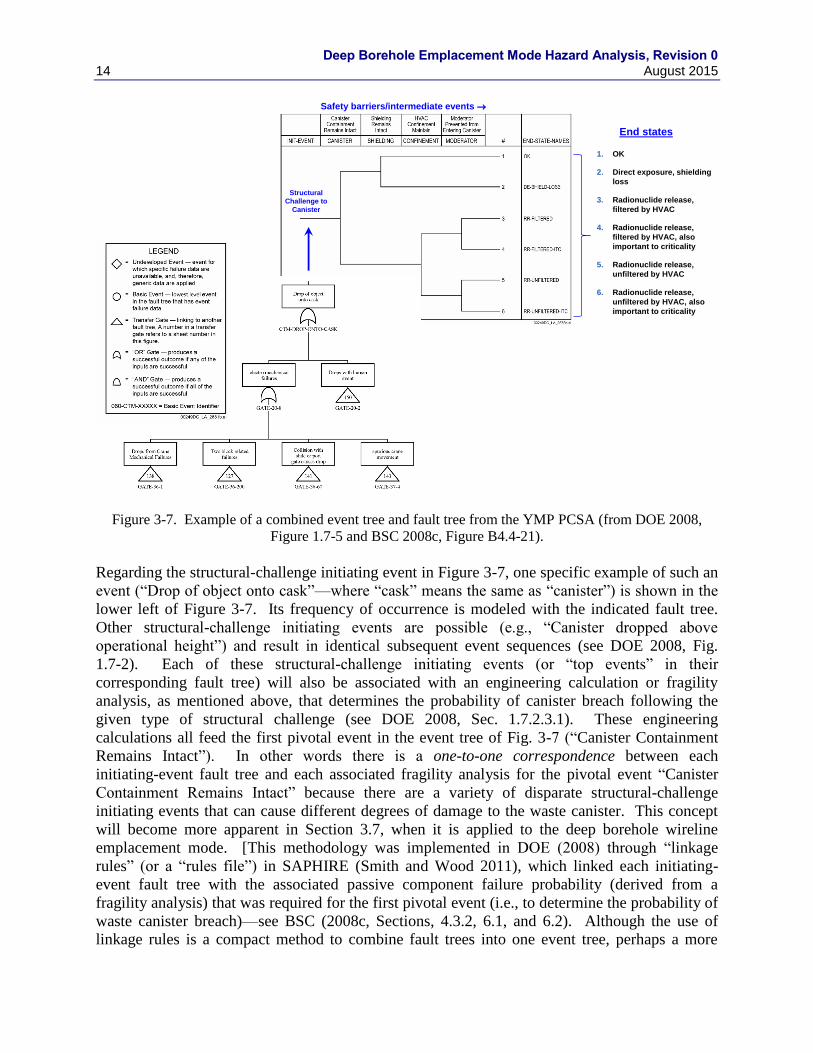
Various hazardous events, event sequences, and safety/mitigation measures were envisioned for
the CTM operations, including multiple possible initiating events that might result in a
“structural challenge” (also called a “mechanical challenge”) to the waste canister, such as
accidentally dropping the canister from the CTM during transfer, dropping an object onto the
canister during transfer, or bumping the canister strongly enough to cause damage (see DOE
2008, Fig. 1.7-2 or BSC 2008a, Fig. 11). These potential accidents represent initiating events
that might first cause a breach in the waste package, and then subsequently result in a variety of
end states depending on the success or failure of intermediate safety barriers. The sequences of
possible events following a structural challenge to the waste canister are shown as an event tree
in the upper right part of Figure 3-7, each terminating in a particular end state. The first branch
or pivotal event in the event tree shown in Figure 3-7 (“Canister Containment Remains Intact”)
is the most important from a radiological consequence perspective, since it determines whether
or not radionuclides are physically released from the waste canister. Because the waste canister
is a passive component, it will require an engineering calculation to determine whether or not
one or more of the potential structural challenges has a high enough force or stress to breach the
waste canister. This is similar to the type of analysis that would be appropriate to determine if a
drop of the waste package during deep borehole emplacement could cause a breach or not.
Regarding subsequent intermediate or pivotal events after the potential breach of the waste
canister in Figure 3-7, if radionuclides are physically released, then there is a safety barrier (the
HVAC filter system, represented as “HVAC Confinement Maintain”) which can limit the
releases. However, even if radionuclides are not released (End States 1 and 2), there is still a
potential for exposure to gamma or neutron radiation if the waste canister shielding is damaged
(End State 2). There is also a safety barrier related to the possibility of criticality in the canister.
CANISTER
GRAPPLE
Deep Borehole Emplacement Mode Hazard Analysis, Revision 0
14 August 2015
Figure 3-7. Example of a combined event tree and fault tree from the YMP PCSA (from DOE 2008,
Figure 1.7-5 and BSC 2008c, Figure B4.4-21).
Regarding the structural-challenge initiating event in Figure 3-7, one specific example of such an
event (“Drop of object onto cask”—where “cask” means the same as “canister”) is shown in the
lower left of Figure 3-7. Its frequency of occurrence is modeled with the indicated fault tree.
Other structural-challenge initiating events are possible (e.g., “Canister dropped above
operational height”) and result in identical subsequent event sequences (see DOE 2008, Fig.
1.7-2). Each of these structural-challenge initiating events (or “top events” in their
corresponding fault tree) will also be associated with an engineering calculation or fragility
analysis, as mentioned above, that determines the probability of canister breach following the
given type of structural challenge (see DOE 2008, Sec. 1.7.2.3.1). These engineering
calculations all feed the first pivotal event in the event tree of Fig. 3-7 (“Canister Containment
Remains Intact”). In other words there is a one-to-one correspondence between each
initiating-event fault tree and each associated fragility analysis for the pivotal event “Canister
Containment Remains Intact” because there are a variety of disparate structural-challenge
initiating events that can cause different degrees of damage to the waste canister. This concept
will become more apparent in Section 3.7, when it is applied to the deep borehole wireline
emplacement mode. [This methodology was implemented in DOE (2008) through “linkage
rules” (or a “rules file”) in SAPHIRE (Smith and Wood 2011), which linked each initiating-
event fault tree with the associated passive component failure probability (derived from a
fragility analysis) that was required for the first pivotal event (i.e., to determine the probability of
waste canister breach)—see BSC (2008c, Sections, 4.3.2, 6.1, and 6.2). Although the use of
linkage rules is a compact method to combine fault trees into one event tree, perhaps a more
Structural
Challenge to
Canister
Safety barriers/intermediate events
End states
1. OK
2. Direct exposure, shielding
loss
3. Radionuclide release,
filtered by HVAC
4. Radionuclide release,
filtered by HVAC, also
important to criticality
5. Radionuclide release,
unfiltered by HVAC
6. Radionuclide release,
unfiltered by HVAC, also
important to criticality
Deep Borehole Emplacement Mode Hazard Analysis, Revision 0 August 2015 15
transparent method is to construct one event tree per initiating fault tree, even though all the
pivotal events are the same for each event tree.]2
The particular fault tree shown in Figure 3-7, which produces the initiating event frequency for
the event “Drop of object onto cask,” may be induced by either of two “immediate cause” events,
either an electro-mechanical failure or a human-induced failure. Electro-mechanical failures
have any of four major causes (four intermediate events linked by an OR gate), each of which is
shown with a transfer gate below it leading to lower levels of the overall fault tree, which
decompose each intermediate event into basic events. For example, the intermediate event
“Collision with slide or port gate causes drop” is decomposed into basic events in Figure 3-8. It
is the basic events in Figure 3-8 for which reliability data are available from a variety of
databases. Several of the databases used for the YMP PCSA and, in particular, for the event
sequences established for operation of the CTM, may be useful for establishing active
component failure frequencies for some of the components used in DBFT emplacement
operations. Therefore, they are reproduced in Appendix A.
3.5 Risk Analysis and ETA/FTA Software
There are a number of commercially available hazard and risk analysis software packages that
contain ETA and FTA modules. Examples include RiskSpectrum PSA, CAFTA, Isograph
Reliability Workbench, and Item ToolKit. A more complete listing of QRA software, current as
of 2007, is given by Vinnem (2007, App. A), with an emphasis on North Sea petroleum industry
usage.
Because of precedence in the U.S. nuclear industry and U.S. regulatory environment (e.g., DOE
2008), SAPHIRE is the software chosen for the DBEMHA. However, even it may be considered
“commercial,” since the most up-to-date version requires a license from Idaho National
Laboratory (INL), as well as a non-disclosure agreement (NDA) filed with the U.S. NRC. For
the analyses in this letter report, two versions were used: (1) v.8.1.24, a recent version from
INL, available through a site-wide license issued to Sandia National Laboratories, and (2) an
older version (v8.0.9), available as freeware from the Oak Ridge National Laboratory Radiation
Safety Information Computational Center (RSICC) (Smith and Wood 2011).
2 The description of the rules file, and the associated connection between an event sequence or tree, its initiating-event fault tree,
and the passive component failure probability (e.g., for a dropped canister) used in the pivotal event describing containment, is
only described briefly in BSC 2008c. Knowledge of the SAPHIRE software is required for a complete understanding.

Deep Borehole Emplacement Mode Hazard Analysis, Revision 0
16 August 2015
Figure 3-8. Example fault tree from YMP PCSA, showing basic events, and feeding Transfer Gate 36-60
in Figure 3-7 (from DOE 2008, Figure 1.7-8; BSC 2008c, Figure B4.4-30).
3.6 Reliability and Accident Databases
Four major categories of hardware reliability databases are identified by Rausand and Hoyland
(2004, Chapter 14), as shown below, along with some examples for each category. Most of these
are commercial databases that require a membership fee or a purchase fee.
1. Component failure event databases, e.g.,
GIDEP (Government Industry Data Exchange Program) in the U.S. (free)
2. Accident and incident databases, e.g.,
MARS (Major Accident Reporting System), supported by the EU
PSID (Process Safety Incident Database), by AIChE
WOAD (World Offshore Accident Databank), by DNV (Det Norske Veritas)
BLOWOUT, the SINTEF offshore blowout database (maintained by the Foundation
for Scientific and Industrial Research in Trondheim, Norway)
Oil and Gas UK (co-sponsored by HSE, the UK Health and Safety Executive)
3. Component reliability databases, e.g.,
OREDA (Offshore Reliability Database), by DNV
RADS (Reliability and Availability Data System), by the U.S. NRC
NPRD (Nonelectronic Parts Reliability Database), by RAIC, a DoD center
PERD (Process Equipment Reliability Database), by AIChE
4. Common cause failure databases
CCFDB (Common-Cause Failure Database), by the U.S. NRC

Deep Borehole Emplacement Mode Hazard Analysis, Revision 0 August 2015 17
Another source of reliability data is the suite of YMP PCSA references listed in Appendix A, as
discussed earlier, which are all non-proprietary.
3.7 ETA/FTA for Wireline Emplacement Mode
For the wireline emplacement mode, this section presents event trees and fault trees associated
with the two primary types of top events discussed in Section 3.1.1: (1) uncontrolled drop of
waste package or equipment (“junk”) into the borehole or (2) waste package stuck in the
borehole. The fault trees in this section show the breakdown of these two top initiating events,
first into intermediate causative events, and finally into a combination/series of basic electro-
mechanical and/or human failures that could cause the top event. Each of the event trees shown
in this section portrays accident sequences and associated outcomes (end states) arising from one
of these two top initiating events, with generally only one of the end states being a success
(labeled “OK-CONTINUE”), and the rest being more or less undesirable.
A slightly different, but similar, categorization of possible top events, as well as a more detailed
set of end states (all associated with radiological risk), for deep borehole emplacement (by drill
string) has been given by Grundfelt (2013) in his Table 3-1 and Figure 3-1, respectively.
However, the events and analyses presented here are sufficient to differentiate the degree of risk
associated with the two alternative emplacement mode options, wireline or drill string.
This section first outlines a set of possible internal hazardous events for the wireline
emplacement mode (Section 3.7.1), followed by some reasonably detailed fault trees (Section
3.7.2), then two simple event trees (Section 3.7.3) showing pivotal events subsequent to the top
event, and concludes with how the fault trees and event trees might be combined in a
consequence analysis based on probabilities and frequencies derived from databases (for active
components) or fragility assumptions for passive components (Section 3.7.4).
3.7.1 Internal Hazardous Events for Wireline Emplacement Mode
Figures 3-9 and 3-10 show two of the basic steps during wireline emplacement of a waste
package: attachment of the wireline cable head to the waste package (Figure 3-9) and lowering
of the waste package by wireline into the deep borehole (Figure 3-10). There are additional steps
in between, as well as subsequent to, these two, as discussed in Cochran and Hardin (2015,
Sec. 2.5.3), several of which could give rise to potential accident initiating events. Typically, the
potential initiating events for a particular facility are formulated using a formal elicitation
technique such as HAZOP, What-If/Checklist, FMEA, or PHA (CCPS 1992)—see DOE (2008,
Sec. 1.6.3.1.3 and Table 1.6-3) that examines the facility processes in detail. The underlying
intermediate and basic events that might cause some of these initiating events may also be
identified by one of the same hazard identification techniques. For this version of the DBEMHA
potential hazardous events were identified in a series of brainstorming sessions not unlike the
PHA technique (CCPS 1992, Sec. 6.4). These events are presented in Table 3-2. Basic events in
Table 3-2, for which active component and human reliability data may be obtained from
literature sources, are established according to the design and emplacement steps given by
Cochran and Hardin (2015, Sec. 2.5.3). [See BSC (2008c), Tables 6.3-1 and 6.4-2, for examples
of active component reliability data (used for electro-mechanical basic events) and human failure
event data, respectively.]

Deep Borehole Emplacement Mode Hazard Analysis, Revision 0
18 August 2015
Figure 3-9. Electric cable head attachment step for the wireline emplacement mode.
Figure 3-10. Waste package lowering step for the wireline emplacement mode.
Another category of event for the DBEMHA, besides intermediate and basic events, is an
undeveloped event (see Figures 3-4 and 3-8). For the DBEMHA, the definition in Figure 3-8 is
adopted: an “event for which specific failure data are unavailable and, therefore, generic data are
applied.” At this stage of the emplacement design this is a convenient category for some parts of
the fault trees, since not all of the systems have been designed to a level that allows specification
of all the active components. A few “undeveloped events” are identified in Table 3-2.
Part of the goal of the deep borehole emplacement mode design (Cochran and Hardin 2015) is
risk prevention and management (Aven et al. 2007), i.e., to engineer the emplacement system in
such a way that many of the potential failure events have a negligible probability. This can be
accomplished through a number of processes and features, which together are called barriers.

Deep Borehole Emplacement Mode Hazard Analysis, Revision 0 August 2015 19
Both mechanical and procedural barriers are relied upon for this purpose. For example, the
interlock system connecting the cask doors with the BOP is an example of an electro-mechanical
system that trades off a generally larger human-error failure probability with the smaller
electromechanical failure probability of the simple interlock system. This barrier and risk trade-
off philosophy is part of the deep borehole emplacement design throughout. Thus, Table 3-2
shows both “included” and “excluded” events. The excluded events are those not included in the
fault tree because their potential occurrence is “prevented” (see Figure 3-1) by either design or
assumption, as indicated in Table 3-2.
3.7.2 Fault Tree Analysis for Wireline Emplacement Mode
Based on the hazardous events identified in Table 3-2, two fault trees for the wireline
emplacement mode have been constructed using SAPHIRE and are shown in Figures 3-11 and
3-12, one for each top event identified in Section 3.1.1. Probability values shown for each basic
event are simply placeholders at this time, but will come from reliability databases in the future
(see Section 3.6).
3.7.3 Event Tree Analysis for Wireline Emplacement Mode
For the two top events formulated in Sec. 3.1.1, Figures 3-13 and 3-14 show simple event trees
and associated event sequences for the wireline emplacement mode. Both event trees are a
sequence of pivotal events3 that include both process steps (e.g., does the waste package breach
or not) and safety barriers/function/procedures (e.g., fishing for a lost or stuck waste package).
Pivotal events that represent processes, such as “waste package breach,” are very similar to the
first pivotal events shown in both Figures 3-3 and 3-7. To determine success or failure of
process-step branches requires either (1) a fragility analysis (engineering calculation) or (2) a
fragility assumption based on expert judgment or a literature search.
Another important point about the event trees in Figures 3-13 and 3-14 is the first “event” in the
tree. This is shown as the number of operations or possible occurrences of the entire event tree,
which in this case is 400, since there are 400 waste packages per borehole. This particular
formulation of an event tree was used in DOE (2008), as described in BSC (2008c, Sec. 6.1.1.2):
“The feed on the left side of the event tree…represents the frequency of challenge to the
successful operation of the process step[s]…in the event tree.” Thus, the quantification of an
event sequence consists of calculating the expected number of occurrences of its initiating event
over the operational period and the failure probability associated with each pivotal event in the
event sequence (DOE 2008, Sec. 1.7.1), where the “initiating event” in Figures 3-13 and 3-14 is
really the second event in the sequences (the one following the number of waste package
operations).
Both the “drop” event tree in Figure 3-13 and the “stuck in hole” event tree in Figure 3-14 have a
“safety barrier” pivotal event listed as the last event in the tree. This is the pivotal event
associated with fishing a waste package which is adversely situated in the borehole. In the
“stuck in hole” event tree, the fishing “safety barrier” can simultaneously have both a favorable
3 Pivotal or intermediate events in an event tree are all called top events in SAPHIRE, probably because it is envisioned that
many of them require a separate fault tree to calculate their probability of occurrence.
Deep Borehole Emplacement Mode Hazard Analysis, Revision 0
20 August 2015
and an adverse consequence: the waste package may be successfully fished out the hole but may
be in a breached condition. It should be noted that this dual-role pivotal event is not typically
used in fault trees, and does not represent “best practice,” but was used here in order to simplify
the cost analysis for a stuck-in-hole waste package and to simplify the multi-attribution utility
analysis (MUA) that is planned for making the final choice between the two emplacement
modes. This dual role was also incorporated into one of the corresponding end states. The
primary end states, which form the basis for the event trees in Figures 3-14 and 3-15, is given in
Table 3-3. [One additional end state, not shown in Table 3-3, is Outcome G in Figure 3-13,
representing the inability to successfully fish an intact waste package that has been dropped into
the emplacement zone.]
3.7.4 Combined Event Tree/Fault Tree Analysis for Wireline Emplacement Mode
Figure 3-15 illustrates the concept mentioned above that a particular pivotal event in an event
tree may be caused by more than one initiating event (e.g., waste package breach may be caused
by different types of drop events). This is shown in Figure 3-15 by separating the fault tree from
Figure 3-11 into three separate fault trees, one for each immediate-cause drop event. For each of
these three fault trees there must be a corresponding fragility analysis for the event labeled
“Waste Package NOT Breached by Drop Event” in Figure 3-13. As described in Section 3.4,
this requires a “rules” file, or sent of linkage rules, in SAPHIRE (Smith and Wood 2011, Vol. 4,
Sec. 3.2) to associate the pivotal event with not only the fault tree that characterizes the
underlying causative basic events but also with a fragility analysis to determine the probability
that the passive component fails. [However, as first mentioned in Section 3.4, another equivalent
method would be to create a different event tree for each initiating fault tree, even though the
steps or pivotal events in all of these event trees are the same.]
For Revision 0 of this report, probabilities of the events in Table 3-2 are simply assumed, in
order to test the corresponding SAPHIRE file. In a later revision, active component failure
frequencies will be derived from either the databases listed in Section 3.6 or in Appendix A, or a
combination thereof. Also, in a later revision, some active component failure frequencies,
undeveloped event probabilities, and/or passive component failure probabilities listed in Table 3-
2 may be based on input from the expert panel members who will be elicited in the Emplacement
Mode Design Study.
The primary information desired from the event and fault trees are end-state frequencies. Based
on conservative probability values for the basic, undeveloped, and passive component events
shown in Figures 3-11 and 3-13, end-state “frequencies” for a drop occurrence are computed by
SAPHIRE and are shown in Figure 3-15. Because these end-state “frequencies” are based on the
assumption of 400 emplaced waste packages (the value used for the first top event in Figure 3-
13), they actually represent the expected number of occurrences of each end state over the entire
time of the borehole operation. They are also based on using the full fault tree in Figure 3-11
(which combines three primary causes for a “drop”) and an initial assumption of the same
passive component failure probability for each of the three different drop events, A, B, and C, as
labeled in Figure 3-15. The “frequency” number shown for the top event sequence (397.1),
labeled “OK-CONTINUE,” is determined by subtracting the sum of the frequencies for the other
three event sequencies from 400 (because SAPHIRE rounded its own computed value for the top
sequence to 400).
Deep Borehole Emplacement Mode Hazard Analysis, Revision 0 August 2015 21
Figure 3-16 indicates end-state “frequencies” (expected number of occurrences for the entire
emplacement operation) for a stuck-in-hole top initiating event. Again these frequencies are
based on conservative assumptions about underlying event probabilities.
End-state frequencies will ultimately be used in a risk-based analysis to determine a risk-based
cost associated with each of the two emplacement modes, wireline and drill string. The final cost
associated with each emplacement mode will be a combination of estimated operational cost for
normal operations plus a probability-weighted or risk-based cost associated with off-normal
events such as drops or stuck waste packages. As outlined in Table 3-3, these off-normal costs
arise from remediation measures, such as fishing, decontamination, and lost time.
Deep Borehole Emplacement Mode Hazard Analysis, Revision 0
22 August 2015
Table 3-2. Internal Initiating, Intermediate, and Basic Events Identified for the Wireline Emplacement Mode. [AC Active Component;
PC Passive Component]
Event ID
Event Identifier Description of Potential Hazardous Event (based on sequential emplacement steps)
Risk Mitigation Measures, Assumptions, and Other Notes
Screening Decision
(include/exclude)
TOP EVENT Drop waste package to emplacement zone or junk onton waste package
Probability determined by a fault tree include
Immediate-cause event Drop waste package during surface operations
Might also be considered a top event; probability determined by a fault tree. Risk prevention measure: Cask/wellhead-safety-door/blind-ram interlock system
include
Immediate-cause event Drop waste package during trip into hole Might also be considered a top event; probability determined by a fault tree.
include
Immediate-cause event Junk drops onto waste package Might also be considered a top event; probability determined by a fault tree.
include
Intermediate event Waste package drops from surface without wireline attached
include
Intermediate event Waste package drops from surface with wireline attached
include
Intermediate event Wireline breaks during during trip in include
Intermediate event Cable head releases accidentally during trip in include
Intermediate event Spooling wireline too fast causes bird cage Risk prevention measure: Automated speed and tension control on wireline winch
include
Intermediate event Wireline cut or sheared include
Intermediate event Cask door shears wireline include
Intermediate event Blind ram shears wireline include
TOP EVENT Waste package stuck in borehole (in guidance casing)
Probability determined by a fault tree include
Immediate-cause event Undetected narrowing of guidance casing Risk prevention measure: Run caliper log prior to lowering a waste package
include
Immediate-cause event Undetected dogleg in guidance casing Risk prevention measure: Run deviation log prior to lowering a waste package
include
Undeveloped event Guidance casing becomes misaligned or narrows after caliper log
include
Undeveloped event Guidance casing doglegs after deviation log include
Undeveloped event Caliper log fails – gives undetected erroneous readings
include
Undeveloped event Deviation log fails – gives undetected erroneous readings
include
Undeveloped event Heavy junk falls into borehole include
Undeveloped event Waste package left in emplacement zone; unbreached
This is a pivotal event in the “drop” event tree. Fishing failed to retrieve a dropped waste package from the emplacement
include

Deep Borehole Emplacement Mode Hazard Analysis, Revision 0 August 2015 23
Event ID
Event Identifier Description of Potential Hazardous Event (based on sequential emplacement steps)
Risk Mitigation Measures, Assumptions, and Other Notes
Screening Decision
(include/exclude)
zone.
Undeveloped event Stuck waste package is above the emplacement zone
This is a pivotal event in the “stuck in hole” event tree include
Basic event – PC Waste package breached by dropping or falling junk breaches waste package
This is a pivotal event in the “drop” event tree. This is a passive component failure of the waste package that may be a function of the impact energy—requires one or more fragility analyses or assumptions.
include
Basic event – PC Waste package breached during a fishing operation for a waste package stuck above the emplacement zone
This is a pivotal event in the “stuck in hole” event tree. This passive component failure of the waste package has two components or aspects: the probability that the fish can be retrieved and the probability of whether the fish will be breached during retrieval operations—it might be considered a “compound event” in SAPHIRE.
include
Basic event – AC Cask door closes spontaneously include
Basic event – AC Cask door opens spontaneously include
Basic event – AC BOP blind ram closes spontaneously include
Basic event – AC BOP blind ram opens spontaneously include
Basic event – AC Wireline fatigue failure Risk prevention measure: Schlumberger TuffLINE cable include
Basic event – AC Wireline winch brake failure (hydraulic) include
Basic event – AC Wireline winch brake failure (electric) include
Basic event – AC Door interlock system fails include
Basic event – AC Electrical-mechanical switch in cable head malfunctions and releases waste package early
include
Basic event – AC Cable head connection to waste package comes loose
include
Basic human event Operator spools waste package “past TD” or “past previous waste package”
Risk prevention measure: Procedural and software controls; “crush box” on bottom of waste package
include
Basic human event Forgot to run caliper log prior to lowering a WP include
Basic human event Forgot to run deviation log prior to lowering a WP
include
Basic human event Winch operator inattention include
Basic human event Operator pushes cable head release button prematurely
include
Basic event BOP (blind ram) closes on the spontaneously waste package
Risk prevention assumption: Waste package is strong enough to be structurally unaffected.
exclude
Basic event Lower cask door closes spontaneously on the waste package
Risk prevention assumption: Waste package is strong enough to be structurally unaffected.
exclude
Basic event Cable head fails to release while package is at TD
May not result in a hazardous event; only requires an extra trip in and out to fix the cable head
exclude

Deep Borehole Emplacement Mode Hazard Analysis, Revision 0
24 August 2015
Event ID
Event Identifier Description of Potential Hazardous Event (based on sequential emplacement steps)
Risk Mitigation Measures, Assumptions, and Other Notes
Screening Decision
(include/exclude)
Basic event Cable head releases on trip out with waste package still attached, releasing package to free fall to the bottom
May not result in a hazardous event, since the package should reach the emplacement zone; also requires previous failure of cable head release at TD
exclude
Basic event Upper cask door closes spontaneously after cable head is attached but while lower cask door is still closed.
Risk prevention measure: A restraint to prevent upper door closing is set prior to cable head attachment. Furthermore, the package has “nowhere to go” at this point, so no significant damage.
exclude
Basic human event
Prior to attachment of cable head, the operator mistakenly opens the lower door on the shipping cask instead of the upper one, dropping package onto the blind ram in the wellhead below
Risk prevention measure: Door/ram/wireline hoist interlock system, including a “deadman” lock out (in case of loss of power or inadvertent energization). This event is not considered to be hazardous enough to include in the analysis.
exclude
Basic human event
Cable head pulls loose, dropping the package on the lower cask door, because operator accidentally tried to spool the cable upward beyond the range-limiting pin
Risk prevention assumption: Such a drop within the cask would be small and not cause damage to the package, the cask, or the lower door.
exclude
Table 3-3. End States Identified for Hazardous Event Sequences Associated with the Wireline Emplacement Mode.
Outcome Key Assumptions Occupational
Safety
Detectable Radiation Leakage
Incremental Cost (> normal wireline ops)
A WP(s) breached above disposal zone (e.g., by fishing)
Fishing successful; borehole decon, sealing, plugging
TBD (primary risk may be radiological exposure
during repair of critical
equipment)
Yes Fishing and remediation; delay; decon; loss of hole
B WP(s) breached in emplacement zone
No fishing; borehole decon, sealing, plugging
Yes Remediation; delay; decon; loss of hole
C
WP(s) dropped into emplacement zone (or something dropped onto WPs); no breach
Fishing successful; WP(s) retrieved, inspected, replaced; borehole useable
No
Fishing (incl. string); delay; WP transport, inspection and replacement
D WP(s) stuck in disposal zone; no breach
No fishing or further emplacement; cementing, sealing, plugging per plan
No Delay; loss of disposal capacity
E WP(s) stuck above disposal zone; no breach
Fishing successful; WP(s) retrieved; no further emplacement; cementing, sealing, plugging per plan
No Fishing; delay; loss of disposal capacity
Normal operations; emplace 400 WPs:
F1 Drill string None See above
No See cost analysis
F2 Wireline No Zero
Deep Borehole Emplacement Mode Hazard Analysis, Revision 0 August 2015 25
Figure 3-11. Fault tree for “drop” top event during wireline emplacement.
[Note: Intermediate events are shown in light blue and basic events in purple. Basic events are shown in “stacked mode”, where the “circle”
basic-event symbol applies to all basic events above it.]
WL-DROP-WP
Drop of WP to EZ or Drop of Junk onto WP
WL-DROP-WP2
Drop Waste Package From
Surface to Emplacment Zone
WL-DROP-WP22
Waste package drops from surface without wireline
1.00E-04WL-EM-CH-SWITCH
Electromechanical cablehead
switch activates
spontaneously
1.00E-07WL-BR-OP-ELEC-HYD
Blind ram opens spontaneously
1.00E-07WL-DR-OP-CASK-ELEC
Cask door opens spontaneously
1.00E-06WL-IL-DOOR
Door interlock system fails
WL-DROP-WP23
Waste package and wireline
drop from surface together
1.00E-05WL-WINCH-BRK-HYD
Wireline winch brake failure - hydraulic
1.00E-06WL-DROP-BRK-ELEC
Wireline winch brake failure - electric
WL-DROP-WP3
Drop Waste Package During
Trip In - Falls to Emplacement
Zone
WL-DROP-WP32
Break in wireline drops Waste Package during trip
WL-DROP-WP323
Spooling too fast causes birdcage and break
1.00E-05WL-WINCH-BRK-HYD
Wireline winch brake failure - hydraulic
1.00E-03WL-HE-INATN
Winch operator inattention
1.00E-06WL-DROP-BRK-ELEC
Wireline winch brake failure - electric
WL-DROP-WP324
Wireline cut or sheared
WL-DROP-WP3242
Cask door shears wireline
1.00E-06WL-IL-DOOR
Door interlock system fails
1.00E-07WL-DR-CL-CASK-ELEC
Cask door closes spontaneously
WL-DROP-WP3243
Blind ram shears wireline
1.00E-06WL-IL-DOOR
Door interlock system fails
1.00E-07WL-BR-CL-ELEC-HYD
Blind ram closes spontaneously
1.00E-07WL-FATIGUE
Wireline fatigue failure
WL-DROP-WP33
Cablehead spurious operation
drops WP during trip
1.00E-04WL-EM-CH-SWITCH
Electromechanical cablehead
switch activates
spontaneously
1.00E-03WL-HE-CH-SWITCH
Operator presses cablehead
release button prematurely
1.00E-04WL-CH-MECH-CONN
Cablehead connection to
waste package comes loose
WL-DROP-WP4
Junk Drops onto WP in Emplacement Zone
1.00E-03WL-JUNK-HEAVY
Heavy junk falls into hole during wireline operations
1.00E-03WL-DP-PAST-TD
Operator spools WP past TD or past previous WP

Deep Borehole Emplacement Mode Hazard Analysis, Revision 0
26 August 2015
Figure 3-12. Fault tree for “stuck-in-hole” top event during wireline emplacement.
WIRE-WP-STUCK
Waste Package Stuck in Hole
WI-NARR-GC
Undetected Narrowing of Guidance Casing
WI-EQ-NARR
Equipment Failure
1.00E-05WI-CAL-FAIL
Caliper fails - erroneous reading
1.00E-07WI-GC-NARR-FAIL
Guidance casing narrows after caliper log
WI-HE-NARR
Human Failure
1.00E-04WI-CAL-HE
Procedural error - forgot to run caliper log
WI-DOG
Unacceptable and Undetected
Dogleg in Guidance Casing
WI-EQ-DOG
Equipment Failure
1.00E-05WI-DEV-FAIL
Deviation log fails - erroneous reading
1.00E-07WI-GC-DOG-FAIL
Guidance casing doglegs after deviation log
WI-HE-DOG
Human Failure
1.00E-04WI-DEV-HE
Procedural error - forgot to run deviation log
Deep Borehole Emplacement Mode Hazard Analysis, Revision 0 August 2015 27
Figure 3-13. Event tree for “drop” top event during wireline emplacement.
[Note: “Up” branches in SAPHIRE represent “success” and “down” branches represent “failure.” Thus underlying fault trees (representing
failures or adverse conditions) are associated with the down branch. This implies that the associated pivotal event in the event tree should be
“named in the negative” when compared with the name of the top event in the associated fault tree.]
Figure 3-14. Event tree for “stuck-in-hole” top event during wireline emplacement.
NUM-WP-WIRE
Number of Emplaced WPs - Wireline
WL-DROP-WP
Drop Event Does NOT Occur
WL-WP-BREACH-DROP
Waste Package NOT Breached by Drop Event
FISH-FAIL-DROP
Successful Fishing of Dropped WP
# End State(Phase - )
Comments(Phase - )
No Drop 1 OK-CONTINUE Outcome F
Drop
WP Intact
Fished 2 OK-FISH-CONTINUE Outcome C
Left in Hole 3 OK-BRIDGE-PLUG-CONTINUE
Outcome G
WP Breached 4 DECON-SEAL-ABANDON Outcome B
NUM-WP-WIRE
Number of Emplaced WPs - Wireline
WIRE-WP-STUCK
Waste Package Freely
Reaches Emplacement Zone
WP-STUCK-ABOVE-EZ
Waste Package Stuck In Emplacement Zone
FISH-BREACH
WP Fished Intact (Fishing Does NOT Damage WP)
# End State(Phase - )
Comments(Phase - )
Not Stuck 1 OK-CONTINUE Outcome F
Stuck
Stuck In EZ 2 STUCK-IN-EZ-NOBREACH
Outcome D
Stuck Above EZ
Fished Intact 3 FISHED-NO-BREACH-ABANDON
Outcome E
Fished/Breached 4 STUCK-ABOVE-EZ-BREACHED
Outcome A

Deep Borehole Emplacement Mode Hazard Analysis, Revision 0
28 August 2015
Figure 3-15. SAPHIRE-based combined event tree/fault tree analysis for the “drop” top event during wireline emplacement.
[Note: End-state frequencies are based on 400 emplaced waste packages and an assumption of the same passive component failure probability for
three different drop events: A, B, and C. End-state frequencies for sequences 2, 3, and 4 are conservatively high at this time.]
NUM-WP-WIRE
Number of Emplaced WPs - Wireline
WL-DROP-WP
Drop Event Does NOT Occur
WL-WP-BREACH-DROP
Waste Package NOT Breached by Drop Event
FISH-FAIL-DROP
Successful Fishing of Dropped WP
# End State(Phase - )
Frequency(Phase - )
Comments(Phase - )
No Drop 1 OK-CONTINUE 397.1 Outcome F
Drop
WP Intact
Fished 2 OK-FISH-CONTINUE 1.68 Outcome C
Left in Hole 3 OK-BRIDGE-PLUG-CONTINUE
1.18 Outcome G
WP Breached 4 DECON-SEAL-ABANDON 1.68E-05 Outcome B
(Prob. by assumption)
WL-DROP-WP3
Drop Waste Package During
Trip In - Falls to Emplacement
Zone
WL-DROP-WP32
Break in wireline drops Waste Package during trip
WL-DROP-WP323
Spooling too fast causes birdcage and break
1.00E-05WL-WINCH-BRK-HYD
Wireline winch brake failure - hydraulic
1.00E-03WL-HE-INATN
Winch operator inattention
1.00E-06WL-DROP-BRK-ELEC
Wireline winch brake failure - electric
WL-DROP-WP324
Wireline cut or sheared
WL-DROP-WP3242
Cask door shears wireline
1.00E-06WL-IL-DOOR
Door interlock system fails
1.00E-07WL-DR-CL-CASK-ELEC
Cask door closes spontaneously
WL-DROP-WP3243
Blind ram shears wireline
1.00E-06WL-IL-DOOR
Door interlock system fails
1.00E-07WL-BR-CL-ELEC-HYD
Blind ram closes spontaneously
1.00E-07WL-FATIGUE
Wireline fatigue failure
WL-DROP-WP33
Cablehead spurious operation
drops WP during trip
1.00E-04WL-EM-CH-SWITCH
Electromechanical cablehead
switch activates
spontaneously
1.00E-03WL-HE-CH-SWITCH
Operator presses cablehead
release button prematurely
1.00E-04WL-CH-MECH-CONN
Cablehead connection to
waste package comes loose
A
WL-DROP-WP4
Junk Drops onto WP in Emplacement Zone
1.00E-03WL-JUNK-HEAVY
Heavy junk falls into hole during wireline operations
1.00E-03WL-DP-PAST-TD
Operator spools WP past TD or past previous WP
C
WL-DROP-WP2
Drop Waste Package From
Surface to Emplacment Zone
WL-DROP-WP22
Waste package drops from surface without wireline
1.00E-04WL-EM-CH-SWITCH
Electromechanical cablehead
switch activates
spontaneously
1.00E-07WL-BR-OP-ELEC-HYD
Blind ram opens spontaneously
1.00E-07WL-DR-OP-CASK-ELEC
Cask door opens spontaneously
1.00E-06WL-IL-DOOR
Door interlock system fails
WL-DROP-WP23
Waste package and wireline
drop from surface together
1.00E-05WL-WINCH-BRK-HYD
Wireline winch brake failure - hydraulic
1.00E-06WL-DROP-BRK-ELEC
Wireline winch brake failure - electric
B
Passive Component
Fragility Analysis or
Assumption
C
Passive Component
Fragility Analysis or
Assumption
B
Passive Component
Fragility Analysis or
Assumption
A
WL-WP-BREACH-DROP
Wireline -- Waste Package Breached by Drop Event
1.00E-05WL-WP-BREACH-DROP-BE
WP Breached by Dropping, or
Falling Junk Breaches WP
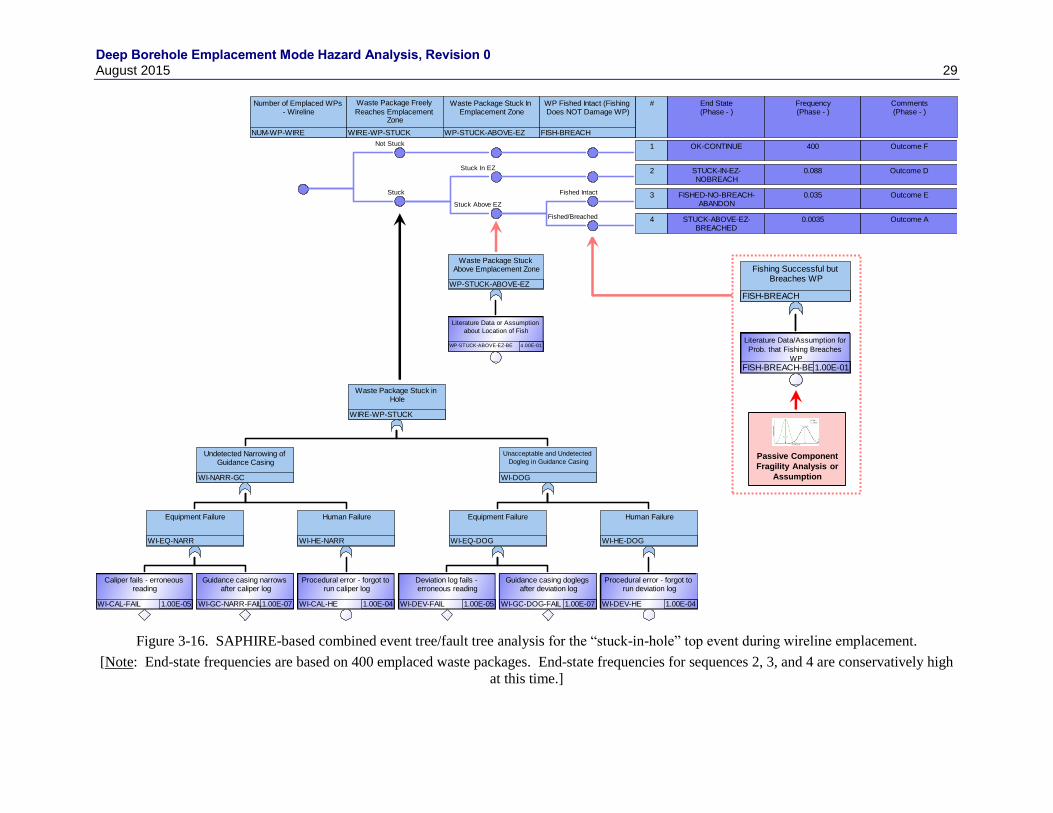
Deep Borehole Emplacement Mode Hazard Analysis, Revision 0 August 2015 29
Figure 3-16. SAPHIRE-based combined event tree/fault tree analysis for the “stuck-in-hole” top event during wireline emplacement.
[Note: End-state frequencies are based on 400 emplaced waste packages. End-state frequencies for sequences 2, 3, and 4 are conservatively high
at this time.]
Passive Component
Fragility Analysis or
Assumption
FISH-BREACH
Fishing Successful but Breaches WP
1.00E-01FISH-BREACH-BE
Literature Data/Assumption for
Prob. that Fishing Breaches
WP
NUM-WP-WIRE
Number of Emplaced WPs - Wireline
WIRE-WP-STUCK
Waste Package Freely
Reaches Emplacement Zone
WP-STUCK-ABOVE-EZ
Waste Package Stuck In Emplacement Zone
FISH-BREACH
WP Fished Intact (Fishing Does NOT Damage WP)
# End State(Phase - )
Frequency(Phase - )
Comments(Phase - )
Not Stuck 1 OK-CONTINUE 400 Outcome F
Stuck
Stuck In EZ 2 STUCK-IN-EZ-NOBREACH
0.088 Outcome D
Stuck Above EZ
Fished Intact 3 FISHED-NO-BREACH-ABANDON
0.035 Outcome E
Fished/Breached 4 STUCK-ABOVE-EZ-BREACHED
0.0035 Outcome A
WIRE-WP-STUCK
Waste Package Stuck in Hole
WI-NARR-GC
Undetected Narrowing of Guidance Casing
WI-EQ-NARR
Equipment Failure
1.00E-05WI-CAL-FAIL
Caliper fails - erroneous reading
1.00E-07WI-GC-NARR-FAIL
Guidance casing narrows after caliper log
WI-HE-NARR
Human Failure
1.00E-04WI-CAL-HE
Procedural error - forgot to run caliper log
WI-DOG
Unacceptable and Undetected
Dogleg in Guidance Casing
WI-EQ-DOG
Equipment Failure
1.00E-05WI-DEV-FAIL
Deviation log fails - erroneous reading
1.00E-07WI-GC-DOG-FAIL
Guidance casing doglegs after deviation log
WI-HE-DOG
Human Failure
1.00E-04WI-DEV-HE
Procedural error - forgot to run deviation log
WP-STUCK-ABOVE-EZ
Waste Package Stuck Above Emplacement Zone
4.00E-01WP-STUCK-ABOVE-EZ-BE
Literature Data or Assumption
about Location of Fish

Deep Borehole Emplacement Mode Hazard Analysis Letter Report
30 August 2015
3.8 ETA/FTA for Drill String Emplacement Mode
For Revision 0 of this report, this section is effectively a placeholder for future event trees and
fault trees corresponding to the drill string emplacement mode. Figure 3-17 is a schematic
diagram of the system used for drill string emplacement of waste packages.
Figure 3-17. Schematic of emplacement workover rig, basement, transport carrier, and shipping cask in
position for waste emplacement by drill string (from Cochran and Hardin 2015, Fig. 2).
Similarly to Table 3-2 for wireline, a table of internal hazardous events will be developed for
drill string emplacement, based on the emplacement steps outlined in Section 2.4.3 of Cochran
and Hardin (2015). An initial cut of these potential events has been made and is summarized in
the “loss of control” fault tree in Figure 3-18. [This preliminary tree was created at time when
the end states for a drop event were undifferentiated from the end states corresponding to a stuck
event. Revision 1 of this report will make this differentiation for the drill string emplacement
mode, along with a set of corresponding event trees and fault trees.]

Deep Borehole Emplacement Mode Hazard Analysis Letter Report August 2015 31
Figure 3-18. Fault tree for “loss of control” top event during drill string emplacement.
DS
Loss of Control of a Waste Package Group
DS0
Drop packages while
assembling waste package
group
DS40
Drill string not attached to packages
DS400
Inadvertant early release of packages
1.0000E+00DS4001
Human inadvertantly sends
command to lower packages
1.0000E+00DS4002
Blind ram withdraws and power slips fail
DS403
Equipment malfunction
1.0000E+00DS401
Blind ram and power slips fail,
releasing packages down hole
1.0000E+00DS402
Bad joint on partially
assembled waste package
group
DS41
Drill string attached to packages
1.0000E+00DS410
Fail to clamp drill string
1.0000E+00DS412
Elevator fails
1.0000E+00DS413
Bad joint in drill string
1.0000E+00DS414
Bad joint in waste package group
DS1
Drop string and packages tripping into the hole
DS10
Human Error
1.0000E+00DS100
Undeveloped Event
DS11
Equipment failure
1.0000E+00DS4210
Fail to clamp string
1.0000E+00DS4211
Elevator fails
1.0000E+00DS4212
Bad joint in drill string
1.0000E+00DS4213
Bad joint in waste package group
DS2
Waste package group gets
stuck downhole during
emplacement
DS435
Guidance casing is deformed or collapsed
DS20
Human Error
1.0000E-03DS200
Operator fails to react to
warning from sensors on
instrumentation package
DS21
Equipment failure
1.0000E+00DS210
Sensor on instrumentaion
package fails to report
deformed or collapsed casing
1.0000E+00DS43011
Software fails to alert operator
of sensor readings on
deformed or collapsed casing
DS3
Drop drill string tripping out of hole
1.0000E+00DS442
Elevator fails
1.0000E+00DS443
Fail to clamp drill string
1.0000E+00DS444
Bad joint in drill string

Deep Borehole Emplacement Mode Hazard Analysis, Revision 0
32 August 2015
4. REFERENCES
Anderson, S. and B. A. Mostue 2012. “Risk analysis and risk management approaches applied to the
petroleum industry and their applicability to IO concepts,” Safety Science 50, 2010-2019.
Atwood, C. L., J. L. LaChance, H. F. Martz, D. J. Anderson, M. Englehardt, D. Whitehead, and T.
Wheeler 2003. Handbook of Parameter Estimation for Probabilistic Risk Assessment, NUREG/CR-6823,
U.S. Nuclear Regulatory Commission, Washington DC 20555, ADAMS #ML032900131, SAND2003-
3348P, Sandia National Laboratories, Albuquerque, NM.
Aven, T. and J. E. Vinnem 2007. Risk Management: With Applications from the Offshore Petroleum
Industry, Springer-Verlag London Limited.
Aven, T., J. E. Vinnem, and H. S. Wiencke 2007. “A decision framework for risk management, with
application to the offshore oil and gas industry,” Reliability Engineering and System Safety 92, 433-448.
Brandsaeter, A. 2002. “Risk assessment in the offshore industry,” Safety Science 40, 231-269.
BORA (Barriere & Operajonell Riskoanalyse) 2007. Operational Risk Analysis—Total Analysis of
Physical and Non-physical Barriers, BORA Handbook Rev 00, June 26, 2007, Preventor AS, Jan Erik
Vinnem, Ulstadvn 8, P.O. Box 56, 7541 Klaebu, Norway, http://preventor.no/projects/bora-barrier-and-
operational-risk-analysis/
Burtonshaw-Gunn, S. A. 2009. Risk and Financial Management in Construction, Fig. 3-8, ISBN 978-0-
5660-8897-1, Ashgate, also Gower at www.gpmfirst.com
BSC 2008a. Canister Receipt and Closure Facility Event Sequence Development Analysis. 060-PSA-
CR00-00100-000-00A CACN 001. Las Vegas, Nevada: Bechtel SAIC Company. ACC:
ENG.20080221.0008, February 2008.
BSC 2008b. Canister Receipt and Closure Facility Reliability and Event Sequence Categorization
Analysis. 060-PSA-CR00-00200-000-00A CACN 001. Las Vegas, Nevada: Bechtel SAIC Company.
ACC: ENG.20080311.0031, March 2008.
BSC 2008c. Canister Receipt and Closure Facility Reliability and Event Sequence Categorization
Analysis. 060-PSA-CR00-00200-000-00B. Las Vegas, Nevada: Bechtel SAIC Company. ACC:
ENG.20090112.0004, November 2008.
Calixto, E. 2013. Gas and Oil Reliability Engineering Modeling and Analysis, Gulf Professional
Publishing (an imprint of Elsevier), Waltham, MA 02451, ISBN 978-0-12-391914-4.
CCPS (Center for Chemical Process Safety) 1992. Guidelines for Hazard Evaluation Procedures, 2nd
Edition with Worked Examples, American Institute of Chemical Engineers, New York, New York, 1992.
Cochran, J. R. and E. L. Hardin 2015. Handling and Emplacement Options for Deep Borehole Disposal
Conceptual Design, Revision 9, SAND2015-6218, Sandia National Laboratories, Albuquerque, NM, July
28, 2015.
CSB (US Chemical Safety and Hazard Investigation Board) 2014. Investigation Report, Volumes 1 and
2: Explosion and Fire at the Macondo Well, CSB, 2175 K Street, Washington DC 20037, June 5, 2014.
http://www.csb.gov/macondo-blowout-and-explosion/
DOE (U.S. Department of Energy) 2008. Yucca Mountain Repository License Application Safety Analysis
Report. DOE/RW-0573, Revision 1. U.S. Department of Energy, Washington, D.C.
(http://www.nrc.gov/waste/hlw-disposal/yucca-lic-app/yucca-lic-app-safety-report.html#1 )
Deep Borehole Emplacement Mode Hazard Analysis, Revision 0 August 2015 33
DOE (U.S. Department of Energy) 1997. DOE Standard: Hazard Categorization and Accident Analysis
Techniques for Compliance with DOE Order 5480.23, Nuclear Safety Analysis Reports. DOE-STD-1027-
92, Change Notice No. 1, September 1997. U.S. Department of Energy, Washington, D.C. 20585
Gran B.A., R. Bye, O.M. Nyheim, E.H. Okstad, J. Seljelid, S. Sklet, J. Vatn, and J.E. Vinnem 2012.
“Evaluation of the Risk OMT model for maintenance work on major offshore process equipment,”
Journal of Loss Prevention in the Process Industries 25, 582-593.
Grundfelt, B. 2013. Radiological consequences of accidents during disposal of spent nuclear fuel in a
deep borehole, SKB P-13-13, ISSN 1651-4416, ID 1400978, Swedish Nuclear Fuel and Waste
Management Co, Box 250, SE-101 24 Stockholm, July 2013, www.skb.se
Hardin, E. L. 2015. Waste Package Emplacement Cost Estimates for Deep Borehole Disposal,
SAND2015-6372-O, Sandia National Laboratories, Albuquerque, NM, July 31, 2015.
Huang, Z. and Y. Jin 2009. “Extension of Stress and Strength Interference Theory for Conceptual
Design-for-Reliabiltiy,” J. Mech. Des 131(7), 071001 (May 27, 2009), ASME.
Marhavilas, P. K., D. Koulouriotis, and V. Gemeni 2011. “Risk analysis and assessment methodologies in
the work sites: On a review, classification and comparative study of the scientific literature of the period
2000-2009,” Journal of Loss Prevention in the Process Industries 24, 477-523.
Matanovic, D., N. Gaurina-Medimurec, and K. Simon 2014. Risk Analysis for Prevention of Hazardous
Situations in Petroleum and Natural Gas Engineering, Engineering Science Reference (an imprint of IGI
Global), Hershey, PA 17033, ISBN 978-1-4666-4777-0.
NAIIC 2012. The Official Report of the Fukushima Nuclear Accident Independent Investigation
Commission, The National Diet of Japan, 2012.
NORSOK 2001. NORSOK Standard Z-013, Risk and Emergency Preparedness Analysis, Rev.2.,
Norwegian Technology Centre, Oslo, Norway.
NRC 2007. Interim Staff Guidance HLWRS-ISG-02, Preclosure Safety Analysis - Level of
Information and Reliability Estimation. HLWRS-ISG-02. Washington, D.C.: U.S. Nuclear
Regulatory Commission.
NRC (Nuclear Regulatory Commission) 2000. Technical Basis and Implementation Guidelines for a
Technique for Human Event Analysis, NUREG-1624, U.S. Nuclear Regulatory Commission, Washington
DC 20555, ADAMS #ML003719212.
NRC (Nuclear Regulatory Commission) 1998. Nuclear Fuel Cycle Facility Accident Analysis Handbook,
NUREG/CR-6410, U.S. Nuclear Regulatory Commission, Washington DC 20555, ADAMS
#ML072000468.
NRC (Nuclear Regulatory Commission) 1983. PRA Procedures Guide, A Guide to the Performance of
Probabilistic Risk Assessments for Nuclear Power Plants, Volumes 1 and 2, NUREG/CR-2300, U.S.
Nuclear Regulatory Commission, Washington DC 20555, ADAMS # ML063560439 and ML063560440.
Pitblado R., B. Bain, A. Falck, K. Litland, and C. Spitzenberger 2012. “Frequency data and modification
factors used in QRA studies,” Journal of Loss Prevention in the Process Industries 24, 249-258.
Rausand, M. and A. Hoyland 2004. System Reliabiltiy Theory: Models, Statistical Methods, and
Applications, Second Edition, John Wiley & Sons, Inc., Hoboken, NJ.
Skogdalen, J. E. and J. E. Vinnem 2012. “Quantitative risk analysis of oil and gas drilling, using
Deepwater Horizon as case study,” Reliability Engineering and System Safety 100, 58-66.
Skogdalen, J. E. and J. E. Vinnem 2011. “Quantitative risk analysis offshore—Human and organizational
factors,” Reliability Engineering and System Safety 96, 468-479.
Deep Borehole Emplacement Mode Hazard Analysis, Revision 0
34 August 2015
Smith, C. L. and S. T. Wood 2011. Systems Analysis Programs for Hands-on Integrated Reliability
Evaluations (SAPHIRE) Version 8, NUREG/CR-7039, Volumes 1 through 7, U.S. Nuclear Regulatory
Commission, Washington DC 20555, June 2011.
Thaheem, M. J., A. De Marco, and K. Barlish. 2012. “A Review of Quantitative Analysis Techniques for
Construction Project Risk Management,” in Proceedings of the Creative Construction Conference 2012,
ed: M. Hajdu and M. J. Skibniewski, Budapest, Hungary, June 30 – July 3, 2012, ISBN 978-963-269-
297-5, Diamond Congress Ltd., Budapest, www.diamond-congress.hu
Vesely, W. E., F.F. Goldberg, N.M. Roberts, and D.F. Haasl (1981). Fault Tree Handbook, NUREG–
0492, Office of Nuclear Regulatory Research. U.S. Nuclear Regulatory Commission: Washington DC,
January 1981.
Vinnem, J. E. 2007. Offshore Risk Assessment: Principles, Modelling and Applications of QRA Studies,
2nd
Edition, Springer-Verlag London Limited 2007.
Vinnem, J.E., R. Bye, B.A. Gran, T. Kongsvik, O.M. Nyheim, E.H. Okstad, J. Seljelid, and J. Vatn 2012.
“Risk modelling of maintenance work on major process equipment on offshore petroleum installations,”
Journal of Loss Prevention in the Process Industries 25, 274-292.
Vinnem, J. E., T. Aven, T. Husebo, J. Seljelid, and O. J. Tveit 2006. “Major hazard risk indicators for
monitoring of trends in the Norwegian offshore petroleum sector,” Reliability Engineering and System
Safety 91, 778-791.
Deep Borehole Emplacement Mode Hazard Analysis, Revision 0 August 2015 35
APPENDIX A:
Active Component Reliability Data Sources Used in the YMP PCSA
BSC 2008c (Sec. C1.2) states that the following data sources had to be widely available, not
proprietary. These references come from BSC 2008c, Attachment C, Table C1.2 and Sec. C5.
C5.1 *AIChE (American Institute of Chemical Engineers) 1989. Guidelines for Process Equipment
Reliability Data with Data Tables. G-07. New York, New York: American Institute of Chemical
Engineers, Center for Chemical Process Safety. TIC: 259872. ISBN: 978-0-8169-0422-8.
C5.5 *Blanton, C.H. and Eide, S.A. 1993. Savannah River Site, Generic Data Base Development (U).
WSRC-TR-93-262. Aiken, South Carolina: Westinghouse Savannah River Company. TIC: 246444.
C5.6 *Borkowski, R.J.; Kahl, W.K.; Hebble, T.L.; Fragola, J.R.; Johnson, J.W. 1983. The In Plant
Reliability Data Base for Nuclear Plant Components: Interim Report-The Valve -Component.
NUREG/CR-3154; ORNL/TM-8647. Oak Ridge, TN: Oak Ridge National Laboratory. ACC:
MOL.20071129.0315.
C5.7 BSC 2007 (Bechtel SAIC Company). Waste Form Throughputs for Preclosure Safety Analysis.
000-PSA-MGRO-01800-000-00A. Las Vegas, Nevada: Bechtel SAIC Company. ACC:
ENG.20071106.0001.
C5.8 *Canavan, K.; Gregg, B.; Karimi, R.; Mirsky, S.; and Stokley, J. 2004. Probabilistic Risk
Assessment (PRA) of Bolted Storage Casks, Updated Quantification and Analysis Report. 1009691.
Palo Alto, California: Electric Power Research Institute. TIC: 257542.
C5.10 *Derdiger, J.A.;Bhatt, K.M.;Siegfriedt, W.E. 1981. Component Failure and Repair Data for
Coal-Fired Power Units. EPRI AP-2071. Palo Alto, CA: Electric Power Research Institute. TIC:
260070.
C5.11 *Dhillon, B.S. 1988. Mechanical Reliability: Theory, Models and Applications. AIAA Education
Series. Washington, D.C.: American Institute of Aeronautics & Astronautics. TIC: 259878.
C5.12 *DOD (U.S. Department of Defense) 1991. Military Handbook, Reliability Prediction of
Electronic Equipment. MIL-HDBK-217F. Washington, D.C.: U.S. Department of Defense. TIC:
232828.
C5.13 *Drago, J.P.; Borkowski, R.J.; Fragola, J.R.; and Johnson, J.W. 1982. The In-Plant Reliability
Data Base for Nuclear Plant Components: Interim Data Report The Pump Component. NUREG/CR-
2886. Washington, D.C.: U.S. Nuclear Regulatory Commission. ACC: MOL.20071219.0222.
C5.14 *E.I. du Pont de Nemours & Company 1981. Some Published and Estimated Failure Rates for
Use in Fault Tree Analysis. Wilmington, Delaware: E.I. du Pont de Nemours & Company. TIC:
260092.
C5.15 *Eide, S.A.; Gentillon, C.D.; Wierman, T.E.; and Rasmuson, D.M. 2005. Analysis of Station
Blackout Risk. Volume 2 of Reevaluation of Station Blackout Risk at Nuclear Power Plants.
NUREG/CR-6890. Washington, D.C.: U.S. Nuclear Regulatory Commission. ACC:
MOL.20071114.0165.
C5.16 *Eide, S.A.; Wierman, T.E.; Gentillon, C.D.; Rasmuson, D.M.; and Atwood, C.T. 2007.
Industry-Average Performance for Components and Initiating Events at U.S. Commercial Nuclear
Power Plants. NUREG/CR-6928. Washington, D.C.: U.S. Nuclear Regulatory Commission. ACC:
MOL.20071211.0229.
C5.17 *Federal Railroad Administration. 2004. "Train Accidents by Cause from Form FRA F 6180.54."
Washington, D.C.: U.S. Department of Transportation, Federal Railroad Administration. Accessed
Deep Borehole Emplacement Mode Hazard Analysis, Revision 0
36 August 2015
03/12/2004. ACC: MOL.20040311.0211. URL: http://safetydata.fra.dot.gov/OfficeofSafety/Query/
Default.asp
C5.20 *Framatome ANP (Advanced Nuclear Power) 2001. Summary, Commercial Nuclear Fuel
Assembly Damage/Misload Study -1985-1999. Lynchburg, Virginia: Framatome Advanced Nuclear
Power. ACC: MOL.20011018.0158.
C5.21 *HID Corporation [n.d.]. Ruggedized Card Reader/Ruggedized Keypad Card Reader. Dorado
740 and 780. Irvine, California: HID Corporation. TIC: 260007.
C5.22 *IEEE (Institute of Electrical and Electronics Engineers) Std 493-1997. 1998. IEEE
Recommended Practice for the Design of Reliable Industrial and Commercial Power Systems. New
York, New York: Institute of Electrical and Electronics Engineers. TIC: 243205. ISBN 1-55937-969-3.
C5.23 *IEEE Std 500-1984 (Reaffirmed 1991). 1991. IEEE Guide to the Collection and Presentation of
Electrical, Electronic, Sensing Component, and Mechanical Equipment Reliability Data for Nuclear-
Power Generating Stations. New York, New York: Institute of Electrical and Electronics Engineers.
TIC: 256281.
C5.24 *Kahl, W.K. and Borkowski, R.J. 1985. The In-Plant Reliability Data Base for Nuclear Plant
Components: Interim Report - Diesel Generators, Batteries, Chargers, and Inverters. NUREG/CR-
3831. Washington, D.C.: U.S. Nuclear Regulatory Commission. ACC: MOL.20071212.0181.
C5.25 *Laurus Systems [n.d.]. Instruments and Software Solutions for Emergency Response and Health
Physics. Ellicott City, Maryland: Laurus Systems. TIC: 259965.
C5.26 Lloyd, R.L. 2003. A Survey of Crane Operating Experience at U.S. Nuclear Power Plants from
1968 through 2002. NUREG-1774. Washington, D.C.: U.S. Nuclear Regulatory Commission. ACC:
MOL.20050802.0185.
C5.28 *Miller, C.F.; Hubble, W.H.; Trojovsky, M.; and Brown, S.R. 1982. Data Summaries of Licensee
Event Reports of Valves at U.S. Commercial Nuclear Power Plants from January 1, 1976 to December
31, 1980. NUREG/CR-1363, Rev. 1. Washington, D.C.: U.S. Nuclear Regulatory Commission. ACC:
MOL.20071219.0223.
C5.32 *Moss, T.R. 2005. The Reliability Data Handbook. 1st Edition. New York, NY: ASME Press
(American Society of Mechanical Engineers). ISBN: 0-7918-0233-7. TIC: 259912.
C5.35 NRC 1980. Control of Heavy Loads at Nuclear Power Plants. NUREG-0612. Washington, D.C.:
U.S. Nuclear Regulatory Commission. TIC: 209017.
C5.37 *NSWC (Naval Surface Warfare Center) 1998. Handbook of Reliability Prediction Procedures
for Mechanical Equipment. NSWC-98/LE1. West Bethesda, Maryland: Naval Surface Warfare Center,
Carderock Division. TIC: 245703.
C5.38 *Peltz, E.; Robbins, M.; Boren, P.; Wolff, M. 2002. "Using the EDA to Gain Insight into Failure
Rates.z" Diagnosing the Army's Equipment Readiness: The Equipment Downtime Analyzer. Santa
Monica, CA: RAND. TIC: 259917. ISBN: 0-8330-3115-5.
C5.39 *Reece, W.J.; Gilbert, B.G.; and Richards, R.E. 1994. Nuclear Computerized Library for
Assessing Reactor Reliability (NUCLARR), Volume 5: Data Manual, Part 3: Hardware Component
Failure Data. NUREG/CR-4639, Vol. 5, Rev. 4. Washington, D.C.: U.S. Nuclear Regulatory
Commission. ACC: MOL.20071220.0209.
C5.40 *Denson, W.; Chandler, G.; Crowell, W.; Clark, A.; and Jaworski, P. 1994. Nonelectronic Parts
Reliability Data 1995. NPRD-95. Rome, New York: Reliability Analysis Center. TIC: 259757.

Deep Borehole Emplacement Mode Hazard Analysis, Revision 0 August 2015 37
C5.41 *SAIC (Science Applications International Corporation) 2002. Umatilla Chemical Agent
Disposal Facility Quantitative Risk Assessment. Report No. SAIC-00/2641. Volume I. Abingdon,
Maryland: Science Applications International Corporation. ACC: MOL.20071220.0210.
C5.42 *SINTEF Industrial Management 1992. OREDA, Offshore Reliability Data Handbook. 2nd
Edition. Trondheim, Norway: OREDA. ISBN: 825150188.1
C5.43 *SINTEF Industrial Management 2002. OREDA, Offshore Reliability Data Handbook. 4th
Edition. Trondheim, Norway: OREDA. ISBN: 8214027055. TIC: 257402.
C5.45 *Trojovsky, M. 1982. Data Summaries of Licensee Event Reports of Pumps at U.S. Commercial
Nuclear Power Plants, January 1, 1972 to April 30, 1980. NUREG/CR-1205, Rev. 1. Washington,
D.C.: U.S. Nuclear Regulatory Commission. ACC: MOL.20080207.0024.
C5.46 *Zentner, M.D.; Atkinson, J.K.; Carlson, P.A.; Coles, G.A.; Leitz, E.E.; Lindberg, S.E.; Powers,
T.B.; and Kelly, J.E. 1988. N Reactor Level 1 Probabilistic Risk Assessment: Final Report. WHC-SP-
0087. Richland, Washington: Westinghouse Hanford Company. ACC: MOL.20080207.0021

Deep Borehole Emplacement Mode Hazard Analysis, Revision 0
38 August 2015
DISTRIBUTION
1 Mark Denton
AREVA Federal Services LLC
7207 IBM Drive, CLT-2C
Charlotte, NC 28262
1 MS0718 John Cochran 6234 (electronic copy)
1 MS0747 Ernest Hardin 6224 (electronic copy)
1 MS0747 Geoff Freeze 6224 (electronic copy)
1 MS0747 Kris Kuhlman 6224 (electronic copy)
1 MS0747 David Sassani 6224 (electronic copy)
1 MS0747 Robert MacKinnon 6224 (electronic copy)
1 MS0748 Katrina Groth 6231 (electronic copy)
1 MS0748 Andrew Jordan Clark 6231 (electronic copy)
1 MS0899 Technical Library 9536 (electronic copy)

Deep Borehole Emplacement Mode Hazard Analysis, Revision 0 August 2015 39

Deep Borehole Emplacement Mode Hazard Analysis, Revision 0
40 August 2015