deep-sea fe-mn crusts from the northeast atlantic … fe-mn crusts from the northeast atlantic...
TRANSCRIPT

Deep-sea Fe-Mn Crusts from the Northeast AtlanticOcean: Composition and Resource Considerations
SUSANA BOLHAO MUINOS*1,3, JAMES R. HEIN2,MARTIN FRANK3, JOSE HIPOLITO MONTEIRO1,LUIS GASPAR1, TRACEY CONRAD2,HENRIQUE GARCIA PEREIRA4, ANDFATIMA ABRANTES*1
1Unidade de Gelogia Marinha, Laboratorio Nacional de Energia eGeologia, Amadora, Portugal2U.S. Geological Survey, Santa Cruz, CA, USA3GEOMAR, Helmholtz Centre for Ocean Sciences, Kiel, Germany4CERENA, Instituto Superior Tecnico, Universidade Tecnica de Lisboa,Lisboa, Portugal
Eighteen deep-sea ferromanganese crusts (Fe-Mn crusts) from 10 seamounts in thenortheast Atlantic were studied. Samples were recovered from water depths of�1,200 to �4,600m from seamounts near Madeira, the Canary and Azores islands,and one sample from the western Mediterranean Sea.
The mineralogical and chemical compositions of the samples indicate that thecrusts are typical continental margin, hydrogenetic Fe-Mn crusts. The Fe-Mn crustsexhibit a CoþCuþNi maximum of 0.96 wt%. Platinum-group element contentsanalyzed for five samples showed Pt contents from 153 to 512 ppb.
The resource potential of Fe-Mn crusts within and adjacent to the PortugueseExclusive Economic Zone (EEZ) is evaluated to be comparable to that of crustsin the central Pacific, indicating that these Atlantic deposits may be an importantfuture resource.
Received 1 July 2011; accepted 29 December 2011.We thank the Portuguese Science and Technology Foundation (FCT) for financial
support through Project PDCT=MAR=56823=2004; FCT also supported a fellowship toS.B.M. (SFRH=BD=22263=2005) co-financed by POCI 2010=EU. Additional support toS.B.M. was provided by a LNEG fellowship. We acknowledge K. Hoernle, the crew and scien-tific party of Meteor M51=1 cruise as well as the Deutsche Forschungsgemeinschaft (DFG,German Research Council) for funding. We acknowledge J. Girardeau, the onboard scientificteam, the University of Nantes and the French INSU-CNRS Institute for the financial sup-port that made possible the collection of the samples from the Tore-Madeira Cruise and forkindly having made these samples available for this work. We also thank the co-chiefs ofthe TTR-11 Cruise, the onboard team and the UNESCO–IOC TTR Program for the samplescollected during the TTR-11 cruise, which was funded by INGMAR Project (FCT). We alsothank S. M. Lebreiro, L. M. Pinheiro, R. Dunham, J. Noiva, J. Dias, F. Neves, C. Lopes andM. Mil-Homens for their help and discussions. The editors and two anonymous reviewers arethanked for their contribution to the improvement of this paper.
�Current affiliation: Divisao de Geologia e Georecursos Marinhos, Instituto Portuguesdo Mare e da Atmosfera, Lisboa, Portugal.
Address correspondence to Susana Bolhao Muinos, Instituto Portugues do Mar e daAtmosfera, I.P., Divisao de Geologia e Georecursos Marinhos, Rua C-Aeroporto de Lisboa,1749-077 Lisboa, Portugal. E-mail: [email protected]
Marine Georesources & Geotechnology, 31:40–70, 2013Copyright # Taylor & Francis Group, LLCISSN: 1064-119X print=1521-0618 onlineDOI: 10.1080/1064119X.2012.661215
40
Dow
nloa
ded
by [
USG
S L
ibra
ries
Pro
gram
] at
08:
48 2
1 Ja
nuar
y 20
13
Keywords ferromanganese crusts, northeast Atlantic, Portuguese EEZ, resourceconsiderations, seamounts
Introduction
Manganese and ferromanganese oxide deposits in the oceans occur as nodules,crusts, and massive beds. These deposits have been classified as diagenetic, hydro-genetic, hydrothermal, and mixed-type deposits (Halbach 1986; Hein et al. 1997;Wen et al. 1997). Hydrogenetic crusts (Fe-Mn crusts) form by direct precipitationof colloidal hydrated metal oxides from the water column onto hard-rocksubstrates.
The first investigations of hydrogenetic Fe-Mn crusts on seamounts were carriedout in the Pacific Ocean (Craig et al. 1982; Halbach et al. 1982, 1989b; Hein et al.1988). The preconditions required for Fe-Mn crust formation, such as the occurrenceof isolated volcanic edifices, strong currents that keep the edifices free of sediment,and an oxygen-minimum zone (OMZ) are also found in the Atlantic Ocean(Koschinsky et al. 1995). Indeed, previous results from NE Atlantic seamountsindicate widespread presence of Fe-Mn crusts of hydrogenetic origin (Koschinskyet al. 1995, 1996; Gaspar 2001; Muinos et al. 2002; Muinos 2005). Hydrogeneticprecipitation is dependent on water-mass properties and is characterized by slowgrowth rates (< 10mm=Ma) and generation of an extremely high specific-surfacearea, which promotes the enrichment of trace elements through scavenging by themajor oxides (e.g., Hein et al. 1997). Seamounts act as obstructions to oceanicwater-mass flow thereby creating seamount-generated currents of enhanced energyrelative to flows away from the seamounts. These currents, which are strongest alongthe outer rim of the summit region of seamounts, promote the formation of thickcrusts, enhanced turbulent mixing, and produce upwelling, leading to increased pri-mary productivity and thus maintenance of the OMZ (summarized in Hein et al.2000). Manganese oxides and associated trace metals are concentrated in the OMZ,which are then scavenged onto crusts under oxic conditions resulting from the turbu-lent mixing around seamounts.
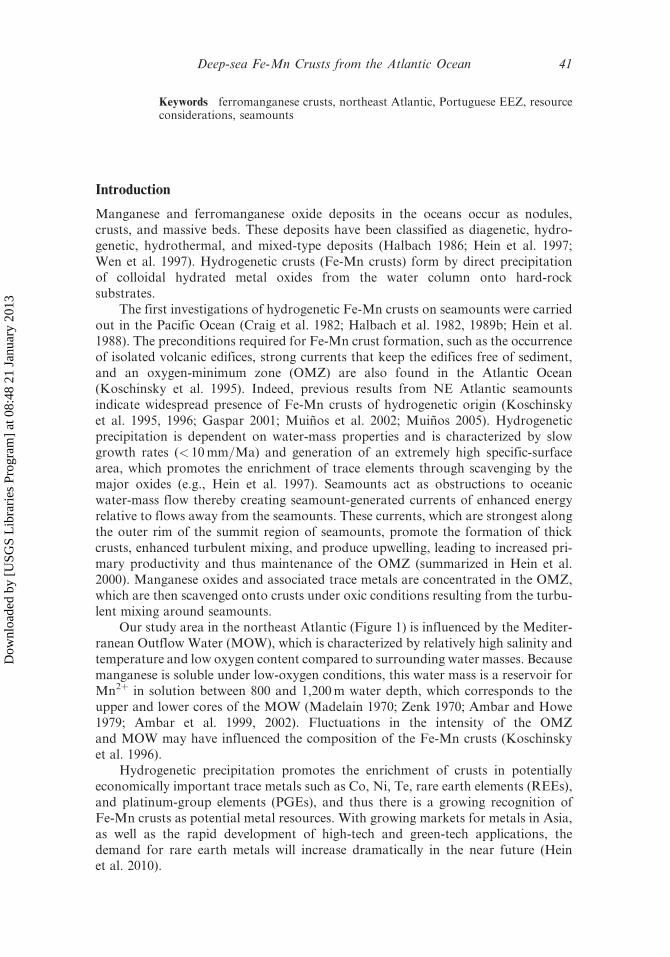
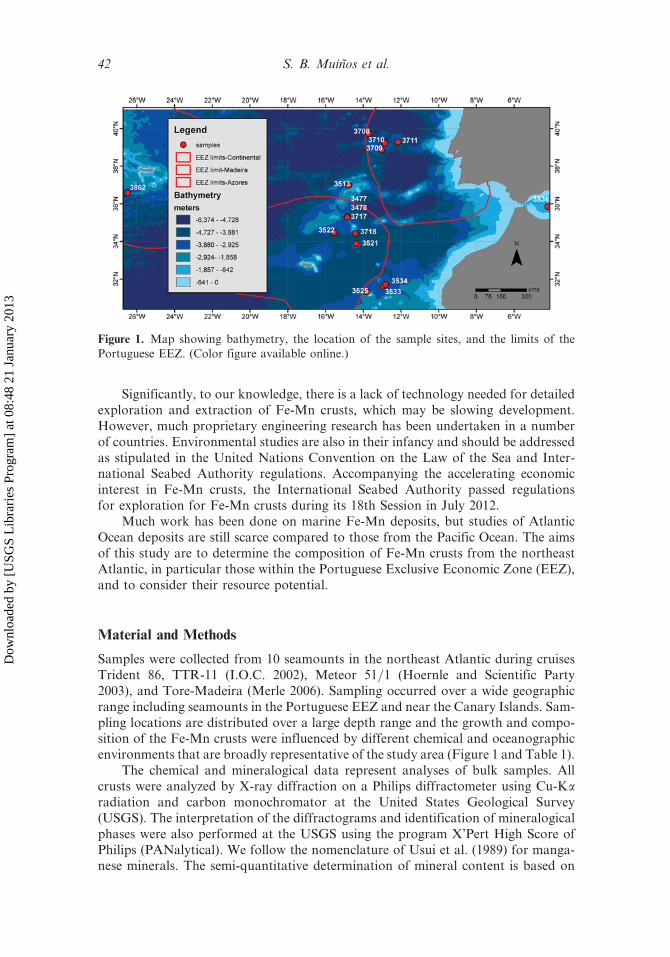
Our study area in the northeast Atlantic (Figure 1) is influenced by the Mediter-ranean Outflow Water (MOW), which is characterized by relatively high salinity andtemperature and low oxygen content compared to surrounding water masses. Becausemanganese is soluble under low-oxygen conditions, this water mass is a reservoir forMn2þ in solution between 800 and 1,200m water depth, which corresponds to theupper and lower cores of the MOW (Madelain 1970; Zenk 1970; Ambar and Howe1979; Ambar et al. 1999, 2002). Fluctuations in the intensity of the OMZand MOW may have influenced the composition of the Fe-Mn crusts (Koschinskyet al. 1996).
Hydrogenetic precipitation promotes the enrichment of crusts in potentiallyeconomically important trace metals such as Co, Ni, Te, rare earth elements (REEs),and platinum-group elements (PGEs), and thus there is a growing recognition ofFe-Mn crusts as potential metal resources. With growing markets for metals in Asia,as well as the rapid development of high-tech and green-tech applications, thedemand for rare earth metals will increase dramatically in the near future (Heinet al. 2010).
Deep-sea Fe-Mn Crusts from the Atlantic Ocean 41
Dow
nloa
ded
by [
USG
S L
ibra
ries
Pro
gram
] at
08:
48 2
1 Ja
nuar
y 20
13
Significantly, to our knowledge, there is a lack of technology needed for detailedexploration and extraction of Fe-Mn crusts, which may be slowing development.However, much proprietary engineering research has been undertaken in a numberof countries. Environmental studies are also in their infancy and should be addressedas stipulated in the United Nations Convention on the Law of the Sea and Inter-national Seabed Authority regulations. Accompanying the accelerating economicinterest in Fe-Mn crusts, the International Seabed Authority passed regulationsfor exploration for Fe-Mn crusts during its 18th Session in July 2012.
Much work has been done on marine Fe-Mn deposits, but studies of AtlanticOcean deposits are still scarce compared to those from the Pacific Ocean. The aimsof this study are to determine the composition of Fe-Mn crusts from the northeastAtlantic, in particular those within the Portuguese Exclusive Economic Zone (EEZ),and to consider their resource potential.
Material and Methods
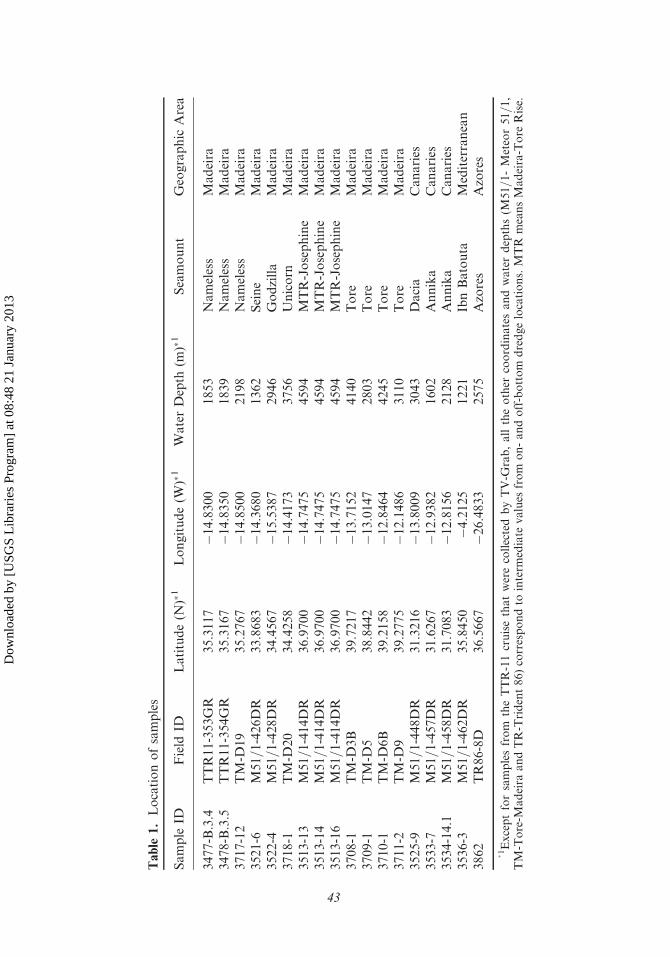
Samples were collected from 10 seamounts in the northeast Atlantic during cruisesTrident 86, TTR-11 (I.O.C. 2002), Meteor 51=1 (Hoernle and Scientific Party2003), and Tore-Madeira (Merle 2006). Sampling occurred over a wide geographicrange including seamounts in the Portuguese EEZ and near the Canary Islands. Sam-pling locations are distributed over a large depth range and the growth and compo-sition of the Fe-Mn crusts were influenced by different chemical and oceanographicenvironments that are broadly representative of the study area (Figure 1 and Table 1).
The chemical and mineralogical data represent analyses of bulk samples. Allcrusts were analyzed by X-ray diffraction on a Philips diffractometer using Cu-Karadiation and carbon monochromator at the United States Geological Survey(USGS). The interpretation of the diffractograms and identification of mineralogicalphases were also performed at the USGS using the program X’Pert High Score ofPhilips (PANalytical). We follow the nomenclature of Usui et al. (1989) for manga-nese minerals. The semi-quantitative determination of mineral content is based on
Figure 1. Map showing bathymetry, the location of the sample sites, and the limits of thePortuguese EEZ. (Color figure available online.)
42 S. B. Muinos et al.
Dow
nloa
ded
by [
USG
S L
ibra
ries
Pro
gram
] at
08:
48 2
1 Ja
nuar
y 20
13
Table
1.Locationofsamples
Sample
IDField
IDLatitude(N
)�1
Longitude(W
)�1
WaterDepth
(m)�1
Seamount
Geographic
Area
3477-B.3.4
TTR11-353GR
35.3117
�14.8300
1853
Nameless
Madeira
3478-B.3.5
TTR11-354GR
35.3167
�14.8350
1839
Nameless
Madeira
3717-12
TM-D
19
35.2767
�14.8500
2198
Nameless
Madeira
3521-6
M51=1-426DR
33.8683
�14.3680
1362
Seine
Madeira
3522-4
M51=1-428DR
34.4567
�15.5387
2946
Godzilla
Madeira
3718-1
TM-D
20
34.4258
�14.4173
3756
Unicorn
Madeira
3513-13
M51=1-414DR
36.9700
�14.7475
4594
MTR-Josephine
Madeira
3513-14
M51=1-414DR
36.9700
�14.7475
4594
MTR-Josephine
Madeira
3513-16
M51=1-414DR
36.9700
�14.7475
4594
MTR-Josephine
Madeira
3708-1
TM-D
3B
39.7217
�13.7152
4140
Tore
Madeira
3709-1
TM-D
538.8442
�13.0147
2803
Tore
Madeira
3710-1
TM-D
6B
39.2158
�12.8464
4245
Tore
Madeira
3711-2
TM-D
939.2775
�12.1486
3110
Tore
Madeira
3525-9
M51=1-448DR
31.3216
�13.8009
3043
Dacia
Canaries
3533-7
M51=1-457DR
31.6267
�12.9382
1602
Annika
Canaries
3534-14.1
M51=1-458DR
31.7083
�12.8156
2128
Annika
Canaries
3536-3
M51=1-462DR
35.8450
�4.2125
1221
IbnBatouta
Mediterranean
3862
TR86-8D
36.5667
�26.4833
2575
Azores
Azores
� 1Exceptforsamplesfrom
theTTR-11cruisethatwerecollectedbyTV-G
rab,alltheother
coordinatesandwaterdepths(M
51=1-Meteor51=1,
TM-Tore-M
adeira
andTR-Trident86)correspondto
interm
ediate
values
from
on-andoff-bottom
dredgelocations.MTR
meansMadeira-Tore
Rise.
43
Dow
nloa
ded
by [
USG
S L
ibra
ries
Pro
gram
] at
08:
48 2
1 Ja
nuar
y 20
13
the relative intensity of the peaks and previously determined weighing factors (Cooket al. 1975; Hein et al. 1988).
Major elements (Fe, Mn, Si, Al, Ca, Mg, Na, K, Ti, P) were analyzed by fused-disk X-ray fluorescence; S, Ba, Cr, Cu, Li, Ni, Sr, V, Zn, and Zr by 4-acid digestionand inductively coupled plasma-optical emission spectrometry (ICP-OES); Ag, As,Be, Bi, Cd, Co, Ga, Ge, Hf, In, Mo, Nb, Pb, Rb, Sb, Sc, Sn, Ta, Tl, W, and Cs wereanalyzed by 4-acid digestion and ICP-mass spectrometry (MS); Th, U, Y, and REEswere analyzed by lithium metaborate fusion and ICP-MS; Se and Te by 4-acid diges-tion, hydride-generation, and atomic absorption spectrometry (AAS), Hg by coldvapor AAS, and Cl� was analyzed by the specific-ion electrode method. Based onduplicate analyses of 10% of the samples, precision was better than 5% for S, As,Ba, Be, Bi, Cd, Co, Cr, Cu, Ga, Ge, In, Li, Mo, Ni, Pb, Rb, Sc, Se, Sr, Te, Th,Tl, U, V, Zn, REEs, Cl�, and Cs and better than 10% for Sb, Sn, W, and Hg.For a few elements, precision varies widely and data should be used with that inmind: Ag (10–33%), Hf (11–28%), Nb (15–24%), Ta (13–24%), and Zr (5–16%). Fivesamples were also analyzed for PGE and Au contents by fire assay and ICP-MS.Analytical accuracy was calculated using international standards AMIS0056 andHGMNEW and is better than 5% for Os and Ru, better than 10% for Ir, Pd, andPt, 13% for Au, and varies from 5–17% for Rh.
Q-Mode factor analyses used the Varimax method (Klovan and Imbrie 1971). Allcommunalities are>0.94 and values between�0.1575 and 0.1575 were not consideredbecause they are below the level of statistical significance assuming a multi-Gaussiandistribution.
The extent of the area covered by seamounts was determined using ArcGIS1
and ETOPO bathymetry (Amante and Eakins 2009; http://www.ngdc.noaa.gov/mgg/global/global.html).
Mineralogy and Chemical Composition of Crusts
All Fe-Mn crust samples are composed predominately of d-MnO2 (vernadite), themineral most characteristic of hydrogenetic Fe-Mn deposits found globally. The min-eral d-MnO2 is epitaxially intergrown with X-ray amorphous iron oxyhydroxide(d-FeO(OH)-feroxyhyte; Burns and Burns 1977; Varentsov et al. 1991; Hein et al.2000). Detrital minerals, such as quartz and feldspar, and biogenic and diageneticminerals, such as calcite and carbonate fluorapatite (CFA) are present in minor tomoderate amounts (Table 2). In addition, two samples contain minor amounts of10 A manganate (probably todorokite), which may reflect a lower oxidation potentialof seawater caused by increased biological productivity, as suggested by Hein et al.(2000) for some occurrences in the Pacific Ocean, or may indicate a minor hydrother-mal contribution. Minor amounts of goethite are also present in the majority of thesamples and can reflect a number of different processes, including: (1) increasedinputs of Fe from continental sources (Bruland et al. 2001); (2) too much Fe presentfor the vernadite structure to accommodate (De Carlo 1991, and references therein);(3) the enhanced supply of Fe from the dissolution of calcareous tests for crusts belowthe calcite compensation depth (CCD), as suggested by von Stackelberg et al. (1984)for goethite in some layers of a deep-water Fe-Mn crust (4,830m) collected in theClarion-Clipperton nodule belt; and (4) as suggested by Hein et al. (2000), goethiteis found only in the older parts of 5% of 640 crust samples analyzed from Pacific Oceansites and may result from the maturation of X-ray amorphous Fe oxyhydroxide. Most
44 S. B. Muinos et al.
Dow
nloa
ded
by [
USG
S L
ibra
ries
Pro
gram
] at
08:
48 2
1 Ja
nuar
y 20
13
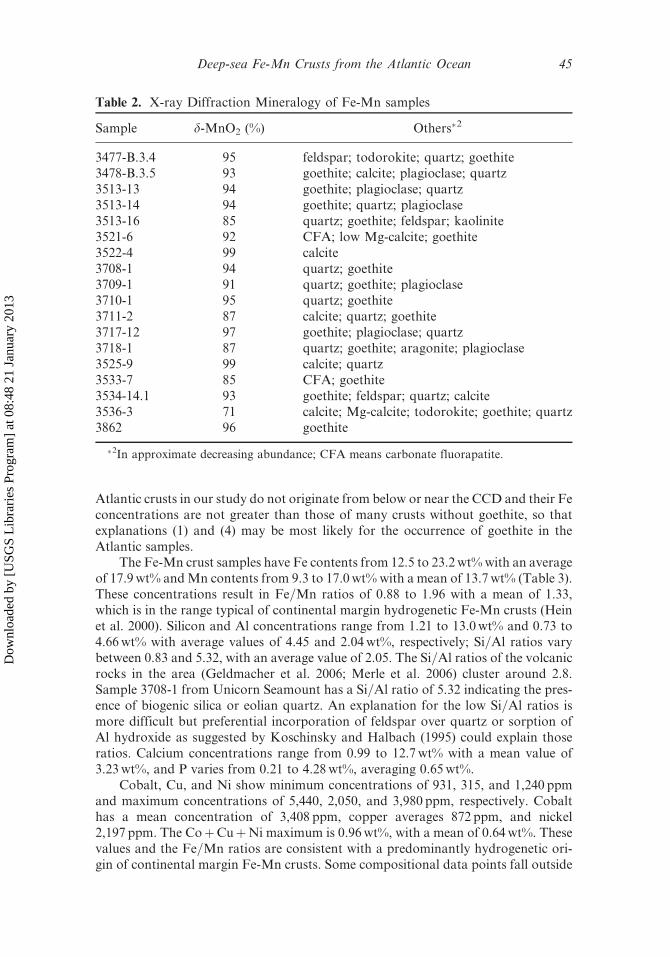
Atlantic crusts in our study do not originate from below or near the CCD and their Feconcentrations are not greater than those of many crusts without goethite, so thatexplanations (1) and (4) may be most likely for the occurrence of goethite in theAtlantic samples.
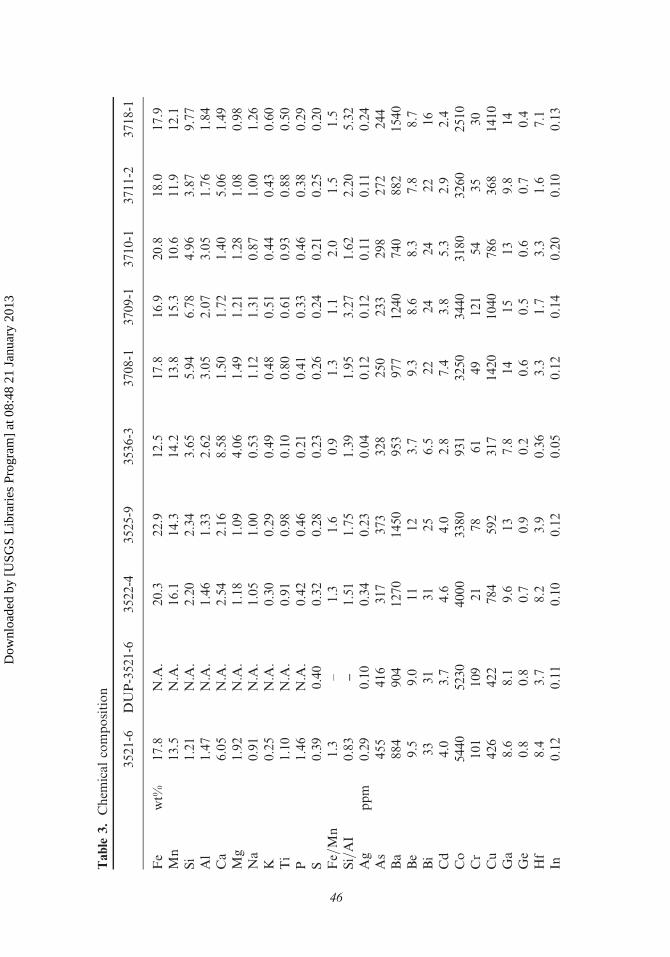
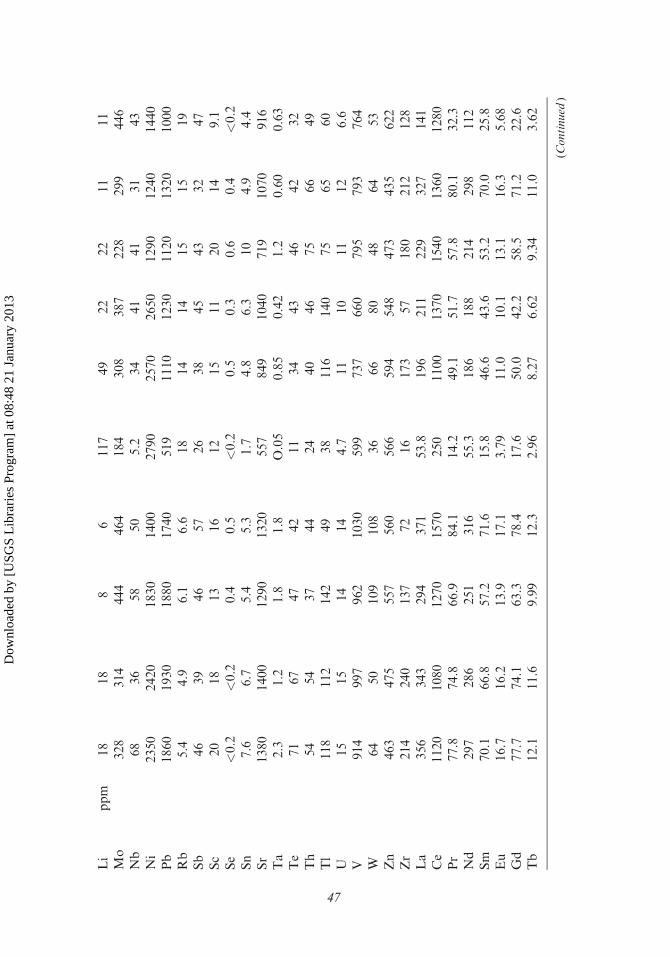
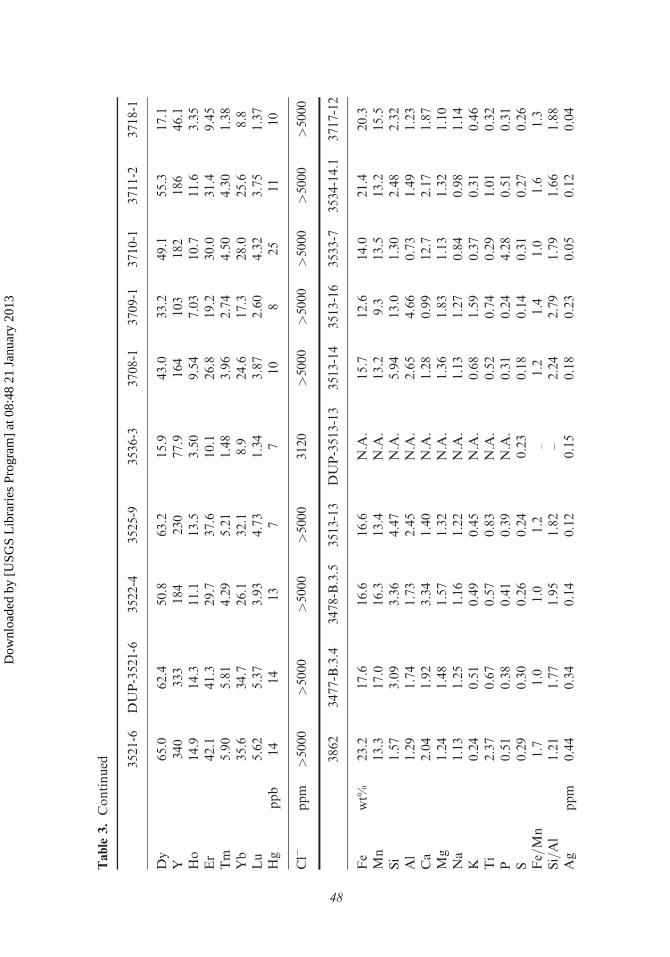
The Fe-Mn crust samples have Fe contents from 12.5 to 23.2wt%with an averageof 17.9wt% andMn contents from 9.3 to 17.0wt% with a mean of 13.7wt% (Table 3).These concentrations result in Fe=Mn ratios of 0.88 to 1.96 with a mean of 1.33,which is in the range typical of continental margin hydrogenetic Fe-Mn crusts (Heinet al. 2000). Silicon and Al concentrations range from 1.21 to 13.0wt% and 0.73 to4.66wt% with average values of 4.45 and 2.04wt%, respectively; Si=Al ratios varybetween 0.83 and 5.32, with an average value of 2.05. The Si=Al ratios of the volcanicrocks in the area (Geldmacher et al. 2006; Merle et al. 2006) cluster around 2.8.Sample 3708-1 from Unicorn Seamount has a Si=Al ratio of 5.32 indicating the pres-ence of biogenic silica or eolian quartz. An explanation for the low Si=Al ratios ismore difficult but preferential incorporation of feldspar over quartz or sorption ofAl hydroxide as suggested by Koschinsky and Halbach (1995) could explain thoseratios. Calcium concentrations range from 0.99 to 12.7wt% with a mean value of3.23wt%, and P varies from 0.21 to 4.28wt%, averaging 0.65wt%.
Cobalt, Cu, and Ni show minimum concentrations of 931, 315, and 1,240 ppmand maximum concentrations of 5,440, 2,050, and 3,980 ppm, respectively. Cobalthas a mean concentration of 3,408 ppm, copper averages 872 ppm, and nickel2,197 ppm. The CoþCuþNi maximum is 0.96wt%, with a mean of 0.64wt%. Thesevalues and the Fe=Mn ratios are consistent with a predominantly hydrogenetic ori-gin of continental margin Fe-Mn crusts. Some compositional data points fall outside
Table 2. X-ray Diffraction Mineralogy of Fe-Mn samples
Sample d-MnO2 (%) Others�2
3477-B.3.4 95 feldspar; todorokite; quartz; goethite3478-B.3.5 93 goethite; calcite; plagioclase; quartz3513-13 94 goethite; plagioclase; quartz3513-14 94 goethite; quartz; plagioclase3513-16 85 quartz; goethite; feldspar; kaolinite3521-6 92 CFA; low Mg-calcite; goethite3522-4 99 calcite3708-1 94 quartz; goethite3709-1 91 quartz; goethite; plagioclase3710-1 95 quartz; goethite3711-2 87 calcite; quartz; goethite3717-12 97 goethite; plagioclase; quartz3718-1 87 quartz; goethite; aragonite; plagioclase3525-9 99 calcite; quartz3533-7 85 CFA; goethite3534-14.1 93 goethite; feldspar; quartz; calcite3536-3 71 calcite; Mg-calcite; todorokite; goethite; quartz3862 96 goethite
�2In approximate decreasing abundance; CFA means carbonate fluorapatite.
Deep-sea Fe-Mn Crusts from the Atlantic Ocean 45
Dow
nloa
ded
by [
USG
S L
ibra
ries
Pro
gram
] at
08:
48 2
1 Ja
nuar
y 20
13
Table
3.Chem
icalcomposition
3521-6
DUP-3521-6
3522-4
3525-9
3536-3
3708-1
3709-1
3710-1
3711-2
3718-1
Fe
wt%
17.8
N.A
.20.3
22.9
12.5
17.8
16.9
20.8
18.0
17.9
Mn
13.5
N.A
.16.1
14.3
14.2
13.8
15.3
10.6
11.9
12.1
Si
1.21
N.A
.2.20
2.34
3.65
5.94
6.78
4.96
3.87
9.77
Al
1.47
N.A
.1.46
1.33
2.62
3.05
2.07
3.05
1.76
1.84
Ca
6.05
N.A
.2.54
2.16
8.58
1.50
1.72
1.40
5.06
1.49
Mg
1.92
N.A
.1.18
1.09
4.06
1.49
1.21
1.28
1.08
0.98
Na
0.91
N.A
.1.05
1.00
0.53
1.12
1.31
0.87
1.00
1.26
K0.25
N.A
.0.30
0.29
0.49
0.48
0.51
0.44
0.43
0.60
Ti
1.10
N.A
.0.91
0.98
0.10
0.80
0.61
0.93
0.88
0.50
P1.46
N.A
.0.42
0.46
0.21
0.41
0.33
0.46
0.38
0.29
S0.39
0.40
0.32
0.28
0.23
0.26
0.24
0.21
0.25
0.20
Fe=Mn
1.3
–1.3
1.6
0.9
1.3
1.1
2.0
1.5
1.5
Si=AI
0.83
–1.51
1.75
1.39
1.95
3.27
1.62
2.20
5.32
Ag
ppm
0.29
0.10
0.34
0.23
0.04
0.12
0.12
0.11
0.11
0.24
As
455
416
317
373
328
250
233
298
272
244
Ba
884
904
1270
1450
953
977
1240
740
882
1540
Be
9.5
9.0
11
12
3.7
9.3
8.6
8.3
7.8
8.7
Bi
33
31
31
25
6.5
22
24
24
22
16
Cd
4.0
3.7
4.6
4.0
2.8
7.4
3.8
5.3
2.9
2.4
Co
5440
5230
4000
3380
931
3250
3440
3180
3260
2510
Cr
101
109
21
78
61
49
121
54
35
30
Cu
426
422
784
592
317
1420
1040
786
368
1410
Ga
8.6
8.1
9.6
13
7.8
14
15
13
9.8
14
Ge
0.8
0.8
0.7
0.9
0.2
0.6
0.5
0.6
0.7
0.4
Hf
8.4
3.7
8.2
3.9
0.36
3.3
1.7
3.3
1.6
7.1
In0.12
0.11
0.10
0.12
0.05
0.12
0.14
0.20
0.10
0.13
46
Dow
nloa
ded
by [
USG
S L
ibra
ries
Pro
gram
] at
08:
48 2
1 Ja
nuar
y 20
13
Li
ppm
18
18
86
117
49
22
22
11
11
Mo
328
314
444
464
184
308
387
228
299
446
Nb
68
36
58
50
5.2
34
41
41
31
43
Ni
2350
2420
1830
1400
2790
2570
2650
1290
1240
1440
Pb
1860
1930
1880
1740
519
1110
1230
1120
1320
1000
Rb
5.4
4.9
6.1
6.6
18
14
14
15
15
19
Sb
46
39
46
57
26
38
45
43
32
47
Sc
20
18
13
16
12
15
11
20
14
9.1
Se
<0.2
<0.2
0.4
0.5
<0.2
0.5
0.3
0.6
0.4
<0.2
Sn
7.6
6.7
5.4
5.3
1.7
4.8
6.3
10
4.9
4.4
Sr
1380
1400
1290
1320
557
849
1040
719
1070
916
Ta
2.3
1.2
1.8
1.8
O.05
0.85
0.42
1.2
0.60
0.63
Te
71
67
47
42
11
34
43
46
42
32
Th
54
54
37
44
24
40
46
75
66
49
Tl
118
112
142
49
38
116
140
75
65
60
U15
15
14
14
4.7
11
10
11
12
6.6
V914
997
962
1030
599
737
660
795
793
764
W64
50
109
108
36
66
80
48
64
53
Zn
463
475
557
560
566
594
548
473
435
622
Zr
214
240
137
72
16
173
57
180
212
128
La
356
343
294
371
53.8
196
211
229
327
141
Ce
1120
1080
1270
1570
250
1100
1370
1540
1360
1280
Pr
77.8
74.8
66.9
84.1
14.2
49.1
51.7
57.8
80.1
32.3
Nd
297
286
251
316
55.3
186
188
214
298
112
Sm
70.1
66.8
57.2
71.6
15.8
46.6
43.6
53.2
70.0
25.8
Eu
16.7
16.2
13.9
17.1
3.79
11.0
10.1
13.1
16.3
5.68
Gd
77.7
74.1
63.3
78.4
17.6
50.0
42.2
58.5
71.2
22.6
Tb
12.1
11.6
9.99
12.3
2.96
8.27
6.62
9.34
11.0
3.62
(Continued
)
47
Dow
nloa
ded
by [
USG
S L
ibra
ries
Pro
gram
] at
08:
48 2
1 Ja
nuar
y 20
13
Table
3.Continued 3521-6
DUP-3521-6
3522-4
3525-9
3536-3
3708-1
3709-1
3710-1
3711-2
3718-1
Dy
65.0
62.4
50.8
63.2
15.9
43.0
33.2
49.1
55.3
17.1
Y340
333
184
230
77.9
164
103
182
186
46.1
Ho
14.9
14.3
11.1
13.5
3.50
9.54
7.03
10.7
11.6
3.35
Er
42.1
41.3
29.7
37.6
10.1
26.8
19.2
30.0
31.4
9.45
Tm
5.90
5.81
4.29
5.21
1.48
3.96
2.74
4.50
4.30
1.38
Yb
35.6
34.7
26.1
32.1
8.9
24.6
17.3
28.0
25.6
8.8
Lu
5.62
5.37
3.93
4.73
1.34
3.87
2.60
4.32
3.75
1.37
Hg
ppb
14
14
13
77
10
825
11
10
Cl�
ppm
>5000
>5000
>5000
>5000
3120
>5000
>5000
>5000
>5000
>5000
3862
3477-B.3.4
3478-B.3.5
3513-13
DUP-3513-13
3513-14
3513-16
3533-7
3534-14.1
3717-12
Fe
wt%
23.2
17.6
16.6
16.6
N.A
.15.7
12.6
14.0
21.4
20.3
Mn
13.3
17.0
16.3
13.4
N.A
.13.2
9.3
13.5
13.2
15.5
Si
1.57
3.09
3.36
4.47
N.A
.5.94
13.0
1.30
2.48
2.32
Al
1.29
1.74
1.73
2.45
N.A
.2.65
4.66
0.73
1.49
1.23
Ca
2.04
1.92
3.34
1.40
N.A
.1.28
0.99
12.7
2.17
1.87
Mg
1.24
1.48
1.57
1.32
N.A
.1.36
1.83
1.13
1.32
1.10
Na
1.13
1.25
1.16
1.22
N.A
.1.13
1.27
0.84
0.98
1.14
K0.24
0.51
0.49
0.45
N.A
.0.68
1.59
0.37
0.31
0.46
Ti
2.37
0.67
0.57
0.83
N.A
.0.52
0.74
0.29
1.01
0.32
P0.51
0.38
0.41
0.39
N.A
.0.31
0.24
4.28
0.51
0.31
S0.29
0.30
0.26
0.24
0.23
0.18
0.14
0.31
0.27
0.26
Fe=Mn
1.7
1.0
1.0
1.2
–1.2
1.4
1.0
1.6
1.3
Si=Al
1.21
1.77
1.95
1.82
–2.24
2.79
1.79
1.66
1.88
Ag
ppm
0.44
0.34
0.14
0.12
0.15
0.18
0.23
0.05
0.12
0.04
48
Dow
nloa
ded
by [
USG
S L
ibra
ries
Pro
gram
] at
08:
48 2
1 Ja
nuar
y 20
13
As
ppm
439
316
278
214
213
207
129
279
419
346
Ba
1450
1320
1360
955
958
1170
769
2180
991
1550
Be
12
8.8
8.0
7.2
7.1
8.1
5.5
7.3
12
11
Bi
15
30
23
18
18
18
14
15
24
25
Cd
4.6
3.7
4.0
4.7
4.6
5.0
3.8
2.5
3.4
2.7
Co
4270
4930
4060
3860
3800
2020
1650
2640
4330
1970
Cr
72
51
50
31
33
67
27
49
60
111
Cu
382
970
969
1140
1130
2050
2010
315
454
449
Ga
14
16
16
14
14
19
19
8.0
10
13
Ge
1.0
0.5
0.5
0.7
0.7
0.6
0.3
0.4
0.7
0.6
Hf
6.5
12
5.8
2.4
3.1
5.5
7.3
0.86
3.0
1.2
In0.10
0.14
0.11
0.19
0.19
0.29
0.31
0.06
0.09
0.16
Li
11
26
33
27
26
43
63
13
11
7Mo
371
379
341
289
289
360
164
278
350
548
Nb
74
68
41
29
41
43
58
11
50
11
Ni
1330
3670
3980
2010
1990
2590
2590
1990
1590
2210
Pb
991
2100
1720
943
953
863
539
1330
1650
1060
Rb
3.2
12
12
12
12
20
34
8.3
6.5
11
Sb
47
55
48
32
32
34
27
37
47
56
Sc
21
10
8.6
14
14
13
17
7.4
17
11
Se
0.3
<0.2
<0.2
0.3
0.3
<0.2
0.3
<0.2
0.4
<0.2
Sn
8.1
7.2
5.5
3.8
3.8
3.7
3.4
2.1
5.0
4.9
Sr
1340
1130
1030
1090
1060
745
484
1470
1090
1170
Ta
4.1
1.2
0.60
0.84
1.1
0.99
1.8
0.38
1.2
0.12
Te
49
66
56
40
41
25
33
32
58
34
Th
43
39
37
61
59
69
50
17
52
45
Tl
73
195
169
122
123
120
61
85
73
143
U19
9.7
8.6
9.6
9.3
7.6
5.1
9.2
14
8.3
(Continued
)
49
Dow
nloa
ded
by [
USG
S L
ibra
ries
Pro
gram
] at
08:
48 2
1 Ja
nuar
y 20
13
Table
3.Continued 3862
3477-B.3.4
3478-B.3.5
3513-13
DUP-3513-13
3513-14
3513-16
3533-7
3534-14.1
3717-12
V1130
848
797
662
644
612
270
861
974
904
W54
115
92
57
57
64
25
84
72
121
Zn
650
724
755
468
475
604
547
576
538
652
Zr
75
151
88
122
178
204
104
88
139
55
La
390
190
174
282
270
189
120
181
324
265
Ce
1460
1210
1100
1450
1400
1290
972
662
1260
1400
Pr
90.8
40.8
39.2
70.3
67.2
52.8
30.9
36.8
71.7
61.8
Nd
339
153
145
254
244
191
113
142
269
229
Sm
78.9
34.4
33.4
61.6
59.2
48.3
27.9
31.9
62.7
52.4
Eu
18.8
8.10
7.85
14.5
13.8
11.2
6.50
7.38
14.9
12.4
Gd
85.0
35.0
34.4
62.0
59.5
46.6
27.0
36.1
68.5
51.1
Tb
13.6
5.61
5.30
9.87
9.55
7.37
4.32
5.62
10.8
7.87
Dy
69.8
29.0
26.8
49.3
47.5
36.5
21.6
30.7
55.8
38.4
Y269
110
100
164
158
120
79.9
159
217
111
Ho
15.4
6.29
5.85
10.4
9.92
7.49
4.52
7.12
12.4
8.03
Er
41.8
17.6
16.1
27.9
27.1
20.8
11.9
20.0
34.0
21.4
Tm
5.82
2.48
2.26
4.03
3.80
2.92
1.78
2.84
4.80
2.97
Yb
35.0
15.5
14.0
23.8
23.6
18.4
11.1
17.3
29.3
18.3
Lu
5.19
2.48
2.26
3.76
3.54
2.75
1.68
2.67
4.42
2.81
Hg
ppb
292
78
89
68
69
8
Cl�
ppm
>5000
>5000
>5000
>5000
>5000
>5000
>5000
3640
>5000
>5000
AllCsconcentrations<5ppm.
50
Dow
nloa
ded
by [
USG
S L
ibra
ries
Pro
gram
] at
08:
48 2
1 Ja
nuar
y 20
13
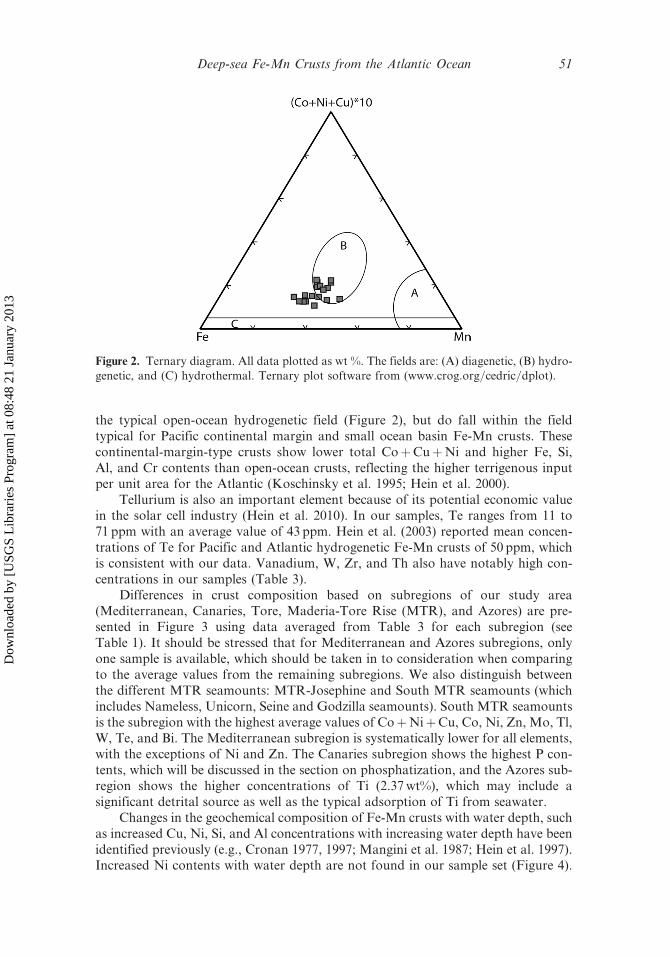
the typical open-ocean hydrogenetic field (Figure 2), but do fall within the fieldtypical for Pacific continental margin and small ocean basin Fe-Mn crusts. Thesecontinental-margin-type crusts show lower total CoþCuþNi and higher Fe, Si,Al, and Cr contents than open-ocean crusts, reflecting the higher terrigenous inputper unit area for the Atlantic (Koschinsky et al. 1995; Hein et al. 2000).
Tellurium is also an important element because of its potential economic valuein the solar cell industry (Hein et al. 2010). In our samples, Te ranges from 11 to71 ppm with an average value of 43 ppm. Hein et al. (2003) reported mean concen-trations of Te for Pacific and Atlantic hydrogenetic Fe-Mn crusts of 50 ppm, whichis consistent with our data. Vanadium, W, Zr, and Th also have notably high con-centrations in our samples (Table 3).
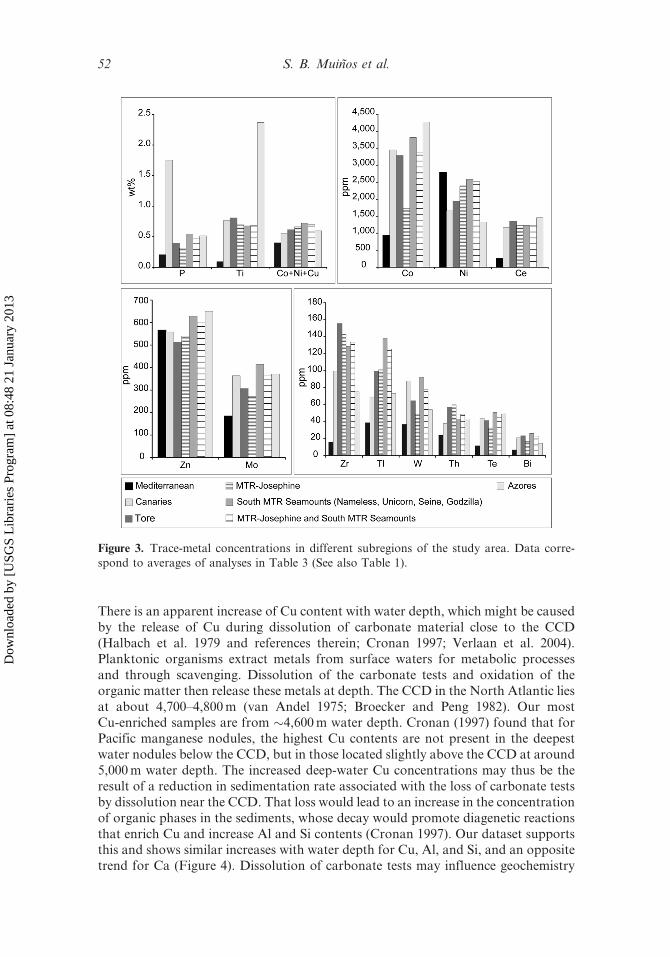
Differences in crust composition based on subregions of our study area(Mediterranean, Canaries, Tore, Maderia-Tore Rise (MTR), and Azores) are pre-sented in Figure 3 using data averaged from Table 3 for each subregion (seeTable 1). It should be stressed that for Mediterranean and Azores subregions, onlyone sample is available, which should be taken in to consideration when comparingto the average values from the remaining subregions. We also distinguish betweenthe different MTR seamounts: MTR-Josephine and South MTR seamounts (whichincludes Nameless, Unicorn, Seine and Godzilla seamounts). South MTR seamountsis the subregion with the highest average values of CoþNiþCu, Co, Ni, Zn, Mo, Tl,W, Te, and Bi. The Mediterranean subregion is systematically lower for all elements,with the exceptions of Ni and Zn. The Canaries subregion shows the highest P con-tents, which will be discussed in the section on phosphatization, and the Azores sub-region shows the higher concentrations of Ti (2.37wt%), which may include asignificant detrital source as well as the typical adsorption of Ti from seawater.
Changes in the geochemical composition of Fe-Mn crusts with water depth, suchas increased Cu, Ni, Si, and Al concentrations with increasing water depth have beenidentified previously (e.g., Cronan 1977, 1997; Mangini et al. 1987; Hein et al. 1997).Increased Ni contents with water depth are not found in our sample set (Figure 4).
Figure 2. Ternary diagram. All data plotted as wt %. The fields are: (A) diagenetic, (B) hydro-genetic, and (C) hydrothermal. Ternary plot software from (www.crog.org/cedric/dplot).
Deep-sea Fe-Mn Crusts from the Atlantic Ocean 51
Dow
nloa
ded
by [
USG
S L
ibra
ries
Pro
gram
] at
08:
48 2
1 Ja
nuar
y 20
13
There is an apparent increase of Cu content with water depth, which might be causedby the release of Cu during dissolution of carbonate material close to the CCD(Halbach et al. 1979 and references therein; Cronan 1997; Verlaan et al. 2004).Planktonic organisms extract metals from surface waters for metabolic processesand through scavenging. Dissolution of the carbonate tests and oxidation of theorganic matter then release these metals at depth. The CCD in the North Atlantic liesat about 4,700–4,800m (van Andel 1975; Broecker and Peng 1982). Our mostCu-enriched samples are from �4,600m water depth. Cronan (1997) found that forPacific manganese nodules, the highest Cu contents are not present in the deepestwater nodules below the CCD, but in those located slightly above the CCD at around5,000m water depth. The increased deep-water Cu concentrations may thus be theresult of a reduction in sedimentation rate associated with the loss of carbonate testsby dissolution near the CCD. That loss would lead to an increase in the concentrationof organic phases in the sediments, whose decay would promote diagenetic reactionsthat enrich Cu and increase Al and Si contents (Cronan 1997). Our dataset supportsthis and shows similar increases with water depth for Cu, Al, and Si, and an oppositetrend for Ca (Figure 4). Dissolution of carbonate tests may influence geochemistry
Figure 3. Trace-metal concentrations in different subregions of the study area. Data corre-spond to averages of analyses in Table 3 (See also Table 1).
52 S. B. Muinos et al.
Dow
nloa
ded
by [
USG
S L
ibra
ries
Pro
gram
] at
08:
48 2
1 Ja
nuar
y 20
13
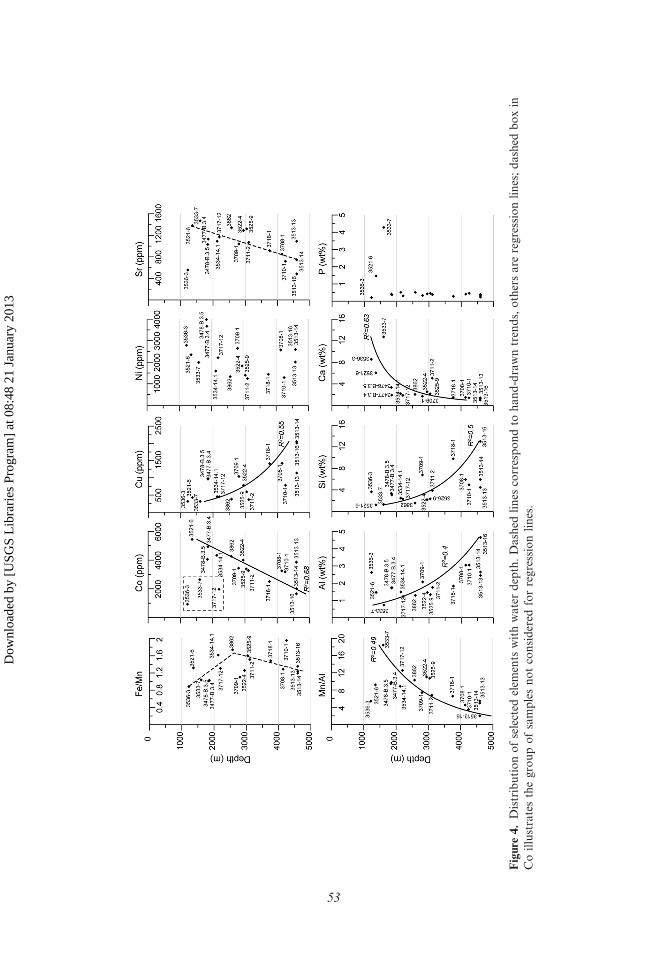
Figure
4.Distributionofselected
elem
ents
withwaterdepth.Dashed
lines
correspondto
hand-drawntrends,othersare
regressionlines;dashed
boxin
Coillustratesthegroupofsamplesnotconsidered
forregressionlines.
53
Dow
nloa
ded
by [
USG
S L
ibra
ries
Pro
gram
] at
08:
48 2
1 Ja
nuar
y 20
13
within the calcite lysocline at depths from about 2,600 to 3,000m as indicated bya significant change in the slope of the Ca pattern and a change from increasingFe=Mn to decreasing Fe=Mn with depth (Figure 4).
Rare Earth Elements
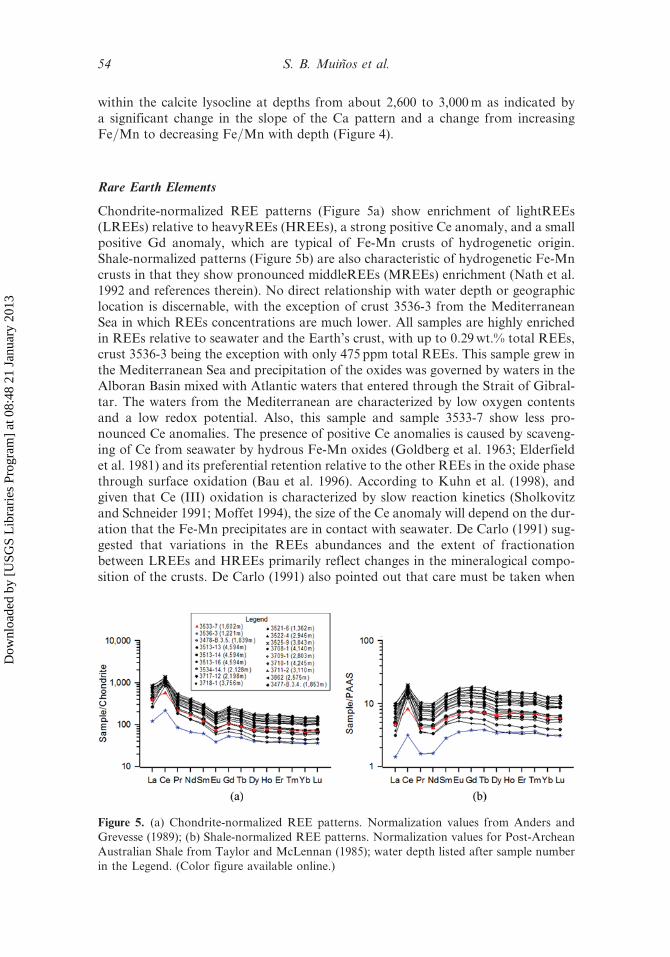
Chondrite-normalized REE patterns (Figure 5a) show enrichment of lightREEs(LREEs) relative to heavyREEs (HREEs), a strong positive Ce anomaly, and a smallpositive Gd anomaly, which are typical of Fe-Mn crusts of hydrogenetic origin.Shale-normalized patterns (Figure 5b) are also characteristic of hydrogenetic Fe-Mncrusts in that they show pronounced middleREEs (MREEs) enrichment (Nath et al.1992 and references therein). No direct relationship with water depth or geographiclocation is discernable, with the exception of crust 3536-3 from the MediterraneanSea in which REEs concentrations are much lower. All samples are highly enrichedin REEs relative to seawater and the Earth’s crust, with up to 0.29wt.% total REEs,crust 3536-3 being the exception with only 475 ppm total REEs. This sample grew inthe Mediterranean Sea and precipitation of the oxides was governed by waters in theAlboran Basin mixed with Atlantic waters that entered through the Strait of Gibral-tar. The waters from the Mediterranean are characterized by low oxygen contentsand a low redox potential. Also, this sample and sample 3533-7 show less pro-nounced Ce anomalies. The presence of positive Ce anomalies is caused by scaveng-ing of Ce from seawater by hydrous Fe-Mn oxides (Goldberg et al. 1963; Elderfieldet al. 1981) and its preferential retention relative to the other REEs in the oxide phasethrough surface oxidation (Bau et al. 1996). According to Kuhn et al. (1998), andgiven that Ce (III) oxidation is characterized by slow reaction kinetics (Sholkovitzand Schneider 1991; Moffet 1994), the size of the Ce anomaly will depend on the dur-ation that the Fe-Mn precipitates are in contact with seawater. De Carlo (1991) sug-gested that variations in the REEs abundances and the extent of fractionationbetween LREEs and HREEs primarily reflect changes in the mineralogical compo-sition of the crusts. De Carlo (1991) also pointed out that care must be taken when
Figure 5. (a) Chondrite-normalized REE patterns. Normalization values from Anders andGrevesse (1989); (b) Shale-normalized REE patterns. Normalization values for Post-ArcheanAustralian Shale from Taylor and McLennan (1985); water depth listed after sample numberin the Legend. (Color figure available online.)
54 S. B. Muinos et al.
Dow
nloa
ded
by [
USG
S L
ibra
ries
Pro
gram
] at
08:
48 2
1 Ja
nuar
y 20
13
using Ce anomalies calculated from bulk REE data as indicators of paleoredox con-ditions, given that the Ce anomaly is not only sensitive to variations in Ce contentbut also to variations in the concentrations of trivalent REEs, which are associatedprimarily with Fe and=or phosphate phases, whereas Ce is associated with the Mnphase. The Ce anomaly may not solely reflect Ce redox cycling and the REEs mayprovide indirect rather than direct evidence of changes in the depositional conditionsthat result from controls on the Fe=Mn ratio. Accordingly, the low REE contents ofcrust 3536-3 are most likely the result of hydrothermal or diagenetic contributionscharacterized by fast growth rates and high Ni and Li contents.
Platinum-Group Elements
Fe-Mn crusts are highly enriched in PGEs (Ir, Ru, Rh, Pt, Pd), especially Pt,compared to Earth’s crustal abundances (Hein et al. 2000). Based on the five samplesanalyzed for PGEs, the Pt contents vary between 153 and 512 ppb, with an averagevalue of 283 ppb; Rh, Ru, Pd, and Ir show concentrations up to 39, 21, 19, and 10ppb, respectively (Table 4).
The processes of Pt enrichment in Fe-Mn crusts are not fully understood. Severalmechanisms have been proposed for this enrichment, such as reduction or oxidationreactions, diagenetic or cosmogenic input, and enrichment related to phosphatization(Halbach et al. 1989a, 1990; Vonderhaar et al. 2000; Hein et al. 2005). We considerthat the oxidative enrichment is the most likely general mechanism for high Ptconcentrations; tetravalent Pt would be the final product, as is also the case for Ce,whereas Te is hexavalent (Hein et al. 2003). The most likely mechanism is that Pt issorbed from seawater and then oxidized on the surface of the FeO(OH) (Hodgeet al. 1985; Hein et al. 1997; Hein et al. 2003; Banakar et al. 2007).
Interelement Relationships and Mineral Phases
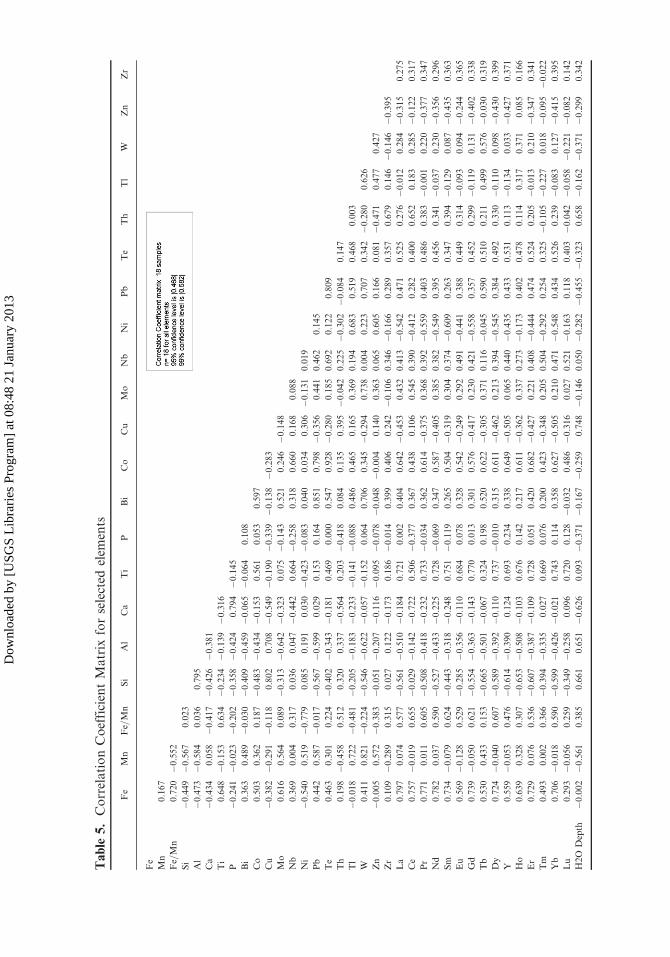
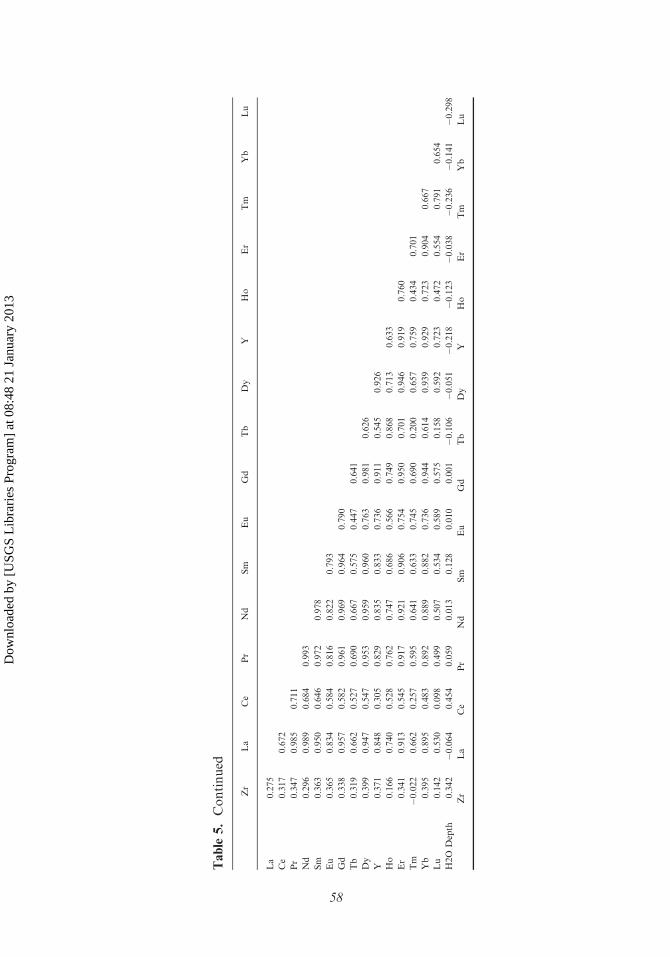
A correlation coefficient matrix for selected elements (Table 5) shows that Fe is posi-tively correlated (99% Confidence Interval-CI) with Ti, Mo, and REEs (the corre-lation is better with LREEs and MREEs) and to a lesser extent (95% CI) with Yand Co. Manganese is positively correlated with W, Tl, and Pb at the 99% CI,and also with Zn, Mo, Ni, and Bi at 95% CI, and shows negative correlations withthe REEs (except La, Pr, and Nd). Cobalt shows strong positive correlations (99%CI) with Te, Pb, Nb, Bi, and some REEs (La, Pr, Nd, Tb, Dy, Ho, Er, Yb), andthe correlations are better with the MREEs and HREEs. Tellurium also shows posi-tive correlations with the same elements as Co, but Te shows lower correlation coef-ficients with Bi and the REEs. Both Co and Te show higher coefficients with Fe thanwith Mn and both show negative correlations with elements characteristic of thedetrital-aluminosilicate fraction, which was also found for Te in open-ocean crusts(Hein et al. 2003).
Q-Mode factor analysis produces five factors that explain 97.3% of totalvariance of the data. Considering the mineralogical composition of the samples,we conclude that the five factors represent the Fe oxyhydroxide, aluminosilicate,biogenic (which may also include hydrothermal Mn), hydrogenetic Mn, and CFAphases (Figure 6), which is in agreement with previous work (Muinos 2005) thatused a slightly different dataset and statistical tool (Pereira et al. 2003) and withinvestigations of globally distributed crusts (Frank et al. 1999). It is also worth
Deep-sea Fe-Mn Crusts from the Atlantic Ocean 55
Dow
nloa
ded
by [
USG
S L
ibra
ries
Pro
gram
] at
08:
48 2
1 Ja
nuar
y 20
13
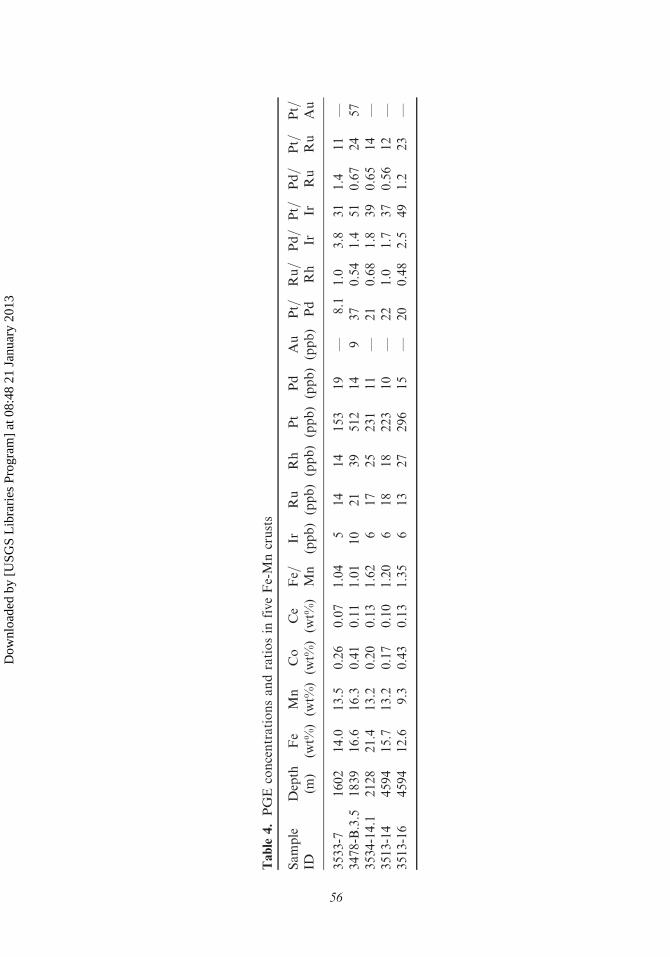
Table
4.PGE
concentrationsandratiosin
fiveFe-Mncrusts
Sample
IDDepth
(m)
Fe
(wt%
)Mn
(wt%
)Co
(wt%
)Ce
(wt%
)Fe=
Mn
Ir(ppb)
Ru
(ppb)
Rh
(ppb)
Pt
(ppb)
Pd
(ppb)
Au
(ppb)
Pt= Pd
Ru=
Rh
Pd=
IrPt= Ir
Pd=
Ru
Pt=
Ru
Pt=
Au
3533-7
1602
14.0
13.5
0.26
0.07
1.04
514
14
153
19
—8.1
1.0
3.8
31
1.4
11
—3478-B.3.5
1839
16.6
16.3
0.41
0.11
1.01
10
21
39
512
14
937
0.54
1.4
51
0.67
24
57
3534-14.1
2128
21.4
13.2
0.20
0.13
1.62
617
25
231
11
—21
0.68
1.8
39
0.65
14
—3513-14
4594
15.7
13.2
0.17
0.10
1.20
618
18
223
10
—22
1.0
1.7
37
0.56
12
—3513-16
4594
12.6
9.3
0.43
0.13
1.35
613
27
296
15
—20
0.48
2.5
49
1.2
23
—
56
Dow
nloa
ded
by [
USG
S L
ibra
ries
Pro
gram
] at
08:
48 2
1 Ja
nuar
y 20
13
Table
5.CorrelationCoefficientMatrix
forselected
elem
ents
Fe
Mn
Fe=Mn
Si
Al
Ca
Ti
PBi
Co
Cu
Mo
Nb
Ni
Pb
Te
Th
Tl
WZn
Zr
Fe
Mn
0.167
Fe=Mn
0.720
�0.552
Si
�0.449
�0.567
0.023
Al
�0.473
�0.584
0.036
0.795
Ca
�0.434
0.058
�0.417
�0.426
�0.381
Ti
0.648
�0.153
0.634
�0.234
�0.139
�0.316
P�0.241
�0.023
�0.202
�0.358
�0.424
0.794
�0.145
Bi
0.363
0.489
�0.030
�0.409
�0.459
�0.065
�0.064
0.108
Co
0.503
0.362
0.187
�0.483
�0.434
�0.153
0.561
0.053
0.597
Cu
�0.382
�0.291
�0.118
0.802
0.708
�0.549
�0.190
�0.339
�0.138
�0.283
Mo
0.616
0.564
0.089
�0.313
�0.642
�0.323
0.075
�0.143
0.521
0.246
�0.148
Nb
0.369
0.004
0.317
0.036
0.047
�0.442
0.664
�0.258
0.318
0.660
0.168
0.088
Ni
�0.540
0.519
�0.779
0.085
0.191
0.030
�0.423
�0.083
0.040
0.034
0.306
�0.131
0.019
Pb
0.442
0.587
�0.017
�0.567
�0.599
0.029
0.153
0.164
0.851
0.798
�0.356
0.441
0.462
0.145
Te
0.463
0.301
0.224
�0.402
�0.343
�0.181
0.469
0.000
0.547
0.928
�0.280
0.185
0.692
0.122
0.809
Th
0.198
�0.458
0.512
0.320
0.337
�0.564
0.203
�0.418
0.084
0.135
0.395
�0.042
0.225
�0.302
�0.084
0.147
Tl
�0.018
0.722
�0.481
�0.205
�0.183
�0.233
�0.141
�0.088
0.486
0.465
0.165
0.369
0.194
0.683
0.519
0.468
0.003
W0.411
0.821
�0.224
�0.546
�0.622
�0.057
�0.152
0.064
0.706
0.345
�0.294
0.738
0.004
0.223
0.707
0.342
�0.280
0.626
Zn
�0.005
0.572
�0.383
�0.051
�0.207
�0.116
�0.095
�0.078
�0.048
�0.004
0.140
0.363
0.065
0.605
0.166
0.081
�0.471
0.477
0.427
Zr
0.109
�0.289
0.315
0.027
0.122
�0.173
0.186
�0.014
0.399
0.406
0.242
�0.106
0.346
�0.166
0.289
0.357
0.679
0.146
�0.146
�0.395
La
0.797
0.074
0.577
�0.561
�0.510
�0.184
0.721
0.002
0.404
0.642
�0.453
0.432
0.413
�0.542
0.471
0.525
0.276
�0.012
0.284
�0.315
0.275
Ce
0.757
�0.019
0.655
�0.029
�0.142
�0.722
0.506
�0.377
0.367
0.438
0.106
0.545
0.390
�0.412
0.282
0.400
0.652
0.183
0.285
�0.122
0.317
Pr
0.771
0.011
0.605
�0.508
�0.418
�0.232
0.733
�0.034
0.362
0.614
�0.375
0.368
0.392
�0.559
0.403
0.486
0.383
�0.001
0.220
�0.377
0.347
Nd
0.782
0.037
0.590
�0.527
�0.433
�0.225
0.728
�0.069
0.347
0.587
�0.405
0.385
0.382
�0.549
0.395
0.456
0.341
�0.037
0.230
�0.356
0.296
Sm
0.734
�0.079
0.624
�0.443
�0.318
�0.248
0.751
�0.119
0.265
0.504
�0.319
0.304
0.374
�0.609
0.263
0.347
0.394
�0.129
0.087
�0.435
0.363
Eu
0.569
�0.128
0.529
�0.285
�0.356
�0.110
0.684
0.078
0.328
0.542
�0.249
0.292
0.491
�0.441
0.388
0.449
0.314
�0.093
0.094
�0.244
0.365
Gd
0.739
�0.050
0.621
�0.554
�0.363
�0.143
0.770
0.013
0.301
0.576
�0.417
0.230
0.421
�0.558
0.357
0.452
0.299
�0.119
0.131
�0.402
0.338
Tb
0.530
0.433
0.153
�0.665
�0.501
�0.067
0.324
0.198
0.520
0.622
�0.305
0.371
0.116
�0.045
0.590
0.510
0.211
0.499
0.576
�0.030
0.319
Dy
0.724
�0.040
0.607
�0.589
�0.392
�0.110
0.737
�0.010
0.315
0.611
�0.462
0.213
0.394
�0.545
0.384
0.492
0.330
�0.110
0.098
�0.430
0.399
Y0.559
�0.053
0.476
�0.614
�0.390
0.124
0.693
0.234
0.338
0.649
�0.505
0.065
0.440
�0.435
0.433
0.531
0.113
�0.134
0.033
�0.427
0.371
Ho
0.639
0.328
0.307
�0.653
�0.508
�0.103
0.676
0.142
0.217
0.611
�0.362
0.337
0.273
�0.173
0.402
0.478
0.114
0.317
0.371
0.085
0.166
Er
0.729
0.076
0.536
�0.607
�0.387
�0.109
0.728
0.051
0.420
0.682
�0.427
0.221
0.408
�0.444
0.474
0.524
0.205
�0.013
0.210
�0.347
0.341
Tm
0.493
0.002
0.366
�0.394
�0.335
0.027
0.669
0.076
0.200
0.423
�0.348
0.205
0.504
�0.292
0.254
0.325
�0.105
�0.227
0.018
�0.095
�0.022
Yb
0.706
�0.018
0.590
�0.599
�0.426
�0.021
0.743
0.114
0.358
0.627
�0.505
0.210
0.471
�0.548
0.434
0.526
0.239
�0.083
0.127
�0.415
0.395
Lu
0.293
�0.056
0.259
�0.349
�0.258
0.096
0.720
0.128
�0.032
0.486
�0.316
0.027
0.521
�0.163
0.118
0.403
�0.042
�0.058
�0.221
�0.082
0.142
H2O
Depth
�0.002
�0.561
0.385
0.661
0.651
�0.626
0.093
�0.371
�0.167
�0.259
0.748
�0.146
0.050
�0.282
�0.455
�0.323
0.658
�0.162
�0.371
�0.299
0.342
Dow
nloa
ded
by [
USG
S L
ibra
ries
Pro
gram
] at
08:
48 2
1 Ja
nuar
y 20
13
Table
5.Continued
Zr
La
Ce
Pr
Nd
Sm
Eu
Gd
Tb
Dy
YHo
Er
Tm
Yb
Lu
La
0.275
Ce
0.317
0.672
Pr
0.347
0.985
0.711
Nd
0.296
0.989
0.684
0.993
Sm
0.363
0.950
0.646
0.972
0.978
Eu
0.365
0.834
0.584
0.816
0.822
0.793
Gd
0.338
0.957
0.582
0.961
0.969
0.964
0.790
Tb
0.319
0.662
0.527
0.690
0.667
0.575
0.447
0.641
Dy
0.399
0.947
0.547
0.953
0.959
0.960
0.763
0.981
0.626
Y0.371
0.848
0.305
0.829
0.835
0.833
0.736
0.911
0.545
0.926
Ho
0.166
0.740
0.528
0.762
0.747
0.686
0.566
0.749
0.868
0.713
0.633
Er
0.341
0.913
0.545
0.917
0.921
0.906
0.754
0.950
0.701
0.946
0.919
0.760
Tm
�0.022
0.662
0.257
0.595
0.641
0.633
0.745
0.690
0.200
0.657
0.759
0.434
0.701
Yb
0.395
0.895
0.483
0.892
0.889
0.882
0.736
0.944
0.614
0.939
0.929
0.723
0.904
0.667
Lu
0.142
0.530
0.098
0.499
0.507
0.534
0.589
0.575
0.158
0.592
0.723
0.472
0.554
0.791
0.654
H2O
Depth
0.342
�0.064
0.454
0.059
0.013
0.128
0.010
0.001
�0.106
�0.051
�0.218
�0.123
�0.038
�0.236
�0.141
�0.298
Zr
La
Ce
Pr
Nd
Sm
Eu
Gd
Tb
Dy
YHo
Er
Tm
Yb
Lu
58
Dow
nloa
ded
by [
USG
S L
ibra
ries
Pro
gram
] at
08:
48 2
1 Ja
nuar
y 20
13
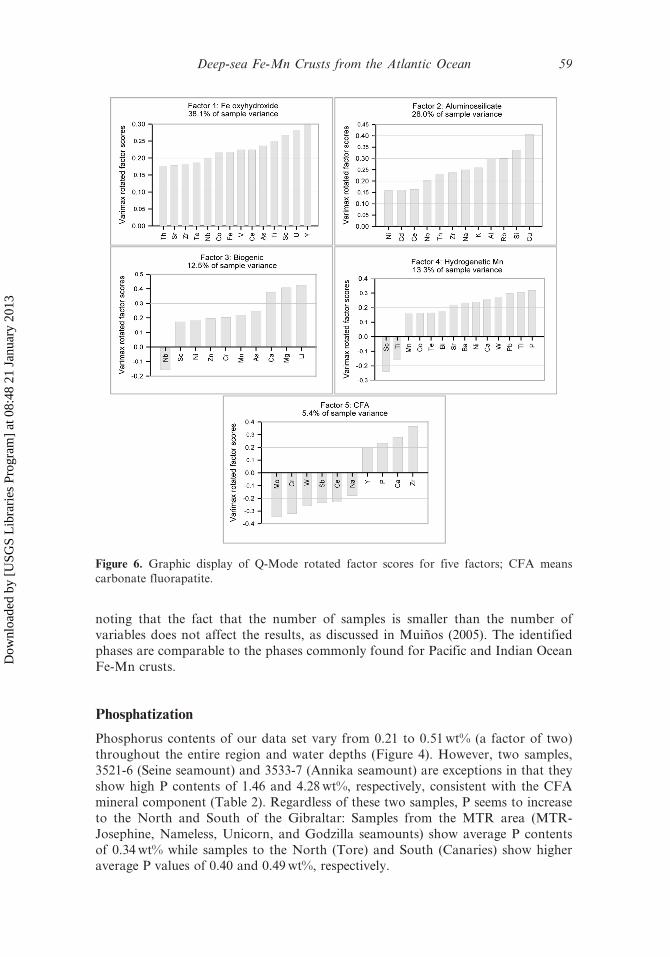
noting that the fact that the number of samples is smaller than the number ofvariables does not affect the results, as discussed in Muinos (2005). The identifiedphases are comparable to the phases commonly found for Pacific and Indian OceanFe-Mn crusts.
Phosphatization
Phosphorus contents of our data set vary from 0.21 to 0.51wt% (a factor of two)throughout the entire region and water depths (Figure 4). However, two samples,3521-6 (Seine seamount) and 3533-7 (Annika seamount) are exceptions in that theyshow high P contents of 1.46 and 4.28wt%, respectively, consistent with the CFAmineral component (Table 2). Regardless of these two samples, P seems to increaseto the North and South of the Gibraltar: Samples from the MTR area (MTR-Josephine, Nameless, Unicorn, and Godzilla seamounts) show average P contentsof 0.34wt% while samples to the North (Tore) and South (Canaries) show higheraverage P values of 0.40 and 0.49wt%, respectively.
Figure 6. Graphic display of Q-Mode rotated factor scores for five factors; CFA meanscarbonate fluorapatite.
Deep-sea Fe-Mn Crusts from the Atlantic Ocean 59
Dow
nloa
ded
by [
USG
S L
ibra
ries
Pro
gram
] at
08:
48 2
1 Ja
nuar
y 20
13
Based on our limited dataset, phosphatization took place within the water-depthrange of 1,200 to 1,500m, but may also have occurred at shallower depths. Thatwater-depth range corresponds to the lower core of MOW characterized by low dis-solved oxygen contents and therefore low oxidation potential. This relationshipwas also pointed out by Koschinsky et al. (1996) and provides an indication of theinfluence of the prevailing oceanographic conditions in the area on the compositionsof the crusts. Hein et al. (1993) suggested that during stable, warm climatic conditionsdissolved phosphorous derived from intense chemical weathering on continents accu-mulated in the deep sea in large quantities. With the expansion of Antarctic glaciationand intensification of ocean circulation, the phosphorous-rich deep waters were redis-tributed by upwelling and turbulent mixing at the seamounts to intermediate waterdepths and may have been temporarily stored in the OMZ. Koschinsky and Halbach(1995) proposed a model for precipitation of hydrogenetic Fe-Mn crusts, with crustsbeing formed below the OMZ, as the result of the mixture of Mn2þ-rich and O2-poorwaters with Mn2þ-poor and O2-rich deep waters. Halbach et al. (1982, 1989b) andKoschinsky et al. (1997) linked the phosphatization with the expansion of theOMZ as the result of increased surface-water productivity. The expansion of theOMZ led to the impregnation with CFA of the extant crusts. Despite the fact thata phosphatized old crust generation is missing in Atlantic crusts, Koschinsky et al.(1996) noted phosphatization episodes within a 8.5Ma record from a crust collectedfrom Lion Seamount in the NE Atlantic Ocean, which may at least in part correspondto the 6Ma event of phosphatization of limestone that occurred on Lighthill sea-mount off Morocco (Jones et al. 2002). The phosphatization was most likely a conse-quence of episodes of increased productivity and biogenic particle flux and is muchyounger than the phosphatization episodes in the Pacific (Hein et al. 1993).
Thus, the most probable explanation for shallow-water phosphatization is aninteraction of the OMZ and MOW to produce an extended depth range for O2-poorand Mn2þ-and dissolved P-rich waters, which reached down the slopes of someseamounts covered with Fe-Mn crusts. As a consequence, crust accretion may havebeen prohibited and precipitation of CFA promoted at these relatively shallowdepths in the Atlantic Ocean (Hein et al. 2000 and references therein).
Resource Considerations
Fe-Mn deposits in the Portuguese EEZ may become an important future resource butthere is a clear need for studies to better understand their origin and distribution. Dur-ing the oceanographic cruisesmentioned above, aswell as during the SO83 cruise (Hal-bach andScientific Crew 1993), samples of Fe-Mnnodules and crustswere collected onvarious seamounts from the northeast Atlantic. Despite the fact that the sampling wasnot systematic, and knowledge of the area needs to be augmented, we present afirst-order evaluation of the possible resource potential of Fe-Mn crusts within andadjacent to the Portuguese EEZ, based on criteria developed by Hein et al. (2009).
Grade
According to Hein et al. (2009), large seamount summit areas with high grades of Co,Ti, REEs, Te, Ni, Th, Mn, Pt, etc, will be preferentially chosen for mining the crusts.It is also stressed that the grade will depend on the ability to collect Fe-Mn crustswithout their substrate rocks, which would of course result in a decrease in the metal
60 S. B. Muinos et al.
Dow
nloa
ded
by [
USG
S L
ibra
ries
Pro
gram
] at
08:
48 2
1 Ja
nuar
y 20
13
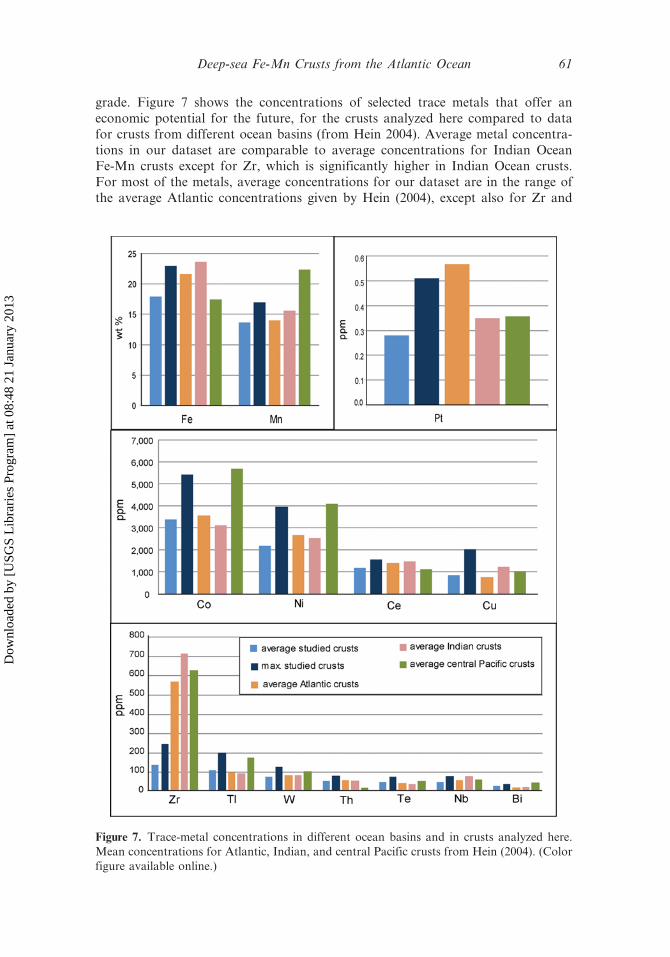
grade. Figure 7 shows the concentrations of selected trace metals that offer aneconomic potential for the future, for the crusts analyzed here compared to datafor crusts from different ocean basins (from Hein 2004). Average metal concentra-tions in our dataset are comparable to average concentrations for Indian OceanFe-Mn crusts except for Zr, which is significantly higher in Indian Ocean crusts.For most of the metals, average concentrations for our dataset are in the range ofthe average Atlantic concentrations given by Hein (2004), except also for Zr and
Figure 7. Trace-metal concentrations in different ocean basins and in crusts analyzed here.Mean concentrations for Atlantic, Indian, and central Pacific crusts from Hein (2004). (Colorfigure available online.)
Deep-sea Fe-Mn Crusts from the Atlantic Ocean 61
Dow
nloa
ded
by [
USG
S L
ibra
ries
Pro
gram
] at
08:
48 2
1 Ja
nuar
y 20
13
Pt. In comparison to central Pacific crusts, the average compositions of the crustsanalyzed here are systematically lower, with the exceptions of Th, which is enrichedin Atlantic and Indian crusts, and Te and Ce, which show similar concentrations.Nevertheless, if we consider the maximum values for our samples, the concentrationsare similar to average central Pacific concentrations, except once again for Zr. Thehighest Co concentrations in our crusts of up to 0.54% Co are found in theshallower-water samples (on Seine and Nameless Seamounts; Figure 4). Furtherexploration is warranted within those areas and also regionally to possibly locate lar-ger areas with mean crust grades similar to the maximum concentrations found forindividual crusts analyzed here.
Tonnage (Thickness)
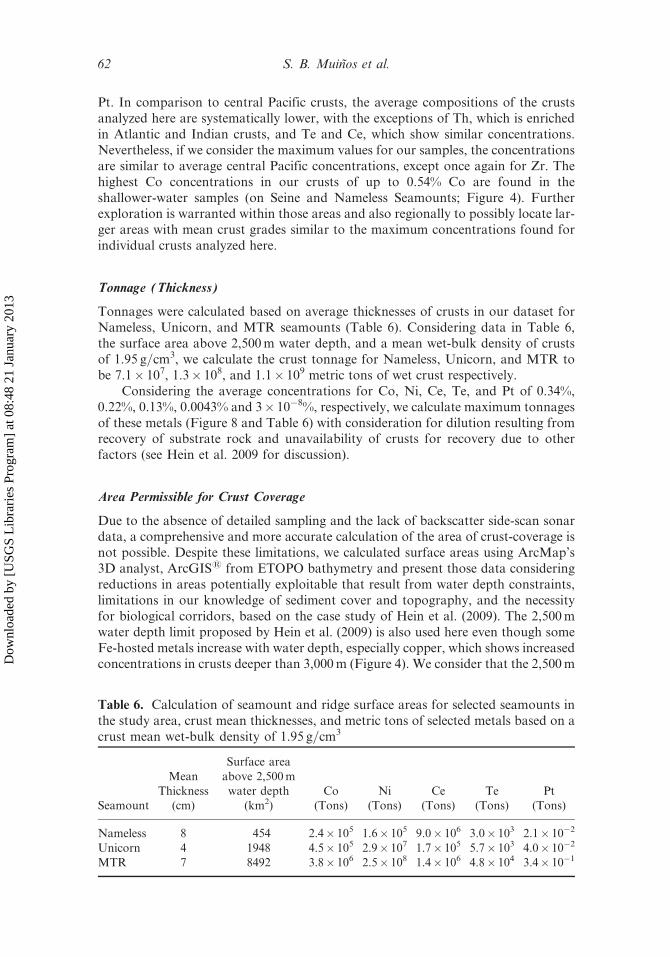
Tonnages were calculated based on average thicknesses of crusts in our dataset forNameless, Unicorn, and MTR seamounts (Table 6). Considering data in Table 6,the surface area above 2,500m water depth, and a mean wet-bulk density of crustsof 1.95 g=cm3, we calculate the crust tonnage for Nameless, Unicorn, and MTR tobe 7.1� 107, 1.3� 108, and 1.1� 109 metric tons of wet crust respectively.
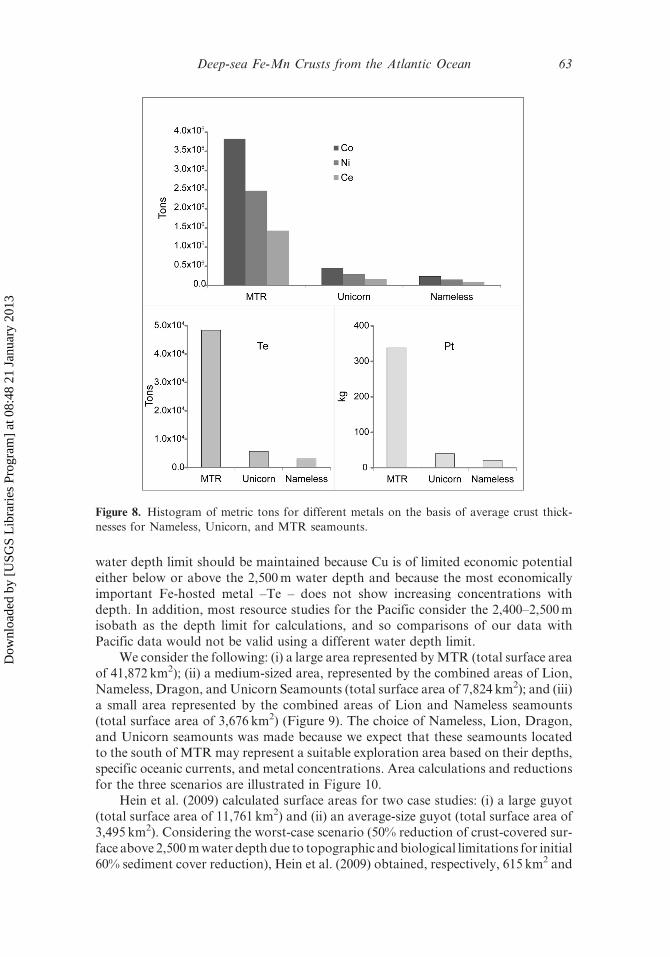
Considering the average concentrations for Co, Ni, Ce, Te, and Pt of 0.34%,0.22%, 0.13%, 0.0043% and 3� 10�8%, respectively, we calculate maximum tonnagesof these metals (Figure 8 and Table 6) with consideration for dilution resulting fromrecovery of substrate rock and unavailability of crusts for recovery due to otherfactors (see Hein et al. 2009 for discussion).
Area Permissible for Crust Coverage
Due to the absence of detailed sampling and the lack of backscatter side-scan sonardata, a comprehensive and more accurate calculation of the area of crust-coverage isnot possible. Despite these limitations, we calculated surface areas using ArcMap’s3D analyst, ArcGIS1 from ETOPO bathymetry and present those data consideringreductions in areas potentially exploitable that result from water depth constraints,limitations in our knowledge of sediment cover and topography, and the necessityfor biological corridors, based on the case study of Hein et al. (2009). The 2,500mwater depth limit proposed by Hein et al. (2009) is also used here even though someFe-hosted metals increase with water depth, especially copper, which shows increasedconcentrations in crusts deeper than 3,000m (Figure 4). We consider that the 2,500m
Table 6. Calculation of seamount and ridge surface areas for selected seamounts inthe study area, crust mean thicknesses, and metric tons of selected metals based on acrust mean wet-bulk density of 1.95 g=cm3
Seamount
MeanThickness
(cm)
Surface areaabove 2,500mwater depth
(km2)Co
(Tons)Ni
(Tons)Ce
(Tons)Te
(Tons)Pt
(Tons)
Nameless 8 454 2.4� 105 1.6� 105 9.0� 106 3.0� 103 2.1� 10�2
Unicorn 4 1948 4.5� 105 2.9� 107 1.7� 105 5.7� 103 4.0� 10�2
MTR 7 8492 3.8� 106 2.5� 108 1.4� 106 4.8� 104 3.4� 10�1
62 S. B. Muinos et al.
Dow
nloa
ded
by [
USG
S L
ibra
ries
Pro
gram
] at
08:
48 2
1 Ja
nuar
y 20
13
water depth limit should be maintained because Cu is of limited economic potentialeither below or above the 2,500m water depth and because the most economicallyimportant Fe-hosted metal –Te – does not show increasing concentrations withdepth. In addition, most resource studies for the Pacific consider the 2,400–2,500misobath as the depth limit for calculations, and so comparisons of our data withPacific data would not be valid using a different water depth limit.
We consider the following: (i) a large area represented byMTR (total surface areaof 41,872 km2); (ii) a medium-sized area, represented by the combined areas of Lion,Nameless, Dragon, and Unicorn Seamounts (total surface area of 7,824 km2); and (iii)a small area represented by the combined areas of Lion and Nameless seamounts(total surface area of 3,676 km2) (Figure 9). The choice of Nameless, Lion, Dragon,and Unicorn seamounts was made because we expect that these seamounts locatedto the south of MTRmay represent a suitable exploration area based on their depths,specific oceanic currents, and metal concentrations. Area calculations and reductionsfor the three scenarios are illustrated in Figure 10.
Hein et al. (2009) calculated surface areas for two case studies: (i) a large guyot(total surface area of 11,761 km2) and (ii) an average-size guyot (total surface area of3,495 km2). Considering the worst-case scenario (50% reduction of crust-covered sur-face above 2,500mwater depth due to topographic and biological limitations for initial60% sediment cover reduction), Hein et al. (2009) obtained, respectively, 615 km2 and
Figure 8. Histogram of metric tons for different metals on the basis of average crust thick-nesses for Nameless, Unicorn, and MTR seamounts.
Deep-sea Fe-Mn Crusts from the Atlantic Ocean 63
Dow
nloa
ded
by [
USG
S L
ibra
ries
Pro
gram
] at
08:
48 2
1 Ja
nuar
y 20
13
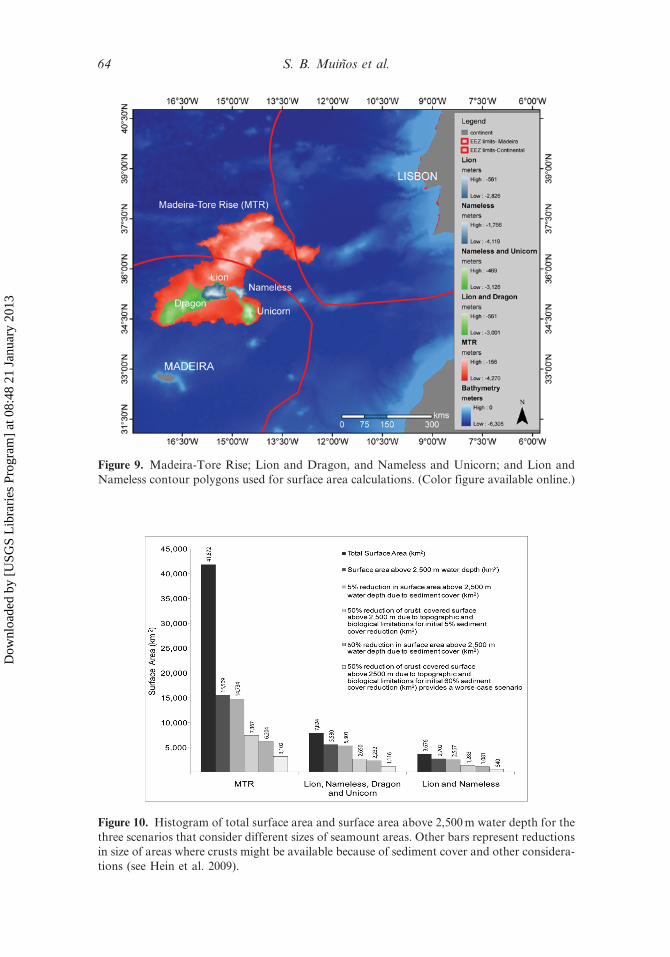
Figure 9. Madeira-Tore Rise; Lion and Dragon, and Nameless and Unicorn; and Lion andNameless contour polygons used for surface area calculations. (Color figure available online.)
Figure 10. Histogram of total surface area and surface area above 2,500m water depth for thethree scenarios that consider different sizes of seamount areas. Other bars represent reductionsin size of areas where crusts might be available because of sediment cover and other considera-tions (see Hein et al. 2009).
64 S. B. Muinos et al.
Dow
nloa
ded
by [
USG
S L
ibra
ries
Pro
gram
] at
08:
48 2
1 Ja
nuar
y 20
13
231 km2 of permissible area. A worst-case scenario for our dataset would yield surfaceareas of 3,102, 1,116, and 540 km2, for the three groups described above, respectively(Figure 10). Considering these surface areas, a wet bulk density of 1.95 g=cm3, anannual production of 1 million tons, and assuming a general mean crust thickness of3 cm rather than using the limited dataset that we have for crust thicknesses from eachseamount, the area needed to maintain a 20-year mine site is 342 km2, which can bepotentially accommodated by all three groups. These results are comparable to theresults obtained by Hein et al. (2009) for central equatorial Pacific seamounts.
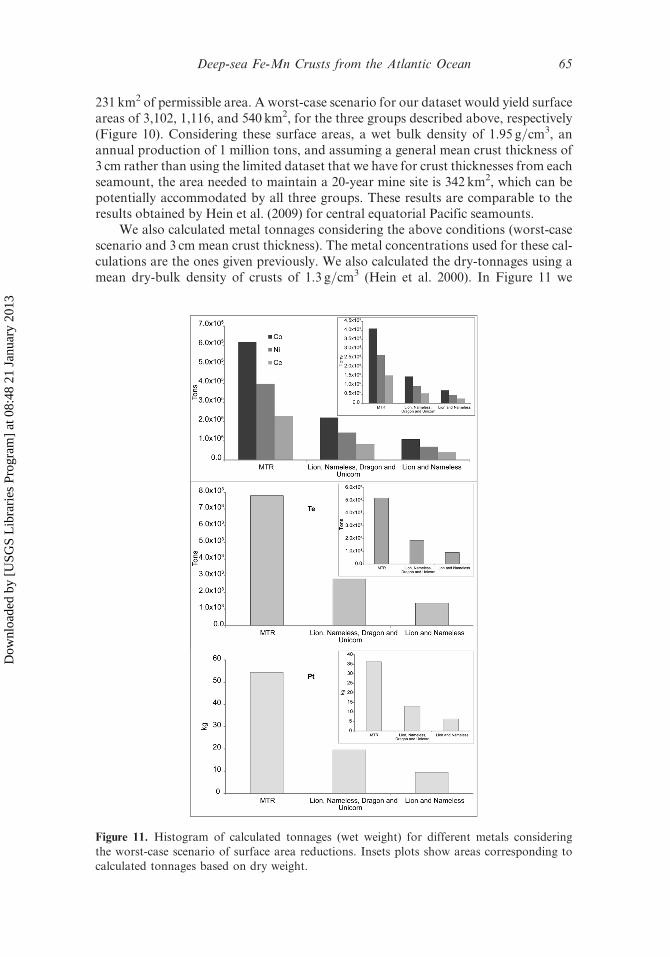
We also calculated metal tonnages considering the above conditions (worst-casescenario and 3 cm mean crust thickness). The metal concentrations used for these cal-culations are the ones given previously. We also calculated the dry-tonnages using amean dry-bulk density of crusts of 1.3 g=cm3 (Hein et al. 2000). In Figure 11 we
Figure 11. Histogram of calculated tonnages (wet weight) for different metals consideringthe worst-case scenario of surface area reductions. Insets plots show areas corresponding tocalculated tonnages based on dry weight.
Deep-sea Fe-Mn Crusts from the Atlantic Ocean 65
Dow
nloa
ded
by [
USG
S L
ibra
ries
Pro
gram
] at
08:
48 2
1 Ja
nuar
y 20
13
present a histogram of calculated tonnages (wet- and dry-weight) for the metals con-sidered. Maximum tonnages (resulting from large area calculations) for Co, Ni, Ce,Te and Pt are 6.2� 105, 4.0� 105, 2.3� 105, 7.8� 103 and 5.4� 10�2 tons, respect-ively. Considering the small area, our calculations result in 1.1� 105, 6.9� 104,4.0� 104, 1.4� 103 and 9.5� 10�3 tons for the same metals, respectively. Our resultsshow that the study area within the Portuguese EEZ (and adjacent areas in Inter-national Waters, for MTR; Figure 11) is comparable to that of areas in the centralPacific Ocean presented in Hein et al. (2009). Exploration beyond reconnaissancemay now be warranted and should include detailed sampling, backscatter side-scansonar, bathymetric mapping, and detailed mapping of crust thicknesses, etc., in orderto better constrain the assumptions made here and to allow for a quantitative resourceevaluation.
Conclusions
The objective of this study was to determine the composition of Fe-Mn crusts fromthe northeast Atlantic and to consider gaps in our knowledge needed for assessingthe quantitative resource potential of these deposits. The compositions of the studiedcrusts are typical for hydrogenetic crusts adjacent to continental margins. Specificcompositional differences are found that likely indicate specific local conditions dur-ing crust accretion, for example higher Co, Ni, and Zr in Pacific crusts and higher Thin Atlantic crusts.
The enrichment of trace metals of economic interest in Fe-Mn crusts is ofparticular importance for their potential as a resource (i.e., Te and REEs), and isof specific interest for the resource potential of these deposits within the PortugueseEEZ. Based on the criteria of Hein et al. (2009), we calculated tonnages for specificmetals in chosen areas in and adjacent to the Portuguese EEZ. Our results indicatethat the study area is comparable to parts of the central Pacific Ocean and mayrepresent an important metal resource for the future. Further studies are warrantedin order to better constrain and quantify the results presented here.
References
Amante, C. and B. W. Eakins. 2009. ETOPO1 1 Arc-Minute Global Relief Model: Procedures,Data Sources and Analysis. Vol. March 2009, NOAA Technical Memorandum NESDISNGDC-24.
Ambar, I., L. Armi, A. Bower, and T. Ferreira. 1999. Some aspects of time variability of theMediterranean Water off south Portugal. Deep-Sea Research I 46: 1109–1136.
Ambar, I. and M. R. Howe. 1979. Observations of the Mediterranean outflow-I Mixing in theMediterranean Outflow. Deep-Sea Research I 26A: 535–554.
Ambar, I., N. Serra, M. J. Brogueira, G. Cabecadas, F. Abrantes, P. Freitas, C. Goncalves,and N. Gonzalez. 2002. Physical, chemical and sedimentological aspects of the Mediter-ranean outflow off Iberia. Deep-Sea Research II 49: 4163–4177.
Anders, E. and N. Grevesse. 1989. Abundances of the elements: Meteoritic and solar. Geochi-mica et Cosmochimica Acta 53: 197–214.
Banakar, V. K., J. R. Hein, R. P. Rajani, and A. R. Chodankar. 2007. Platinum group ele-ments and gold in ferromanganese crusts from Afanasiy-Nikitin seamount, equatorialIndian Ocean: Sources and fractionation. Journal of Earth System Science 116: 3–13.
66 S. B. Muinos et al.
Dow
nloa
ded
by [
USG
S L
ibra
ries
Pro
gram
] at
08:
48 2
1 Ja
nuar
y 20
13
Bau, M., A. Koschinsky, P. Dulski, and J. R. Hein. 1996. Comparison of the partitioningbehaviors of yttrium, rare-earth elements, and titanium between hydrogenetic marineferromanganese crusts and seawater. Geochimica et Cosmochimica Acta 60: 1709–1725.
Broecker, W. S. and T.-H. Peng. 1982. Tracers in the Sea. Palisades, New York: Lamont-Doherty Geological Observatory, Columbia University.
Bruland, K. W., E. L. Rue, and G. J. Smith. 2001. Iron and macronutrients in Californiacoastal upwelling regimes: Implications for diatom blooms. Limnology and Oceanography46: 1661–1674.
Burns, R. G. and V. M. Burns. 1977. Mineralogy. In: Marine Manganese Deposits. Glasby, G.P. (ed.), 185–248. Amsterdam: Elsevier.
Cook, H. E., P. D. Johnson, J. C. Matti, and I. Zemmels. 1975. Methods of samplepreparation and X-ray data analysis (X-ray mineralogy laboratory, Deep Sea DrillingProject, University of California Riverside). In Initial Reports of the Deep-Sea DrillingProject 28: 999–1007.
Craig, J. D., J. E. Andrews, and M. A. Meylan. 1982. Ferromanganese Deposits in theHawaiian Archipelago. Marine Geology 45: 127–157.
Cronan, D. S. 1977. Deep-sea nodules: distribution and geochemistry. In: Marine ManganeseDeposits. Glasby, G. P. (ed.), 11–44. Amsterdam: Elsevier.
———. 1997. Some controls on the geochemical variability of manganese nodules with parti-cular reference to the tropical South Pacific. In: Manganese Mineralization: Geochemistryand mineralogy of terrestrial and marine deposits, Geological Society Special Publication119. Nicholson, K., Hein, J. R., Buhn, J. R. and Dasgupta, S. (eds.), 139–151. Bath,U.K.: The Geological Society.
De Carlo, E. H. 1991. Paleoceanographic implications of rare earth element variability withina Fe-Mn crust from the central Pacific Ocean. Marine Geology 98: 449–467.
Elderfield, H., C. J. Hawkesworth, M. J. Greaves, and S. E. Calvert. 1981. Rare earth elementgeochemistry of oceanic ferromanganese nodules and associated sediments. Geochimica etCosmochimica Acta 45: 513–528.
Frank, M., R. K. O’Nions, J. R. Hein, and V. K. Banakar. 1999. 60Ma records of majorelements and Pb-Nd isotopes from hydrogenous ferromanganese crusts: Reconstructionof seawater paleochemistry. Geochimica Cosmochimica Acta 63: 1689–1708.
Gaspar, L. 2001. Quımica e mineralogia de depositos de ferromanganes da montanha submar-ina Lion, ZEE da Madeira, Portugal. Paper read at Actas do VI Congresso de Geoquı-mica dos Paıses de Lıngua Portuguesa=XII Semana da Geoquımica, at Faro, Portugal,April 9–12.
Geldmacher, J., K.Hoernle, A. Klugel, P. V. D. Bogaard, F.Wombacher, and B. Berning. 2006.Origin and geochemical evolution of the Madeira-Tore Rise (eastern North Atlantic).Journal of Geophysical Research 111: B09206, doi: 10.1029=2005JB003931.
Goldberg, E. D., M. Koide, R. A. Schmitt, and R. H. Smith. 1963. Rare earth distribution inthe marine environment. Journal of Geophysical Research 68: 4209–4217.
Halbach, P., E. Rehm, and V. Marchig. 1979. Distribution of Si, Mn, Ge, Ni, Cu, Co, Zn, Pb,Mg, and Ca in Grain-Size Fractions of Sediment Samples from a Manganese NoduleField in the Central Pacific Ocean. Marine Geology 29: 237–252.
Halbach, P. 1986. Process controlling the heavy metal distribution in Pacific ferromanganesenodules and crusts. Geologische Rundschau 75: 235–247.
Halbach, P., F. T. Manhein, and P. Otten. 1982. Co-rich ferromanganese deposits in themarginal seamount regions of the central Pacific basin: results of the Midpac’81. Erzme-tall 35: 447–453.
Halbach, P., C. Kriete, B. Prause, and D. Puteanus. 1989a. Mechanisms to explain the plati-num concentration in ferromanganese seamount crusts. Chemical Geology 76: 95–106.
Halbach, P. E., C-D. Sattler, F. Teichmann, and M. Washner. 1989b. Cobalt-rich andplatinum-bearing manganese crust deposits on seamounts: nature, formation, and metalpotential. Marine Mining 8: 23–39.
Deep-sea Fe-Mn Crusts from the Atlantic Ocean 67
Dow
nloa
ded
by [
USG
S L
ibra
ries
Pro
gram
] at
08:
48 2
1 Ja
nuar
y 20
13
Halbach, P., B. Prause, K. Koch, and M. Westholt. 1990. Platinum and Palladium in Co-RichFerromanganese Crust Deposits. Marine Mining 9: 117–126.
Halbach, P. and Scientific Crew. 1993. Marine geological and geochemical investigations ofsediments, precipitates and hard rocks from three seamounts in the NE Atlantic to ident-ify element fluxes. Technical cruise report of the RV Sonne cruise SO 83 – MARFLUX 4;BMFT project 03R424A6 and MAST contract 0022C. Berlin, Germany: Freie UniversitatBerlin.
Hein, J. R. 2004. Cobalt-rich ferromanganese crusts: Global distribution, composition, originand research activities. Minerals other than Polymetallic nodules of the InternationalSeabed Area. Proceedings of a Workshop held on 26–30 June 2000, 188–256. Kingston,Jamaica: International Seabed Authority.
Hein, J. R., T. A. Conrad, and R. E. Dunham. 2009. Seamount Characteristics and Mine-SiteModel Applied to Exploration- and Mining-Lease-Block Selection for Cobalt-RichFerromanganese Crusts. Marine Georesources and Geotechnology 27: 160–176. doi:10.1080=10641190902852485.
Hein, J. R., T. A. Conrad, and H. Staudigel. 2010. Seamount Mineral Deposits, a source ofrare metals for high-technology industries. Oceanography 23(1): 184–189.
Hein, J. R., A. Koschinsky, M. Bau, F. T. Manheim, J.-K. Kang, and L. Roberts. 2000.Cobalt-Rich ferromanganese crusts in the Pacific. In: Handbook of Marine MineralDeposits. Cronan, D. S. (ed.), 239–279. Boca Raton, Florida: CRC Press.
Hein, J. R., A. Koschinsky, P. Halbach, F. T. Manheim, M. Bau, J-K. Kang, and N. Lubick.1997. Iron and manganese oxide mineralization in the Pacific. In: Manganese Mineraliza-tion: Geochemistry and mineralogy of terrestrial and marine deposits, Geological SocietySpecial Publication 119. Nicholson, K., Hein, J. R., Buhn, J. R. and Dasgupta, S. (eds.),123–138. Bath, U.K.: The Geological Society.
Hein, J. R., A. Koschinsky, and A. N. Halliday. 2003. Global occurrence of tellurium-richferromanganese crusts and a model for the enrichment of tellurium. Geochimica etCosmochimica Acta 67(6): 1117–1127.
Hein, J. R., A. Koschinsky, and B. McIntyre. 2005. The global enrichment of platinum groupelements in marine ferromanganese crusts. Extended Abstracts, 10th InternationalPlatinum Symposion. Tormanen, T. O. and Alapeti, T. T. (eds.), 7–11 August 2005, Oulu,Finland, 98–101.
Hein, J. R., W. C. Schwab, and A. S. Davis. 1988. Co and Pt-rich ferromanganese crusts andassociated substrate rocks from the Marshall Islands. Marine Geology 78: 255–283.
Hein, J. R., H.-W. Yeh, S. H. Gunn,W. V. Sliter, L.M. Benninger, and C.-H.Wang. 1993. Twomajor Cenozoic episodes of phosphogenesis recorded in Equatorial Pacific seamountdeposits. Paleoceanography 8(2): 293–311.
Hodge, V. F., M. Stallard, M. Koide, and E. D. Goldberg. 1985. Platinum and the platinumanomaly in the marine environment. Earth and Planetary Science Letters 72: 158–162.
Hoernle, K. and Scientific Party. 2003. Cruise Report M51=1. In: Ostatlantik – Mittelmeer –Schwarzes Meer, Cruise No. 51, 12 September–28 December 2001, Meteor-Berichte 03-1.C. Hemleben, K. Hoernle, B. B. Jorgensen and W. Roether (eds.). Hamburg, Germany:University of Hamburg.
Intergovernmental Oceanographic Commission (IOC). 2002. Geological Processes in theMediterranean and Black Seas and North East Atlantic. Preliminary results of investiga-tions during the TTR-11 cruise of RV Professor Logachev, July-September, 2001. IOCTechnical Series, N. H. Kenyon, M. K. Ivanov, A. M. Akhmetzhanov and G. G.Akhmanov (eds.), Paris, France: UNESCO.
Jones, E. J. W., M. K. BouDagher-Fadel, and M. F. Thirlwall. 2002. An investigation of sea-mount phosphorites in the Eastern Equatorial Atlantic. Marine Geology 183: 143–162.
Klovan, J. E. and J. Imbrie. 1971. An algorithm and FORTRAN-IV program for large-scale Q-mode factor analysis and calculation of factor scores. Mathematical Geology 3:61–77.
68 S. B. Muinos et al.
Dow
nloa
ded
by [
USG
S L
ibra
ries
Pro
gram
] at
08:
48 2
1 Ja
nuar
y 20
13
Koschinsky, A. and P. Halbach. 1995. Sequential leaching of marine ferromanganese precipi-tates: Genetic implications. Geochimica et Cosmochimica Acta 59: 5113–5132.
Koschinsky, A., P. Halbach, J. R. Hein, and A. Mangini. 1996. Ferromanganese crusts as indi-cators for paleoceanographic events in the NEAtlantic.Geologische Rundschau 85: 567–576.
Koschinsky, A., M. van Gerven, and P. Halbach. 1995. First investigations of massiveferromanganese crusts in the NE Atlantic in comparison with hydrogenetic Pacificoccurrences. Marine Georesources and Geotechnology 13: 375–391.
Koschinsky, A., A. Stascheit, M. Bau, and P. Halbach. 1997. Effects of phosphatization onthe geochemical and mineralogical composition of marine ferromanganese crusts. Geochi-mica et Cosmochimica Acta 61(19): 4079–4094.
Kuhn, T., M. Bau, N. Blum, and P. Halbach. 1998. Origin of negative Ce anomalies in mixedhydrothermal-hydrogenetic Fe-Mn crusts from the Central Indian Ridge. Earth andPlanetary Science Letters 163: 207–220.
Madelain, F. 1970. Influence de la topographie du fond sur l’ecoulement Mediterraneen entrele Detroit de Gibraltar et le cap Saint-Vincent. Cahiers Oceanographiques 22: 43–61.
Mangini, A., P. Halbach, D. Puteanus, and M. Segl. 1987. Chemistry and Growth of CentralPacific Mn-Crusts and Their Economic Importance. In: Marine Minerals, Advances inResearch and Resource Assessment. Teleki, P. G., Dobson, M. R., Moore, J. R. andStackelberg, U. V. (eds.), 205–220. Dordrecht Germany: D Reidel Publishing Company.
Merle, R. 2006. Age and origin of Tore-Madeira Rise: beginning of Atlantic Ocean spreadingor hotspot track. Petrology, geochemistry, U-Pb geochronology and Pb-Sr-Hf isotopes.PhD Thesis. University of Nantes, Nantes, (in French).
Merle, R., U. Scharer, J. Girardeau, and G. Cornen. 2006. Cretaceous seamounts alongthe continent-ocean transition of the Iberian margin: U-Pb ages and Pb-Sr-Hf isotopes.Geochimica et Cosmochimica Acta 70(19): 4950–4976.
Moffet, J. W. 1994. A radiotracer study of cerium and manganese uptake onto suspendedparticles in Chesapeake Bay. Geochimica et Cosmochimica Acta 58: 695–703.
Muinos, S. B. 2005. Contribuicao da analise multivariada para o estudo de crostas submarinasde ferro e manganes do Atlantico Nordeste. Master, Instituto Superior Tecnico, Lisbon,Portugal: Universidade Tecnica de Lisboa, (in Portuguese).
Muinos, S. B., L. Gaspar, J. H. Monteiro, R. Salgueiro, J. F. Ramos, V. H. Magalhaes, and T.Rodrigues. 2002. Ferromanganese deposits from the Nameless Seamount: Preliminaryresults. IOC Workshop Report 183: 27–30.
Nath, B. N., V. Balaram,M. Sudhakar, and E.W. L. Plueger. 1992. Rare-earth element geochem-istry of ferromanganese deposits from the Indian Ocean. Marine Chemistry 38: 185–208.
Pereira, H. G., S. Renca, and J. Saraiva. 2003. A case study on geochemical anomalyidentification through principal components analysis supplementary projection. AppliedGeochemistry 18: 37–44.
Sholkovitz, E. R. and D. L. Schneider. 1991. Cerium redox cycles and rare earth elements inthe Sargasso Sea. Geochimica et Cosmochimica Acta 55: 2737–2743.
Taylor, S. R. and S. M. McLennan. 1985. The Continental Crust: Its Composition andEvolution. Oxford: Blackwell.
Usui, A., T. A. Mellin, M. Nohara, and M. Yuasa. 1989. Structural stability of marine 10Amanganates from the Ogasawara (Bonin) arc: Implication for low-temperature hydro-thermal activity. Marine Geology 86: 41–56.
van Andel, T. H. 1975. Mesozoic-Cenozoic calcite compensation depth and the global distri-bution of calcareous sediments. Earth and Planetary Science Letters 21: 455–480.
Varentsov, I. M., V. A. Drits, A. I. Gorshkov, A. V. Sivtsov, and B. A. Sakharov. 1991.Mn-Fe oxyhydroxide crusts from the Krylov seamount (eastern Atlantic): Mineralogy,Geochemistry and Genesis. Marine Geology 96: 53–70.
Verlaan, P. A., D. S. Cronan, and C. L. Morgan. 2004. A comparative analysis of composi-tional variations in and between marine ferromanganese nodules and crusts in the SouthPacific and their environmental controls. Progress in Oceanography 63: 125–158.
Deep-sea Fe-Mn Crusts from the Atlantic Ocean 69
Dow
nloa
ded
by [
USG
S L
ibra
ries
Pro
gram
] at
08:
48 2
1 Ja
nuar
y 20
13
von Stackelberg, U., H. Kuzendorf, V. Marchig, and R. Gwodz. 1984. Growth history of alarge ferromanganese crust from the equatorial North Pacific nodule belt. GeologischesJahrbuch A75: 213–235.
Vonderhaar, D. L., G. M. McMurty, D. Garbe-Schonberg, D. Stuben, and B. K. Esser. 2000.Platinum and other related element enrichment in Pacific ferromanganese crust deposits.In: Marine authigenesis: From global to microbial, SEPM Special Publication 66. Glenn,C. R., Prevot-Lucas, L. and Lucas, J. (eds.), 287–308. Tulsa, Oklahoma: SEPM.
Wen, X., E. H. De Carlo, and Y. H. Li. 1997. Interelement relationships in ferromanganesecrusts from the central Pacific ocean: their implications for crust genesis. Marine Geology136: 277–297.
Zenk, W. 1970. On the temperature and salinity structure of the Mediterranean Water in theNortheast Atlantic. Deep-Sea Research 17: 627–631.
70 S. B. Muinos et al.
Dow
nloa
ded
by [
USG
S L
ibra
ries
Pro
gram
] at
08:
48 2
1 Ja
nuar
y 20
13