deeper questions: how interactive visualization empowers analysts
TRANSCRIPT

Grab some
coffee and
enjoy the
pre-show
banter before
the top of the
hour!
The Briefing Room
Deeper Questions: How Interactive Visualization Empowers Analysis
Twitter Tag: #briefr The Briefing Room
Reveal the essential characteristics of enterprise software, good and bad
Provide a forum for detailed analysis of today’s innovative technologies
Give vendors a chance to explain their product to savvy analysts
Allow audience members to pose serious questions... and get answers!
Mission
Twitter Tag: #briefr The Briefing Room
Topics
March: BI/ANALYTICS
April: BIG DATA
May: CLOUD

I 💚 ANALYTICS!
Twitter Tag: #briefr The Briefing Room
Analyst: Phil Bowermaster
With more than 25 years experience analyzing and writing about emerging technologies, Phil Bowermaster is the founder and publisher of Speculist Media and a co-founder of the World Transformed Institute. As an industry analyst, he focuses on the convergence of information and society as reflected in current developments around Big Data and the Internet of Things. Phil is also co-host of the popular Internet radio series The World Transformed, where he has interviewed some of the world’s leading technologists, futurists, scientists, and other thought leaders.

Twitter Tag: #briefr The Briefing Room
Tableau
Tableau builds software for data visualization, business intelligence and analytics
Its products include Tableau Desktop, Tableau Public, Tableau Online and Tableau Drive
Tableau 9 includes added performance features and more data connections

Twitter Tag: #briefr The Briefing Room
Guest: Ellie Fields
Ellie is the Vice President of Product Marketing at Tableau, responsible for new product launches, Tableau Public and Tableau's community. Her data geek credentials come from time served in technology and finance companies. She works with people from all over the world who are trying to tell stories with data, from journalists to hospitals to high tech companies. She’s seen a lot of ugly data, beautiful data, and downright mean data. She’s a passionate believer that data used well can inform, excite and create value. Prior to Tableau, Ellie worked at Microsoft and in late-stage venture capital. She has an engineering degree from Rice University and an M.B.A. from The Stanford Graduate School of Business.
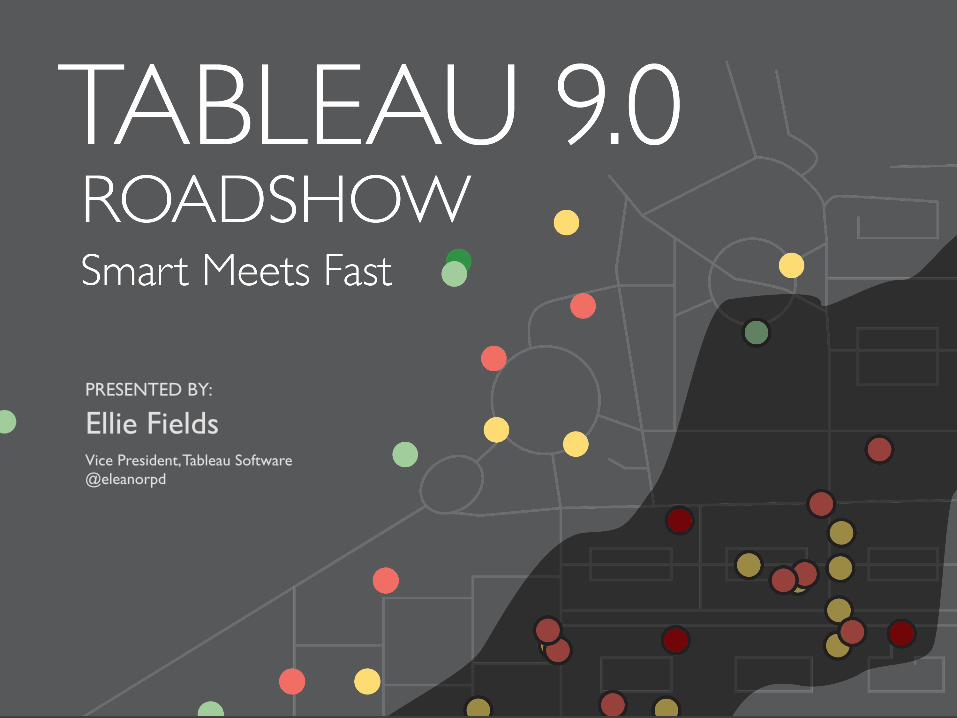
PRESENTED BY:
Ellie Fields Vice President, Tableau Software @eleanorpd
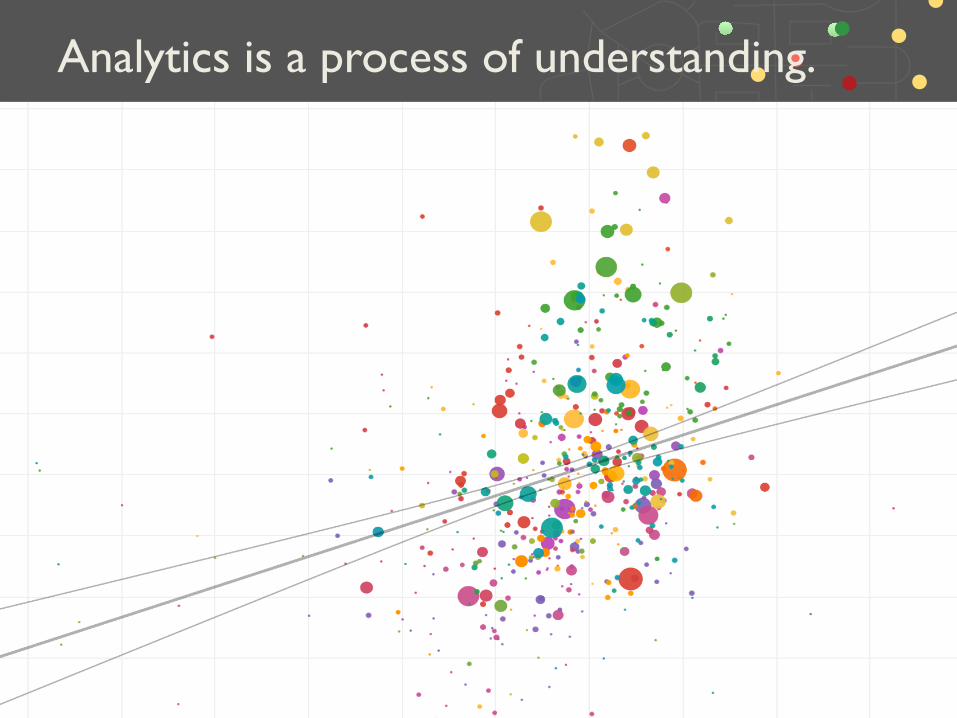
Analytics is the process of understanding.
Analytics is a process of understanding.

Analytics should feel like this.

But more often, it feels like this.

And that’s a problem.

Mihaly Csikszentmihalyi:
Flow, the secret to happiness
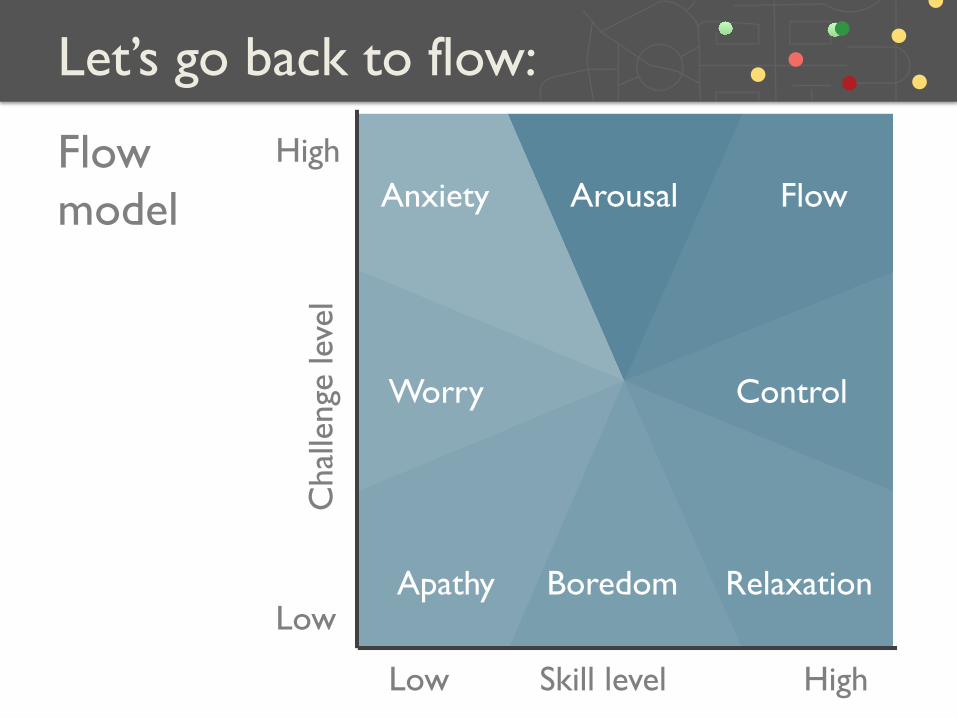
Let’s go back to flow:
Flow model
High
Low
Low Skill level High
Cha
lleng
e le
vel
Anxiety Arousal Flow
Apathy Boredom Relaxation
Worry Control
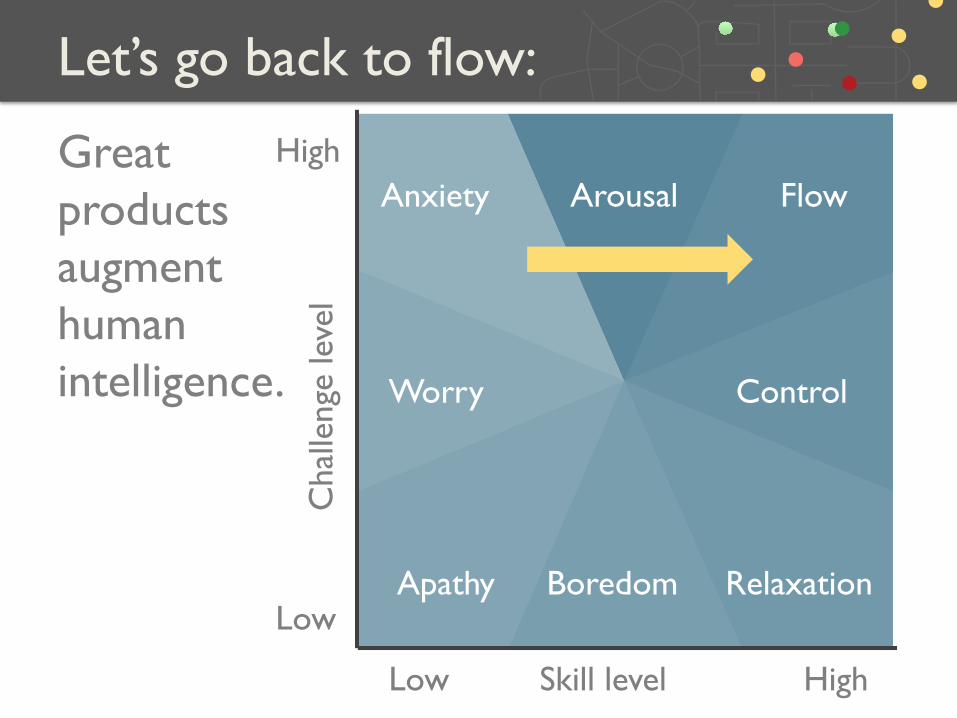
Let’s go back to flow:
Great products augment human intelligence.
High
Low
Low Skill level High
Cha
lleng
e le
vel
Anxiety Arousal Flow
Apathy Boredom Relaxation
Worry Control
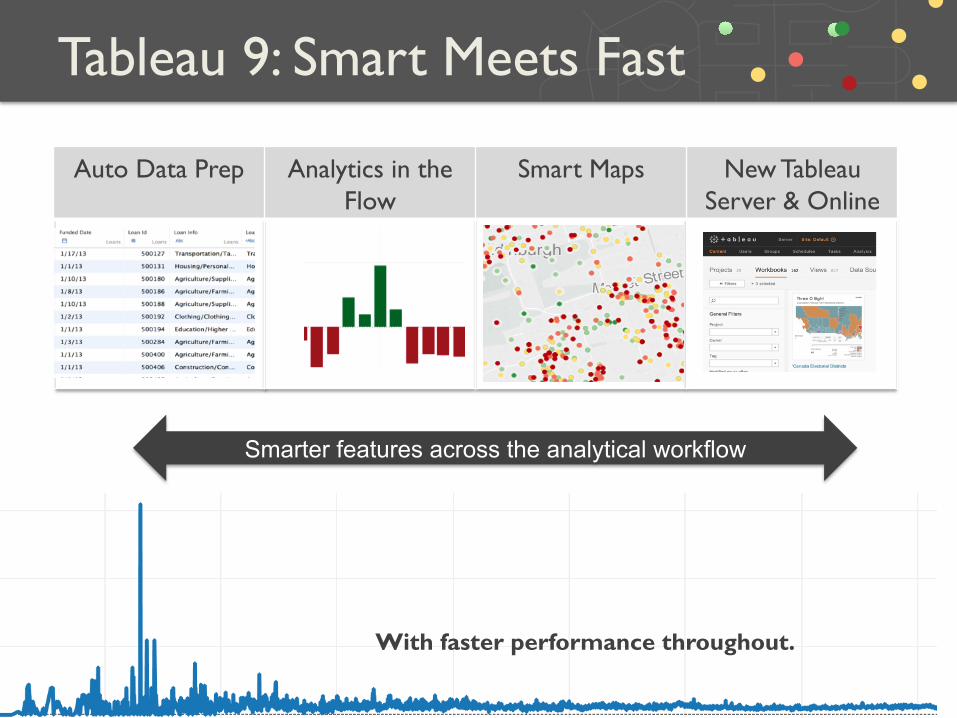
Tableau 9: Smart Meets Fast
Auto Data Prep Analytics in the Flow
Smart Maps New Tableau Server & Online
Smarter features across the analytical workflow
With faster performance throughout.

DEMO
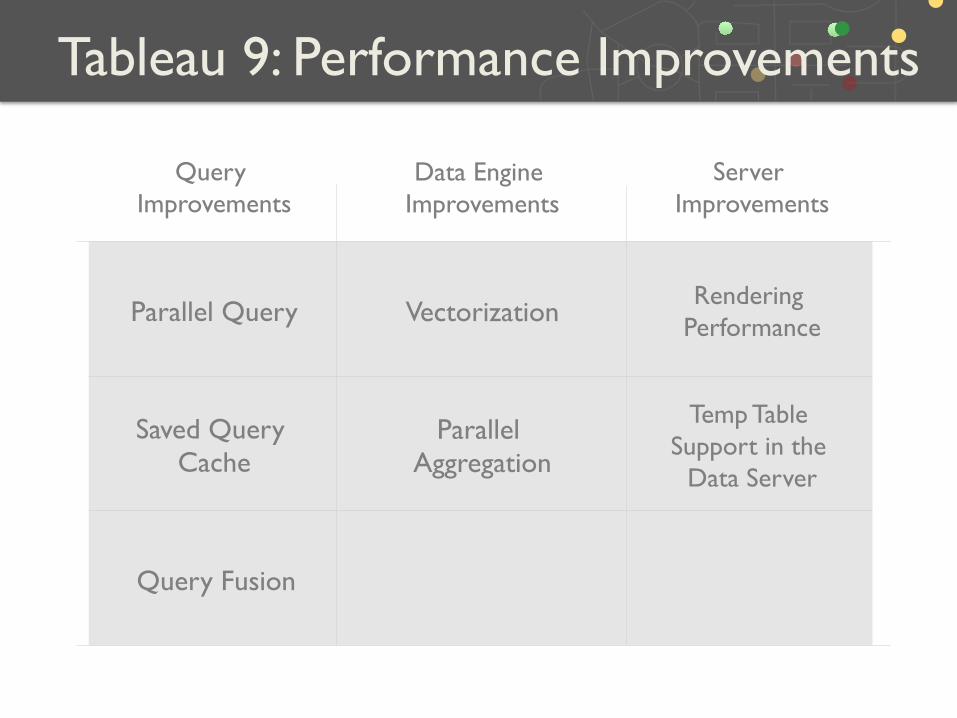
Tableau 9: Performance Improvements
Query Improvements
Data Engine Improvements
Server Improvements
Parallel Query Vectorization Rendering Performance
Saved Query Cache
Parallel Aggregation
Temp Table Support in the
Data Server
Query Fusion
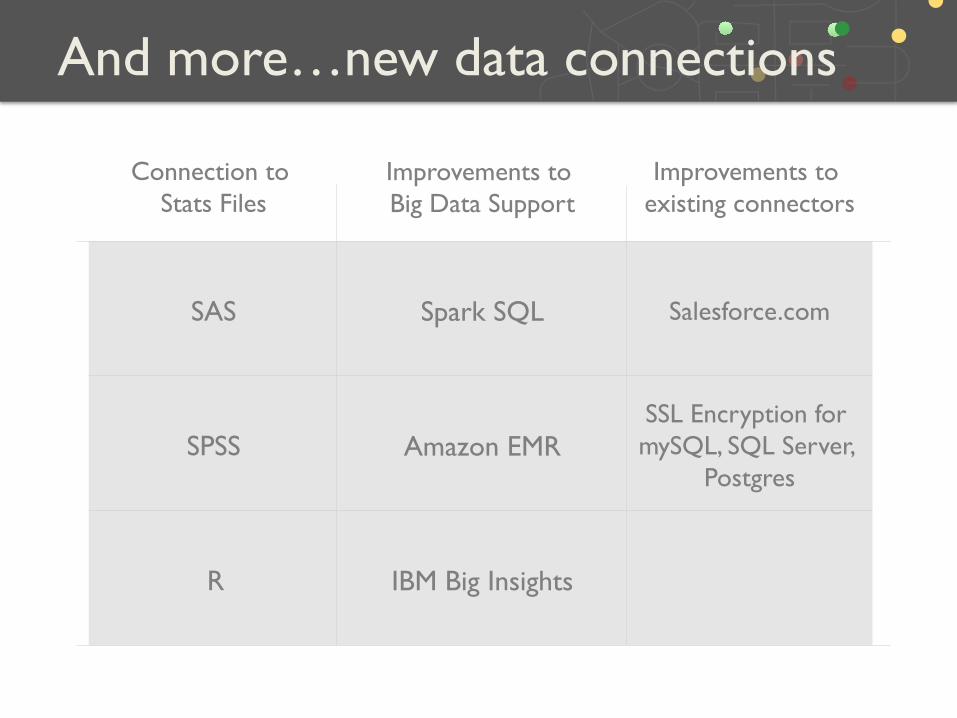
And more…new data connections
Connection to Stats Files
Improvements to Big Data Support
Improvements to existing connectors
SAS Spark SQL Salesforce.com
SPSS Amazon EMR SSL Encryption for mySQL, SQL Server,
Postgres
R IBM Big Insights

Twitter Tag: #briefr The Briefing Room
Perceptions & Questions
Analyst: Phil Bowermaster
Thinking Like a Human
The story of analy5cs revised
The Story So Far…
• Data Warehousing • Business Intelligence • Analy5cs
– “Predic5ve” – “Advanced”
• Big Data
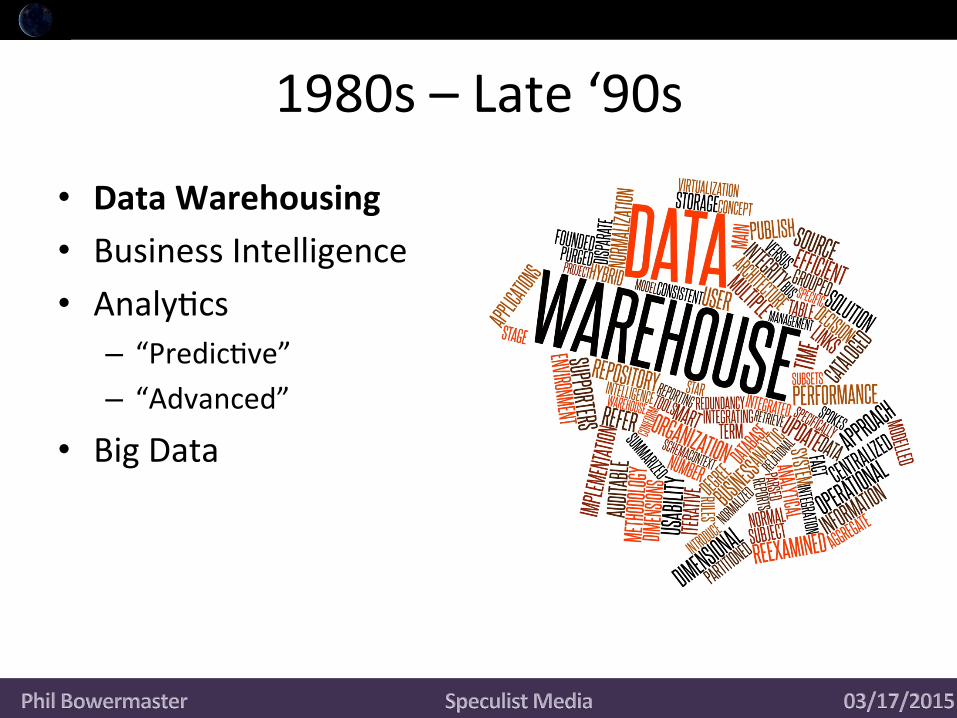
1980s – Late ‘90s
• Data Warehousing • Business Intelligence • Analy5cs
– “Predic5ve” – “Advanced”
• Big Data
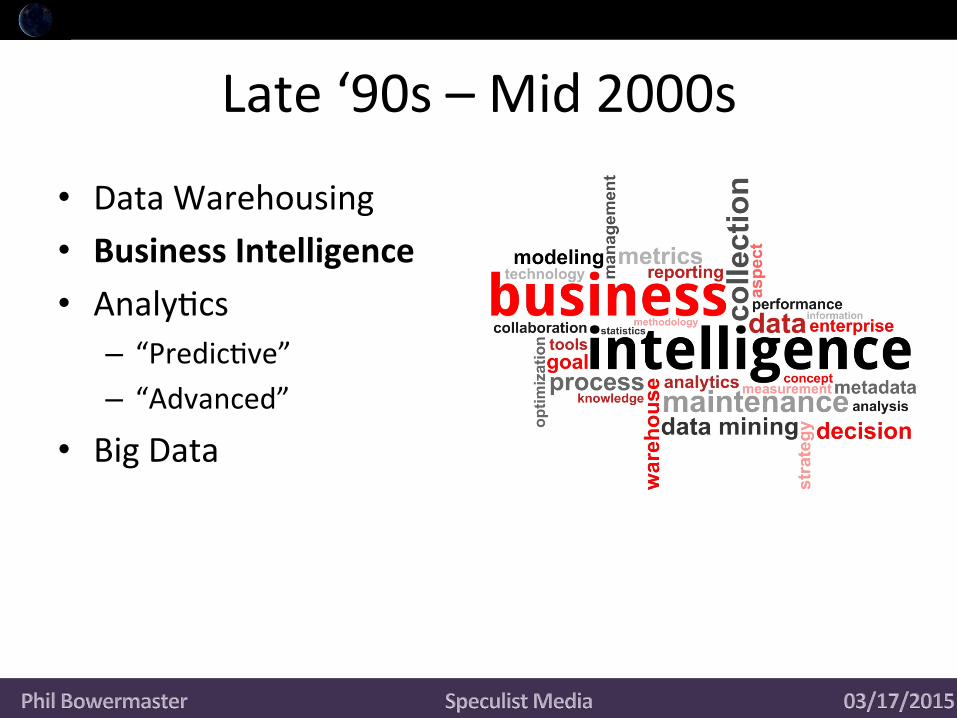
Late ‘90s – Mid 2000s
• Data Warehousing • Business Intelligence • Analy5cs
– “Predic5ve” – “Advanced”
• Big Data
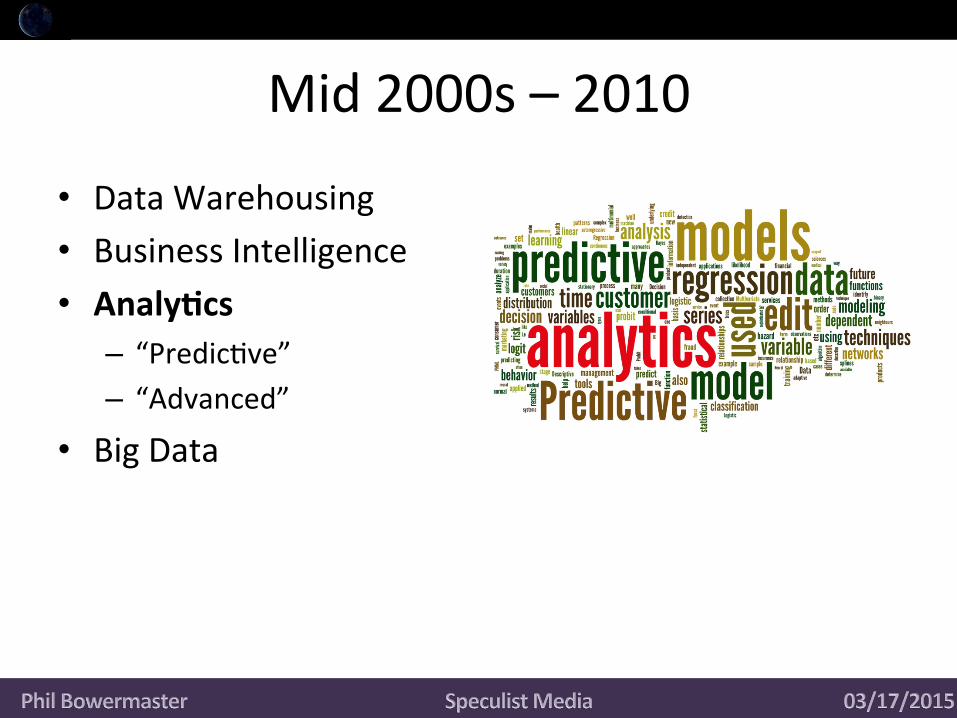
Mid 2000s – 2010
• Data Warehousing • Business Intelligence • Analy5cs
– “Predic5ve” – “Advanced”
• Big Data
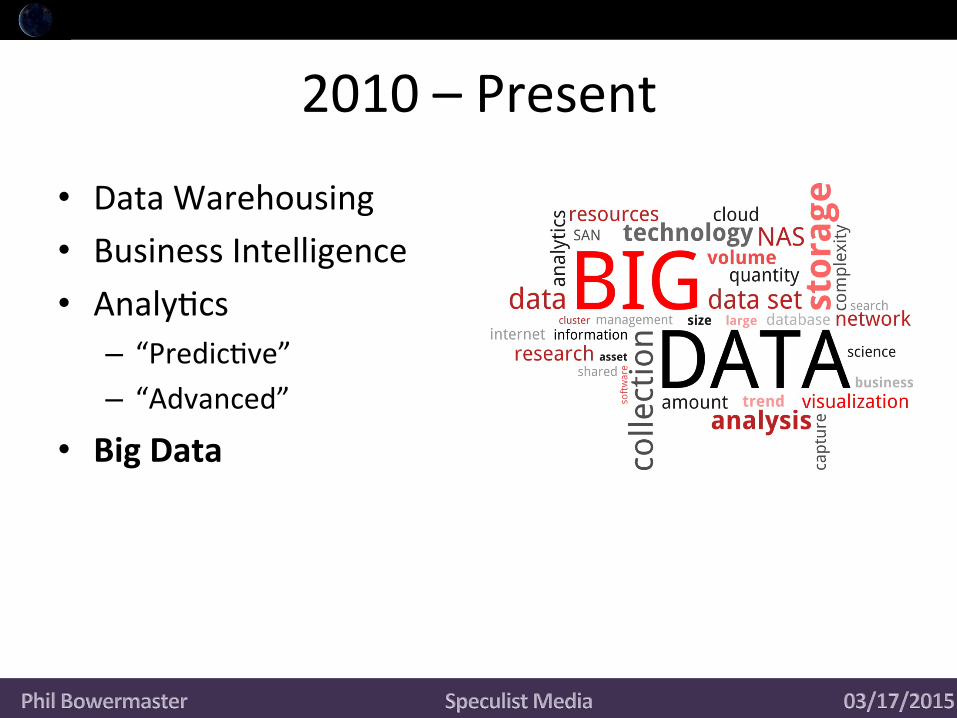
2010 – Present
• Data Warehousing • Business Intelligence • Analy5cs
– “Predic5ve” – “Advanced”
• Big Data
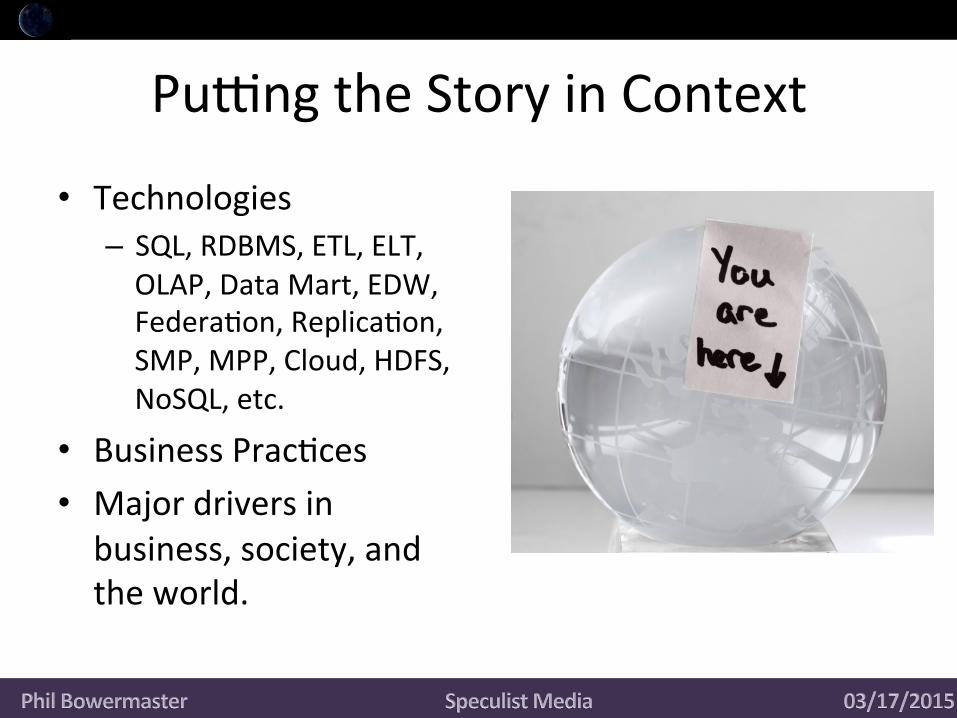
PuLng the Story in Context
• Technologies – SQL, RDBMS, ETL, ELT, OLAP, Data Mart, EDW, Federa5on, Replica5on, SMP, MPP, Cloud, HDFS, NoSQL, etc.
• Business Prac5ces • Major drivers in business, society, and the world.
One Problem with that Story…
• It’s (arguably) upside down
• Run it backward: – Technology driven by evolving business
– Business driven by external drivers
• So what are these drivers?
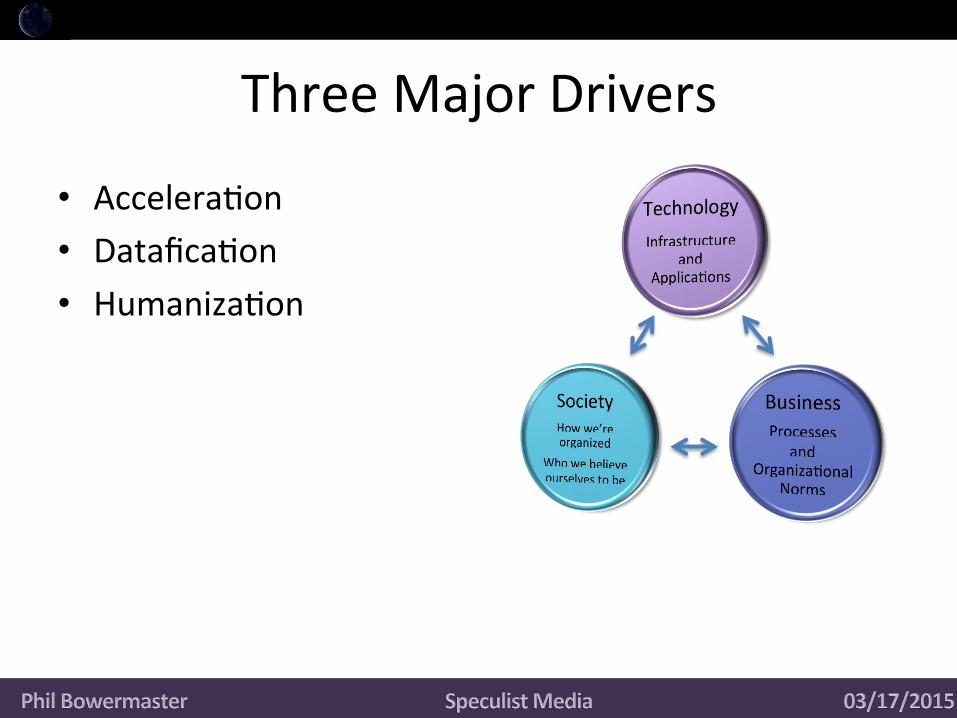
Three Major Drivers
• Accelera5on • Datafica5on • Humaniza5on
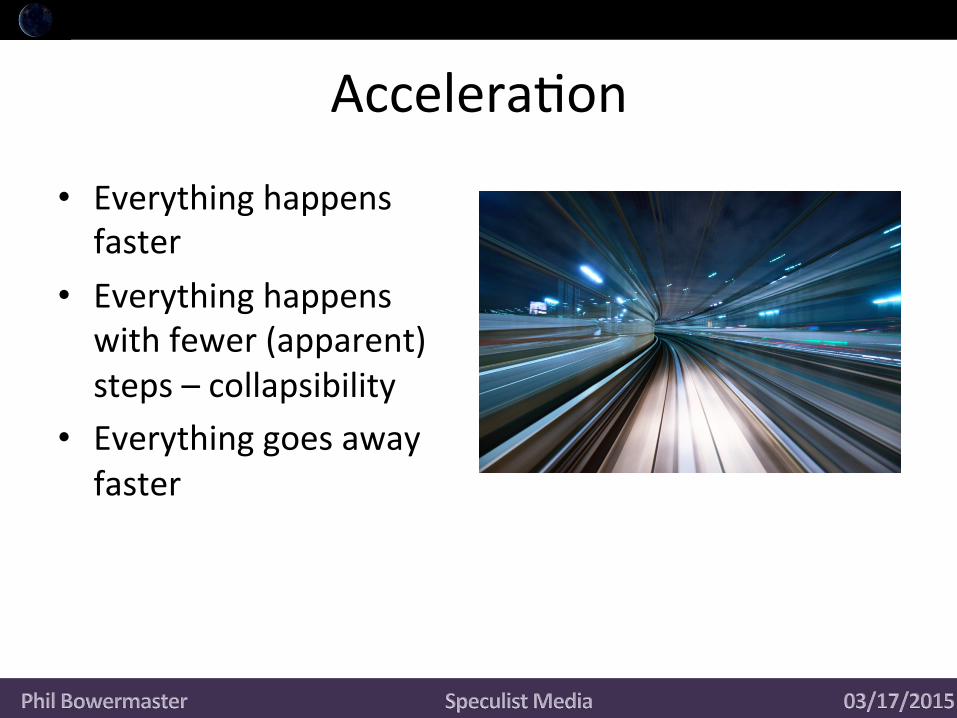
Accelera5on
• Everything happens faster
• Everything happens with fewer (apparent) steps – collapsibility
• Everything goes away faster
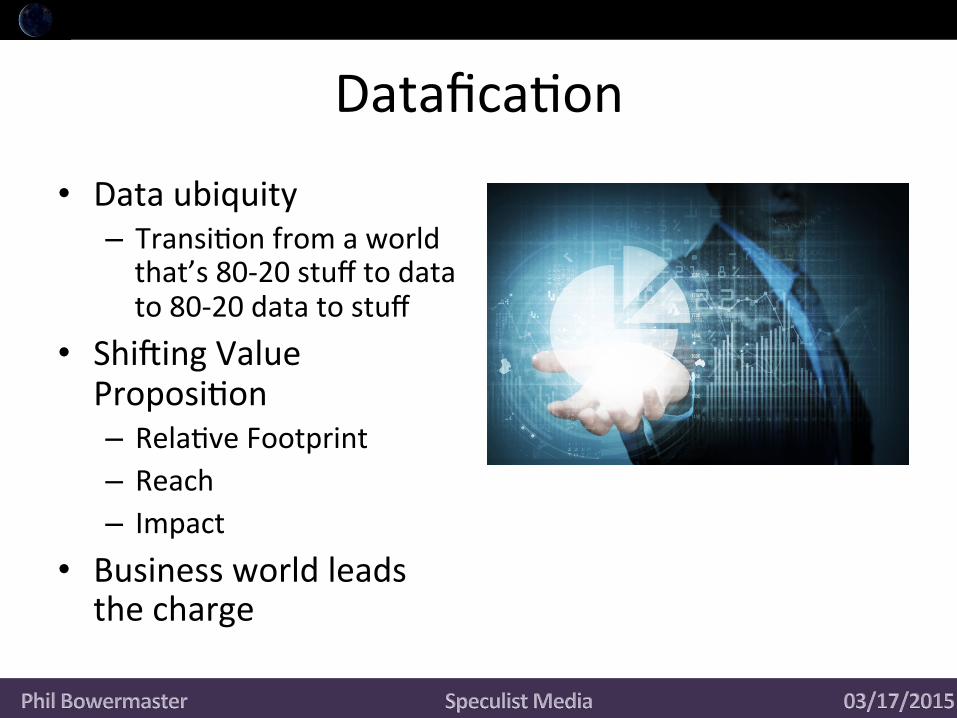
Datafica5on
• Data ubiquity – Transi5on from a world that’s 80-‐20 stuff to data to 80-‐20 data to stuff
• Shiding Value Proposi5on – Rela5ve Footprint – Reach – Impact
• Business world leads the charge
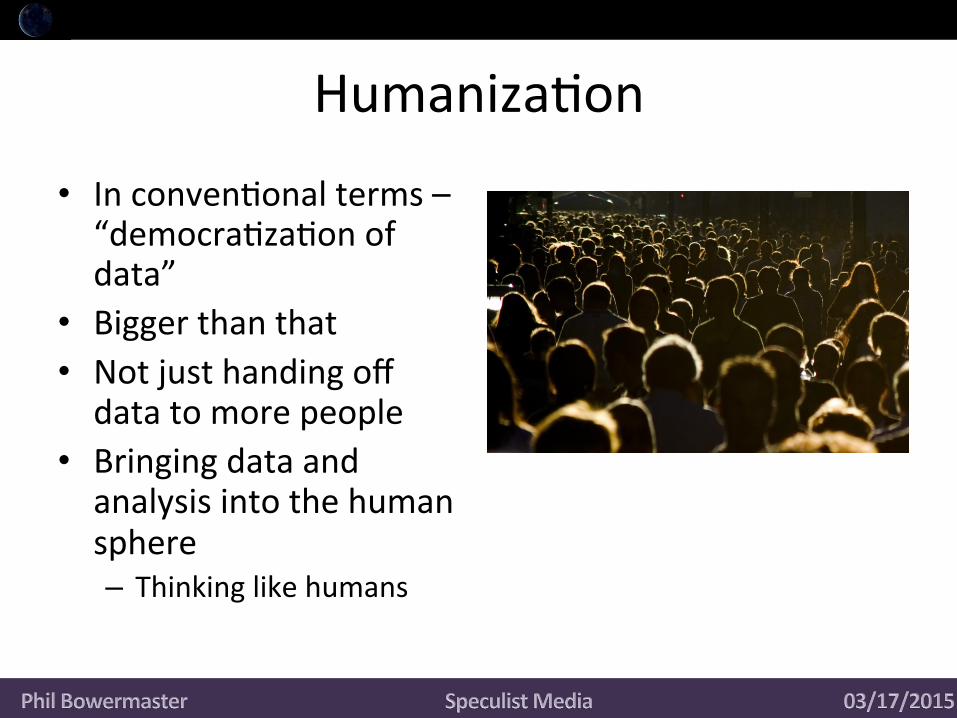
Humaniza5on
• In conven5onal terms – “democra5za5on of data”
• Bigger than that • Not just handing off data to more people
• Bringing data and analysis into the human sphere – Thinking like humans
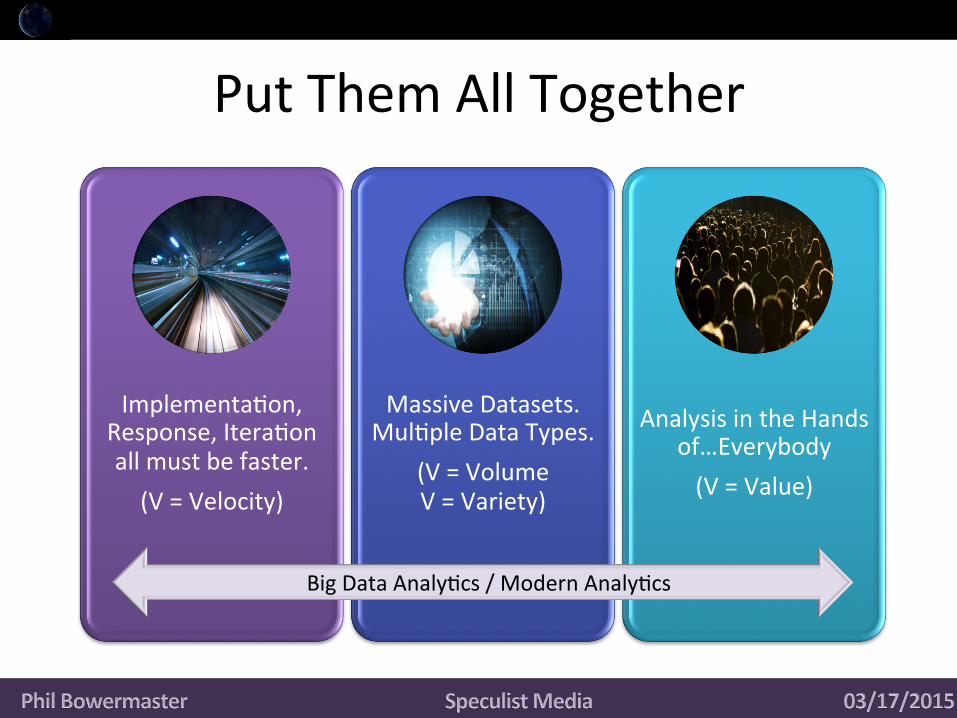
Put Them All Together
Implementa5on, Response, Itera5on all must be faster. (V = Velocity)
Massive Datasets. Mul5ple Data Types.
(V = Volume V = Variety)
Analysis in the Hands of…Everybody (V = Value)
Big Data Analy5cs / Modern Analy5cs
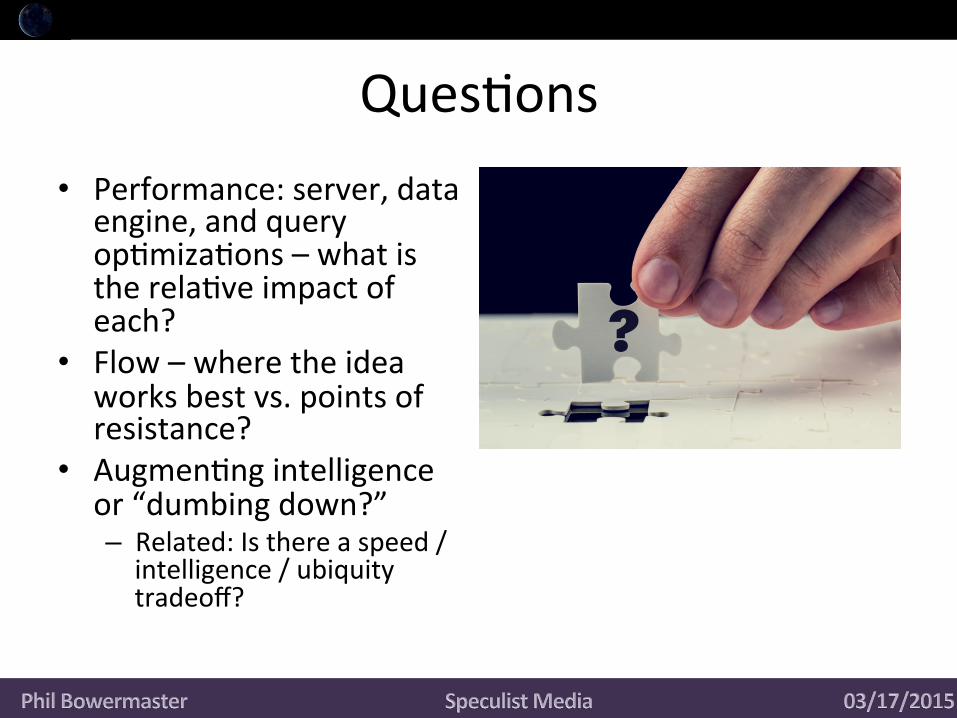
Ques5ons • Performance: server, data
engine, and query op5miza5ons – what is the rela5ve impact of each?
• Flow – where the idea works best vs. points of resistance?
• Augmen5ng intelligence or “dumbing down?” – Related: Is there a speed / intelligence / ubiquity tradeoff?

Twitter Tag: #briefr The Briefing Room
Twitter Tag: #briefr The Briefing Room
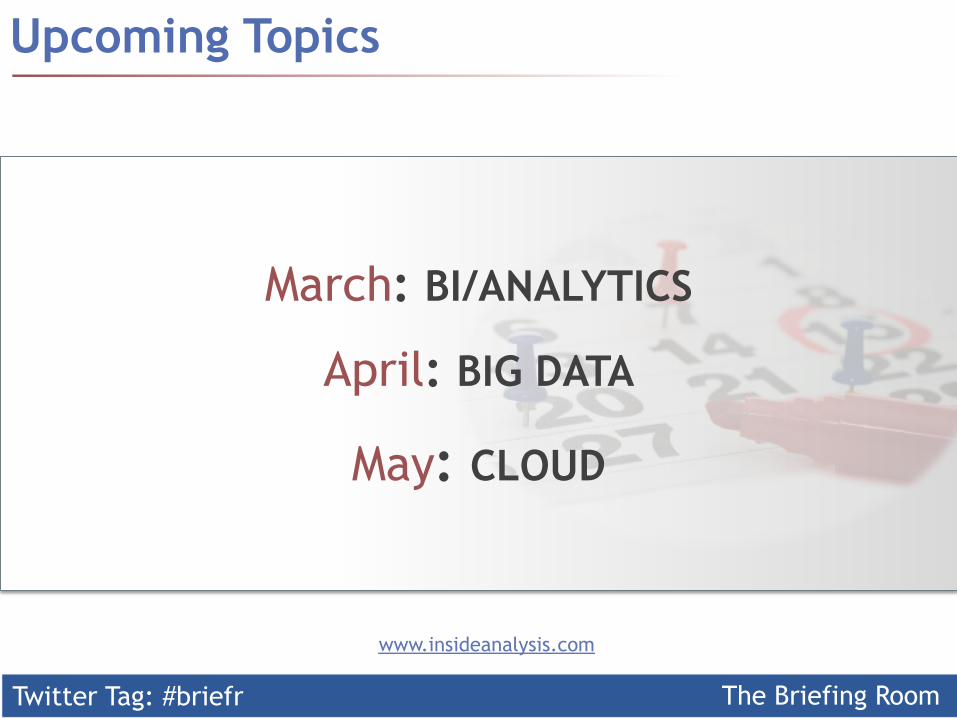
Upcoming Topics
www.insideanalysis.com
March: BI/ANALYTICS
April: BIG DATA
May: CLOUD

Twitter Tag: #briefr The Briefing Room
THANK YOU for your
ATTENTION!
Some images provided courtesy of Wikimedia Commons