defence data - eda.europa.eu
TRANSCRIPT

Defence Data2013

More information on the European Defence Agency is available at: www.eda.europa.eu
ISBN: 978-92-95075-27-6ISSN: 1831-9513doi: 10.2836/552746
© European Defence Agency, 2015For reproduction or use of this material, permission must be sought directly from the copyright holder.
Responsible editor: Eric Platteau
For further information on Defence Data, please contact project officer Silvija Guzelytė (Tel: +32 (0)2 504 2882 or [email protected]).
Printed in BelgiumPhoto credits front cover © polygraphus-Fotolia

DE
FEN
CE
DAT
A 2
013
1
I. INTRODUCTION
The European Defence Agency (EDA) collects defence data on an annual basis. The Ministries of Defence of the Agency’s 27 Member States (MS)¹ provide the data. EDA acts as the custodian of the data and publishes the aggregated figures in this booklet.
The data is broken down, based on the list of indicators approved by the Agency’s Ministerial Steering Board. The indicators are grouped under four sections, represented in the headings of the booklet:
General: macro-economic data to show how defence budgets relate to GDP and overall government spending.
Reform: major categories of defence budget spending - personnel; investment, including research and development (R&D)/research and technology (R&T); operation and maintenance (O&M) and others - to show what defence budgets are spent on; and personnel numbers to show the ratio between the military and civilians employed in defence.
European collaboration: for defence equipment procurement and R&T, to show to what extent the EDA MS are investing together.
Deployability: military deployed in crisis management operations to show the ratio between deployments
and total military personnel; and costs of deployed operations.
In November 2007, the Agency’s Ministerial Steering Board approved four collective benchmarks for investment:
Equipment procurement (including R&D/R&T): 20% of the total defence spending.
European collaborative equipment procurement: 35% of the total equipment spending.
Defence R&T: 2% of the total defence spending.
European collaborative defence R&T: 20% of the total defence R&T spending.
These benchmarks are collective: they apply to the total sum spent by all EDA MS together.
They are voluntary: turning them into national targets is optional.
There are no timelines for realising these benchmarks.
The final section of the booklet provides the results of the collective benchmarks.
The definitions used for data gathering and some general caveats are listed at the end of the booklet.
¹ All EU Member States, except Denmark.

DE
FEN
CE
DAT
A 2
013
2
II. EDA MEMBER STATES’ AGGREGATED DEFENCE DATA 2013
Europe’s defence expenditure decreases further
2013 was no exception to the recent years’ trend across EDA Member States to cut defence spending. Despite the fact that EDA increased from 26 to 27 Member States in 2013, the total defence expenditure of its Member States decreased by EUR 1.7 billion or 0.9%, compared to 2012, to EUR 186 billion. In real terms², the total defence expenditure has been declining since 2006, dropping by over EUR 32 billion or about 15% from 2006 to 2013. Both as a share of GDP and as a share of the total government spending, defence expenditure has decreased for the seventh year in a row to its lowest value since 2006, 1.45% and 2.97%, respectively.
Operation and maintenance and R&D/R&T expenditure increase slightly
In terms of the distribution of defence expenditure, there were some shifts in 2013. Personnel-related expenditure decreased by over 4%, from EUR 95.7 billion in 2012 to EUR 91.8 billion in 2013, and for the first time since 2006, its share in the total defence expenditure dropped below 50%, to 49.3%. Personnel expenditure expressed per person employed in defence (military and civilian) has been increasing since 2006 to reach
its highest value of EUR 51,475 in 2011, and started to decrease the year after. It decreased further from 2012 to 2013 (-2.6%), to EUR 49,836.
With a share of 25.1% - the biggest since 2006 - operation and maintenance expenditure remained the second largest component of the total defence spending in 2013, and, despite minor annual fluctuations, it appears to be on an upward trajectory. From 2012 to 2013, it increased by EUR 2 billion or 4.4%, to EUR 46.8 billion, and almost reached its highest level of EUR 46.9 billion recorded in 2007.
By contrast, defence investment, comprising equipment procurement and R&D (including R&T) expenditure, following a sharp decrease in 2011 (-10.5%), increased slightly in 2012, but decreased again in 2013 below the level it was in 2006, to EUR 37.5 billion or 20.1% of the total defence expenditure. This resulted from a decrease in one of its components - equipment procurement - which reduced by EUR 1.5 billion or 4.9%, to EUR 30 billion (16.1% of the total expenditure). The second component - defence R&D expenditure - increased slightly to EUR 7.5 billion (4% of the total expenditure), breaking a downward trend observed since 2006 (with the exception of 2010, when it
The figures refer to the total for all EDA 27 Member States1, and if not otherwise stated, they are nominal.

DE
FEN
CE
DAT
A 2
013
3
marginally increased). R&T expenditure - a subset of R&D - followed a similar path. Being on a decline since 2006 (except 2011), it increased by just over 3% from 2012 to 2013, to reach EUR 2.1 billion. In real terms, defence investment decreased by EUR 4.8 billion or 11.3% from 2006 to 2013, whereas its components - equipment procurement and R&D - decreased by EUR 1.7 billion (-5.3%) and EUR 3.1 billion (-29.1%), respectively.
Collaboration3: a sharp decrease in procurement and a marginal increase in R&T
Since 2012, it has not been possible to have a comprehensive picture of the total EDA Member States’ expenditure on collaborative (including European collaboration) defence equipment procurement and R&T projects or programmes, as several Member States were not able to provide this data. A glimpse into the partial 2012-2013 data reveals a worrisome trend, particularly for defence equipment procurement. Between 2012 and 2013, reported collaborative equipment procurement expenditure decreased by 20.7% to the lowest level since 2006
of EUR 4.75 billion. In relation to the total defence equipment procurement, collaborative expenditure accounted for 15.9%, suggesting that over 84% was spent nationally. European collaborative equipment procurement experienced an even sharper decrease of 21.6%, and in 2013, amounted to EUR 4.5 billion, accounting for 94.6% of the total collaborative equipment procurement.
The total collaborative defence R&T expenditure of the EDA Member States that provided the data also shrank, though less dramatically (-0.9%), to EUR 203 million. Its share in the total defence R&T was 9.7%, the remaining 90.3% being regarded as national expenditure. Although the reported European collaborative defence R&T expenditure increased by 21.4% between 2012 and 2013, with a total of EUR 168 million, accounting for 82.5% of the total collaborative defence R&T, it nevertheless remained record-low.
1 Data in this publication does not include Denmark which is not an EDA Member State. 2006-2012 data does not include Croatia which became the 27th EDA Member State on 1 July 2013.
2 In order to measure real growth and ensure a “real” comparison between years, inflation needs to be taken into account. Thus, data from 2006 to 2012 has been inflated to 2013 economic conditions (Source of deflator: European Commission ECFIN - based on weight of EU-28).
3 All 2012 and 2013 figures on collaboration are partial, as several Member States were not able to provide data.

DE
FEN
CE
DAT
A 2
013
4
Defence expenditure and investment per military decrease despite reduced personnel numbers
2013 saw the seventh consecutive reduction in the number of personnel working in defence (both military and civilian), caused mainly by internal restructuring processes. The total personnel decreased by almost 600,000 or 24% between 2006 and 2013, while the number of military and civilian personnel decreased by over 500,000 (-26%) and almost 80,000 (-16%), respectively, during the same period. In 2013, there was a total of 1,435,693 military and 407,245 civilian personnel in EDA Member States - a decrease of 0.9% and 3.6%, compared to 2012. A share of military in the total personnel has also been decreasing from the highest of 80.6% in 2008 and 2010 to the lowest of 77.4% in 2012. In 2013, it was 77.9%.
For the first time since 2006, defence expenditure expressed per military decreased by 0.05%, from EUR 129,878 in 2012 to EUR 129,814 in 2013. So did defence investment per military, which has been on an overall increasing trend since 2006 due to declining military personnel, rather than increasing Member States’ investment. In 2013, defence investment per military was EUR 26,122 - a 2.9% reduction on the 2012 figure of EUR 26,906.
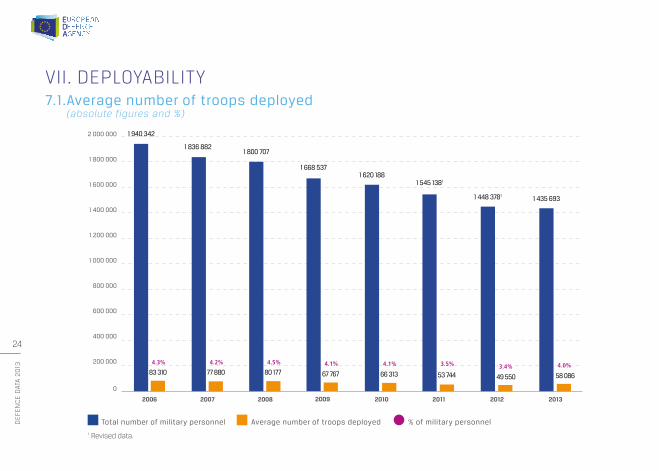
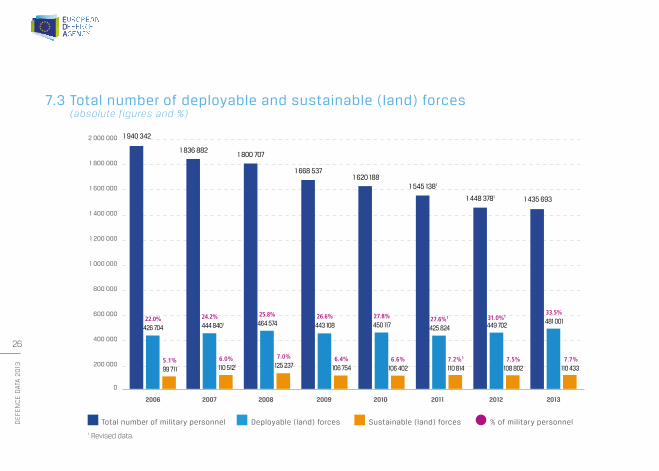
Increasing numbers of troops available for deployment and actual deployments
Between 2012 and 2013, the average number of troops deployed outside the EU territory increased for the first time since 2008, both in absolute terms (+17.2%) and as a share of military personnel (from 3.4% to 4%). EDA Member States together deployed on average 58,086 troops on a continuous basis throughout 2013, which constituted 4% of the overall strength of their military personnel. In 2013, there was also an increase in the total number of deployable (land) forces (+7%) and that of sustainable (land) forces (+1.5%). The 27 EDA Member States had in total 481,001 deployable (the highest number since 2006) and 110,433 sustainable (land) forces. The ratio between sustainable and a pool of deployable (land) forces remained stable at 1:4.4.
Meanwhile, after a five-year-long upward trend, the costs related to deployed operations4 decreased for the second time in a row, both in absolute terms - from EUR 9 billion to EUR 7.4 billion (-17.1%) - and as a share of the total expenditure - from 4.8% to 4% - between 2012 and 2013. Operations costs per military deployed decreased by 29.3% and stood at EUR 127,989 in 2013.
4 2013 figure is an estimate, as several Member States were not able to provide accurate data, therefore sound comparisons with the previous years are limited.

DE
FEN
CE
DAT
A 2
013
5
Progress recorded on one out of four collective benchmarks
In 2007, EDA Member States agreed on a set of four collective benchmarks for investment. There is no obligation in terms of timeline or adoption of these benchmarks into national targets.
Since 2012, due to incomplete collaborative data, it is no longer possible to measure progress towards two out of the four agreed benchmarks, namely European collaborative equipment procurement as a percentage of the total equipment procurement (the benchmark is 35%) and European collaborative defence R&T as a percentage of the total defence R&T (the benchmark is 20%).
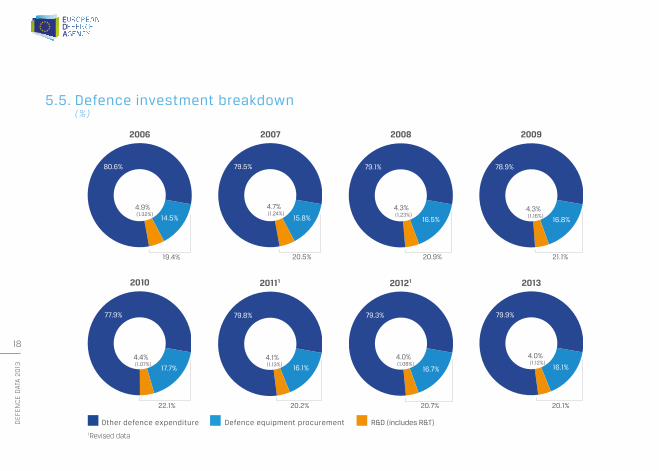
With regard to the remaining two benchmarks, the evolution of EDA Member States’ expenditure from 2006 to 2013, reveals two opposite trends. The proportion of defence equipment procurement and R&D (investment) in the total defence expenditure has been slowly but steadily increasing. It has been above the 20% benchmark since 2007, reaching a
maximum of 22.1% in 2010. Despite a subsequent decrease over the years 2011-2013, it remained slightly above the benchmark, and in 2013, amounted to 20.1%. On the contrary, there has been a steady reduction in R&T as a percentage of the total defence expenditure, except in 2011 and 2013, when it increased slightly. At 1.12% in 2013, it remained well below the 2% benchmark.

DE
FEN
CE
DAT
A 2
013
6
III. GENERAL-MACRO ECONOMIC DATA3.1. GDP, overall government expenditure and total defence expenditure
(billion EUR and % change on previous year)
GDP Overall government expenditure Defence expenditure
0
2 000
4 000
6 000
8 000
10 000
12 000
14 000
2006 2007 2008 2009 2010 2011 2012 2013
+6.7%
+4.2% +3.7% +2.3% +3.2% +0.4% +2.6% +0.8%
+1.7%
+1.5%
-5.6%
-1.3% -3.6% -0.3% -1.9% -1.5% -0.9%
+4.0%+3.0%
+2.0%
11 316
5 303
201 204 201 194 194 1901 1881 186
5 525 5 729 5 858 6 047 6 072 6 232 6 284
12 072 12 272
11 58412 046
12 41112 653 12 823
+1.3%
¹Revised data.

DE
FEN
CE
DAT
A 2
013
7
3.2. Real1 GDP, overall government expenditure and total defence expenditure (billion EUR and % change on previous year)
¹ In order to measure real gowth and ensure a "real" comparison over years, inflation needs to be taken into account. Thus, data from 2006 to 2012 has been inflated to 2013 economic conditions. Source of deflator: European Commission, DG ECFIN - based on weight of EU- 28.
0
2 000
4 000
6 000
8 000
10 000
12 000
14 000
2013
+0.6%
-1.7%186
6 284
12 823
+0.1%
2012
-0.4%
-3.2%190
6 278
12 748
+0.3%
2011
+1.6%
-3.2%
-0.9%
196
6 262
12 798
2010
+1.6%
-2.6%202
6 320
12 591
+0.8%
2009
+3.7%
-4.3%
-2.3%208
6 268
12 393
2008
+1.4%
+3.5%
-1.6%212
6 044
12 946
2007
+3.8%
+1.4%
-1.2%216
5 841
12 763
2006
218
5 760
12 291
GDP Overall government expenditure Defence expenditure

DE
FEN
CE
DAT
A 2
013
8
GDP per capita Government expenditure per capita Defence expenditure per capita
30 000
25 000
20 000
15 000
10 000
5000
0
2006
413
10 881
23 217
2007
+6.2%
+3.7%
+1.0%417
11 281
24 648
2008
+1.1%
+3.1%
-1.9%409
11 628
24 910
2009
+1.8%
-6.1%
-4.1%392
11 833
23 398
2010
+3.8%
+3.0%
-0.5%390
12 187
24 280
2011
+2.8%
+0.2%
-2.1%3821
12 212
24 959
2012
+2.3%
+1.7%
-1.2%3771
12 497
25 374
2013
+0.6%
+0.1%
-1.7%371
12 510
25 526
3.3. GDP, overall government expenditure and defence expenditure per capita (EUR and % change on previous year)
¹Revised data.

DE
FEN
CE
DAT
A 2
013
9
3.4. Defence expenditure in current and constant1 prices (billion EUR)
225
220
215
210
205
200
195
190
185
2006 2007 2008 2009 2010 2011 2012 2013
190
196
202
208
212
216
218
1882
201
204
201
194194
1902
186
1 Data from 2006 to 2012 has been inflated to 2013 economic conditions. Source of deflator: European Commission ECFIN - based on weight of EU-28. 2 Revised data.
Constant prices (2013) Current prices

DE
FEN
CE
DAT
A 2
013
10
3.5. Defence expenditure as a share of GDP and overall government expenditure (%)
4.0%
3.5%
3.0%
2.5%
2.0%
1.5%
1.0%
2006 2007 2008 2009 2010 20111 20121 2013
3.79%3.69%
3.52%
3.31%
3.20%3.13%
3.02%2.97%
1.78%1.69% 1.64%1.68% 1.61%
1.53% 1.49% 1.45%
Defence expenditure as % of overall government expenditure Defence expenditure as % of GDP
¹Revised data.

DE
FEN
CE
DAT
A 2
013
11
IV. REFORM - PERSONNEL4.1. Total number of military and civilian personnel
(absolute figures and % change on previous year)
Military personnel
2 500 000
2 000 000
1 500 000
1 000 000
500 000
0
2006 2007 2008 2009 2010 2011 2012 2013
+12.8%
-5.4%
-2.6%-6.2%
-4.1%
2 425 169
2 294 2742 234 487
2 094 8722 009 907
1 919 5651
1 870 69311 842 938
-4.5%-2.5% -1.5%
-3.6%
-3.9%-8.6%
-1.7%
-5.2%-5.7%
-5.3% -2.0% -7.3% -2.9% -4.6% -6.3% -0.9%1 940 342 1 836 882 1 800 707
1 668 537 1 620 1881 545 1381
1 448 3781
1 435 693
484 827
457 392 433 780
426 335389 719
374 427422 3152
407 245
Civilian personnel
1Revised data.2There was a significant increase in civilian personnel in 2012 due to changes in the measurement system of one Member State.

DE
FEN
CE
DAT
A 2
013
12
4.2. Total personnel (military and civilian) and personnel expenditure per person employed in defence (thousand persons and EUR)
Total personnel (military and civilian) Personnel expenditure per person
€ 47 000
€ 46 000
€ 44 000
€ 43 000
€ 42 0002006 2007 2008 2009 2010 20111 20121 2013
0
500
1 000
1 500
2 000
2 500
3 000
€ 45 000
€ 48 000
€ 49 000
€ 50 000
€ 51 000
€ 52 000
€ 45 617
2 425
2 294 2 234
2 0952 010
1 920 1 871 1 843
€ 46 210
€ 47 981
€ 46 971
€ 49 083
€ 51 475€ 51 183
€ 49 836
¹Revised data.

DE
FEN
CE
DAT
A 2
013
13
4.3. Total military personnel and defence expenditure and investment¹ per military (thousand persons, EUR, and % change on previous year)
Defence expenditure per military Defence investment per military
€ 140 000
€ 120 000
€ 100 000
€ 80 000
€ 60 000
€ 40 000
€ 20 000
€ 0
2006 2007 2008 2009 2010 20112 20122 2013
+7.2%
+13.7%€ 22 812
€ 111 136
+2.3%€ 23 333
+0.6%
€ 111 850
+5.1%€ 24 5182
+4.0%
€ 116 324
+7.9%€ 26 458
+2.7%
€ 119 455
-6.2%€ 24 830
+2.9%
€ 122 881
+8.4%€ 26 906
+5.7%€ 129 878
-2.9%€ 26 122
-0.05%€ 129 814
0
500
1 000
1 500
2 000
2 500
€ 20 058
€ 103 654
1 4361 448
1 5451 620
1 6691 8011 837
1 940
Total military personnel
¹Defence equipment procurement and R&D.2Revised data.

DE
FEN
CE
DAT
A 2
013
14
V. REFORM - DEFENCE EXPENDITURE BREAKDOWN5.1. Defence expenditure breakdown
(billion EUR and % change on previous year)
Personnel
120
100
80
60
40
20
0
2008
+1.1%
107.2
-7.8%43.2
+0.3%42.0
-4.3%8.9
2007
-4.2%
106.0
+8.1%46.9
+7,7%41.9
+13.9%9.3
2006
110.6
43.438.9
8.2
98.
2009
+19.5%10.7
+2.0%44.1
-2.6%40.9
-8.2%
4
2010
-1.0%43.7
+4.8%42.9
-21.8%8.4
+0.3%
98.7
20111
+2.2%44.6
-10.5%38.4
8.1
+0.2%
98.8
-3.4%. 6
20121
+6.1%8
+1.6%39.0
+0.5%44.8
-3.1%95.7
2013
+19.7%10.2
-3.8%37.5
+4.4%46.8
-4.1%91.8
Investment (equipment procurement and R&D) Other expenditure (including infrastructure/construction)Operation and maintenance
¹Revised data.

DE
FEN
CE
DAT
A 2
013
15
5.2. Real1 defence expenditure breakdown (billion EUR and % change on previous year)
Personnel
140
120
100
80
60
40
20
0
2013
+18.8%10.2
-4.5%37.5
+3.6%46.8
-4.8%
91.8
2012
+3.6%8.6
-0.8%39.3
-1.8%45.2
-5.3%
96.5
2011
+0.8%46.0
-11.7%39.6
-4.7%8.3
-1.2%
101.9
2010
-13.3%
45.6+2.4%44.8
-23.6%8.7
-2.0%
103.1
2009
+21.2%11.4
+3.4%
47.2-1.2%43.8
-6.9%
105.3
2008
+0.9%
113.1
-8.0%
45.6+0.1%44.3
-4.5%9.4
2007
-6.7%
112.1
+5.2%49.6
+4.8%44.3
+10.9%9.9
2006
120.2
47.142.3
8.9
Investment (equipment procurement and R&D) Other expenditure (including infrastructure/construction)Operation and maintenance
¹ In order to measure real gowth and ensure a "real" comparison over years, inflation needs to be taken into account. Thus, data from 2006 to 2012 has been inflated to 2013 economic conditions. Source of deflator: European Commission, DG ECFIN - based on weight of EU- 28.

DE
FEN
CE
DAT
A 2
013
16
5.3. Defence expenditure breakdown (billion EUR and %)
Personnel
70%
80%
90%
100%
60%
50%
40%
30%
20%
10%
0
2013
€ 186 Bn
5.5%
20.1%
25.1%
49.3%
20121
€ 188 Bn
4.6%
20.7%
23.8%
50.9%
20111
€ 190 Bn
4.3%
20.2%
23.5%
52.0%
2010
€ 194 Bn
4.3%
22.1%
22.6%
51.0%
2009
€ 194 Bn
5.5%
21.1%
22.7%
50.7%
2008
€ 201 Bn
4.4%
20.9%
21.5%
53.2%
2007
€ 204 Bn
4.6%
20.5%
23.0%
51.9%
2006
€ 201 Bn
4.1%
19.4%
21.6%
55.0%
Investment (equipment procurement and R&D) Other expenditure (including infrastructure/construction)Operation and maintenance
Total defence expenditure
¹Revised data

DE
FEN
CE
DAT
A 2
013
17
5.4. Defence investment breakdown (billion EUR and % change on previous year)
0
10
5
15
20
25
30
35
40
45
50
2006 2007 2008 2009 2010 20112 20122 2013
38.92
29.13
32.2433.27 32.512
34.31
30.6031.50
29.97
9.79 9.668.75 8.40 8.56 7.77 7.47 7.53
2.66 2.54 2.48 2.26 2.08 2.15 2.03 2.09
41.90 42.02 40.91242.87
38.37 38.9737.50
-2.6%
-1.3%
-4.3%
-9.5%
-2.5%
-4.0%
-8.9% -8.0%
-9.2% -3.9%
-5.7%
+7.7% +0.3%
+1.9%
+3.4%
+0.9%
+3.1%
+4.8%
+1.6%
+3.0%
+5.5%-2.3%
-10.5% -3.8%
-4.9%-10.8%+10.7% +3.2%
Total investment Equipment procurement R&D R&T1
¹R&T is a subset of R&D.
²Revised data.
DE
FEN
CE
DAT
A 2
013
18
5.5. Defence investment breakdown (%)
19.4%
2006
14.5%
80.6%
4.9%(1.32%)
20.5%
2007
15.8%
79.5%
4.7%(1.24%)
20.9%
2008
16.5%
79.1%
4.3%(1.23%)
21.1%
2009
16.8%
78.9%
4.3%(1.16%)
22.1%
2010
17.7%
77.9%
4.4%(1.07%)
20.2%
20111
16.1%
79.8%
4.1%(1.13%)
20.7%
20121
16.7%
79.3%
4.0%(1.08%)
20.1%
2013
16.1%
79.9%
4.0%(1.12%)
Other defence expenditure R&D (includes R&T)Defence equipment procurement
¹Revised data

DE
FEN
CE
DAT
A 2
013
19
5.6. Outsourced defence expenditure (billion EUR and %)
Remaining defence expenditure Outsourced defence expenditure
2006
93.0%
7.0%
Total outsourcing:€14.1 bn
2007
92.9%
7.1%
Total outsourcing:€14.5 bn
2008
94.0%
6.0%
Total outsourcing:€12.0 bn
2009
92.7%
7.3%
Total outsourcing:€14.1 bn
2010
92.1%
7.9%
Total outsourcing:€15.4 bn
20111
92.9%
7.1%
Total outsourcing:€13.4 bn
2012
92.7%
7.3%
Total outsourcing:€13.8 bn
2013
92.3%
7.7%
Total outsourcing:€14.4 bn
¹ Revised data.

DE
FEN
CE
DAT
A 2
013
20
VI. EUROPEAN COLLABORATION6.1. National and collaborative defence equipment procurement
(billion EUR)
National defence equipment procurement
0
5
10
15
20
25
30
2006
22.47
6.08
0.58
29.1
6.7
2007
25.40
32.2
6.11
0.74
6.8
2008
25.20
33.3
7.07
1.00
8.1
2009
24.29
32.5
7.14
1.09
8.2
2010
26.61
34.3
7.29
0.41
7.7
20111
22.69
30.6
7.34
0.57
7.9
20121 2
25.51
31.5
5.73
0.27
6.0
20132
25.22
30.0
4.50
0.26
4.8
Other collaborative defence equipment procurement
European collaborative defence equipment procurement
¹ Revised data.
² 2012 and 2013 figures are partial, as several Member States were not able to provide data.

DE
FEN
CE
DAT
A 2
013
21
6.2. National and collaborative defence equipment procurement (%)
2006
77.1%
20.9%2.0%
22.9%
2007
78.8%
18.9%2.3%
21.2%
2008
75.8%
21.2%3.0%
24.2%
2009
74.7%
22.0%3.3%
25.3%
2010
77.6%
21.2%1.2%
22.4%
20111
74.1%
24.0%1.9%
25.9%
20121 2
81.0%
18.2%0.8%
19.0%
20132
84.1%
15.0%0.9%
15.9%
National defence equipment procurement
Other collaborative defence equipment procurement
European collaborative defence equipment procurement
¹ Revised data.
² 2012 and 2013 figures are partial, as several Member States were not able to provide data.

DE
FEN
CE
DAT
A 2
013
22
6.3. National and collaborative defence R&T (billion EUR)
National defence R&T
0.0
0.5
1.0
1.5
2.0
2.5
2006
2.272
0.254
0.130
2.66
0.38
2007
2.164
2.54
0.333
0.045
0.38
2008
2.027
2.48
0.412
0.040
0.45
2009
1.936
2.26
0.290
0.032
0.32
2010
1.813
2.08
0.246
0.018
0.26
2011
1.839
2.15
0.260
0.049
0.31
20121 2
1.820
2.03
0.1380.067
0.20
1.884
2.09
0.168
0.036
0.20
20132
Other collaborative defence R&TEuropean collaborative defence R&T
¹ Revised data.
² 2012 and 2013 figures are partial, as several Member States were not able to provide data.

DE
FEN
CE
DAT
A 2
013
23
6.4. National and collaborative defence R&T (%)
2006
85.5%
9.6%
4.9%
14.5%
2007
85.1%
13.1%
1.8%
14.9%
2008
81.8%
16.6%1.6%
18.2%
2009
85.7%
12.8%
1.4%
14.2%
2010
87.3%
11.8%
0.9%
12.7%
20111
85.7%
12.1%2.3%
14.4%
20121 2
89.9%
6.8%
3.3%
10.1%
20132
90.3%
8.0%
1.7%
9.7%
National defence R&T Other collaborative defence R&TEuropean collaborative defence R&T
¹ Revised data.² 2012 and 2013 figures are partial, as several Member States were not able to provide data.
DE
FEN
CE
DAT
A 2
013
24
7.1. Average number of troops deployed (absolute figures and %)
Total number of military personnel
2 000 000
1 800 000
1 600 000
1 400 000
1 200 000
1 000 000
800 000
600 000
400 000
200 000
0
2006
4.3%
1 940 342
83 310
2007
4.2%
77 880
1 836 882
2008
4.5%
80 177
1 800 707
2009
4.1%
67 767
1 668 537
2010
4.1%
66 313
1 620 188
2011
3.5%
53 744
1 545 1381
2012
3.4%
49 550
1 448 3781
2013
4.0%
58 086
1 435 693
Average number of troops deployed % of military personnel
¹ Revised data.
VII. DEPLOYABILITY

DE
FEN
CE
DAT
A 2
013
25
7.2 Costs of deployed operations (absolute figures, EUR, and billion EUR)
90 000
80 000
70 000
60 000
50 000
40 000
30 000
20 000
10 000
0
€ 250 000
€ 200 000
€ 100 000
€ 50 000
€ 0
2006 2007 2008 2009 2010 2011 2012 2013
€ 79 373
€ 150 000
€ 6.6 bn € 8.7 bn € 9.7 bn € 9.8 bn € 10.4 bn € 11.1 bn1 € 9.0 bn1 € 7.4 bn2
€ 111 282€ 120 395
€ 145 003
€ 156 931
€ 206 851¹
€ 181 063¹
€ 127 989²
83 310
77 88080 177
67 76766 313
53 744
49 550
58 086
Average number of troops deployed Operations costs per military deployed
¹ Revised data.
² 2013 figure is an estimate as several Member States were not able to provide accurate data.
Total operations costs
DE
FEN
CE
DAT
A 2
013
26
7.3 Total number of deployable and sustainable (land) forces (absolute figures and %)
Total number of military personnel
2 000 000
1 800 000
1 600 000
1 400 000
1 200 000
1 000 000
800 000
600 000
400 000
200 000
0
2006
22.0%426 704
5.1%99 711
1 940 342
2007
24.2%444 8401
6.0%110 5121
1 836 882
2008
25.8%464 574
7.0%125 237
1 800 707
2009
26.6%443 108
6.4%106 754
1 668 537
2010
27.8%450 117
6.6%106 402
1 620 188
2011
27.6%1
425 824
7.2%1
110 814
1 545 1381
2012
31.0%1
449 702
7.5%108 802
1 448 3781
2013
33.5%481 001
7.7%110 433
1 435 693
Deployable (land) forces Sustainable (land) forces % of military personnel
¹ Revised data.

DE
FEN
CE
DAT
A 2
013
27
7.3 Total number of deployable and sustainable (land) forces (absolute figures and %)
VIII. BENCHMARKS8.1. Benchmark 1 - Defence equipment procurement and R&D as %
of total defence expenditure
Defence equipment procurement and R&D
100%
90%
80%
70%
60%
50%
40%
30%
20%
10%
0%
Benchmark
20.0%
2006
19.4%
80.6%
2007
20.5%
79.5%
2008
20.9%
79.1%
2009
21.1%
78.9%
2010
22.1%
77.9%
20111
20.2%
79.8%
20121
20.7%
79.3%
2013
20.1%
79.9% 80.0%
Other defence expenditure
¹ Revised data.

DE
FEN
CE
DAT
A 2
013
28
8.2. Benchmark 2 - European collaborative defence equipment procurement as % of total defence equipment procurement
Other defence equipment procurement
100%
90%
80%
70%
60%
50%
40%
30%
20%
10%
0%
2006
20.9%
79.1%
2007
18.9%
81.1%
2008
21.2%
78.8%
2009
22.0%
78.0%
2010
21.2%
78.8%
20111
24.0%
76.0%
20121 2
18.2%
81.8%
20132
15.0%
85.0%
Benchmark
35.0%
65.0%
European collaborative defence equipment procurement
¹ Revised data.
² 2012 and 2013 figures are partial, as several Member States were not able to provide data.

DE
FEN
CE
DAT
A 2
013
29
8.3. Benchmark 3 - Defence R&T as % of total defence expenditure
Other defence expenditure
2006
1.32%
98.68%
2007
1.24%
98.76%
2008
1.23%
98.77%
2009
1.16%
98.84%
2010
1.07%
98.93%
2011
1.13%
98.87%
20121
1.08%
98.82%
2013
1.12%
98.88%
Benchmark
2.0%
98.0%
100%
90%
80%
70%
60%
50%
40%
30%
20%
10%
0%
Defence R&T
¹ Revised data.

DE
FEN
CE
DAT
A 2
013
30
8.4. Benchmark 4 - European collaborative defence R&T as % of total defence R&T
Other defence R&T
100%
90%
80%
70%
60%
50%
40%
30%
20%
10%
0%
2006 2007 2008 2009 2010 2011 20121 2 20132 Benchmark
9.6%13.1%
16.6%12.8% 11.8% 12.1%
6.8% 8.0%
90.4%86.9%
83.4%87.2% 88.2% 87.9%
93.2% 92.0%
20.0%
80.0%
European collaborative defence R&T
¹ Revised data.
² 2012 and 2013 figures are partial, as several Member States were not able to provide data.

DE
FEN
CE
DAT
A 2
013
31
IX. ADDITIONAL NOTES ON THE DATA
EDA receives data from the Ministries of Defence of its 27 Member States. On occasions, the data can be revised, and this may have an impact on the overall aggregated figures. Please check EDA’s website regularly for updates:
http://eda.europa.eu/info-hub/defence-data-portal
• Data on GDP, general government expenditure and population is Eurostat data, which is occasionally revised, thus may impact some of the data calculated by EDA.
• The data provided in this booklet is at aggregate level, and may differ from other sources due to, inter alia, rounding.
• For some spending categories, a margin of error exists, as accounting systems of the MS differ. Nevertheless, the data provided in the booklet represents the best publicly available figures.
• Comparisons are made for 2006 to 2013. Significant changes in the exchange rates with the euro has had a considerable impact on the 2008 data: the lower amount of defence expenditure is partly caused by significant drops of some of the MS currencies exchange rates to the euro.

DE
FEN
CE
DAT
A 2
013
32
X. DEFINITIONS
Data collection is based on the list of indicators and their definitions approved by the Agency’s Ministerial Steering Board. The definitions provided below have been shortened and edited for the purpose of this publication.
Macroeconomic data: GDP, general government expenditure and population are based on the Eurostat data.
Total defence expenditure is defined as total Ministry of Defence (MoD) expenditure plus other defence-related expenditure allocated by other governmental institutions (other Ministries’ special budgetary lines).
Civilian personnel: the authorised strength of all civilian personnel on 31 December of each year employed by all military establishments and the armed forces.
Military personnel: the authorised strengths of all active military personnel on 31 December of each year.
Personnel expenditure: all personnel-related expenditure for military and civilian personnel, including from non-MoD sources.
Defence equipment procurement expenditure: expenditure for all major equipment categories.
Research and development (R&D): expenditure for any R&D programmes up to the point where expenditure for production of equipment starts to be incurred.
Research and technology (R&T): expenditure for basic research, applied research and technology demonstration for defence purposes. It is a subset of R&D.
Investment: defence equipment procurement and R&D (including R&T) expenditure.
Operation and maintenance (O&M) expenditure: covers O&M (spare parts and supplies) of major equipment, other equipment and supplies, and costs related to maintaining utilities and infrastructure.
Other expenditure: all other expenditure that cannot be attributed to any of the above expenditure categories.
Outsourced expenditure: defence expenditure for which services have been contracted at central level with service suppliers from outside the MoD and/or Armed Forces.
European collaboration (a subset of collaboration): agreement between at least two EU Member States’ Ministries of Defence for project or programme contracts. Possible non-EU partners’ share in such contracts is lower than 50%.

DE
FEN
CE
DAT
A 2
013
33
Other collaborative expenditure: all collaborative expenditure that does not fall under the European collaboration definition.
Average number of troops deployed: average number of troops (all Armed Forces) deployed throughout the year for crisis management operations.
Deployable (land) forces: number of (land) forces troops structured, prepared, and equipped for deployed operations.
Sustainable (land) forces: number of (land) forces troops undertaking or planned for sustained operations (mid- to long-term). It is a subset of deployable (land) forces.
Operations costs: all national expenditure to cover incremental (extra) costs linked to deployed operations outside the EU Member States’ territory.

QU
-AB
-15
-00
1-EN
-C
ISBN 978-92-95075-27-6
European Defence AgencyRue des Drapiers 17-23B-1050 Brussels - Belgiumwww.eda.europa.euTel +32 2 504 28 00Fax +32 2 504 28 [email protected]