deformation limit states for corroded reinforced concrete ...399308/plse2015_171_jian… ·...
TRANSCRIPT

DEFORMATION LIMIT STATES FOR CORRODED REINFORCED CONCRETE BEAMS AND COLUMNS
Huanjun Jiang 1, 2*, Xiaojuan Liu 1, 2 1 State Key Laboratory of Disaster Reduction in Civil Engineering, Tongji University,
1239 Siping Road, Shanghai, China.*Email:[email protected] 2 Research Institute of Structural Engineering and Disaster Reduction, Tongji University,
1239 Siping Road, Shanghai, China ABSTRACT Since deformation quantities have become principal design consideration in performance-based seismic design (PBSD), it is necessary to evaluate the deformation behavior of corroded RC structures for life-cycle oriented PBSD philosophy. Firstly, the material strain-based criteria to classify the performance limit states of RC beams and columns were proposed. Numerical analysis of corroded RC beams and columns in a wide range of design parameters was performed with the aid of ABAQUS finite element analytical program to evaluate the deformation behavior of corroded RC members. It is found that the corrosion ratio of reinforced bars has little effect on the deformation capacity of corroded RC members with low corrosion ratio. RC beams and columns with high corrosion ratio could fail due to the deterioration of bond between the concrete and longitudinal reinforcement, which induces significant degradation of deformation capacity of the structural member. The statistical characteristic values of deformation indexes corresponding to individual performance limit state of corroded RC beams and columns were obtained based on numerical analysis results. The research results can be utilized for life-cycle oriented seismic performance evaluation and design of RC structures. KEYWORDS Corroded RC beam, corroded RC column, deformation index, seismic performance level. INTRODUCTION The corrosion of steel reinforcement is detrimental to the serviceability and capacity of reinforced concrete (RC) structures. For RC structures located in earthquake-prone regions, reinforcement corrosion may gradually induce the degradation of structural members and increase their seismic vulnerability. A structure that is originally designed to meet code specifications may not have the same margin of safety once the structure has undergone significant corrosion (Choe et al. 2008). Due to the time-dependent nature of RC structures, it is suggested that seismic design of RC structures should consider the joint effect of seismic and aging threats. The inelastic deformation capacity of RC members is important for the resistance of RC structures imposed to seismic loads because the earthquake resistant design relies on the ductility. Due to the emergence of displacement-based concept for seismic design of new structures and seismic evaluation of old ones, the quantification of deformation capacity of RC members has attracted increasing interest in recent years (Panagiotakos et al. 2001). The guidelines, known as FEMA 273 (FEMA 1997) and FEMA 356 (FEMA 2000), specified the deformation capacity of RC members in terms of geometric and mechanical characteristics of members and of their reinforcement. These studies focused on pristine (not corroded) RC structures, and the proposed deformation limits may not be appropriate once the structure begin deterioration from corrosion. In recent years, significant research efforts have been devoted to the evaluation of corrosion effects on the seismic performance and seismic fragility of RC structures (Ma et al. 2012; Ou et al. 2014). The previous studies provide a preliminary understanding on the seismic behavior of corroded RC structures. However, the further study on the performance index of corroded components has been rarely reported up to now. Due to the emergence of the life-cycle oriented performance-based concept for seismic design of new structures and seismic evaluation of old ones in recent years, the quantification of seismic performance indexes for corroded RC structural components is needed. To this end, the main objective of this study is to evaluate the deformation limit of RC beams and columns corresponding to individual damage state, considering the effect of the performance deterioration induced by the steel bar corrosion. The material strain-based criteria were proposed to classify the performance levels of RC members. PERFORMANCE LIMIT STATES FOR RC BEAMS AND COLUMNS
1526

Defining the performance limit states and selecting proper damage indexes for quantifying the seismic damage state of building structures are the first important step for seismic performance evaluation. In this study, five damage levels, i.e., intact, very slightly damaged, slightly damaged, moderately damaged and severely damaged, were considered. The definitions of all damage limit states are shown in Table 1.
Table 1 Definitions of damage limit states
For the damage level of "intact", the concrete compressive strain limit is defined as the strain corresponding to the peak stress of the concrete, and the steel tensile strain limit is defined as the yield strain of the steel bar. For the damage level of "very slight", the concrete compressive strain limit is defined as the strain at which the crushing begins, and the steel tensile strain limit is defined as the strain at which the maximum residual crack width exceeds 1mm, thus likely requiring repair (Priestly et al. 1996) and interrupting serviceability. For the damage level of slight, the concrete compressive strain limit is defined as the compressive strain at which the slight crushing of cover concrete begins, and the steel tensile strain limit is defined as the strain at which the maximum residual crack width exceeds 2mm, thus slight repairing, such as injection of the epoxy, is required to avoid later corrosion. According to ATC-40 (ATC 1996), for the damage level of "moderate", the concrete compressive strain limit is defined as 75% of the ultimate concrete compressive strain, and the steel tensile strain limit is defined as the strain at which the maximum residual crack width exceeds 4mm. The steel tensile strain of 0.06 is selected as the limit value at this damage state (Priestly et al. 1996; Kowalsky 2000). For the damage level of "severe" which means the post-earthquake damage state on the verge of partial or total collapse (FEMA 2000), the residual load-carrying capacity of the component shall be larger than 85% of the maximum load-carrying capacity. The compressive strain of the concrete shall not be larger than the ultimate compressive strain. The steel tensile strain must also be limited to avoid rupture or buckling while the deformation capacity is reduced due to the cyclic loading (Priestly et al. 1996). CORROSION DAMAGE MODELS OF CORRODED RC BEAMS AND COLUMNS The consequences of the steel bar corrosion can range from progressive deterioration of the RC structural member and the structure over time to the catastrophic failure. Therefore, the effects of steel bar corrosion need to be carefully assessed in the numerical model. The following aspects were considered herein:
- Steel area reduction in the longitudinal steel bars and stirrups; - Changes in the mechanical properties of steel bars owing to the pitting corrosion; - Equivalent changes in the strength and ductility of the concrete in compression, due to the micro cracking
and the spalling of concrete induced by the bar expansion; - Strength deterioration of the bonding between the corroded steel bars and surrounding concrete.
Steel bars
Damage levels Damage description1 Repairing methods
Classified criteria2, 3, 4 Steel strain limit
Concrete strain limit
Deformation or force limit
Intact The member substantially retains the elastic state. No yielding occurs. (ωres<0.2mm)
Repair is not needed. fy/Es 0.002 θ≤θy
Very slight
The member substantially retains its original strength. Yielding is possible. No crushing occurs. (0.2≤ωres<1mm)
Repair is not needed in normal environment. Minor repairs may be appropriate for structures in extreme environment.
0.015 0.0033 ——
Slight Visible cracks extend. Minor crushing occurs. (1≤ωres<2mm)
Injection of epoxy is needed to avoid later corrosion. No significant remedial measures are needed.
0.030 0.005 ——
Moderate Spalling of cover concrete occurs. (2≤ωres<4mm)
A certain amount of repair is acceptable, but the cost should be significant less than the cost of replacement.
0.060 0.75εcu
Severe The range of concrete spalling extends. No collapse occurs. Repair becomes no longer feasible. 0.072 εcu Fres≥85%Fmax
1. ωres is the maximum residual crack width; 2. θ is the total rotation of the member, fy and Es are the yield strength and elastic modulus of steel reinforcement; 3. εcu is the ultimate compressive strain of concrete, and Fres is the residual load-carrying capacity of the member; 4. For each damage state, the minimum value of the rotation determined by the classified criteria is selected as the deformation limit.
1527

In this study, for simplicity the uniform corrosion was considered and modelled simply by reducing the cross-sectional area as well as the yield strength of reinforcement according to the work (Zhang et al. 2006). The reduced cross-sectional area and yield strength of corroded steel bars can be calculated according to the following equations:
0(1 )DA AK � (1) � �� �
1 1.2311
Dyk ykf f
KK
�
� (2)
Where AD and A0 are the reduced and initial cross-sectional area, respectively; Dykf and ykf are the reduced and
initial yield strength, respectively; η is the corrosion ratio. Residual strength of corrosion damaged concrete As suggested by Coronelli and Gambarova (2004), the effect of the concrete cracking and spalling was reflected by reducing the strength of the cover concrete. The reduced concrete strength can be calculated according to the model proposed by Vecchio and Collins (1986), as follows:
11 /D ck
ckco
ffRH H
�
(3)
Where fckD and fck are the compressive strength of the damaged concrete and undamaged concrete, respectively;
R is the coefficient related to the roughness and diameter of the steel bar, and for medium-diameter deformed bars it is taken as 0.1, as suggested by Cape (1999); ε1 is the average tensile strain in the cracked concrete perpendicular to the direction of the applied compression; εco is the concrete strain at peak compressive strength. Bond-slip relationship between corroded bars and surrounding concrete Based on the bond stress-slip relationship proposed by CEB-FIP Model Code 90 (1993), the following equation was adopted to incorporate the corrosion effects:
� � � �0s sW EW (4) Where τ(s) is the bond stress between the corroded steel rebar and the surrounding concrete; τ0(s) is the bond stress between the uncorroded steel rebar and the surrounding concrete, which is proposed by CEB-FIP Model Code 90 (1993), as shown in Figure 1; β is the normalized bond strength defined as the ratio of bond strength at certain corrosion ratio η to the original bond strength of the uncrorroded specimen. The model proposed by Bhargava et al. (2008) was applied to determine the normalized bond strength β, as follows:
11.7
1.0 1.5%1.192 1.5%e K
KE
K�
d ® !¯
(5)
The normalized bond strength β versus corrosion ratio η relationship is shown in Figure 2.
FINITE ELEMENT MODEL OF CORRODED RC BEAMS AND COLUMNS The numerical analysis of corroded RC beams and columns was conducted with the aid of ABAQUS finite element analysis program. A three-dimensional finite element model was adopted in this study. The concrete was modelled using 8-node 3D stress element (C3D8R). The concrete damage plasticity model with the constitutive relationship recommended by Chinese code for design of concrete structures (MOHURD 2010) was adopted. All stirrups were modelled using 2-node linear 3-D truss elements (T3D2) while the longitudinal reinforcement was modelled using 2-node linear beam element (B31). All the steel bars were assumed to exhibit elastic-perfectly plastic behavior. The bond between the longitudinal reinforcement and the concrete was modelled using the connector with the bond-slip relationship calculated according to Eqs 4 and 5. Corroded RC members from three experimental studies were used herein to verify the FE models (Niu et al. 2004; Ma et al. 2012; Wang 2008).The comparison of load-displacement curves between the test and numerical
Bond
stre
ss, τ
Slip, S
τmax
τf
S1 S2 S3
0
0.2
0.4
0.6
0.8
1
1.2
0 5 10 15 20
β
锈蚀率(%)
Nor
mal
ized
bon
d st
reng
th, β
1.21.00.80.60.40.2
00 5 10 15 20
Corrosion ratio, η (%) Figure 1 Bond-slip relationship for uncorroded
specimen Figure 2 Normalized bond strength versus
corrosion ratio relationship
1528

results are shown in Figure 3. It is found that the numerical results are in good agreement with the test results, which indicates that the corrosion damage model and finite element modelling technique adopted herein can accurately predict the behavior of corroded RC members. Subsequently, they can be used in the parametric study to examine the influence of various parameters on the behavior of corroded RC members.
0
10
20
30
40
50
60
0 10 20 30 40 50 60
Load(
kN)
Displacement(mm)
Numerical resultsTest results
020406080
100120
0 10 20 30 40 50
Load(
kN)
Displacement(mm)
Numerical resultsTest result
0
20
40
60
80
0 10 20 30 40 50 60
Load(
kN)
Displacement(mm)
Numerical results
Test results
(a) XZ-8 (n=0.2, η=5.87%) (b) C9-25 (n=0.40, η=9.7%) (c) UU-10 (n=0, η=5.35%)
Figure 3 Comparison of lateral load-displacement curves between test and numerical results PARAMETRIC STUDY 324 RC beams were designed according to the current Chinese code. The cross-section of the beam is a rectangle with the dimensions of 300×600 mm. For the RC beam, the main parameters considered in this paper are the corrosion ratio of the steel reinforcement η, the shear span ratio λ, and the longitudinal reinforcement characteristic value K determined by the following equation:
� �'
0
y s s
c b
f A AK
f bh [
� (6)
Where fy is the design yield strength of the longitudinal reinforcement; fc is the design compressive strength of the concrete; As and As' are the area of the tensile and compressive longitudinal reinforcement, respectively; b and h0 are the width and effective depth of the cross-section, respectively; ξb is the ratio of the balanced depth to the effective depth of the cross-section. The corrosion ratio of the steel reinforcement ranges from 0% to 20% at an interval of 2.5%. Four shear span ratios, i.e., 3, 4, 5 and 6, as well as nine discrete values of K ranging from 0 to 0.8, were considered. The corroded RC beam is numbered as Bη-K-λ. For example, B5-2-4 represents a beam with corrosion ratio of 5%, longitudinal reinforcement characteristic value of 0.2 and the shear span ratio of 4. According to the current Chinese code, 954 RC columns were designed. The cross-section of the column is a rectangle with the dimensions of 450×450 mm. The corrosion ratio η of reinforced bars, axial compressive load ratio n, shear span ratio λ, volumetric stirrup ratio ρv and longitudinal reinforcement ratio ρl were considered as the main parameters for RC columns. Similar to RC beam described above, the corrosion ratio of the steel reinforcement ranges from 0% to 20% at an interval of 2.5%. Four axial compressive load ratios, i.e., 0.2, 0.4, 0.6 and 0.8, as well as three shear span ratios, i.e., 3, 4, and 5, were considered. Three levels of volumetric stirrup ratio ρv, i.e., 0.79% (B8@100), 1.24% (B10@100) and 1.78% (B12@100), as well as three levels of
longitudinal reinforcement ratio ρl, i.e., 0.6% (8C14), 1.24%(8C 20) and 1.94% (8C25), were selected. The RC columns are numbered as Cη-n-λ-dv -dl. The cube compression strength of original concrete was 30 MPa. The yield strength of uncorroded longitudinal reinforcement and stirrup are 400 MPa and 330 MPa, respectively. Dimensions and typical reinforcement details of the beams and columns are shown in Figure 4. The corrosion damage model and finite element modelling technique described above were adopted in the analysis. The finite element analytical model of the specimen is shown in Figure 5. The specimens are fixed at the base. For RC beams, only the horizontal load is applied at the top while for RC columns, the constant axial compressive load is applied at the top before imposing lateral load at the top.
1 1
2
2 1000
500
L
6 20
6 20
2 20
12@100
600
500
2-2
10@100/200
4 12
1-1
15d
300
600
2 20
2 20+2 22
(a) Beam (K=0.2)
1 1
2
2 1000
500
H
3 20
2 20
3 20
12@100/200450
450
6 20
6 20
2 20
12@100
600
500
1-1
2-2
12d (b) Column (dv=12mm, dl=20mm)
(a) Concrete (b) Steel bar (c) Connector
Figure 4 Dimensions and steel reinforcement of RC members Figure 5 FEA model of the specimen
1529

RESULTS AND DISCUSSION Lateral load versus displacement curves
The typical lateral load versus displacement curves obtained are shown in Figure 6. It is found that the corrosion of steel reinforcement has little effect on the performance of RC members before cracking. After cracking, the lateral strength as well as the stiffness of the specimens decreases with the increase of the corrosion ratio. For the specimen with the corrosion ratio smaller than 10%, the lateral load versus displacement curve is similar to that of the original specimen. For specimens with the corrosion ratio lager than 10%, the post peak load and stiffness of the specimen drop more significantly with the increase of displacement than those of the specimen with the corrosion ratio smaller than 10%. Compared with corroded RC columns, the effect of steel reinforcement corrosion on the lateral load-displacement curves of RC beam is more pronounced.
0 40 80 120 160 2000
30
60
90
120
150
Late
ral l
oad
(kN
)
Displacement (mm)
η=0% η=2.5% η=5.0% η=7.5% η=10.0% η=12.5% η=15.0% η=17.5% η=20.0%
0 10 20 30 40 50 60
0
50
100
150
200
250
300
Late
ral l
oad
(mm
)Displacement (mm)
η=0% η=2.5% η=5.0% η=7.5% η=10.0% η=12.5% η=15.0% η=17.5% η=20.0%
(a) Beam (Bη-5-6) (b) Column (Cη-4-4-12-20)
Figure 6 Lateral load versus displacement curves
Stress of longitudinal reinforcement Figure 7 shows the steel stress along the tensile longitudinal reinforcement. For the specimen with the corrosion ratio smaller than 10%, the largest stress of tensile longitudinal reinforcement maintains at the corresponding yield strength at both peak load state and ultimate limit state. For the specimen with the corrosion ratio of 10%, the largest stress of tensile longitudinal steel is close to the yield strength at peak load state and drops significantly at the ultimate limit state due to the deterioration of bond strength between the reinforcement and concrete. For the specimen with the corrosion ratio larger than 10%, the bond strength between the steel reinforcement and concrete degrades rapidly, and the largest steel stress is smaller than the corresponding yield strength at both the peak load state and the ultimate limit state, which indicates that the tensile rebar is unable to reach the yield strength and the specimen fails due to the deterioration of bond between the concrete and the longitudinal reinforced bars.
0 500 1000 1500 2000 25000
100
200
300
400
Ste
el s
tress
(MP
a)
Distance from the base (mm)
η=0% η=2.5% η=5.0% η=7.5% η=10% η=12.5% η=15% η=17.5% η=20%
0 500 1000 1500 2000 2500
0
100
200
300
400
Ste
el s
tress
(MP
a)
Distance from the base (mm)
η=0% η=2.5% η=5.0% η=7.5% η=10% η=12.5% η=15% η=17.5% η=20%
(a) Peak load state (b) Ultimate limit state
Figure 7 Stress distribution along tensile longitudinal reinforcement of Column (Cη-2-4-12-20) Parametric analysis of deformation behavior The inelastic deformation capacity of RC members is important for earthquake-resistant design relying on the ductility. The primary deformation index considered herein is the ultimate plastic rotation over the plastic hinge length. Based on the previous studies on plastic hinge length of RC components (Bae and Bayrak 2008), the plastic hinge length lp shall be set equal to half of the flexural depth of RC components. The ultimate plastic rotation can be obtained by subtracting the yield rotation from the ultimate rotation over the plastic hinge length. The yield rotation was defined based on the equivalent elasto-plastic energy absorption while the ultimate rotation was calculated according to the classified criteria of the "severe" damage state listed in Table 1. Yield rotation
1530

Figure 8 shows the yield rotation versus corrosion ratio curves of RC beams and columns. It is found that the corrosion ratio of steel reinforcement has little influence on the yield rotation of RC beams and columns with the corrosion ratio smaller than 10%. For specimens with the corrosion ratio larger than 10%, the yield rotation significantly decreases with the increase of the corrosion ratio. According to the relationship between yield rotation and corrosion ratio, a simplified model, as shown in Figure 9, was proposed to describe the deterioration characteristic of yield rotation for corroded RC beams and columns. For RC beams, the yield rotation versus longitudinal reinforcement characteristic value curve is shown in Figure 10. It is found that for RC beams with the corrosion ratio smaller than 7.5%, the longitudinal reinforcement characteristic value K has little effect on the yield rotation, and the yield rotation slightly increases with the increase of shear span ratio. For RC beams with corrosion ratio of 20%, the yield rotation linearly increases with the increase of K, and the shear span ratio has little influence on the yield rotation. For RC columns, the relationships of the yield rotation with the parameters, i.e., the axial compressive load ratio, the shear span ratio, the volumetric stirrup ratio and the longitudinal reinforcement area ratio, are shown in Figures 11 and 12. It is shown that the volumetric stirrup ratio, as well as the shear span ratio, has little effect on the yield rotation of corroded RC columns. The yield rotation of RC columns linearly decreases with the increase of the axial compressive load ratio and increases with the increase of longitudinal reinforcement area ratio.
0 4 8 12 16 200.000
0.001
0.002
0.003
0.004
0.005
Yie
ld ro
tatio
n (r
ad)
Corrision ratio (%)
K=0.0 K=0.1 K=0.2 K=0.3 K=0.4 K=0.5 K=0.6 K=0.7 K=0.8
(a) Beam (Bη-K-4)
0 4 8 12 16 200.001
0.002
0.003
0.004
Yie
ld ro
tatio
n (r
ad)
Corrosion ratio (%)
n=0.2 n=0.4 n=0.6 n=0.8
(b) Column (Cη-n-4-10-20)
Yie
ldin
g ro
tatio
n
Corrosion ratio
7.5 20
θy1
θy2
Yie
ld ro
tatio
n (r
ad)
Corrosion ratio (%) Figure 9 Model of yield
rotation versus corrosion ratio Figure 8 Yield rotation versus corrosion ratio of steel reinforcement
curves
0.0 0.2 0.4 0.6 0.80.000
0.001
0.002
0.003
0.004
0.005
0.006
Yie
ld ro
tatio
n (r
ad)
K
λ=2 λ=3 λ=4 λ=5 λ=6
0.0 0.2 0.4 0.6 0.8
0.000
0.001
0.002
0.003
0.004
0.005
0.006
Yie
ld ro
tatio
n (r
ad)
K
λ=2 λ=3 λ=4 λ=5 λ=6
(a) η≤7.5% (b) η=20%
Figure 10 Yield rotation versus longitudinal reinforcement characteristic value K curves for RC beam
0.0 0.2 0.4 0.6 0.8 1.00.000
0.001
0.002
0.003
0.004
Yiel
d ro
tatio
n (ra
d)
Axial compressive load ratio
ρv=0.79% ρv=1.24% ρv=1.78%
(a) η≤7.5%
0.0 0.2 0.4 0.6 0.8 1.00.000
0.001
0.002
0.003
0.004
Yie
ld ro
tatio
n (r
ad)
Axial compressive load ratio
ρv=0.79% ρv=1.24% ρv=1.78%
(b) η=20%
0.0 0.5 1.0 1.5 2.0 2.50.000
0.001
0.002
0.003
0.004
Yie
ld ro
tatio
n (ra
d)
Longitudinal reinforcement area ratio (%)
λ=3 λ=4 λ=5
(a) η≤7.5%
0.0 0.5 1.0 1.5 2.0 2.50.000
0.001
0.002
0.003
0.004
Yie
ld ro
tatio
n (r
ad)
Longitudinal reinforcement ratio (%)
λ=3 λ=4 λ=5
(b) η=20%
Figure 11 Yield rotation versus axial compressive load ratio curves for RC columns with different volumetric
stirrup ratios
Figure 12 Yield rotation versus longitudinal reinforcement area ratio curves for RC columns with different shear span
ratios For simplicity, the curvature distribution along the length of RC beams and columns was assumed to be linear before yield. The yield rotation within the plastic hinge length shall be calculated by the following equation:
� �2 /
2y p p
y
l l lMT
� (7)
Where θy is the yield rotation; lp is the assumed plastic hinge length; l is the length of the component; φy is the yield curvature of the component. According to the work of Priestley (2003), the yield curvature φy shall be expressed as
1y
y ChH
M (8)
1531
Where C1 is a constant depending on the type of the RC component considered, εy is the yield strain of the flexural reinforcement, and h is the section depth. Substituting Eq. 8 into Eq. 7, the yield rotation of the RC beams and columns shall be calculated using the following equation:
� �1 2 /
2y p p
y
C l l l
h
HT
� (9)
As discussed previously, the statistical analysis was conducted to derive the constant C1 for RC beams with low corrosion ratio. According to the numerical results of the corroded RC beams with corrosion ratio not larger than 7.5%, the average value of C1 is equal to 2.84, with a standard deviation of 0.25 and a variation coefficient of 8.85%. For RC beams with the corrosion ratio of 20%, the linear relationship between the longitudinal reinforcement characteristic value K and the yield rotation was assumed in developing the expression of θy for simplicity. The θy expression as follows was proposed for corroded RC beams:
1
2.84 7.5%1.663 1.164 20%
CK
KKd ½
® ¾� ¯ ¿ (10)
For RC beams with the corrosion ratio between 7.5% and 20%, the yield rotation can be obtained by the linear interpolation. For RC columns, the linear relationship between the parameters, i.e., the axial compressive load ratio and the longitudinal reinforcement ratio, and the yield rotation, was assumed in deriving the θy expression for simplicity. Least square analyses were conducted to identify the coefficient for each parameter using the numerical results of corroded RC columns. The θy expression as follows was proposed for corroded RC columns:
1
2.037 1.66 94 7.5%1.027 44.5 20%
l
l
nC
U KU K
� � d ½ ® ¾� ¯ ¿
(11)
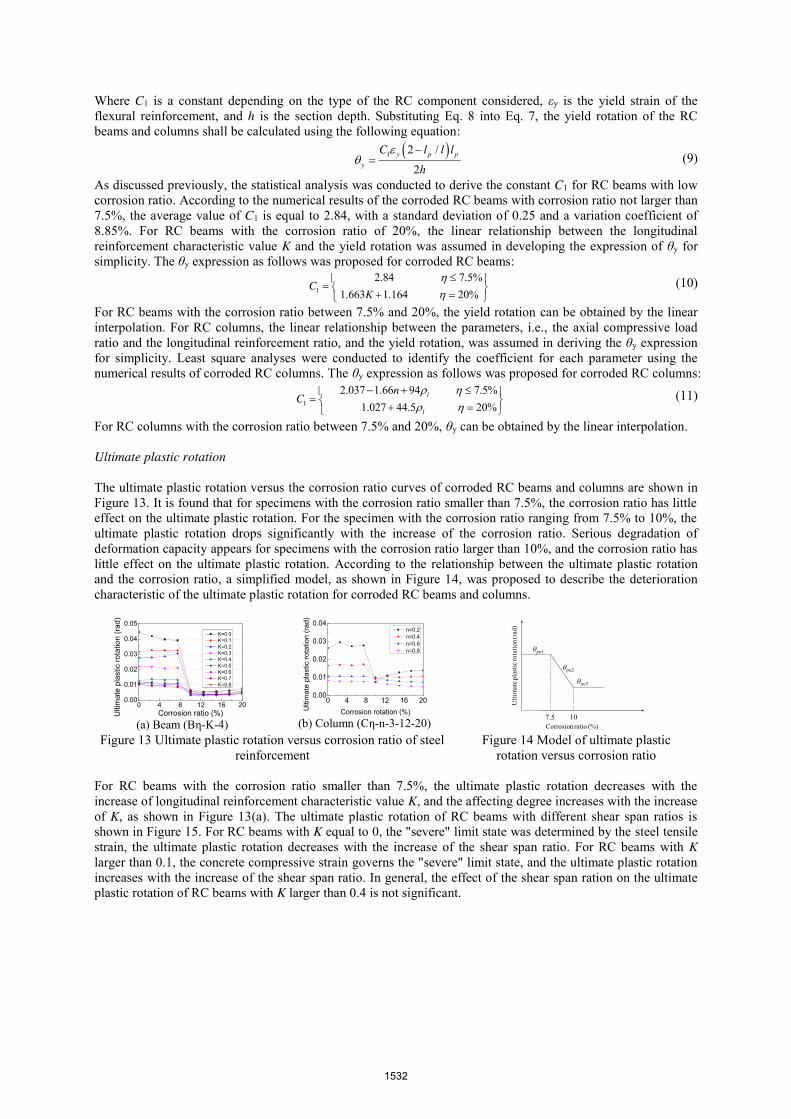
For RC columns with the corrosion ratio between 7.5% and 20%, θy can be obtained by the linear interpolation. Ultimate plastic rotation The ultimate plastic rotation versus the corrosion ratio curves of corroded RC beams and columns are shown in Figure 13. It is found that for specimens with the corrosion ratio smaller than 7.5%, the corrosion ratio has little effect on the ultimate plastic rotation. For the specimen with the corrosion ratio ranging from 7.5% to 10%, the ultimate plastic rotation drops significantly with the increase of the corrosion ratio. Serious degradation of deformation capacity appears for specimens with the corrosion ratio larger than 10%, and the corrosion ratio has little effect on the ultimate plastic rotation. According to the relationship between the ultimate plastic rotation and the corrosion ratio, a simplified model, as shown in Figure 14, was proposed to describe the deterioration characteristic of the ultimate plastic rotation for corroded RC beams and columns.
0 4 8 12 16 200.00
0.01
0.02
0.03
0.04
0.05
Ulti
mat
e pl
astic
rota
tion
(rad
)
Corrosion ratio (%)
K=0.0 K=0.1 K=0.2 K=0.3 K=0.4 K=0.5 K=0.6 K=0.7 K=0.8
(a) Beam (Bη-K-4)
0 4 8 12 16 200.00
0.01
0.02
0.03
0.04
Ulti
mat
e pl
astic
rota
tion
(rad
)
Corrosion rotation (%)
n=0.2 n=0.4 n=0.6 n=0.8
(b) Column (Cη-n-3-12-20)
极限
塑性
转角
(ra
d)
锈蚀率(%)
7.5 10
θpu1
θpu2
θpu3
Ulti
mat
e pla
stic
rota
tion (
rad)
Corrosion ratio (%) Figure 13 Ultimate plastic rotation versus corrosion ratio of steel
reinforcement Figure 14 Model of ultimate plastic
rotation versus corrosion ratio For RC beams with the corrosion ratio smaller than 7.5%, the ultimate plastic rotation decreases with the increase of longitudinal reinforcement characteristic value K, and the affecting degree increases with the increase of K, as shown in Figure 13(a). The ultimate plastic rotation of RC beams with different shear span ratios is shown in Figure 15. For RC beams with K equal to 0, the "severe" limit state was determined by the steel tensile strain, the ultimate plastic rotation decreases with the increase of the shear span ratio. For RC beams with K larger than 0.1, the concrete compressive strain governs the "severe" limit state, and the ultimate plastic rotation increases with the increase of the shear span ratio. In general, the effect of the shear span ration on the ultimate plastic rotation of RC beams with K larger than 0.4 is not significant.
1532

0 4 8 12 16 200.000.010.020.030.040.050.06
Ulti
mat
e pl
astic
rota
tion
(rad)
Corrosion ratio (%)
λ=3 λ=4 λ=5 λ=6
0 4 8 12 16 20
0.000.010.020.030.040.050.06
Ulti
mat
e pl
astic
rota
tion
(rad)
Corrosion ratio (%)
λ=3 λ=4 λ=5 λ=6
0 4 8 12 16 20
0.000.010.020.030.040.050.06
Ulti
mat
e pl
astic
rota
tion
(rad
)
Corrosion ratio (%)
λ=3 λ=4 λ=5 λ=6
(a) K=0.0 (b) K=0.2 (c) K=0.4
Figure 15 Ultimate plastic rotations of RC beams with different shear span ratios Based on the parametric analysis described above, the ultimate plastic rotation versus longitudinal reinforcement characteristic value curves of RC beams with the corrosion ratio smaller than 7.5% are shown in Figure 16. Exponential function was selected to describe the relationship between ultimate plastic rotation of RC beams and the longitudinal reinforcement characteristic value K. The ultimate plastic rotation of RC beams with the corrosion ratio smaller than 7.5% shall be calculated by the following equation:
2.24
2.11
0.035 30.040 4
K
pu K
ee
OT
O
�
�
° ®t°̄
(12)
For RC beams with corrosion ratio larger than 10%, the shear span ration, as well as K, has little effect on the ultimate plastic rotation. The distribution of ultimate plastic rotation of RC beams with corrosion ratio larger than 10% is shown in Figure 17. The average value of the ultimate plastic rotation is 0.0042, with the standard deviation of 0.000392 and the variation coefficient of 21.98%.
y = 0.035e-2.24x
R = 0.941
0
0.01
0.02
0.03
0.04
0.05
0.06
0 0.2 0.4 0.6 0.8
Ulti
mat
e pla
stic r
otat
ion (
rad)
K (a) λ=3
y = 0.040e-2.11x
R = 0.919
0
0.01
0.02
0.03
0.04
0.05
0.06
0 0.2 0.4 0.6 0.8
Ulti
mat
e pla
stic r
otat
ion (
rad)
K (b) λ≥4
0
10
20
30
40
50
2 3 4 5 6 7 8
Rel
ativ
e Fre
quen
cy (%
)
Ultimate plastic rotation (×10-3rad)
20 3 4 5 6 7 8
μμ-σ μ+σ
Figure 17 Distribution of ultimate plastic rotation for specimens with
corrosion ratio of 20% Figure 16 Ultimate plastic rotation versus longitudinal reinforcement
characteristic value curves (η≤7.5%) The ultimate plastic rotation of RC columns with different shear span ratio is shown in Figure 18. It is found that the differences in the ultimate plastic rotation of RC columns with different shear span ratios are not distinct. Figure 19 shows the ultimate plastic rotation of RC columns with different volumetric stirrup ratios. It is found that for RC columns with the corrosion ration smaller than 7.5%, the ultimate plastic rotation slightly increases with the increase of the volumetric stirrup ratio, but the effect of volumetric stirrup ratio is not significant. As shown in Figure 13(b), the ultimate plastic rotation significantly decreases with the increase of axial compressive load ratio for RC columns with the corrosion ratio smaller than 10%. While for RC columns with the corrosion ratio larger than 10%, the influence of axial compressive load ratio is reduced. Figure 20 shows the relationship between the average ultimate plastic rotation and the axial compressive load ratio of RC columns. With the increase of axial compressive load ratio, the ultimate plastic rotation decreases exponentially. Average ultimate plastic rotation versus longitudinal reinforcement ratio curves are shown in Figure 21. For RC columns with the corrosion ratio smaller than 7.5%, the ultimate plastic rotation linearly increases with the increase of longitudinal reinforcement ratio. For RC columns with the corrosion ratio larger than 10%, the effect of the longitudinal reinforcement ratio on the ultimate plastic rotation is not significant.
0 4 8 12 16 200.000
0.005
0.010
0.015
0.020
0.025
Ulti
mat
e pl
astic
rota
tion
(rad
)
Corrosion ratio (%)
λ=3 λ=4 λ=5
(a) Cη-2-λ-10-20
0 4 8 12 16 200.000
0.005
0.010
0.015
0.020
0.025
Ulti
mat
e pl
astic
rota
tion
(rad
)
Corrosion ratio (%)
λ=3 λ=4 λ=5
(b) Cη-4-λ-10-20
0 4 8 12 16 200.000
0.005
0.010
0.015
0.020
0.025
Ulti
mat
e pl
astic
rota
tion
(rad
)
Corrosion ratio (%)
ρv=0.79% ρv=1.24% ρv=1.78%
(a) Cη-2-4-dv-20
0 4 8 12 16 200.000
0.005
0.010
0.015
0.020
0.025
Ulti
mat
e pl
astic
rota
tion
(rad)
Corrosion ratio (%)
ρv=0.79% ρv=1.24% ρv=1.78%
(b) Cη-4-4-dv-20 Figure 18 Ultimate plastic rotation of RC columns with
different shear span ratios Figure 19 Ultimate plastic rotation of RC columns with
different volumetric stirrup ratios
1533

0.0 0.2 0.4 0.6 0.8 1.00.000
0.005
0.010
0.015
0.020
0.025
0.030
U
ltim
ate
plas
tic ro
tatio
n (r
ad)
Axial compressive load ratio
ρl=0.60% ρl=1.24% ρl=1.94%
(a) η≤7.5%
0.0 0.2 0.4 0.6 0.8 1.00.000
0.005
0.010
0.015
0.020
0.025
0.030
Ulti
mat
e pl
astic
rota
tion
(rad
)
Axial compressive load ratio
ρl=0.60% ρl=1.24% ρl=1.94%
(b) η≥10%
0.0 0.5 1.0 1.5 2.00.000
0.005
0.010
0.015
0.020
0.025
0.030
Ulti
mat
e pl
astic
rota
tion
(rad)
Longitudinal reinforcement ratio (%)
n=0.2 n=0.4 n=0.6 n=0.8
(a) η≤7.5%
0.0 0.5 1.0 1.5 2.00.000
0.005
0.010
0.015
0.020
0.025
0.030
Ulti
mat
e pl
astic
rota
tion
(rad
)
Corrosion ratio (%)
n=0.2 n=0.4 n=0.6 n=0.8
(b) η≥10%
Figure 20 Average ultimate plastic rotation versus axial compressive load ratio curves of RC columns
Figure 21 Average ultimate plastic rotation versus longitudinal reinforcement ratio curves of RC columns
Based on the parametric analysis results discussed above, the following function was assumed to describe the relationship between ultimate plastic rotation of RC columns with the main parameters, i.e., axial compressive load ratio and longitudinal reinforcement ratio:
� � 1
2
1 1
2
7.5%10%
c nl
pu c n
a b ea eU K
TK
�
�
½� d° ° ® ¾t° °¯ ¿
(13)
Where a1, b1, c1, a2 and c2 are the regression coefficients determined by least squares analyses using the numerical results of corroded RC columns. The expression shown in following equation was obtained for the ultimate plastic rotation of RC columns with the corrosion ratio smaller than 7.5% or larger than 10%:
� � 2.31
1.97
0.9 0.029 7.5%0.022 10%
nl
pu n
ee
U KT
K
�
�
½� d° ° ® ¾t° °¯ ¿
(14)
For RC columns with the corrosion ratio between 7.5% and 10%, the ultimate plastic rotation can be obtained by the linear interpolation. Deformation limits corresponding to various damage states Based on the numerical results of corroded RC beams and columns, the deformation limits corresponding to various damage states were determined according to the criteria listed in Table 1. The proportional factor di is defined as the ratio of the plastic rotation corresponding to the ith damage state to the ultimate plastic rotation. For the 'intact' state, the proportional factor d1 is defined as the ratio of the total rotation to the yield rotation. The distributions of deformation proportional factors di for individual damage state are shown in Figures 22 and 23. The statistical characteristic values of each deformation proportional factor di are listed in Table 2.
0.6 0.7 0.8 0.9 1.0 1.10.0
0.1
0.2
0.3
0.4
Rel
ativ
e Fr
eque
ncy
θ1/θy
μ-σ μ μ+σ
(a) Intact
0.02 0.04 0.06 0.08 0.100.0
0.1
0.2
0.3
0.4
Rel
ativ
e Fr
eque
ncy
θp2/θpu
μ-σ μ μ+σ
(b) Very slight
0.2 0.3 0.4 0.5 0.6 0.70.00
0.05
0.10
0.15
0.20
0.25
Rel
ativ
e Fr
eque
ncy
θp3/θpu
μ-σ μ μ+σ
(c) Slight
0.5 0.6 0.7 0.8 0.9 1.00.00
0.05
0.10
0.15
0.20
0.25
Rel
ativ
e Fr
eque
ncy
θp4/θpu
μ-σ μ μ+σ
(d) Moderate
Figure 22 Distribution of proportional factors for deformation limit values of RC beams
0.7 0.8 0.9 1.0 1.10.0
0.2
0.4
0.6
0.8
θ1/θy
Rel
ativ
e Fr
eque
ncy
μ-σ μ μ+σ
(a) Intact
0.00 0.04 0.08 0.12 0.16 0.200.00
0.05
0.10
0.15
0.20
0.25
0.30μ μ+σ
Rel
ativ
e Fr
eque
ncy
θp2/θpu
μ-σ
(b) Very slight
0.3 0.4 0.5 0.60.0
0.1
0.2
0.3
Rel
ativ
e Fr
eque
ncy
θp3/θpu
μ-σ μ μ+σ
(c) Slight
0.6 0.7 0.80.00
0.05
0.10
0.15
0.20
0.25
θp4/θpu
Rel
ativ
e Fr
eque
ncy
μ-σ μ μ+σ
(d) Moderate
Figure 23 Distribution of proportional factors for deformation limit values of RC columns
Table 2 Statistical characteristics of deformation proportional factor
Component Damage state di
Statistical characteristics for di1
m m-σ m+σ Pdi∈[m-σ, m+σ] Pdi≥m-σ
RC beam Intact θ1/θy
0.87 0.75 0.99 50.7% 80% Very slight θp2/θpu
0.06 0.05 0.07 67.3% 85.5% Slight θp3θpu
0.45 0.35 0.55 81.7% 84.5%
1534

Moderate θp4θpu 0.76 0.66 0.85 67.8% 84.3%
Severe θp5θpu 1.0 - - - -
RC column
Intact θ1/θy 0.96 0.89 1.04 84.8% 84.8%
Very slight θp2/θpu 0.11 0.08 0.15 60.6% 76.9%
Slight θp3θpu 0.41 0.35 0.48 69.8% 84.4%
Moderate θp4θpu 0.70 0.65 0.84 68.3% 86.5%
Severe θp5θpu 1.0 - - - -
1. m is the mean value of the proportional factor di, σ is the standard deviation, and P is the distribution probability.
As shown in Figures 22-23 and Table 2, it is observed that the dispersion of the deformation proportional ratios corresponding to individual damage states is small. The probability of the proportional ratios exceeding the mean m minus one standard deviation σ is larger than 80% for most of the damage states. Accordingly, the m-σ bound of deformation proportional ratios di is suggested to be used as the deformation proportional ratio limits in seismic evaluation and performance-based seismic design of RC structures. CONCLUSIONS To quantify the seismic damage levels of building structures, the material strain-based criteria to classify the performance limit states of RC beams and columns were proposed in this study. Numerical analysis of corroded RC beams and columns in a wide range of design parameters was performed with the aid of ABAQUS finite element analytical program to evaluate the deformation behavior of corroded RC members. Based on the numerical results, the expressions for yield rotation and ultimate plastic rotation of corroded RC beams and columns were derived. Furthermore, statistical characteristic values of deformation limits corresponding to various damage states were derived according to numerical results. The research results can be utilized for life-cycle oriented seismic design and seismic performance evaluation of RC structures. ACKNOWLEDGMENTS The authors gratefully acknowledge the financial support provided by Specialized Research Fund for the Doctoral Program of Higher Education under Grant No. 20130072110011 and the National Natural Science Foundation of China under Grant No. 51478354. REFERENCES ATC (Applied Technology Council). (1996). Seismic evaluation and retrofit of concrete buildings (Report No.
ATC-40), Redwood City, California. Bae S. and Bayrak O. (2008). “Plastic hinge length of reinforced concrete columns”, ACI Structure Journal,
105(3), 290-300. Bhargava K., Ghosh A. K., Mori Y., and Ramanujam S. (2008). “Suggested empirical models for corrosion-
induced bond degradation in reinforced concrete”, Journal of structural engineering, 134(2), 221-230. Cape M. (1999). Residual service-life assessment of existing R/C structures, MS thesis, Chalmers University of
Technology, Goteborg (Sweden) and Milan University of Technology, Italy. CEB-FIP Model Code 1990 (1993). Design of concrete structures, British Standard Institution, Landon, UK. Coronelli D. and Gambarova P. (2004). “Structural assessment of corroded reinforced concrete beams: modeling
guidelines”, Journal of structural engineering, 130(8), 1214-1224. FEMA (Federal Emergency Management Agency) (1997). NEHRP guidelines for the seismic rehabilitation of
buildings (Report No. FEMA 273), Washington, D.C. FEMA (Federal Emergency Management Agency) (2000). Pre-standard and Commentary for the Seismic
Rehabilitation of Buildings (Report No. FEMA 356), Washington, D.C. Kowalsky M. J. (2000). “Deformation limit states for circular reinforced concrete bridge columns”, Journal of
Structural Engineering, 126(8), 869-878. Ma Y., Che Y. and Gong J.X. (2012). “Behavior of corrosion damaged circular reinforced concrete columns
under cyclic loading”, Construction and Building Materials, 29, 548-556. Ministry of Construction of the People's Republic of China (MCPRC) (2010). Code for design of concrete
structures (GB50010-2010), China Architecture and Building Press: Beijing, China. Niu D.T., Chen X.X. and Wang X.M. (2004). “Experimental study on the seismic behaviour of corroded RC
components”, Building Structure, 34(10), 36-45. (in Chinese) Ou Y.C., Tsai L.L. and Chen H.H. (2012). “Cyclic performance of large-scale corroded reinforced concrete
beams”, Earthquake Engineering and Structural Dynamics, 41, 593-604.
1535
Priestley M.J.N., Seible F. and Calvi G. M. (1996). Seismic design and retrofit of bridge structures, Wiley, NewYork.
Priestley, M. N. (2003). Myths and fallacies in earthquake engineering, revisited, IUSS press, Pavia, Italy. Wang X. G. (2008). Study on the flexural behavior of corroded RC beams strengthened with carbon fiber
composite sheets, Doctoral thesis, Tongji University, Shanghai. (in Chinese) Vecchio F.J. and Collins M.P. (1986). “The modified compression-field theory for reinforced concrete elements
subjected to shear”, ACI Journal Proceedings, 83(2), 219-231. Zhang W.P., Shang D.F. and Gu X.L. (2006). “Stress-strain relationship of corroded steel bars”, Journal of
Tongji University (Natural Science), 34(5), 586-592. (in Chinese)
1536