r obustness of corroded reinforced c oncrete structures of corroded... · r obustness of corroded...
TRANSCRIPT

Robustness of Corroded Reinforced
Concrete Structures
Short Term Scientic Mission, COST ACTION TU-0601
by
Eduardo Soares Cavaco
under the guidance of
Prof. Juan R. Casas
and
Prof. Luís A. C. Neves
Universitat Politècnica de Catalunya, Barcelona
July 2009


This report respects to the research done by the PhD Student, Eduardo Soares Cavacofrom Faculdade de Ciências e Tecnologia da Universidade Nova de Lisboa, during a ShortTerm Scientic Mission (STSM) with regard to Cost Action TU-0601.
The STMS took place at Universitat Politècnica de Catalunya from 01/03/2009 to31/07/2009 under the guidance of Prof. Juan R. Casas.
The propose of the visit was to intend to make contributions to the denition ofstructural robustness especially in the analysis of reinforced concrete structures subjectedto corrosion.
An article on IABMAS 2010 is the expected publication resulting from the referredSTSM.
3

Acknowledgments
I would like to express my deep gratitude to Prof. Juan R. Casas and Prof. Luís A. C.Neves, for their invaluable help and guidance during the course of this Short Term Scien-tic Mission. I am also highly indebted to Prof. Alfredo Huespe without whom this workwould not be possible. I am also grateful to Prof. Xavier Oliver, Prof. Dorian Linero andIvo Dias for their support and for transmitting me fundamental knowledges to performthis work. Finally I would like to acknowledge Cost Action TU-0601 for help supportingme during this Short Term Scientic Mission.
Eduardo Soares CavacoJuly 2009Universitat Politècnica de Catalunya, Barcelona
5


Contents
Contents i
List of Figures iii
1 Introduction 3
2 Robustness Denition 7
2.1 Introduction . . . . . . . . . . . . . . . . . . . . . . . . . . . . . . . . . . . 72.2 Related Concepts . . . . . . . . . . . . . . . . . . . . . . . . . . . . . . . . 10
3 Robustness Assessment 13
3.1 Frangopol and Curley, 1987 . . . . . . . . . . . . . . . . . . . . . . . . . . 133.2 Lind, 1995 . . . . . . . . . . . . . . . . . . . . . . . . . . . . . . . . . . . . 143.3 Ghosn and Moses, 1998 . . . . . . . . . . . . . . . . . . . . . . . . . . . . . 143.4 Baker et al., 2008 . . . . . . . . . . . . . . . . . . . . . . . . . . . . . . . 153.5 Biondini and Restelli, 2008 . . . . . . . . . . . . . . . . . . . . . . . . . . . 173.6 Starossek, 2008, 2009 . . . . . . . . . . . . . . . . . . . . . . . . . . . . . . 18
3.6.1 Damage Based Robustness Measure I . . . . . . . . . . . . . . . . . 193.6.2 Damage Based Robustness Measure II . . . . . . . . . . . . . . . . 193.6.3 Stiness Based Robustness Measure . . . . . . . . . . . . . . . . . 203.6.4 Energy Based Robustness Measure . . . . . . . . . . . . . . . . . . 20
4 Proposing a Robustness Index 21
4.1 Proposed Robustness Indexes . . . . . . . . . . . . . . . . . . . . . . . . . 214.2 Proposing a Robustness Index . . . . . . . . . . . . . . . . . . . . . . . . . 24
5 Methodology 27
5.1 Introduction . . . . . . . . . . . . . . . . . . . . . . . . . . . . . . . . . . . 275.2 Finite element methodology . . . . . . . . . . . . . . . . . . . . . . . . . . 285.3 CSDA - Continuum Strong Discontinuity Approach (Oliver et al., 2002;
Oliver and Huespe, 2004) . . . . . . . . . . . . . . . . . . . . . . . . . . . . 295.4 Isotropic Continuum Damage Model (Oliver et al., 1990) . . . . . . . . . . 295.5 Cross Section Analysis . . . . . . . . . . . . . . . . . . . . . . . . . . . . . 33
5.5.1 Steel bar model . . . . . . . . . . . . . . . . . . . . . . . . . . . . . 335.5.2 Steel-Concrete interface model . . . . . . . . . . . . . . . . . . . . . 34
5.6 2D Longitudinal Analysis . . . . . . . . . . . . . . . . . . . . . . . . . . . . 355.6.1 Composite material model . . . . . . . . . . . . . . . . . . . . . . . 35
i

ii CONTENTS
5.6.2 Slipping-ber model . . . . . . . . . . . . . . . . . . . . . . . . . . 365.6.3 Bond-Strength deterioration (Bhargava et al., 2007) . . . . . . . . . 38
6 Numerical Example 39
6.1 Introduction . . . . . . . . . . . . . . . . . . . . . . . . . . . . . . . . . . . 396.2 Design Solution . . . . . . . . . . . . . . . . . . . . . . . . . . . . . . . . . 396.3 Cross Section Analysis . . . . . . . . . . . . . . . . . . . . . . . . . . . . . 406.4 2D longitudinal model for structural analysis . . . . . . . . . . . . . . . . . 426.5 Coupling cross section and 2D structural analysis . . . . . . . . . . . . . . 456.6 Results . . . . . . . . . . . . . . . . . . . . . . . . . . . . . . . . . . . . . . 46
7 Conclusions and Future Work 51
References 53

List of Figures
1.1 Ronan Point (London, UK - 1968). . . . . . . . . . . . . . . . . . . . . . . . . 31.2 September 11 (New York, USA - 2001). . . . . . . . . . . . . . . . . . . . . . . 41.3 I-35W Mississippi River bridge collapse (Minneapolis, USA - 2007). . . . . . . 51.4 Gusset plate used to unite multiple structural members of a truss (adapted
from NTSB, 2008). . . . . . . . . . . . . . . . . . . . . . . . . . . . . . . . . . 5
2.1 Dening Robustness. . . . . . . . . . . . . . . . . . . . . . . . . . . . . . . . . 82.2 Progressive loss in structural function. . . . . . . . . . . . . . . . . . . . . . . 82.3 Robustness: structural property vs. property of structure and environment. . . 9
3.1 Event Tree (adapted from Baker et al., 2008). . . . . . . . . . . . . . . . . . . 163.2 Truss system undergoing damage of one member (adapted from Biondini and
Restelli, 2008). . . . . . . . . . . . . . . . . . . . . . . . . . . . . . . . . . . . 173.3 Results using displacement and considering the deterioration of all members
each at a time (adapted from Biondini and Restelli, 2008). . . . . . . . . . . . 183.4 Damage Based Robustness Measure II (adapted from Starossek, 2009). . . . . 19
4.1 Barrier Model (adapted from Sorensen and Christensen, 2006). . . . . . . . . . 214.2 Event Tree (* Stiness based measure; ** Damaged based measures). . . . . . 234.3 Normalized structural response as a function of normalized damaged. . . . . . 25
5.1 Plane strain 2D model: (a) Corrosion expansion mechanism. (b) Numericalmodel idealization. (c) Typical pattern of cracks. (adapted from Sánchez et al.,2008) . . . . . . . . . . . . . . . . . . . . . . . . . . . . . . . . . . . . . . . . . 28
5.2 Corrosion analysis methodology uxogram. . . . . . . . . . . . . . . . . . . . . 305.3 CSDA kinematics. Jump on displacement eld (adapted from Oliver et al.,
2006). . . . . . . . . . . . . . . . . . . . . . . . . . . . . . . . . . . . . . . . . 315.4 Equilibrium of a damaged section. . . . . . . . . . . . . . . . . . . . . . . . . . 315.5 Isotropic continuum damage model (adapted from Oliver et al., 2002). . . . . . 335.6 Material hardening and softening. . . . . . . . . . . . . . . . . . . . . . . . . . 345.7 Steel-Concrete interface model adopted from Sánchez et al. (2008) . . . . . . . 355.8 Composite material model (adapted from Oliver et al., 2008). . . . . . . . . . 355.9 Composite material model components (adapted from Oliver et al., 2008). . . 365.10 Slipping-ber model (adapted from Oliver et al., 2008). . . . . . . . . . . . . . 375.11 Slipping-ber model composition (adapted from Oliver et al., 2008). . . . . . . 375.12 Normalized Bond strength as a function of corrosion level for experimental
data of pullout tests (adapted from Bhargava et al., 2007). . . . . . . . . . . . 38
iii

iv LIST OF FIGURES
6.1 2D Structural model. . . . . . . . . . . . . . . . . . . . . . . . . . . . . . . . . 396.2 Cross Sections. (a) Slab solution; (b) I beam solution. . . . . . . . . . . . . . . 406.3 Finite elements discretization around steel rebars. . . . . . . . . . . . . . . . . 416.4 Concrete damaging due to corrosion for slab design solution. . . . . . . . . . . 416.5 Isodisplacement lines for slab design solution. . . . . . . . . . . . . . . . . . . 426.6 Damage and isodisplacement lines for I beam design solution. . . . . . . . . . 426.7 Uncorroded stage force - displacement diagram for slab design solution. . . . . 436.8 Slab design solution results for the uncorroded stage. (a) Damage on Concrete.
(b) Horizontal (x-direction) isodisplacemet lines. (c) horizontal displacementat cross section bottom ber points. . . . . . . . . . . . . . . . . . . . . . . . . 44
6.9 Uncorroded stage force - displacement diagram for I-beam design solution. . . 446.10 I-beam design solution results for the uncorroded stage. (a) Damage on Con-
crete. (b) Horizontal (x-direction) isodisplacemet lines. (c) horizontal dis-placement at cross section bottom ber points. . . . . . . . . . . . . . . . . . . 45
6.11 Coupling Strategy. (a) Dening regions with d = 1. (b) computing Averagedamage distribution along cross section depth. (c) Coupling the cross sectiondamage results with the 2D longitudinal model. . . . . . . . . . . . . . . . . . 46
6.12 Force - displacement diagram for slab design solution and for several corrosionlevels Xp. . . . . . . . . . . . . . . . . . . . . . . . . . . . . . . . . . . . . . . 47
6.13 Force - displacement diagram for I-beam design solution and for several cor-rosion levels Xp. . . . . . . . . . . . . . . . . . . . . . . . . . . . . . . . . . . . 47
6.14 Normalized peak load carrying capacity F/Fmax and bond strength(σi
y)corroded
(σiy)uncorroded
as a function of the corrosion level Xp. . . . . . . . . . . . . . . . . . . . . . . 486.15 Normalized peak load carrying capacity F/Fmax as a function of normalized
bond strength deterioration Dσiy. . . . . . . . . . . . . . . . . . . . . . . . . . 49

Abstract
The deterioration of existing structures has been a growing concern in the last
decade. Signicant attention has been paid to the deterioration of bridges, since
signicant costs in repair and replacement are expected in the next decades.
At the same time structural robustness seems to be an emergent concept related
to the structural response to damage. At the present time, robustness is not well
dened and much controversy still remains around this subject.
This report intends to be a contribution to the denition of structural robustness
especially in the analysis of reinforced concrete structures subjected to corrosion.
To achieve this, rst of all, several proposed robustness denitions and indicators
and misunderstood concepts will be analyzed and compared. From this point and
regarding a concept that could be applied to most type of structures and damage
scenarios, a robustness denition is proposed.
To illustrate the proposed concept, some example of corroded reinforced concrete
structures will be analyzed using nonlinear analysis numerical methods based on a
continuum strong discontinuities approach and isotropic damage models for concrete.
Finally the robustness of the presented examples will be assessed and compared.
1


Chapter 1
Introduction
Tragic events such as the partial collapse of Ronan Point building (London, UK - 1968)or most recently the collapse of the World Trade Center (New York, USA - 2001) andthe I-35W Mississippi River bridge (Minneapolis, USA - 2007), among others, increasedthe attention of engineers, but also the society, to the safety, reliability and robustness ofstructures.
Figure 1.1: Ronan Point (London, UK - 1968).
Ronan Point was a 23-storey tower block in Newham, East London, which suereda fatal partial collapse due to a natural gas explosion on a kitchen located on a cornerat on the 18th oor of the building (Figure 1.1). The Ronan Point tower consisted ofprecast panels joined together, without any structural frame, and thus lacked alternateload paths to redistribute forces in the event of a partial collapse. When the structurewas dismantled, investigators found poor workmanship of the critical connections betweenthe panels. The already shaky structure had been further weakened by the inadequateconstruction practices (Pearson et al., 2003). The structure was described by Levi and
3

4 CHAPTER 1. INTRODUCTION
Salvadori (1992) as a "house of cards".
Figure 1.2: September 11 (New York, USA - 2001).
The collapse of World Trade Center Towers on September 11, Figure 1.2, was triggeredby an impact of two commercial aircrafts that damaged partially the perimeter steeltube design. In spite of the redundancy of the system the prolonged exposure to hightemperatures lead to additional steel connection failures, resulting in failure of criticaloor over the already weaken oor below. This started a chain reaction leading to theoverall ruin of the towers (Eagar and Musso, 2001).
The initiating event in the collapse of the I-35W bridge (Figure 1.3) was the lateralshifting instability of the upper end of a diagonal member and the subsequent failure ofa gusset plates (Figure 1.4) on the center portion of the deck truss. Since the deck trussportion of the I-35W bridge was non-load-path redundant, the total collapse of the decktruss was likely once the gusset plates failed (NTSB, 2008).
What seems to be common to these cases is the occurrence of consequences dispro-portionate to the initial cause or damage.
Society is demanding robust and reliable structures, but what society needs to takeconscience is that no building system can be engineered and constructed to be absolutelyrisk-free in the presence of numerous sources of uncertainties that arise in the buildingprocess or from potential failure-initiating events. Building codes and standards justprovide tools for structural engineers to manage risk in the public interest (Ellingwoodand Dusenberry, 2005).

Robustness of Corroded Reinforced Concrete Structures 5
Figure 1.3: I-35W Mississippi River bridge collapse (Minneapolis, USA - 2007).
Most modern structural design codes provide detailed direction for verifying if a designis acceptable with regard to individual failure modes, which in most cases, relate todamage of individual structural components. Unfortunately the codes are far less specic,regarding requirements for reliability against system failure (Baker et al., 2008). Often,the stated requirement is that structural systems should be robust but a precise denitionof structural robustness still does not exist.
This limitation is more important as most structural failures are due to unexpectedloads, design errors, errors during execution, unforeseen deterioration and poor mainte-nance which can not be prevented using conventional component based code checkingformats (Canisius et al., 2007).
Figure 1.4: Gusset plate used to unite multiple structural members of a truss (adaptedfrom NTSB, 2008).
Regarding this scenario, the question arises of what can be done to improve this

6 CHAPTER 1. INTRODUCTION
situation, since there are no risk free structures, actual design codes do not regulateagainst system failures and the main causes of structural collapse can not be predictedand avoided.
There are no simple answers for this question, but certainly the risk could be minimizedif structures would be designed to be less vulnerable to local damage no matter what causesit, or in other words if structures would be more robust. To achieve this it is importantto have a precise denition of robustness. Then it would be possible to calibrate it andintroduce it on design codes. After this, comparing dierent design solutions and choosingbetween the more robust would be feasible.
This report intends to be a contribution to the denition of structural robustness. Todo it, rst of all, several proposed robustness denitions and indicators and misunderstoodconcepts will be analyzed and compared. From this point, and regarding a concept thatcould be applied to most type of structures and damage scenarios, a robustness denitionis proposed.To illustrate the proposed concept, some examples of corroded reinforced con-crete structures will be analyzed using methods of nonlinear analysis based on continuumstrong discontinuities approach and isotropic damage models for concrete. Finally therobustness of the presented examples will be assessed and compared.

Chapter 2
Robustness Denition
2.1 Introduction
Several attempts to dene robustness were made by numerous authors, but consensushas still not been reached. Here several proposed denitions for robustness are presented,including some originating from areas other than structural engineering.
Robustness can be dened as:
1. "The consequences of structural failure are not disproportional to the eect causingthe failure" (CEN, 1994).
2. "The ability of a structure to withstand extreme events without being damage toan extent disproportionate to the original cause" (Agarwal et al., 2006).
3. "...dened as insensitivity of a structure to local failure. It's a property of thestructure alone and independent of the possible causes and probabilities of the initiallocal failure" (Starossek, 2008).
4. "...bridge robustness, ability to carry loads after the failure of one of its members"(Wisniewski et al., 2006).
5. "The ability to react appropriately to abnormal circumstances (i.e. circumstances"outside of specications"). A system may be correct without being robust"(Meyer,1997).
6. "The ability of a system to maintain function even with changes in internal structureor external environment" (Callaway et al., 2000).
7. "...robustness is taken to imply tolerance to damage from extreme loads or accidentalloads, human error and deterioration"(Baker et al., 2008).
8. "We call a system robust if it can withstand an arbitrary damage, for example, theloss of a member or degradation in the quality of a member" (Agarwal et al., 2006).
9. "The degree to which a system is insensitive to eects that are not considered inthe design" (Slotine et al., 1991).
10. "Insensitivity against small deviations in the assumptions" (Huber, 1996).
7
8 CHAPTER 2. ROBUSTNESS DEFINITION
As was seen above, several concepts were used to dene structural robustness. Thefundamental concepts are: event, causes, damage, environment, function, consequences.Disproportionate or abnormal were also used but not on a dening sense but instead ona quantifying one.
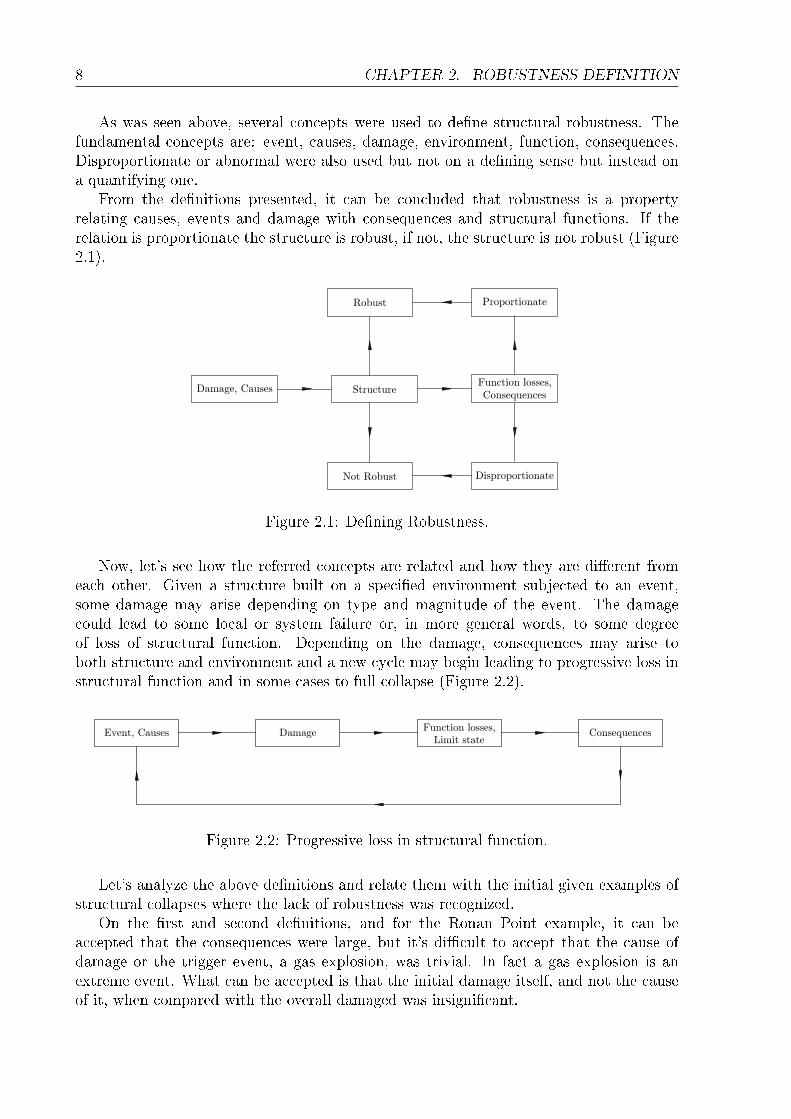
From the denitions presented, it can be concluded that robustness is a propertyrelating causes, events and damage with consequences and structural functions. If therelation is proportionate the structure is robust, if not, the structure is not robust (Figure2.1).
Figure 2.1: Dening Robustness.
Now, let's see how the referred concepts are related and how they are dierent fromeach other. Given a structure built on a specied environment subjected to an event,some damage may arise depending on type and magnitude of the event. The damagecould lead to some local or system failure or, in more general words, to some degreeof loss of structural function. Depending on the damage, consequences may arise toboth structure and environment and a new cycle may begin leading to progressive loss instructural function and in some cases to full collapse (Figure 2.2).
Figure 2.2: Progressive loss in structural function.
Let's analyze the above denitions and relate them with the initial given examples ofstructural collapses where the lack of robustness was recognized.
On the rst and second denitions, and for the Ronan Point example, it can beaccepted that the consequences were large, but it's dicult to accept that the cause ofdamage or the trigger event, a gas explosion, was trivial. In fact a gas explosion is anextreme event. What can be accepted is that the initial damage itself, and not the causeof it, when compared with the overall damaged was insignicant.

Robustness of Corroded Reinforced Concrete Structures 9
According with Starossek (2008), robustness is also related with the initial damage,and not with the "possible causes and probabilities of the initial local failure", being aproperty of the structure.
Although the rst two denitions seem similar, they are slightly dierent. In thesecond one, after the trigger event happens, it's referred the structure ability to maintainfunction and on the rst one, the amount of consequences. The second denition looks justfor the structural response and the rst looks also for the environment, if consequencesare interpreted in a broad sense.
In fact, from these denitions, it results that robustness can be dened as a propertyof both environmental and structure (Figure 2.3).
Figure 2.3: Robustness: structural property vs. property of structure and environment.
If robustness is considered a property of the structure, neither the causes of damagesnor the environmental consequences of the damage can be included in the analysis andonly the structure response and the initial damage should be considered. Denition 4(Wisniewski et al., 2006) focus on this aspect, but limits the damage to a member failure.The point of view adopted in this report is that robustness can be regarded even whenthe damage is something trivial as corroded reinforcement or in much worst situation asdamages resulting from a terrorist attack. Damage would be the same as dened by Yao(1985) and adopted by Frangopol and Curley (1987), i.e., damage refers to any strengthdeciency introduced during design or construction phase of the structure as well as anydeterioration of strength caused by external loading and/or environmental conditionsduring the lifetime of the structure. Thus a constructed structure can be considered tohave an initial damage even before it has been subjected to any environmental loadings.In general then, damage can exist in the initial structure or be imposed upon the structureprogressively or suddenly.
It's also a point of view that when talking about maintaining structural function afterdamage, it can be referred to the preservation of all kind of functions a structure isdesigned for. Denitions number 5, 6, 7, 8, 9 and 10 go on this direction, by not reducingdamage and functions spectrums.
As a conclusion, and if considering only a structural property it can be said thatrobustness is a measure of the degree of structural function loss after damage occurrence.This relation can have many forms, from service limit states to ultimate limit states.

10 CHAPTER 2. ROBUSTNESS DEFINITION
Damage can vary from a simple degradation state to a more serious damage as a columnor a beam failure. Errors during the design or the construction stage can also be seenas types of damages. The concept behind this denition is to limit neither the functionsspectrum nor the damage scenarios.
2.2 Related Concepts
"Continuous, highly redundant structures with ductility tend to absorb local damage well.Other systems, such as large panel or bearing wall systems, pre-cast concrete slabs or steeljoint oors supported on masonry walls, and any building system that is well tied but lacksductility are inherently more vulnerable because of the diculties in providing continuityand ductility in such systems" (Ellingwood and Dusenberry, 2005).
As can be seen the above citation includes important robustness related conceptssometimes used with the same meaning. Here some robustness related concepts denitionswill be proposed without the pretension to give the true ones, but instead the point ofview adopted in this report:
1. Vulnerability - It refers to the damage susceptibility of a structure to environmentalexposure. It's not a structural property. The same structure can be more or lessvulnerable depending on the overall situation. For example the same bridge can bevulnerable to corrosion if it's located on a maritime environmental but not vulnera-ble if it's located on chloride free environment. Another example, "a wooden houseis less likely to collapse in an earthquake but it may be more vulnerable in the eventof a re" (Agarwal et al., 2006).
2. Damage Tolerance - Can be viewed as robustness synonymous. It's the ability tomaintain structural performances after damage occurrence.
3. Progressive Collapse - On some structures damage on a component will overloadanother component that will become also damage initiating an overloading/damagechain reaction that leads to structure collapse. Progressive collapse is dicult topredict since it is associated with non-linear and dynamic behavior of the structure.If structural behavior under damage is hard to predict, the dynamic behavior underdamage it's even harder. Robust design will minimize the risk of progressive collapsebecause the initiation of the chain reaction of overloading and damage is avoided.
4. Static Indeterminacy - It's the number of restrains and constrains above the mini-mum absolutely necessary to achieve an equilibrium conguration under any kindof load arrangement. Static Indeterminacy is a structural property.
5. Redundancy - As dened by Frangopol and Curley (1987), redundancy refers to themultiple availability of load-carrying paths a structure contains. As it depends onthe load is not the same as static indeterminacy but is intently related to it. Astructure can provide several load-carrying paths for one kind of load arrangementand few, or even none, for another dierent load conguration. The ability toprovide a specic load-carrying path may depend on the competence to deform.

Robustness of Corroded Reinforced Concrete Structures 11
6. Flexibility - It's related with the structure ability to suer elastic and reversibledeformations.
7. Ductility - It's related with the structure ability to suer plastic deformations withenergy release.
8. Reliability - Refers to the probability of not exceeding limit state functions. Onthe other hand, robustness, as used in this report, is similar but is related with notexceeding limit state functions under a damage condition.


Chapter 3
Robustness Assessment
Since robustness is a desirable structural property for structural systems, it is paramountto be able to assess it, in order to compare between dierent design solutions and tochoose the more adequate in a given context. If robustness could be assessed it would bepossible to optimize it during design process.
In the following sections, several authors attempts to assess robustness or other relatedconcepts are presented.
3.1 Frangopol and Curley, 1987
Frangopol and Curley (1987) analyzed the eects of damage and redundancy on structuralsystems proposing both deterministic and probabilistic measures for the latter.
On the deterministic approach the measure of redundancy is the reserve strengthbetween components damage and system collapse, and can be dened by the followingexpression:
R =LIntact
LIntact − Ldamaged(3.1)
where LIntact is the overall collapse load of the structure without damage and can becomputed through plastic methods of structural analysis. Ldamaged is the overall collapseload of the structure considering some damage in one or more members. The redundancyfactor is equal to 1 when the damaged structure has no reserve strength and is innitewhen the damage has no inuence on the reserve strength of the bridge.
To account for the random nature in safety evaluation of damaged structures, Fran-gopol and Curley (1987) also propose a probabilistic redundancy factor βR dened by:
βR =βIntact
βIntact − βdamaged(3.2)
where βIntact is the reliability index of the intact system and βdamaged is the reliabilityindex of the damaged system. Similarly, if probabilistic redundant index takes valuesclose to innite then structure is very robust. If probabilistic redundant index assumesvalues close to 1 that means robustness is null.
13

14 CHAPTER 3. ROBUSTNESS ASSESSMENT
3.2 Lind, 1995
Lind (1995) proposes quantitative measures of vulnerability and damage tolerance of asystem. In his point of view, vulnerability and damage tolerance are complementaryconcepts. If a system is vulnerable it is not damage tolerant and vice versa.
As can be seen vulnerability here has a dierent sense than the adopted on the previouschapter. In this report vulnerability was dened as the susceptibility to environmentalexposure and Lind denes it as the damage tolerance, what was dened as robustness.
The vulnerability V of a system is dened as:
V =P (r0, S)
P (rd, S)(3.3)
where rd is the resistance of the damaged system, r0 is the resistance of the intact system,and S is the loading. P (r, S) is the probability of system failure as a function of botheect of loading and resistance. The vulnerability V of a system can vary from zero toinnite, if the damage has null or huge impact on system resistance, respectivelly.
On the other hand damage tolerance Td can be viewed as the inverse of vulnerabilityV :
Td =P (rd, S)
P (r0, S)(3.4)
As explained later, Lind's indicator to assess robustness is very similar to the one suggestedby Frangopol and Curley (1987). They represent a form to measure robustness as aproperty of the structure with the advantage that can be applied to any kind of damageand structural performance.
3.3 Ghosn and Moses, 1998
Ghosn and Moses (1998) focused on bridges, dening redundancy as the ability of thestructure to continue to carry load after the failure of one of its members. Redundancyis dened as described on Chapter 2 if damage corresponds to the member failure andfunction matches to load carrying capacity.
As a matter a fact what Ghosn and Moses (1998) proposed is an entire methodologyto assess, not just the member, but all system safety. It is assumed that a bridge may beconsidered safe from a system view point if:
• it provides a reasonable safety level against rst member failure;
• it does not produce large deformations under regular trac conditions;
• it does not reach its ultimate system capacity under extreme loading conditions;
• it is able to carry some trac loads after damage or the loss of a main load-carryingmember.
Therefore, the following states should be checked to insure adequate bridge redundancyand system safety:

Robustness of Corroded Reinforced Concrete Structures 15
1. Member failure limit state: this is the traditional check of individual member safetyand the corresponding level of safety may be represented by the reliability indexβmember.
2. Serviceability limit state: this is dened as a maximum live load displacement ac-counting for the nonlinear behavior of the bridge system which correspond the valueof βserv.
3. Ultimate limit state: this is the ultimate capacity of the bridge system against theformation of a collapse mechanism which correspond the value of βult.
4. Damaged condition limit state: this is dened as the ultimate capacity of the bridgesystem after the complete removal of one main load carrying component from thestructural model. The value of βdamaged is dened in this situation.
The incorporation of system behavior to the safety assessment in the mentionedmethod is done by the relative reliability indices ∆βi, which are dened as the dier-ence between the safety indices for the system and the safety index for the member.In order to guarantee the bridge safety, the obtained relative reliability indices must begreater than the corresponding target values and, at the same time, the member safetyhas to be ensured. The safety format should take the form above:
βult = ∆βult + βmember ≥ ∆βulttarget + βmembertarget = βulttarget (3.5)
βserv = ∆βserv + βmember ≥ ∆βservtarget + βmembertarget = βservtarget (3.6)
βdamaged = ∆βdamaged + βmember ≥ ∆βdamagedtarget + βmembertarget = βdamagedtarget (3.7)
Ghosn and Moses (1998) go further by proposing target system values for the referredreliability indices for highway bridges. For bridges superstructures the proposes targetsare:
∆βult = βult − βmember ≥ 0.85 (3.8)
∆βserv = βserv − βmember ≥ 0.25 (3.9)
∆βdamaged = βdamaged − βmember ≥ −2.70 (3.10)
Later, Liu et al. (2001) recommended for highway bridges substructures the followingtargets:
∆βult = βult − βmember ≥ 0.50 (3.11)
∆βserv = βserv − βmember ≥ 0.50 (3.12)
∆βdamaged = βdamaged − βmember ≥ −2.00 (3.13)
3.4 Baker et al., 2008
Baker et al. (2008) proposed a risk-based interpretation for robustness. Robustness isassessed by computing both direct risk, which is associated with the direct consequencesof potential damages to the system, and indirect risk, which corresponds to the increasedrisk of a damaged system. Indirect risk can be interpreted as risk from consequencesdisproportionate to the cause of damage, and so robustness of a system is indicated by

16 CHAPTER 3. ROBUSTNESS ASSESSMENT
the contribution of these indirect risks to total risk. The robustness index IRob is thendened as:
IRob =RDir
RDir +RInd
(3.14)
and measures the ratio between direct risk and total risk. The index may assume valuesbetween zero and one. If the system is completely robust IRob is equal to one, if all riskis due to indirect consequences, then IRob is equal to zero.
To assess both direct and indirect risk, decision analysis theory and event tree formu-lation can be used (Figure 3.1):
Figure 3.1: Event Tree (adapted from Baker et al., 2008).
First, an exposure EXBD occurs which has the potential of damaging components inthe system. If no damage D occurs, then the analysis is nished. If damage occurs, avariety of damage D states can result. For each of these states, there is a probability thatsystem failure results F . Consequences are associated with each of the possible damageand failure scenarios.
To assess system risk the consequences associated to each scenario are multiplied byits occurrence probability, and then integrated over all the event space in the event tree.The risk corresponding to each branch is then:
RDir =
∫x
∫y
CDirfD|EXBD(y|x)fEXBD
(x)dydx (3.15)
RInd =
∫x
∫y
CIndP (F |D = y)fD|EXBD(y|x)fEXBD
(x)dydx (3.16)
where RDir and RInd are respectively the risk associated with direct (CDir) and indirect(CInd) consequences, fD|EXBD
is the damage subjected to a given exposure probabilitydensity function, fEXBD
is the exposure probability density function and P (F |D = y) isthe failure probability given a certain damage.
An exposure is considered to be any event that may cause potential damage to thesystem, from design loads, to accidental loads such as explosion or terrorist attacks orsomething more trivial such as exposure to agents that can cause deterioration. Damagerefers to any performance reduction of structural components such as member failure,excessive deformation or material deterioration, among others. Likewise system failuremay correspond to eective failure or just to a decrease on system performance.

Robustness of Corroded Reinforced Concrete Structures 17
As can be seen, the robustness denition proposed by Baker et al depends on environ-ment and so cannot be considered only as a structural property. The same structure mayhave dierent robustness in dierent contexts. In addition the robustness of a structuremay vary depending on changes (socio-economical) on the environment. So, over time, astructure that was robust may become not robust.
3.5 Biondini and Restelli, 2008
According to Biondini and Restelli (2008), robustness evaluations are usually relatedto damage suddenly provoked by accidental actions, like explosion or impacts. However,damage could also arise slowly in time from aging of structures, as induced, for example, byenvironmental aggressive agents. In this context, it is of great interest to develop suitablelife-cycle measures of structural robustness with respect to a progressive deterioration ofthe structural performance.
Figure 3.2: Truss system undergoing damage of one member (adapted from Biondini andRestelli, 2008).
Biondini and Restelli (2008) have the same perspective than the one adopted in thisreport for robustness. In fact when discussing structural robustness, it can be consideredany event that may cause damage, from extreme events to just ordinary ones such anenvironmental exposure causing corrosion. Likewise damage could also be somethingsimple for instance a member failure due to corrosion. The same occurs with structuralperformances which could be something such as system failure or more trivial such as anincrement on the deformations.
The damage considered is the deterioration of section member by corrosion. For thedamaged member an external layer of uniform thickness t is removed. Therefore, theamount of damage can be specied by means of the damage index δ = t/r ∈ [0; 1].
To assess robustness the authors compared several structural performance indicatorson pristine and on damage state. The indicators used were, among others, several stinessmatrix properties, displacements, internal energy measures and pseudo-loads.

18 CHAPTER 3. ROBUSTNESS ASSESSMENT
Figure 3.3: Results using displacement and considering the deterioration of all memberseach at a time (adapted from Biondini and Restelli, 2008).
On Figure 3.3 the results are presented using displacement at the point of force appli-cation and considering the deterioration of all members each at a time. As can be seenthe structure is full robust if the deterioration on member number 2 is considered. Thestructure is more susceptible in terms of displacement if member number 5 is corroded.
3.6 Starossek, 2008, 2009
According to Starossek (2008, 2009), progressive collapse resistance can be inuenced invarious ways. One possibility is trough the structural robustness. In a robust structure,no damage disproportionate to the initial failure will occur.
In terms of probabilities, progressive collapse may be represented as a chain of partialprobabilities:
P (F ) = P (F |D)× P (D|E)× P (E) (3.17)
where P (F ) is the probability of progressive collapse occurrence due to an event E and Drepresents any kind of damage.
Starossek denes robustness as a property of structure and associated with the termP (F |D). If a structure is robust the probability of failure will not be too much aectedby damage occurrence. Robustness here has essentially the same concept adopted inChapter 2, i.e., robustness concerns about structural response or performance under adamage state.
Having in mind that structural property denition, Starossek also proposes some nonprobabilistic measures for robustness as follows (Starossek, 2009).
Robustness of Corroded Reinforced Concrete Structures 19
3.6.1 Damage Based Robustness Measure I
The rst robustness based measure is given by the expression bellow:
Rd = 1− p
plim(3.18)
where Rd is the damage based measure of robustness, p is the maximum total damageresulting from the assumable initial damage and plim is the acceptable total damage. Avalue of one indicates perfect robustness and negative values indicate that the designobjectives are not met.
3.6.2 Damage Based Robustness Measure II
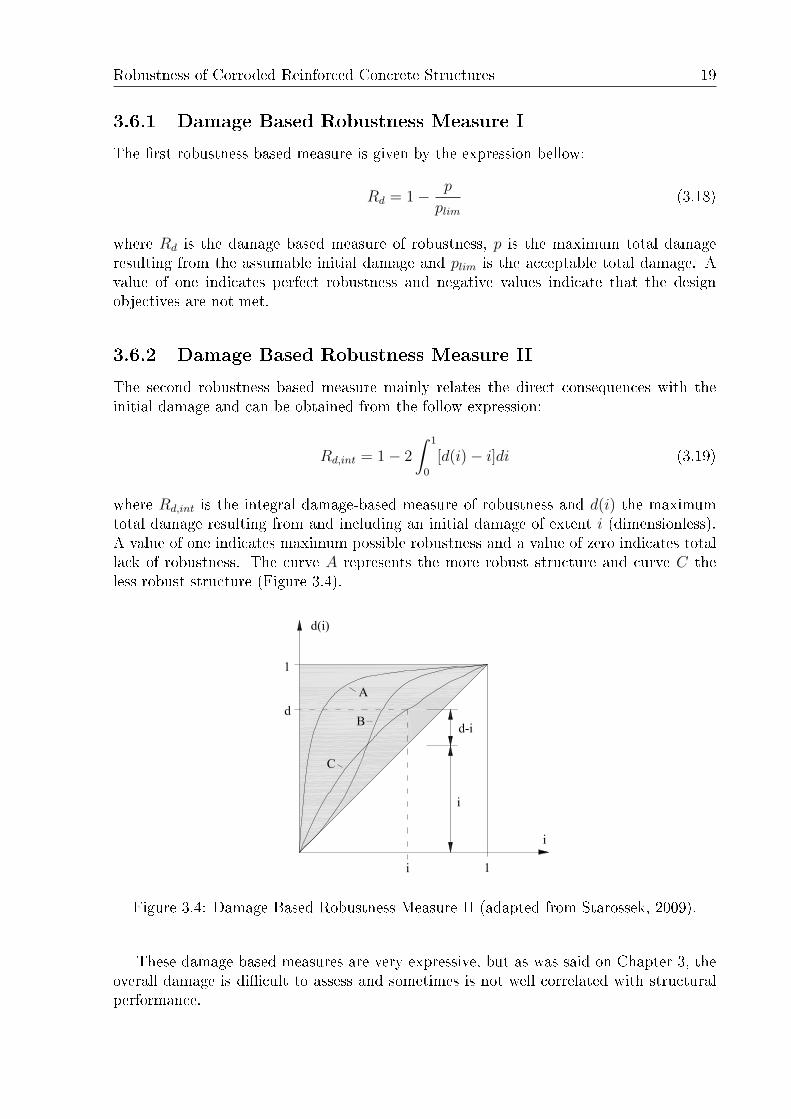
The second robustness based measure mainly relates the direct consequences with theinitial damage and can be obtained from the follow expression:
Rd,int = 1− 2
∫ 1
0
[d(i)− i]di (3.19)
where Rd,int is the integral damage-based measure of robustness and d(i) the maximumtotal damage resulting from and including an initial damage of extent i (dimensionless).A value of one indicates maximum possible robustness and a value of zero indicates totallack of robustness. The curve A represents the more robust structure and curve C theless robust structure (Figure 3.4).
Figure 3.4: Damage Based Robustness Measure II (adapted from Starossek, 2009).
These damage based measures are very expressive, but as was said on Chapter 3, theoverall damage is dicult to assess and sometimes is not well correlated with structuralperformance.

20 CHAPTER 3. ROBUSTNESS ASSESSMENT
3.6.3 Stiness Based Robustness Measure
The stiness based robustness measures proposed stands on a structural property insteadof damage and can be computed using the expression bellow:
Rs = minjdetKj
detK0
(3.20)
where Rs is the stiness based measure of robustness, Kj the active system stiness matrixof structure after removing a structural element or constraint j and K0 the active systemstiness matrix of the intact structure. Although this measure is based on a structuralproperty it may be not very expressive because it does not correlates always well withthe pretended design performances such as load carrying capacity. On the other hand it'seasy to calculate.
3.6.4 Energy Based Robustness Measure
More appropriated to impact type progressive collapses, Starossek (2009) proposed anenergy based robustness measure given by the follow equation:
Rs = 1−maxjEr,jEf,k
(3.21)
where Re represents the energy based robustness measure, Er,j is the energy releasedduring initial failure of structural element j and contributing to damaging a subsequentlyaected element k and Ef,k is the energy required for failure of subsequently aectedelement k. A value equal to 1 indicates perfect robustness and negative values indicatefailure progression. According with Starossek (2009), usually Er,j is dicult to calculate.

Chapter 4
Proposing a Robustness Index
4.1 Proposed Robustness Indexes
The main objective of this chapter is to analyze the proposed measures for robustnessand try to describe the relations between them. Almost all authors referred adopted thestructural property perspective, i.e., robustness may be calculated without having in mindstructural environment. An exception is Baker robustness index equation 3.14:
IRob =RDir
RDir +RInd
(3.14)
This index depends on structural environmental because both direct and indirect risksdepend on exposure and indirect consequences depend on environment.
Although this index is more complete and is able to reect the all process from exposureto consequences it is very dicult to quantify robustness if concepts such as exposure orconsequences, that are also dicult quantify, are employed. A structural engineer wouldfeel much more comfortable if he only would have to deal with structural concepts. Thisis the major advantage of dening robustness as structural property. On the other handfor the computation of Baker's robustness index, structural response under damage hasalways to be known.
Figure 4.1: Barrier Model (adapted from Sorensen and Christensen, 2006).
To illustrate the above idea one can use the barrier model from Haddon (1980), Ersdal(2005) and Sorensen and Christensen (2006) that represent the structural collapse to a
21

22 CHAPTER 4. PROPOSING A ROBUSTNESS INDEX
determined exposure (Figure (4.1).The rst barrier protects the structure from environment aggressions and may consist
of more general measures including detailed and independent quality control of bothdesign and construction, assessment of loads and design parameters and modeling.
The second barrier deals with the behavior of structural system under damage. Theway to enhance this barrier is to design structures robustly and more damage tolerant.
Recalling equation (3.17), it can be said that rst barrier acts by reducing the termP (D|E) and for common exposure such as design loads is regulated in standards andcodes. The second barrier acts by reducing the term P (F |D) and has not yet beenintroduced in standards and codes on a quantitative form. The term P (E) for accidentalloads and unpredictable exposures it's dicult to manage.
The robustness denition adopted in this report is related only with the second barrier.Instead, Baker's robustness index takes into account with both barriers and goes furtherby making possible a third barrier between collapse and indirect consequences. This wouldbe possible by introducing a new term, P (C|F ), in equations 3.15 and 3.16.
Now let's see how the referred robustness measures relate them selves by using theevent tree on Figure 4.2.
Based on the above event tree the probabilistic measures proposed by Frangopol andCurley, Lind and Ghosn and Moses can be rewritten:
• Frangopol and Curley (1987) redundancy index:
βR =βIntact
βIntact − βdamaged=
φ(1− P (F ))−1
φ(1− P (F )))−1 − φ(1− P (F |D))−1(4.1)
• Lind (1995) vulnerability index:
V =P (r0, S)
P (rd, S)=
1− P (F )
1− P (F |D)(4.2)
• Ghosn and Moses (1998) target system values:
If damage, D, represents member failure, Ghosn and Moses (1998) target systemmay be rewritten in follows forms,
∆βult = βult − βmember = φ(1− P (F ))−1 − φ(1− P (D|E)P (E))−1 ≥ 0.85 (4.3)
and
∆βdamaged = βdamaged−βmember = φ(1−P (F |D))−1−φ(1−P (D|E)P (E))−1 ≥ −2.70(4.4)
If failure, F , represents excessive deformation instead, the above expression can besuggested:
∆βserv = βserv − βmember = φ(1− P (F ))−1 − φ(1− P (D|E)P (E))−1 ≥ 0.25 (4.5)
From the above expressions the follow conclusion can be extracted. The indexesproposed by Frangopol and Curley (1987) and Lind are almost the same, represent a

Robustness of Corroded Reinforced Concrete Structures 23
Figure 4.2: Event Tree (* Stiness based measure; ** Damaged based measures).

24 CHAPTER 4. PROPOSING A ROBUSTNESS INDEX
relation between the failure probability of the intact and damage system and refer onlyto the second barrier of the event tree.
Ghosn and Moses (1998) proposal go further by introducing the therms P (E) andP (D|E) related with member and reecting the rst barrier. Ghosn and Moses (1998)also propose values for the target limits although just for highway bridges.
Baker et al. (2008) index also accounts with both direct and indirect consequencesresulting from damage and collapse and for that it is a risk measure.
Biondini and Restelli (2008) analyze the structural behavior when system is subjectedto a continuous damage scenario. The authors attempt to describe the relation betweenstructural performance and damage. So, if F represents a performance indicator of struc-tural behavior and D the damage, the referred approach can be synthesized on the followform:
ρ =F (D = d)
F (D = 0)(4.6)
where ρ is the robustness indicator that depends on the structural performance indicatorstudied and on the level of damage.
This framework reveals of great interest when damage is a continuous variable asoccurs in many real situation such as damage resulting from deterioration or excessivedeformation, among others. The extension to a probabilistic measure is also possibleif damage could be considered as a random variable. The probabilistic measure shouldresult on the above expression:
ρ =P (F |D = d)
P (F |D = 0))(4.7)
which is the inverse of the Vulnerability index as dened by Lind.Regarding Starossek (2009) measures, it can be said that the rst two (damage based
robustness measure I and II) mainly measure the direct consequences Cdir resulting froman initial damage D. Although they are deterministic, these measures can by very usefulwhen computing Baker et al. (2008) robustness index.
The stiness based robustness measure proposed by Starossek (2009) reects thechanges on structural behavior when damage occurs and for that is closer to Biondiniand Restelli (2008) proposal. The energy based robustness measure is more appropriateto predict a progressive collapse but it is dicult to generalize.
In conclusion it can be said that, from the analyzed measures for robustness, Frangopoland Curley (1987); Lind (1995); Biondini and Restelli (2008); Starossek (2009) (only thestiness based measure) measures are more concerned with structural performance. Theother ones attempt to quantify also the consequences resulting from the losses on struc-tural performance resulting from an initial damage. When combined with probabilitiesthese are risk measures.
4.2 Proposing a Robustness Index
So robustness as dened here in this report pretend to describe behavior of structuresafter damage occurs. If concern is about a specic structural function F and if a specicdamage D is considered, a useful form to measure robustness would be a robustness index

Robustness of Corroded Reinforced Concrete Structures 25
βR(F,D) dened as:βR(F,D) = φ [1− P (F |D)]−1 (4.8)
This index could be calibrated for dierent performances F and damages D dependingon structural type and exposure. Alternatively one may want a unique robustness in-dex independent of damage or performance. In that case the follow expression may besuggested:
βR = φ
[1−
∫x
∫y
fF |D(y|x)dydx)
]−1
(4.9)
In this case F and D would represent the overall design performance functions and damagescenarios respectively.
Regard that equation 4.9 is very similar to equation 3.16 without the terms CInd,fD|EXBD
and fEXBD.
Although Starossek (2009) and Biondini and Restelli (2008) do not present probabilis-tic measures the concept would be easily extended as presented by Frangopol and Curley(1987) with the deterministic redundancy factor R and the probabilistic redundancy factorβR.
The main idea of a deterministic approach would be to compare specic performanceindicators F with the structure intact (D = 0) and damaged (D = d):
R(f,D) = R [F (D = 0), F (D = d)] (4.10)
where R would be a robustness factor. The form of R would be dened depending on theperformance in study.
Figure 4.3: Normalized structural response as a function of normalized damaged.
When damage D is a continuous variable it would be preferable to analyze the degreeof performance lost across the overall dominium of D. In this case the follow index maybe suggested:
R =
∫ 1
0
fd(x)dx (4.11)

26 CHAPTER 4. PROPOSING A ROBUSTNESS INDEX
where fd is the normalized response of the structure obtained by the ratio FD/F0 as afunction of the normalized damage variable obtained by the ratio D/Dmax.
In this case the robustness index would vary from zero to one with correspondencewith extreme cases A and E respectively. For curve A, a minimum damage would lead tototal performance lost, and for curve E only the maximum damage possible would causesome dierence on structural response. The curve C would represent reference robustnessof 1/2.
On Figure 4.3 in all cases represented the maximum damage leads to total lost onstructural performance. This methodology is also valid in other situations where themaximum damage does not correspond to total lost in performance or in situations wherethe collapse happens before maximum damage occurs.

Chapter 5
Corroded reinforced concrete structures
- Methodology
5.1 Introduction
The main objective of this chapter is to present an example of robustness assessmenton a typical structure. As was discussed in the previous chapter, the denition adoptedconsiders robustness as a property of the structure. Robustness measures the variance onstructural performance as a function of damage. This can be done on a probabilistic ordeterministic framework.
The damaged scenario considered on this chapter will be deterioration of reinforcedconcrete structures due to corrosion. Structural response to ultimate limit states such asload carrying capacity will be studied.
To represent adequately eects of corrosion on reinforced concrete structures it is nec-essary to take account with some undesirable mechanisms such as net area reduction ofreinforcement and expansion around reinforcements due to corrosion products accumula-tion. This last phenomenon leads to damage, cracking and splitting of the surroundingconcrete and degradation of steel-concrete bond responsible for stress transfer betweenboth materials.
To perform such a study, an advanced nite elements methodology will be used coupledwith advanced constitutive models for materials. First an analysis of the corroded crosssection will be carried out, subsequently the results obtained will be used to enrich a 2Dmodel of the structure with the properties of the deteriorated section.
The competence of the referred methods to reproduce the behavior of corroded rein-forced concrete was demonstrated by comparing obtained numerical results with resultsobtained experimentally (Sánchez et al. (2008)).
The following sections are not intended to be an exhaustive and complete explanationof the models and methodologies used. A brief explanation of the tools used will bepresented in order to show how they can be used to simulate the behavior of corrodedreinforced concrete. Full details can be found in Sánchez et al. (2008) and Oliver et al.(2008).
27

28 CHAPTER 5. METHODOLOGY
5.2 Finite element methodology
On this section the advanced nite element methodology used to simulate corrosion phe-nomenon will be briey explained. This methodology was introduced by Sánchez et al.(2008) and Oliver et al. (2008), where a full and detailed explanation can be found.
The methodology employed considers a two-step analysis. In the rst step a niteelement analysis of the structure cross section is carried out. In this analysis the formationand accumulation of corrosion products are simulated by an expansion of steel bars (Figure5.1). Steel bars are modeled using a linear elastic constitutive relation and they arecoupled to concrete through an interface model that regulates the shear stress transferencebetween the two materials. For concrete, an isotropic continuum damage model was usedenriched with kinematics provided by the strong discontinuities theory. The combinationof these two approaches, for modeling concrete behavior, permits the development ofcracking caused by corrosion as a result of concrete deterioration (Figure 5.1 (c)). Theresults obtained during the cross section analysis are than used to build a 2D structuralmodel.
To model reinforced concrete a continuum strong discontinuity approach coupled withmixture theory as described in Oliver et al. (2008) was used. The mixture theory consistson modeling reinforced concrete as a composite material, constituted by a plain concretematrix reinforced with embedded long ber bundles which represent the steel bars. Matrixfailure is modeled on the basis of the continuum damage model enriched with the resultsprovided by the cross section analysis. For the steel bars an elasto-plastic with slipping-ber option model was used.
The degradation of bond between concrete and steel bars, as a result of corrosion,plays an important role on load carrying capacity. To account for that, an empiric modelof bond degradation presented by Bhargava et al. (2007) was used to complement theslipping-ber model used on the structural analysis. At the same time the reduction of
Figure 5.1: Plane strain 2D model: (a) Corrosion expansion mechanism. (b) Numericalmodel idealization. (c) Typical pattern of cracks. (adapted from Sánchez et al., 2008)

Robustness of Corroded Reinforced Concrete Structures 29
reinforcement area was taken in account as a function of corrosion depth X.On Figure 5.2, a uxogram represents schematically the methodology used.On the next sections a more detailed explanation of the models features will be pre-
sented
5.3 CSDA - Continuum Strong Discontinuity
Approach (Oliver et al., 2002; Oliver and Huespe,
2004)
As earlier described, steel expansion, resulting from corrosion products accumulation,produces cracking and splitting on surrounding concrete. Concrete cracks are, from amacroscopical point of view, discontinuities that can be characterized as jumps on thedisplacement eld across material, denoted also as strong discontinuities.
In the context of traditional Continuum Mechanics dealing with discontinuities isa hard task, so since the ultimate load carrying capacity is largely inuenced by theformation and pattern of cracking, an advanced methodology with competences do dealwith cracking eectively had to be chosen.
The continuum strong discontinuity approach (CSDA) is an advanced and recentmethodology which is equipped with recent and advanced ingredients in order to make itan ecient and robust strategy for solving complex three-dimensional multi crack prob-lems.
According with CSDA methodology if a body H experiences a strong discontinuity(i.e., a crack formation) across the surface S described by the normal n, the displacementeld will experience a jump (Figure 5.3). If the surface S divides the solid in two domainsΩ+ and Ω− then the displacement u(x) and the compatible strain eld ε(x) may be writtenin the form:
u(x) =
continuous︷︸︸︷u(x) +
discontinuous︷ ︸︸ ︷HS(x)JuK(x) ; HS(x) =
1 ∀ x ∈ Ω+
0 ∀ x ∈ Ω−(5.1)
ε(x) = ∇symu(x) = ε(x)︸︷︷︸regular
+ δS(x) (JuK⊗ n)sym︸ ︷︷ ︸singular
(5.2)
where u(x) is a continuous function, JuK(x) represents the displacement jump across thediscontinuity S and HS(x) is the step function. The strain eld shows a singular term,the second one in equation (2), given by the Dirac's delta distribution δS(x).
The above strategy, to include strong discontinuities, refers only to the kinematicsaspect of the problem but it is possible to couple it with an eective constitutive relationto adequately represent concrete behavior.
5.4 Isotropic Continuum Damage Model (Oliver
et al., 1990)
Concrete exhibits a complex constitutive behavior especially in the neighborhoods ofcracking. Continuum Damage Models have been widely accepted as an alternative to

30 CHAPTER 5. METHODOLOGY
Figure 5.2: Corrosion analysis methodology uxogram.

Robustness of Corroded Reinforced Concrete Structures 31
Figure 5.3: CSDA kinematics. Jump on displacement eld (adapted from Oliver et al.,2006).
deal with this complex behavior.On of the main concepts of continuum damage mechanics is consideration that phys-
ically the degradation of material properties is the result of the initiation, growth andcoalescence of micro cracks or micro voids. One may model this process by introduc-ing an internal damage or deterioration variable d, which can be a scalar or a tensorialquantity.
Figure 5.4: Equilibrium of a damaged section.
The equilibrium of the damaged section on Figure 5.4 may be written on the followform:
N = σ · S = σ · S (5.3)
where N is the tension force, σ is the homogenized apparent stress, S is the total nominalarea surface, S is the eective surface and σ the eective stress. Based on the above

32 CHAPTER 5. METHODOLOGY
expression one may write:
σ =S
S· σ =
S − SdS
· σ =
(1− Sd
S
)· σ = (1− d) · σ (5.4)
where Sd is the damaged area. On a one-dimensional problem d physically represents theratio of damage surface over total surface area at a local material point (equation 5.5) and(1− d) is a reduction factor that relates eective with homogenized and apparent stress.
d =SdS
(5.5)
As the eective stress is given by:
σ = E · ε (5.6)
where E is concrete Young's modulus and ε is the strain, equation 5.4 can be rewrittenon the follow form:
σ = (1− d) · E · ε = Ed · ε (5.7)
When d takes zero value it corresponds to undamaged state. When d is equal to one itmeans completely damaged stage is reached. When d is a scalar variable, it representsan isotropic damage case, i.e., the mechanical behavior of micro cracks is independent oftheir orientation.
Another aspect of interest of the isotropic continuum damage model is that damagesurface Sd cannot diminish, which implies that:
Sd ≥ 0⇒ d ≥ 0 (5.8)
where Sd and d represent temporal derivates of both Sd and d.Another important concept of the damage model is that degradation is initiated when
the strain ε (or stress σ) exceeds the initial damage threshold ε0 (σ0):
d = 0 if
ε ≤ ε0or
σ ≤ σ0
(5.9)
Graphically the model can be represented in Figure 5.5 for a uniaxial tension case.Summarizing the isotropic continuum damage model for three-dimensional case:
σ = (1− d)C : ε (5.10)
0 ≤ d ≤ 1 ; d ≥ 0 (5.11)
where σ represents second order stress tensor and C represents the fourth order isotropic
elastic tensor.Now it is important to analyze how damage variable d evolves after degradation is
initiated when the strain or stress reach a specic threshold. An ecient form to do so isdening d as a function of an internal variable r as follows:
d(r) = 1− q(r)
r; 0 ≤ d(r) ≤ 1 (5.12)

Robustness of Corroded Reinforced Concrete Structures 33
Figure 5.5: Isotropic continuum damage model (adapted from Oliver et al., 2002).
where q(r) is a hardening variable that determines how d evolutes and helps dening thedamage criterion, i.e., the elastic domain, which could be dened as:
τ(σ)− q(r) ≤ 0 (5.13)
where τ(σ)is a stress norm dened as:
τ(σ)
=∥∥σ∥∥ (5.14)
The equation 5.13 is the damage criterion and denes the elastic domain. On the three-dimensional case, it represents a damage surface.
The internal variable r variable may be dened as follows:
r ∈ [r0,∞] ; r|t=0 = r0 ; r ≥ 0
when r = r0 corresponds to undamaged state and r = ∞ corresponds to full damagedstate. The time positive derivate of r means that damage cannot decrease.
The hardening variable q(r) denes how material behavior evolves when damage oc-curs. Several possibilities may be considered as can be seen on Figure 5.6. H is thehardening parameter dened by dq(r)/dr. When H is positive the material is hardening,when H is negative the material is softening. Similarly, when H is positive the surfacedened by damage criterion is rising and vice-versa.
5.5 Cross Section Analysis
As earlier describe, in both cross section and 2D longitudinal structural analysis, concretewas modeled by means of an isotropic continuum damaged model combined with a strongdiscontinuity approach. On the cross section analysis steel rebars and interface elementswere modeled as described in the following paragraphs.
5.5.1 Steel bar model
During the deterioration analysis of the corroded cross section a standard linear elasticconstitutive relation was assumed for the steel bars. The corrosion products accumulation

34 CHAPTER 5. METHODOLOGY
Figure 5.6: Material hardening and softening.
and expansion eect was simulated by a volumetric deformation of the steel bars ε0.Assuming a plain strain state, the total strains ε can be obtained by the sum of thestrains due to stresses εe and due to the referred volumetric expansion ε0:
ε = ∇symu(x) =
εxxεyyγxyεzz
=
εxxεyyγxy0
=
εe︷ ︸︸ ︷1E
(σxx − νσyy − νσzz)1E
(σyy − νσzz − νσxx)21+ν
Eσxy
1E
(σzz − νσxx − νσyy)
+
ε0︷ ︸︸ ︷DD00
(5.15)
The variable D represent the dilational component, depends on the corrosion attack depthX and can be obtained from the follow expression:
D =R2f −R2
i
2R2i
(5.16)
where Ri is the initial bar radius and Rf is the nal bar radius. Assuming incompressibilityof the accumulated corrosion products and taking the bar radius increment equal tocorrosion depth, the nal bar radius can be computed as:
Rf = Ri + ∆R (5.17)
Figure 5.1 (c) illustrate the process.During the cross section analysis and for a determined corrosion depth X, the dilation
D is applied incrementally during the nt time steps required to perform the non-linearanalysis.
5.5.2 Steel-Concrete interface model
To simulate the mechanism of shear stress transference between steel and concrete theinterface model represented on Figure 5.7 was used.
This type of element coupled with CSDA methodology allows the expected separa-tion between steel and concrete materials when high levels of corrosion are reached. As

Robustness of Corroded Reinforced Concrete Structures 35
Figure 5.7: Steel-Concrete interface model adopted from Sánchez et al. (2008)
can be seen on Figure 5.7 the interface model is characterized by four parameters: thenormal stiness Kηη, the maximum adherence stress τmax, the shear stiness Kη and thehardening/softening shear modulus K.
5.6 2D Longitudinal Analysis
As earlier stated, in the 2D longitudinal analysis, reinforced concrete was modeled bymeans of a composite material constituted by a matrix and long bers which representthe steel bars (Figure 5.8). A more detailed explanation of the model will be presentedin the next subsections.
Figure 5.8: Composite material model (adapted from Oliver et al., 2008).
5.6.1 Composite material model
On the mixture theory, reinforced concrete is assumed to be a composite material consti-tuted by a matrix, which represent the concrete, and long bers which represent the steelrebars. According to the basic hypothesis of the mixture theory , a composite materialis a continuum in which each innitesimal volume is occupied simultaneously by all con-stituents behaving as a parallel mechanical system. As a consequence, all the constituents
36 CHAPTER 5. METHODOLOGY
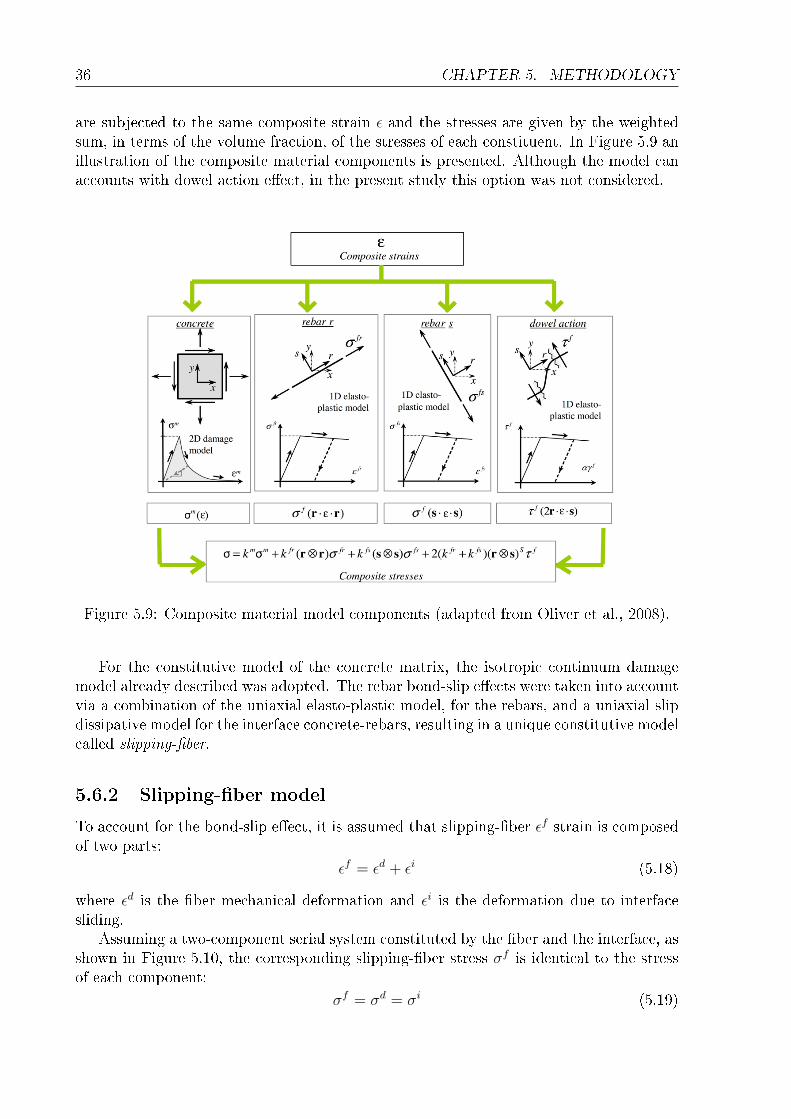
are subjected to the same composite strain ε and the stresses are given by the weightedsum, in terms of the volume fraction, of the stresses of each constituent. In Figure 5.9 anillustration of the composite material components is presented. Although the model canaccounts with dowel action eect, in the present study this option was not considered.
Figure 5.9: Composite material model components (adapted from Oliver et al., 2008).
For the constitutive model of the concrete matrix, the isotropic continuum damagemodel already described was adopted. The rebar bond-slip eects were taken into accountvia a combination of the uniaxial elasto-plastic model, for the rebars, and a uniaxial slipdissipative model for the interface concrete-rebars, resulting in a unique constitutive modelcalled slipping-ber.
5.6.2 Slipping-ber model
To account for the bond-slip eect, it is assumed that slipping-ber εf strain is composedof two parts:
εf = εd + εi (5.18)
where εd is the ber mechanical deformation and εi is the deformation due to interfacesliding.
Assuming a two-component serial system constituted by the ber and the interface, asshown in Figure 5.10, the corresponding slipping-ber stress σf is identical to the stressof each component:
σf = σd = σi (5.19)

Robustness of Corroded Reinforced Concrete Structures 37
Figure 5.10: Slipping-ber model (adapted from Oliver et al., 2008).
where σd is the ber stress and σi is the interface stress. On both cases the stress-strainrelation can be obtained via an one-dimensional elasto-plastic model hardening/softening.The resulting constitutive behavior for the slipping-ber is also an elasto-plastic modelwith the following characteristics (Figure 5.11):
σfy = min(σdy , σfadh) (5.20)
Ef =1
1Ed + 1
Ei
(5.21)
Hf =
Hd if σdy < σfadhH i if otherwise
(5.22)
in which Ed and σdy are the steel Young's modulus and yield stress, respectively, Ei is theinterface elastic modulus and σfadh is the interface bond limit stress. In this study, thehardening/softening model option characterized by parameters Hf ,Hd,H i respectively forslipping-ber, ber and interface was not considered.
Regard that when Ei → ∞ and σdy < σfadh, the system provides only the mechanicalbehavior of the ber, reproducing a perfect combination between concrete and reinforce-ment bars.
Figure 5.11: Slipping-ber model composition (adapted from Oliver et al., 2008).
The parameters required to characterize the slipping-ber model can be obtainedfrom pullout tests. In the present study perfect adhesion between steel bars and concrete

38 CHAPTER 5. METHODOLOGY
was considered and a rigid-plastic behavior for the interface was adopted just for theuncorroded state.
5.6.3 Bond-Strength deterioration (Bhargava et al., 2007)
Corrosion plays a fundamental role on bond strength weakening. Literature research (Al-Sulaimani et al., 1990; Cabrera, 1996; Rodriguez et al., 1994; Almusallam et al., 1996;Amleh and Mirza, 1999; Auyeung et al., 2000; Lee et al., 2002; Fang et al., 2004) showedthat research, on the inuence of corrosion on bond strength, has used a wide variety ofbond specimens and bar types, resulting in the wide range reported bond strengths forthe same levels of corrosion. Therefore, choosing a model for bond deterioration resultedis an hard task.
Figure 5.12: Normalized Bond strength as a function of corrosion level for experimentaldata of pullout tests (adapted from Bhargava et al., 2007).
To improve this situation an empirical model, developed by Bhargava et al. (2007)and based on a large set of dierent pullout experimental tests, was adopted. On Figure5.12 it can be seen all the experimental data considered and the M-Pull model adopted.
M-pull model gives the normalized bond strength R as a function of corrosion levelXp. Corrosion level Xp is the loss of weight of reinforcing bar expressed as a percentageof original rebar weight. M-Pull model can be resumed on equation 5.23.
R(Xp) =
1.0 if Xp ≤ 1.5%
1.192 · e−0.117Xp if Xp > 1.5%(5.23)
Notice that experimental presented data on Figure 5.12 do not account with stirrupseect on bond strength deterioration. Although the studied examples had stirrups thepresented model was used. This option was taken due to lack of consistent informationabout the subject.

Chapter 6
Robustness of Corroded Reinforced
Concrete Structures - Numerical
Example
6.1 Introduction
The main objective of this chapter is to present two practical examples of real reinforcedconcrete structures subjected to corrosion. The eects of corrosion will be simulatedusing the methodology presented in the previous chapter. Finally, using the robustnessdeterministic measure proposed on Chapter 4, the two proposed structural solutions willbe compared. For this propose, damage considered will be the corrosion level Xp and thefunction performance studied will be the load carrying capacity.
6.2 Design Solution
Having in mind the potential size of the numerical models resulting from modeling realreinforced concrete structures using the methodology presented, two small foot bridgeswere adopted for the present study.
Figure 6.1: 2D Structural model.
The same structural model was chosen for the two design solutions for a direct compar-ison between them. The structural model considered was a simply supported beam with14.0m of free span subjected to a midspan concentrated load as represented on Figure6.1.
The requisites when designing the two dierent solutions were a load carrying capacityas required in CEB (1993) and a walking path of 2.0m of width. Based on this, two cross
39
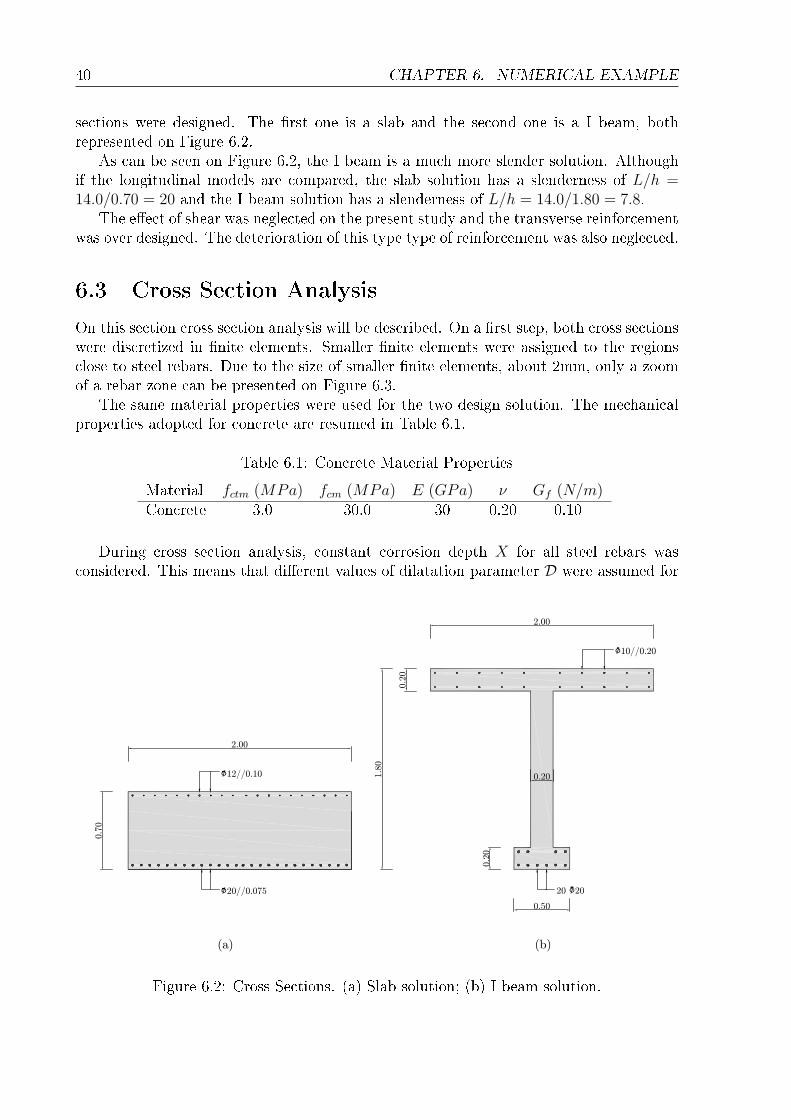
40 CHAPTER 6. NUMERICAL EXAMPLE
sections were designed. The rst one is a slab and the second one is a I beam, bothrepresented on Figure 6.2.
As can be seen on Figure 6.2, the I beam is a much more slender solution. Althoughif the longitudinal models are compared, the slab solution has a slenderness of L/h =14.0/0.70 = 20 and the I beam solution has a slenderness of L/h = 14.0/1.80 = 7.8.
The eect of shear was neglected on the present study and the transverse reinforcementwas over designed. The deterioration of this type type of reinforcement was also neglected.
6.3 Cross Section Analysis
On this section cross section analysis will be described. On a rst step, both cross sectionswere discretized in nite elements. Smaller nite elements were assigned to the regionsclose to steel rebars. Due to the size of smaller nite elements, about 2mm, only a zoomof a rebar zone can be presented on Figure 6.3.
The same material properties were used for the two design solution. The mechanicalproperties adopted for concrete are resumed in Table 6.1.
Table 6.1: Concrete Material Properties
Material fctm (MPa) fcm (MPa) E (GPa) ν Gf (N/m)Concrete 3.0 30.0 30 0.20 0.10
During cross section analysis, constant corrosion depth X for all steel rebars wasconsidered. This means that dierent values of dilatation parameter D were assumed for
Figure 6.2: Cross Sections. (a) Slab solution; (b) I beam solution.

Robustness of Corroded Reinforced Concrete Structures 41
Figure 6.3: Finite elements discretization around steel rebars.
each dierent steel bar radius. Similarly for each analysis step, corrosion levels Xp werehigher for small radius rebars.
As the analysis started and the corrosion levels increase concrete around steel rebarsbecame damaged. As was presented on Chapter 5, damaged concrete begins loosingstrength. When variable damage is equal to 1 cracks start appearing. On Figure 6.4damage concrete pattern slab solution for half section is shown. The damage around steelbars is evident.
Figure 6.4: Concrete damaging due to corrosion for slab design solution.
On Figure 6.5 isodisplacement lines are presented for the same step of the cross sectionanalysis presented on Figure 6.4. When isodisplacement lines tend to concentrate it meansthat a crack appeared on that zone. By analyzing Figure 6.5, it is possible to observe,on the bottom of the slab, the delamination of concrete cover, due to a crack formationbetween all rebars. On the cross section top this happened only on the most left sidebars. On the other bars the cracks just crossed the concrete cover.
By comparing Figures 6.5 and 6.4 it is also possible to conclude that isodisplacementlines concentrate on most damaged areas. When a crack crosses all the section it meansthat the part of concrete that remains outside the crack is no longer monolithic with therest of the section. On this study, the inuence of these parts of concrete, on the crosssection resistance, was neglected as the inuence of stirrups on crack developing. Thisassumption was taken into account during the 2D longitudinal analysis by consideringthese parts of concrete with damage equal to one. As was seen, damage equal to onemeans that concrete has completely lost all its resistance.

42 CHAPTER 6. NUMERICAL EXAMPLE
Figure 6.5: Isodisplacement lines for slab design solution.
For the I beam cross section design solution, damage pattern and isodisplacement linesare presented on Figure 6.6 for an advanced corrosion attack level.
Figure 6.6: Damage and isodisplacement lines for I beam design solution.
Figure 6.6 shows that corrosion produces several cracks. On the top ange, severalcracks appeared crossing all its depth. On the bottom ange, delamination of concretecover occurs on both levels of steel bars. Another crack appeared connecting these twolevels of reinforcement. In this case, the loss of monolithicism is much more importantbecause section inertia and eective reinforcement area will be drastically reduced. Theeect of stirrups was also neglected on this case due to the increased complexity involved.
6.4 2D longitudinal model for structural analysis
Using the strategy presented in Chapter 5, longitudinal models for structural analysis werebuilt. For concrete material the same properties adopted on cross section analysis wereconsidered. To characterize the slipping-ber model, during the non corroded stage, an

Robustness of Corroded Reinforced Concrete Structures 43
elastoplastic constitutive behavior was considered for steel bars with a Young modulus Ed
equal to 200GPa and yielding stress σd equal to 400MPa. For the interface a rigid-plasticmodel with a yielding stress also equal to 400MPa was adopted. These assumptions resultin perfect adhesion in the non corroded stages.
700F (kN)
400
500
600
700F (kN)
200
300
400
500
600
700F (kN)
0
100
200
300
400
500
600
700
0.00 0.02 0.04 0.06 0.08 0.10 0.12 0.14 0.16 0.18 0.20
F (kN)
0
100
200
300
400
500
600
700
0.00 0.02 0.04 0.06 0.08 0.10 0.12 0.14 0.16 0.18 0.20
F (kN)
Displacement at mid span (m)
0
100
200
300
400
500
600
700
0.00 0.02 0.04 0.06 0.08 0.10 0.12 0.14 0.16 0.18 0.20
F (kN)
Displacement at mid span (m)
0
100
200
300
400
500
600
700
0.00 0.02 0.04 0.06 0.08 0.10 0.12 0.14 0.16 0.18 0.20
F (kN)
Displacement at mid span (m)
Figure 6.7: Uncorroded stage force - displacement diagram for slab design solution.
To compare structural behaviors of corroded and uncorroded states, for each designsolution, a rst run of the longitudinal model was performed. On Figure 6.7 is presentedthe force-displacement diagram for slab solution.
Three behavior stages can be observed. The elastic behavior on rst stage correspondto maximum load of about 450kN. The second stage correspond to crack spreading andgoes to a maximum load of about 650kN. On this stage it is possible to observe the losson structural rigidity due to cracking. On the third stage, structure can no longer sustainload increment as the second stage ends with the yielding of steel on the bottom bars.Thus the third stage correspond to mechanism development that consist on a plastic hingeformation under the load application point, where exural moments are higher.
On Figure 6.8 (a) and (b), results of damage and horizontal isodisplacement lines,corresponding to the last step of the analysis, are presented. In this case, there aredamaged zones where isodisplacement lines do not concentrate, so it looks like that thereare no crack formation on that damaged zones. In fact on the last step of the analysis theconcentration of isodisplacement lines is much higher on the midspan where the largercracks are. Thus it becomes dicult to observe smaller cracks on other damage areas andFigure 6.8 (b) only show two big cracks around the beam mid span.
On Figure 6.8 (c) it is shown an horizontal displacement diagram of the slab bottomsurface. The diagram is aligned with isodisplacement lines on Figure 6.8 (b) so it ispossible to observe the jump on the displacement eld due to crack formation whereisodisplacement lines concentrate. This jump occurrence was characterized on Chapter 5as a strong discontinuity.
For the I-beam cross section solution the same results are now presented on Figures6.9 and 6.10. In this case it is also possible to observe the damage, in the cross sectionweb concrete, due to shear eect.

44 CHAPTER 6. NUMERICAL EXAMPLE
(a)
‐0.020
‐0.015
‐0.010
(m)
HORIZONTAL DISPLACEMENT AT BOTTOM FIBER
(a)
(b)
‐0.020
‐0.015
‐0.010
‐0.005
0.000
0 1 2 3 4 5 6 7
(m)
(m)
HORIZONTAL DISPLACEMENT AT BOTTOM FIBER
(a)
(c)
(b)
‐0.020
‐0.015
‐0.010
‐0.005
0.000
0 1 2 3 4 5 6 7
(m)
(m)
HORIZONTAL DISPLACEMENT AT BOTTOM FIBER
(a)
(c)
(b)
‐0.020
‐0.015
‐0.010
‐0.005
0.000
0 1 2 3 4 5 6 7
(m)
(m)
HORIZONTAL DISPLACEMENT AT BOTTOM FIBER
(a)
(c)
(b)
‐0.020
‐0.015
‐0.010
‐0.005
0.000
0 1 2 3 4 5 6 7
(m)
(m)
HORIZONTAL DISPLACEMENT AT BOTTOM FIBER
(a)
(c)
(b)
Figure 6.8: Slab design solution results for the uncorroded stage. (a) Damage on Concrete.(b) Horizontal (x-direction) isodisplacemet lines. (c) horizontal displacement at crosssection bottom ber points.
700
F (kN)
400
500
600
700
F (kN)
200
300
400
500
600
700
F (kN)
0
100
200
300
400
500
600
700
0.00 0.01 0.02 0.03 0.04 0.05 0.06 0.07 0.08 0.09 0.10
F (kN)
0
100
200
300
400
500
600
700
0.00 0.01 0.02 0.03 0.04 0.05 0.06 0.07 0.08 0.09 0.10
F (kN)
Displacement at mid span (m)
0
100
200
300
400
500
600
700
0.00 0.01 0.02 0.03 0.04 0.05 0.06 0.07 0.08 0.09 0.10
F (kN)
Displacement at mid span (m)
0
100
200
300
400
500
600
700
0.00 0.01 0.02 0.03 0.04 0.05 0.06 0.07 0.08 0.09 0.10
F (kN)
Displacement at mid span (m)
Figure 6.9: Uncorroded stage force - displacement diagram for I-beam design solution.
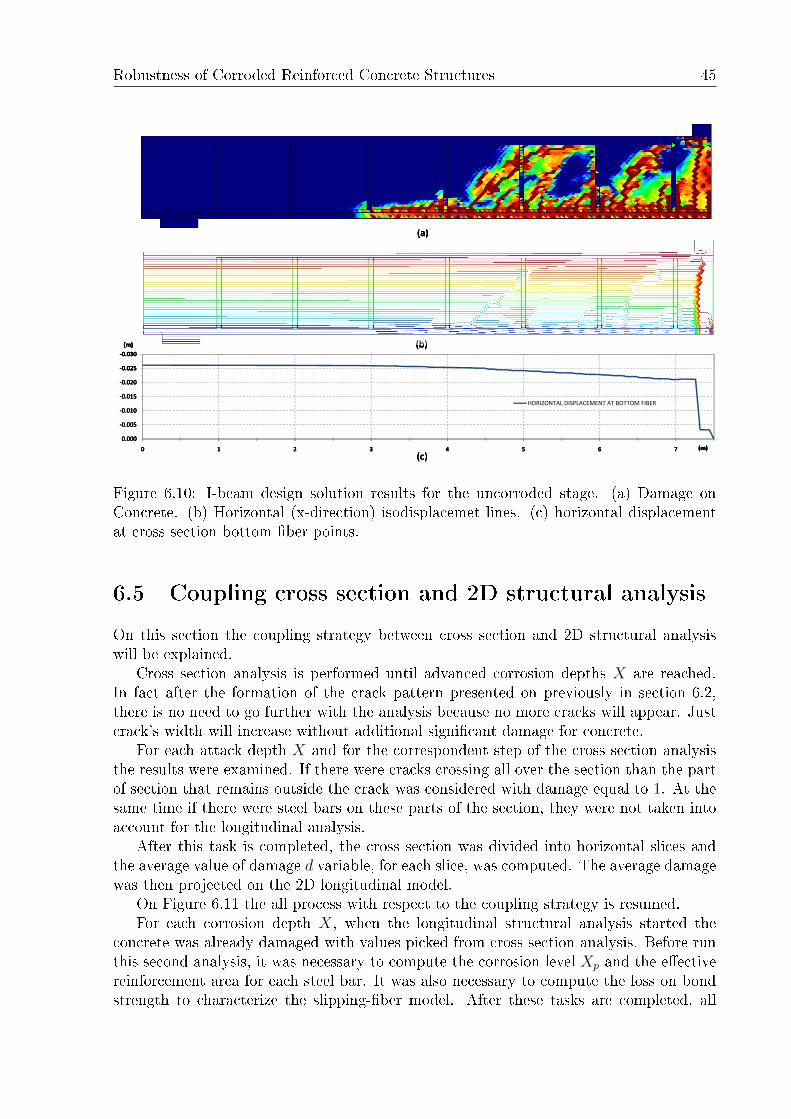
Robustness of Corroded Reinforced Concrete Structures 45
(a)
(a)
‐0.030
‐0.025
(m)
(a)
(b)
(a)
(b)‐0.030
‐0.025
‐0.020
‐0.015
‐0.010
‐0.005
0.000
0 1 2 3 4 5 6 7
(m)
(m)
HORIZONTAL DISPLACEMENT AT BOTTOM FIBER
(a)
(c)
(b)
(a)
(b)‐0.030
‐0.025
‐0.020
‐0.015
‐0.010
‐0.005
0.000
0 1 2 3 4 5 6 7
(m)
(m)
HORIZONTAL DISPLACEMENT AT BOTTOM FIBER
(a)
(c)
(b)
(a)
(b)‐0.030
‐0.025
‐0.020
‐0.015
‐0.010
‐0.005
0.000
0 1 2 3 4 5 6 7
(m)
(m)
HORIZONTAL DISPLACEMENT AT BOTTOM FIBER
(a)
(c)
(b)
(a)
(b)‐0.030
‐0.025
‐0.020
‐0.015
‐0.010
‐0.005
0.000
0 1 2 3 4 5 6 7
(m)
(m)
HORIZONTAL DISPLACEMENT AT BOTTOM FIBER
(a)
(c)
(b)
(a)
(b)
Figure 6.10: I-beam design solution results for the uncorroded stage. (a) Damage onConcrete. (b) Horizontal (x-direction) isodisplacemet lines. (c) horizontal displacementat cross section bottom ber points.
6.5 Coupling cross section and 2D structural analysis
On this section the coupling strategy between cross section and 2D structural analysiswill be explained.
Cross section analysis is performed until advanced corrosion depths X are reached.In fact after the formation of the crack pattern presented on previously in section 6.2,there is no need to go further with the analysis because no more cracks will appear. Justcrack's width will increase without additional signicant damage for concrete.
For each attack depth X and for the correspondent step of the cross section analysisthe results were examined. If there were cracks crossing all over the section than the partof section that remains outside the crack was considered with damage equal to 1. At thesame time if there were steel bars on these parts of the section, they were not taken intoaccount for the longitudinal analysis.
After this task is completed, the cross section was divided into horizontal slices andthe average value of damage d variable, for each slice, was computed. The average damagewas then projected on the 2D longitudinal model.
On Figure 6.11 the all process with respect to the coupling strategy is resumed.For each corrosion depth X, when the longitudinal structural analysis started the
concrete was already damaged with values picked from cross section analysis. Before runthis second analysis, it was necessary to compute the corrosion level Xp and the eectivereinforcement area for each steel bar. It was also necessary to compute the loss on bondstrength to characterize the slipping-ber model. After these tasks are completed, all

46 CHAPTER 6. NUMERICAL EXAMPLE
Figure 6.11: Coupling Strategy. (a) Dening regions with d = 1. (b) computing Averagedamage distribution along cross section depth. (c) Coupling the cross section damageresults with the 2D longitudinal model.
features of the longitudinal model were updated and the analysis could than start.Withthis methodology it was possible to account with the follow eects produced by steelcorrosion:
1. expansion and accumulation of corrosion products resulting on concrete deteriora-tion by means of damage variable d;
2. concrete cracking and lost of monolithicism of section;
3. bond strength deterioration;
4. reinforcement eective area reduction.
6.6 Results
On Figure 6.12, load-displacement diagrams are presented for several corrosion levels Xp
for the slab design solution. As the corrosion level increases, the second behavior stage,which correspond to crack spreading, tend to become shorter. For a corrosion depth ofXp = 7.92% the second stage does not exist and after the rst crack appears steel barsimmediately reach the yielding stress. In fact, when the rst crack occurs, stresses passfrom concrete to steel bars. As steel bars are signicantly corroded and the adherence toconcrete is deteriorated, rebars cannot support the demanded stresses, and the load fallsto lower levels compatible with the deteriorated state.
So, for advanced corrosion states, steel rebars play a small role on ultimate load ofthe beam. They increase slightly the maximum load on the uncraked stage and theyare responsible for postpeak carrying load capacity. For a corrosion level of 100% onlyconcrete contributes for the cross section resistance and than there is no post peak carryingcapacity.
On Figure 6.13 same results are presented for the I-beam design solution. The con-clusions on structural behavior are basically the same. Although in this case it is possible

Robustness of Corroded Reinforced Concrete Structures 47
700F (kN)
400
500
600
700F (kN)
Xp=0%
X 1 19%
200
300
400
500
600
700F (kN)
Xp=0%
Xp=1.19%
Xp=3.92%
Xp=7.69%
Xp=11.32%
0
100
200
300
400
500
600
700
0.00 0.02 0.04 0.06 0.08 0.10 0.12 0.14 0.16 0.18 0.20
F (kN)
Xp=0%
Xp=1.19%
Xp=3.92%
Xp=7.69%
Xp=11.32%
Xp=100%
0
100
200
300
400
500
600
700
0.00 0.02 0.04 0.06 0.08 0.10 0.12 0.14 0.16 0.18 0.20
F (kN)
Displacement at mid span (m)
Xp=0%
Xp=1.19%
Xp=3.92%
Xp=7.69%
Xp=11.32%
Xp=100%
0
100
200
300
400
500
600
700
0.00 0.02 0.04 0.06 0.08 0.10 0.12 0.14 0.16 0.18 0.20
F (kN)
Displacement at mid span (m)
Xp=0%
Xp=1.19%
Xp=3.92%
Xp=7.69%
Xp=11.32%
Xp=100%
0
100
200
300
400
500
600
700
0.00 0.02 0.04 0.06 0.08 0.10 0.12 0.14 0.16 0.18 0.20
F (kN)
Displacement at mid span (m)
Xp=0%
Xp=1.19%
Xp=3.92%
Xp=7.69%
Xp=11.32%
Xp=100%
Figure 6.12: Force - displacement diagram for slab design solution and for several corrosionlevels Xp.
to observe a bigger dierence between corroded and uncorroded states load carrying ca-pacities. In this case the peak load decreases from about 650kN to 150kN respectivelyfor Xp = 0% and Xp = 100%. On the slab design case the load reduction was from about650kN to 225kN for the same corrosion levels. This means that, without steel bars, theslender cross section in I shape is weaker, or by other words, that the inuence of steelbars on the overal resistance is higher on the I-beam case.
700
500
600
700F (kN)
Xp=0%
Xp=1.98%
200
300
400
500
600
700F (kN)
Xp=0%
Xp=1.98%
Xp=3.54%
Xp=8.06%
Xp=16.51%
Xp=33 29%
0
100
200
300
400
500
600
700
0.00 0.01 0.02 0.03 0.04 0.05 0.06 0.07 0.08 0.09 0.10
F (kN)
Xp=0%
Xp=1.98%
Xp=3.54%
Xp=8.06%
Xp=16.51%
Xp=33.29%
Xp=100%
0
100
200
300
400
500
600
700
0.00 0.01 0.02 0.03 0.04 0.05 0.06 0.07 0.08 0.09 0.10
F (kN)
Displacement at mid span (m)
Xp=0%
Xp=1.98%
Xp=3.54%
Xp=8.06%
Xp=16.51%
Xp=33.29%
Xp=100%
0
100
200
300
400
500
600
700
0.00 0.01 0.02 0.03 0.04 0.05 0.06 0.07 0.08 0.09 0.10
F (kN)
Displacement at mid span (m)
Xp=0%
Xp=1.98%
Xp=3.54%
Xp=8.06%
Xp=16.51%
Xp=33.29%
Xp=100%
0
100
200
300
400
500
600
700
0.00 0.01 0.02 0.03 0.04 0.05 0.06 0.07 0.08 0.09 0.10
F (kN)
Displacement at mid span (m)
Xp=0%
Xp=1.98%
Xp=3.54%
Xp=8.06%
Xp=16.51%
Xp=33.29%
Xp=100%
Figure 6.13: Force - displacement diagram for I-beam design solution and for severalcorrosion levels Xp.
Now let's apply the deterministic robustness measure proposed on Chapter 4 in orderto compare the susceptibility to corrosion of both design solutions.
As was previously dened, robustness is a property of the structure that measure thedegree of loss on structural performance due to damage. In this case structural perfor-mance will be the peak load and damage will be the corrosion level X which measuresthe loss on eective reinforcement area.
On Figure 6.14 the normalized peak load carrying capacity F/Fmax of the structuresis plotted against corrosion level Xp. The normalized bond strength of the slipping-bermodel was also plotted on the same graphic and against corrosion level Xp.
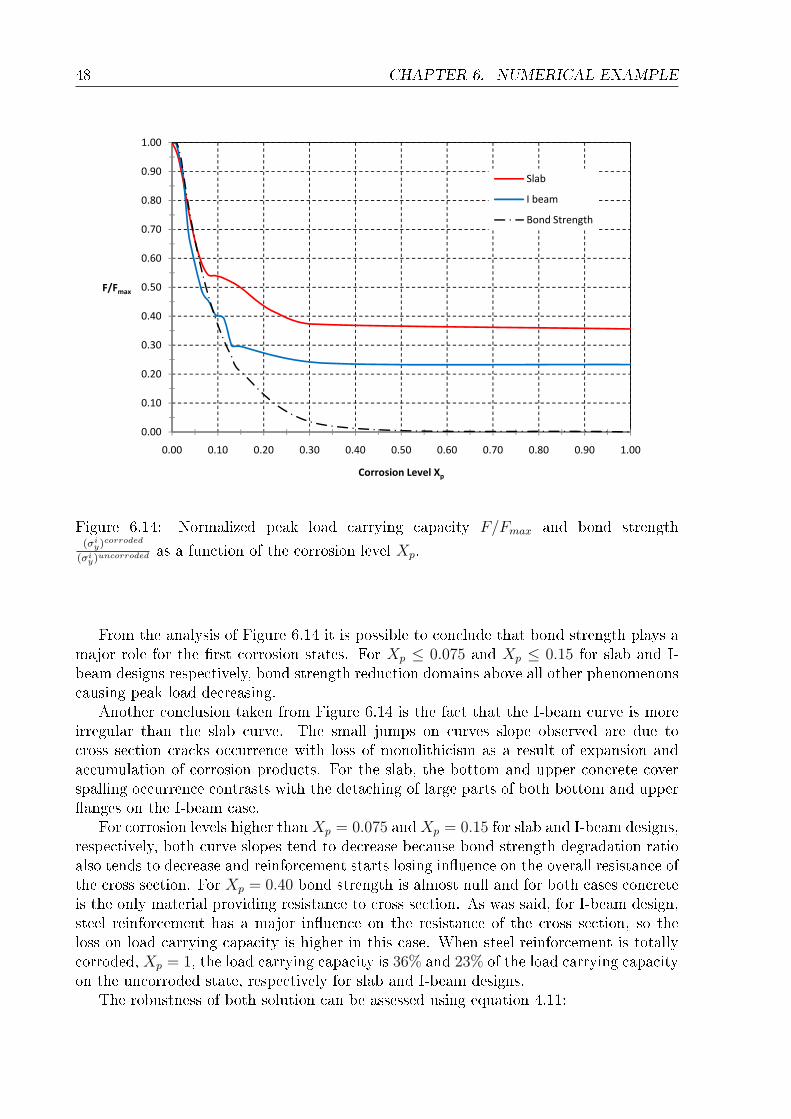
48 CHAPTER 6. NUMERICAL EXAMPLE
1.00
0.80
0.90
1.00
Slab
I beam
Bond Strength
0 50
0.60
0.70
0.80
0.90
1.00
F/F
Slab
I beam
Bond Strength
0.30
0.40
0.50
0.60
0.70
0.80
0.90
1.00
F/Fmax
Slab
I beam
Bond Strength
0.10
0.20
0.30
0.40
0.50
0.60
0.70
0.80
0.90
1.00
F/Fmax
Slab
I beam
Bond Strength
0.00
0.10
0.20
0.30
0.40
0.50
0.60
0.70
0.80
0.90
1.00
0.00 0.10 0.20 0.30 0.40 0.50 0.60 0.70 0.80 0.90 1.00
F/Fmax
Corrosion Level X
Slab
I beam
Bond Strength
0.00
0.10
0.20
0.30
0.40
0.50
0.60
0.70
0.80
0.90
1.00
0.00 0.10 0.20 0.30 0.40 0.50 0.60 0.70 0.80 0.90 1.00
F/Fmax
Corrosion Level Xp
Slab
I beam
Bond Strength
0.00
0.10
0.20
0.30
0.40
0.50
0.60
0.70
0.80
0.90
1.00
0.00 0.10 0.20 0.30 0.40 0.50 0.60 0.70 0.80 0.90 1.00
F/Fmax
Corrosion Level Xp
Slab
I beam
Bond Strength
Figure 6.14: Normalized peak load carrying capacity F/Fmax and bond strength(σi
y)corroded
(σiy)uncorroded as a function of the corrosion level Xp.
From the analysis of Figure 6.14 it is possible to conclude that bond strength plays amajor role for the rst corrosion states. For Xp ≤ 0.075 and Xp ≤ 0.15 for slab and I-beam designs respectively, bond strength reduction domains above all other phenomenonscausing peak load decreasing.
Another conclusion taken from Figure 6.14 is the fact that the I-beam curve is moreirregular than the slab curve. The small jumps on curves slope observed are due tocross section cracks occurrence with loss of monolithicism as a result of expansion andaccumulation of corrosion products. For the slab, the bottom and upper concrete coverspalling occurrence contrasts with the detaching of large parts of both bottom and upperanges on the I-beam case.
For corrosion levels higher thanXp = 0.075 andXp = 0.15 for slab and I-beam designs,respectively, both curve slopes tend to decrease because bond strength degradation ratioalso tends to decrease and reinforcement starts losing inuence on the overall resistance ofthe cross section. For Xp = 0.40 bond strength is almost null and for both cases concreteis the only material providing resistance to cross section. As was said, for I-beam design,steel reinforcement has a major inuence on the resistance of the cross section, so theloss on load carrying capacity is higher in this case. When steel reinforcement is totallycorroded, Xp = 1, the load carrying capacity is 36% and 23% of the load carrying capacityon the uncorroded state, respectively for slab and I-beam designs.
The robustness of both solution can be assessed using equation 4.11:

Robustness of Corroded Reinforced Concrete Structures 49
1. For the slab design:
R =
∫ 1
0
F/Fmax(Xp)dXp = 0.42 (6.1)
2. For the I-beam design:
R =
∫ 1
0
F/Fmax(Xp)dXp = 0.29 (6.2)
As was expected robustness result higher for the slab design case. To conrm the compe-
0 80
0.90
1.00
I beam
Slab
0.60
0.70
0.80
0.90
1.00
I beam
Slab
0 30
0.40
0.50
0.60
0.70
0.80
0.90
1.00
F/Fmax
I beam
Slab
0.10
0.20
0.30
0.40
0.50
0.60
0.70
0.80
0.90
1.00
F/Fmax
I beam
Slab
0.00
0.10
0.20
0.30
0.40
0.50
0.60
0.70
0.80
0.90
1.00
0.00 0.10 0.20 0.30 0.40 0.50 0.60 0.70 0.80 0.90 1.00
F/Fmax
Normalized Bond Strenght Degradation
I beam
Slab
0.00
0.10
0.20
0.30
0.40
0.50
0.60
0.70
0.80
0.90
1.00
0.00 0.10 0.20 0.30 0.40 0.50 0.60 0.70 0.80 0.90 1.00
F/Fmax
Normalized Bond Strenght Degradation
I beam
Slab
0.00
0.10
0.20
0.30
0.40
0.50
0.60
0.70
0.80
0.90
1.00
0.00 0.10 0.20 0.30 0.40 0.50 0.60 0.70 0.80 0.90 1.00
F/Fmax
Normalized Bond Strenght Degradation
I beam
Slab
Figure 6.15: Normalized peak load carrying capacity F/Fmax as a function of normalizedbond strength deterioration Dσi
y.
tence of the above measure another damage variable to assess structural robustness wasconsidered. As was observed bond strength degradation plays an important role on loadcarrying capacity. On Figure 6.15 normalized load carrying capacity F/Fmax is plottedagainst normalized bond strength degradation Dσi
ygiven by:
Dσiy
= 1−(σiy)
corroded
(σiy)uncorroded
(6.3)
where (σiy)uncorroded (σiy)
corroded represent the bond strength of the slipping-ber modelrespectively on corroded and uncorroded states.
The loss on structural performance (load carrying capacity) has a linear relation withdamage (bond strength degradation) for both cases. Applying on more time equation4.11:

50 CHAPTER 6. NUMERICAL EXAMPLE
1. to the slab design
R =
∫ 1
0
F/Fmax(Dσiy)dDσi
y= 0.61 (6.4)
2. and to the I-beam design
R =
∫ 1
0
F/Fmax(Dσiy)dDσi
y= 0.51 (6.5)
the slab design result again more robust.If an unreinforced structure was considered on the present study, robustness would be
equal to 1 because corrosion would not aect the load carrying capacity. This is coherentwith the adopted denition, i.e., a full robust structure is one that does not loose anyperformance under damage.

Chapter 7
Conclusions and Future Work
At the present time, robustness is not well dened and much controversy still remainsaround the subject.
On this report several proposed robustness denitions were analyzed and discussed. Itwas concluded that some proposals dene robustness as a structural property and othersdene it as a property of both structure and environment. From the analysis carried out,based on a event tree and on the barrier model, it was also concluded that all authorsproposals are closely related. The authors, that consider robustness as a property of thestructure, are mainly concerned about structural performance after damage occurrence.Other authors regard also for structural susceptibility to an event and for damage directand indirect consequences.
In this report, the theory of robustness being a structural property was adopted andthe follow denition was proposed:Robustness is a measure of the degree of structural function lost after a damage occurs.Function can be of any kind, from service limit states to ultimate limit states. Damagecan vary from a simple degradation state to a more serious damage as a column or a beamfailure.In order to assess robustness as dened above, a probabilistic index was proposed onequations 4.8 and 4.9. A deterministic measure was also dened by means of equation4.11.
To illustrate the suggested denition for robustness and methods for quantifying it,an example of a corroded reinforced concrete structure was presented. The exampleconsisted of two simply supported beams with dierent cross sections. For the rst beama slab design solution was adopted, and for the second one an I-beam design solution wasconsidered.
The structural performance under analysis was the load carrying capacity and thedamage considered was the corrosion level of the bottom reinforcement.
To capture eects of reinforcement corrosion, an advanced nite element methodologywas performed. The nite element analysis were based on three main features:
1. an isotropic continuum damage model in order to represent concrete behavior;
2. a continuum strong discontinuity approach to consider concrete cracking;
3. and the mixture theory for the composite material, concrete and reinforcement,simulation.
51

52 CHAPTER 7. CONCLUSIONS AND FUTURE WORK
With the purpose of capturing concrete damage and cracking occurrence due to corro-sion products accumulation, an in-plane analysis of the cross section was rstly performed.The results of the corroded cross section were than coupled with a longitudinal model ofthe simply supported beams and the structural analysis were nally performed for severalcorrosion levels. The eect of bond strength deterioration was also considered by meansof the M-pull model.
Cross section analysis revealed that the reinforcement corrosion produces spalling ofconcrete cover on the slab design solution. On the I-beam design case, corrosion producescracks crossing all over both bottom and upper anges weakening more signicantly thesection resistance.
Structural longitudinal analysis showed that bond strength deterioration is the majorcause of load carrying capacity on both beams.
For the two design solutions normalized load carrying capacity was plotted as a func-tion of corrosion level and as a function of bond strength deterioration. On both cases,the robustness assessment, using the deterministic measure proposed on equation 4.11,demonstrated that slab solution is more robust. This is mainly due to lost of I-beamcross section integrity due to cracking of bottom and upper ange. The other reason isthe important role played by the steel reinforcement on exural resistance of I-beam crosssection. Consequently reinforcement corrosion has a higher impact on the load carryingcapacity of the I-beam.As future developments it would be of great interest to perform a reliability analysis andassess the robustness of the presented examples with the probabilistic measure proposedon equation (4.8). It would be also of great interest to illustrate the proposed denitionand measures by means of more examples, i.e., considering more damage scenarios anddierent structural performance indicators.

References
Agarwal, J., England, J., and Blockley, D. (2006). Vulnerability analysis of structures.Structural Engineering International, 16(2):124128.
Al-Sulaimani, G., Kaleemullah, M., and Basunbul, I. (1990). Inuence of corrosion andcracking on bond behavior and strength of reinforced concrete members. ACI StructuralJournal, 87(2).
Almusallam, A., Al-Gahtani, A., and Aziz, A. (1996). Eect of reinforcement corrosionon bond strength. Construction and Building Materials, 10(2):123129.
Amleh, L. and Mirza, S. (1999). Corrosion inuence on bond between steel and concrete.ACI Structural Journal, 96(3).
Auyeung, Y., Balaguru, P., and Chung, L. (2000). Bond behavior of corroded reinforce-ment bars. ACI Materials Journal, 97(2).
Baker, J., Schubert, M., and Faber, M. (2008). On the assessment of robustness. StructuralSafety, 30(3):253267.
Bhargava, K., Ghosh, A., Mori, Y., and Ramanujam, S. (2007). Corrosion-induced bondstrength degradation in reinforced concreteAnalytical and empirical models. NuclearEngineering and Design, 237(11):11401157.
Biondini, F. and Restelli, S. (2008). Damage propagation and structural robustness. InLife-Cycle Civil Engineering: Proceedings of the International Symposium on Life-CycleCivil Engineering, IALCCE'08, Held in Varenna, Lake Como, Italy on June 11-14 2008,page 131. Taylor & Francis.
Cabrera, J. (1996). Deterioration of concrete due to reinforcement steel corrosion. Cement& Concrete Composites, 18(1):4759.
Callaway, D., Newman, M., Strogatz, S., and Watts, D. (2000). Network robustness andfragility: Percolation on random graphs. Physical Review Letters, 85(25):54685471.
Canisius, T., Sørensen, J., and Baker, J. (2007). Robustness of structural systemsa newfocus for the joint committee on structural safety (JCSS). In Proc., 10th Int. Conf. onApplication of Statistic and Probability in Civil Engineering (ICASP10).
CEB, C. (1993). Model Code 1990. Bulletin dInformation no213/214, Thomas Telford,London.
53

54 REFERENCES
CEN (1994). Eurocode 1: basis of design and actions on structures; Part 1: basis ofdesign. European Prestandard ENV 1991-1. Brussels (Belgium):Comite European deNormalization 250.
Eagar, T. and Musso, C. (2001). Why did the world trade center collapse? science,engineering, and speculation. JOM Journal of the Minerals, Metals and MaterialsSociety, 53(12):811.
Ellingwood, B. and Dusenberry, D. (2005). Building design for abnormal loads and pro-gressive collapse. Computer-Aided Civil and Infrastructure Engineering, 20(3):194205.
Ersdal, G. (2005). Assessment of existing oshore structures for life extension. Norway:University of Stavanger.
Fang, C., Lundgren, K., Chen, L., and Zhu, C. (2004). Corrosion inuence on bond inreinforced concrete. Cement and concrete research, 34(11):21592167.
Frangopol, D. M. and Curley, J. P. (1987). Eects of damage and redundancy on structuralreliability. Journal of Structural Engineering, 113(7):15331549.
Ghosn, M. and Moses, F. (1998). NCHRP Report 406: Redundancy in Highway BridgeSuperstructures. Transportation Research Board, National Research Council, Washing-ton, DC.
Haddon, W. (1980). The basic strategies for reducing damage from hazards of all kinds.Hazard prevention, 16(11):812.
Huber, P. (1996). Robust statistical procedures. Society for Industrial Mathematics.
Lee, H., Noguchi, T., and Tomosawa, F. (2002). Evaluation of the bond properties be-tween concrete and reinforcement as a function of the degree of reinforcement corrosion.Cement and Concrete research, 32(8):13131318.
Levi, M. and Salvadori, M. (1992). Why buildings fall down.
Lind, N. (1995). A measure of vulnerability and damage tolerance. Reliability engineering& systems safety, 48(1):16.
Liu, W., Neuenhoer, A., Ghosn, M., and Moses, F. (2001). Redundancy in highwaybridge substructures. National cooperative highway research program report.
Meyer, B. (1997). Object-oriented software construction (2nd ed.). Prentice-Hall, Inc.,Upper Saddle River, NJ, USA.
NTSB (2008). Collapse of i-35w highway bridge. highway accident report ntsb/har-08/03.Technical report, National Transportation Safety Board.
Oliver, J., Cervera, M., Oller, S., and Lubliner, J. (1990). Isotropic damage models andsmeared crack analysis of concrete. In Second International Conference on ComputerAided Analysis and Design of Concrete Structures, volume 2, pages 945958.

Robustness of Corroded Reinforced Concrete Structures 55
Oliver, J. and Huespe, A. (2004). Continuum approach to material failure in strong dis-continuity settings. Computer Methods in Applied Mechanics and Engineering, 193(30-32):31953220.
Oliver, J., Huespe, A., Blanco, S., and Linero, D. (2006). Stability and robustness is-sues in numerical modeling of material failure with the strong discontinuity approach.Computer Methods in Applied Mechanics and Engineering, 195(52):70937114.
Oliver, J., Huespe, A., Pulido, M., and Chaves, E. (2002). From continuum mechanics tofracture mechanics: the strong discontinuity approach. Engineering Fracture Mechanics,69(2):113136.
Oliver, J., Linero, D., Huespe, A., and Manzoli, O. (2008). Two-dimensional modelingof material failure in reinforced concrete by means of a continuum strong discontinuityapproach. Computer Methods in Applied Mechanics and Engineering, 197(5):332348.
Pearson, C., Delatte, N., et al. (2003). Lessons the Progressive Collapse of the RomanPoint Apartment Tower. Forensic Engineering, pages 190200.
Rodriguez, J., Ortega, L., and Casal, J. (1994). Corrosion of reinforcing bars and servicelife of r/c structures: corrosion and bond deterioration. In Concrete across Borders,Proceedings, Odense, Denmark, volume II.
Sánchez, P., Huespe, A., Oliver, J., and Toro, S. (2008). Numerical modelling of the loadcarrying capacity degradation in concrete beams due to reinforcement corrosion. In 8thWorld Congress on Computational Mechanics (WCCM8), 5th European Congress onComputational Methods in Applied Sciences and Engineering (ECCOMAS 2008).
Slotine, J., Li, W., et al. (1991). Applied nonlinear control. Prentice-Hall EnglewoodClis, NJ.
Sorensen, J. and Christensen, H. (2006). Danish Requirements for Robustness ofStructures: Background and Implementation. Structural Engineering International,16(2):172177.
Starossek, U. Haberland, M. (2008). Measures of structural robustness - requirements andapplications. In Proceedings, ASCE SEI 2008 Structures Congress, Crossing Borders.
Starossek, U. (2009). Collapse types and robustness measures. In COST Action TU0601 Robustness of Structures.
Wisniewski, D., Casas, J., and Ghosn, M. (2006). Load capacity evaluation of existing rail-way bridges based on robustness quantication. Structural Engineering International,16(2):161166.
Yao, J. (1985). Safety and reliability of existing structures. Pitman Publishing.