degree of doctor of philosophy. - university of kansas
TRANSCRIPT

A RELIABILITY AND VALIDITY STUDY OF
THE PROTECTIVE FACTORS SURVEY
TO ASSESS PROTECTIVE FACTORS IN FAMILIES
By
Copyright 2010
Jacqueline M. Counts
Submitted to the School of Social Welfare and the Faculty of the Graduate School
of the University of Kansas in partial fulfillment of the requirements for the
degree of Doctor of Philosophy.
Committee:
____________________________________ Chairperson, Christopher G. Petr, Ph.D. __________________________________ Methodologist, Thomas P. McDonald, Ph.D. ____________________________________ Jerry D. Bailey, Ed.D. ____________________________________ Steve Kapp, Ph.D. ____________________________________ Edward Scanlon, Ph.D.
Date Approved:
April 19, 2010___________

A RELIABILITY AND VALIDITY STUDY OF
THE PROTECTIVE FACTORS SURVEY
TO ASSESS PROTECTIVE FACTORS IN FAMILIES
The Dissertation Committee for Jacqueline M. Counts certifies that this is the approved version of the following dissertation:
Committee:
____________________________________ Chairperson, Christopher G. Petr, Ph.D. __________________________________ Methodologist, Thomas P. McDonald, Ph.D. ____________________________________ Jerry D. Bailey, Ed.D. ____________________________________ Steve Kapp, Ph.D. ____________________________________ Edward Scanlon, Ph.D.
Date Defended: April 19, 2010___________

i
Table of Contents
List of Tables…………………………………………………………………….. vii.
List of Figures…………………………………………………………................. ix.
Acknowledgements…………………………………….………………………… x.
Abstract…………………………………………………………………………... xvi.
Chapter 1: Introduction………………………………………………………….. 1
The Problem of Child Maltreatment…………………………………………. 2
History of prevention…………………………………………………….. 8
Prevention and parent education programs……………………………….. 11
Parent education research………………………………………………… 12
Risk and protective factors and limitations of the literature……………... 14
Limitations of a risk perspective and potential of a protective factors perspective………………………………………………………………...
16
Reframing Prevention: Strengthening Families and the Protective factors… 19
Instrument review………………………………………………………… 27
Limited inclusion of protective factors and population fit …………….. 30
Lengthy administration and qualifications of administrator……………… 30
The Development of the Protective Factors Survey…………………………..
31
Alignment with Center for the Study of Social Policy protective factors… 33
The protective factors literature review………………………………… 35
Family functioning………………………………………………… 35
Social support………………………………………………………… 36

ii
Concrete support……………………………………………………… 37
Nurturing and attachment…………………………………………….. 38
Knowledge of parenting and child development…………………….. 39
Revision of the CSSP protective factors………………………………… 40
Purpose of the Study………………………………………………………….
42
Research Questions and Hypotheses………………………………………… 44
Chapter 2: Research Methodology……………………………………..………… 46
Procedure……………………………..……………………………………… 46
Participants………………………………………………………………........ 48
Measures—The Protective Factors Survey ………………………………….. 53
Development of the PFS…………………………………………………. 53
Phase I……………………………………………………………………. 53
Phase II…………………………………………………………………… 54
Phase III………………………………………………………………… 59
Phase IV………………………………………………………………….. 62
Limitations………………………………………………………………. 67
Analytic Strategy……………………………………………………………… 68
Power………………………………………………..………………….. 68
Data preparation and screening…………………………………..……. 68
Normality………………………………………………………………… 69
Missing data…………………………………………………………….. 69
The research design………………………………………………..……. 71

iii
Structural equation modeling (SEM ) ……………………………………. 71
Confirmatory factor analysis (CFA)……………………………………. 72
Structural model………………………………………………………….. 77
Goodness of fit…………………………………………………..………. 80
The Research Questions and Models………………………………………… 80
Chapter 3: Results………………………………………………………………. 84
Sample………………………………………………………………………... 84
Examination of Normality……………………………………………………
88
The Measurement Model (CFA)…………………………………………….. 91
Question 1: To what extent do the items (manifest variables) in the PFS define the protective factors constructs (content validity and reliability)?.
93
Hypothesis 1: The manifest variables will load highly on the appropriate factors……………………………………………………..
93
Summary…………………………………………………………... 94
Question 2: What are the underlying relationships among the protective factors as measured by the items in the PFS (convergent validity)?............
96
Hypotheses 2a: Family functioning and social support will be highly positively correlated…………………………………………………...
96
Summary…………………………………………………………........ 97
Hypothesis 2b: Social support and concrete support will be positively moderately correlated…………………………………………………
97
Summary……………………………………………………………… 97
Hypothesis 2c: Social support and nurturing and attachment will be highly positively correlated……………………………………………
97
Summary…………………………………………………………….... 98

iv
Question 3: To what extent does the underlying structure of the PFS remain stable across time? ………………………………………………..
98
Hypotheses 3a:
The factor loadings for each construct will remain stable across time...................................................................................
99
Summary………………………………………………….................... 100
Hypothesis 3b: The relationships between the constructs will remain stable across time.
……………………………………………………. 102
Summary………………………………….……………....................... 102
Hypothesis 3c:
Latent mean scores will differ from Time One to Time Two……………………………………………………………...
103
Summary……………………………………………………………... 106
Question 4: What is the internal consistency of the items in each of the subscales?. ………………………………………………………………...
106
Hypothesis 4: Internal consistency for each subscale will exceed a Cronbach alpha of .8.………………………………………………….
107
Summary…………..………………………………………………….. 107
Additional Analyses: The Structural Model…………………………………. 108
Chapter 4: Discussion And Conclusions…………………………………………. 110
Context………………………………………….…………………………….. 110
Brief Summary………………………………………………….…………….. 111
Discussion……………………………………………………………………. 115
Question 1: To what extent do the items (manifest variables) in the PFS define the protective factors constructs (content validity and reliability)?..
115
Hypothesis 1: The manifest variables will load highly on the appropriate factors.................................................................................
116
Question 2: What are the underlying relationships among the protective factors as measured by the items in the PFS (convergent validity)?............
118

v
Hypotheses 2a: Family functioning and social support will be highly positively correlated…………………………………………………...
119
Hypothesis 2b: Social support and concrete support will be positively moderately correlated…………..……………………………………
120
Hypothesis 2c: Social support and nurturing and attachment will be highly positively correlated…………………………………………..
122
Question 3: To what extent does the underlying structure of the PFS remain stable across time? ………………………………………………
124
Hypotheses 3a: The factor loadings for each construct will remain stable across time...................................................................................
125
Hypothesis 3b: The relationships between the constructs will remain stable across time.
…………………………………………….…….. 126
Hypothesis 3c:
Latent mean scores will differ from Time One to Time Two……………………………………………..……………...
127
Question 4: What is the internal consistency of the items in each of the subscales?. ………………………………………………………………...
129
Hypothesis 4: Internal consistency for each subscale will exceed a Cronbach alpha of .8.………………………………………………...
130
Limitations……………………………………………………………………
131
Implications for Practice…………………………………………………...
133
Future Research……………………………………………………………….
136
References………………………………………………………………………...
140
Appendices…………………………………………..………………………………….
165
Appendix A: Participant Organizations in the Development of the Strengthening Families Protective Factors……………………………………
166
Appendix B: Protective Factors Survey User Manual……………………………. 169

vi
Appendix C: The Protective Factors Survey…………………………………. 195
Appendix D: MPlus Syntax ………………..………………………………... 200

vii
List of Tables
Table 1. Strengthening Families’ Protective Factors and Definitions…………………….. 22
Table 2. Instrument Review……………………………………………………………….. 28
Table 3. Alignment of CSSP and PFS Constructs………………………………………… 41
Table 4. Agency and Number of Participants……………………………………………... 49
Table 5. Demographic Characteristics…………………………………………………….. 51
Table 6. Correlations between PFS Subscales and Validation Scales…………………….. 58
Table 7. Time One – Time Two Correlations of PFS Factors…………………………….. 61
Table 8. Time One PFS – Time Two Criterion Scale Correlations………………………. 62
Table 9. Research Design…………………………………………………………………. 71
Table 10. Constructs, Operational Definition, & Expected Items to Load……………….. 74
Table 11. Research Questions, Model, and Explanation………………………………….. 83
Table 12. Comparison of Completers and Non-Completers on Pre Test…………………. 85
Table 13. Comparison of Completers and Non-Completers on PFS Scale Scores……….. 88
Table 14. Descriptive Statistics for the PFS Items Included in the Confirmatory Factor Analysis……………………………………………………………………………………..
90
Table 15. Fit Indices………………………………………………………………………. 92
Table 16. PFS Items and Factor Loadings………………………………………………… 94
Table 17. Time One – Time Two Correlations of PFS Factors…………………………… 98
Table 18. Measurement Invariance: PFS Items and Equated Factor Loadings…………... 101
Table 19. Measurement Invariance: Equated Correlations at Time One and Time Two.... 103
Table 20. Measurement Invariance: Equated Latent Means……………………………… 104

viii
Table 21. Comparison Time One to Time Two PFS Scale Scores………………………... 106
Table 22. Structural Model………………………………………………………………... 109

ix
List of Figures
Figure 1. Ecological Model and Risk and Protective Factors……………………………… 4
Figure 2. One Group Longitudinal CFA with All Parameters Estimated (including residuals)………………………………………………………………………………………
76
Figure 3. Structural Model…………………………………………………………………... 79

x
Acknowledgements
These last four and a half years during the completion of the Social Welfare
Doctorate program and especially, my dissertation have been an experiential journey
and a realization of the presence of protective factors in my own life. Without the
strong support of family, friends, and co-workers, I would never have been able to
keep all the balls in the air long enough to “get this dissertation off my plate.”
I’d like to sincerely thank my dissertation committee of Chairperson,
Christopher G. Petr, Ph.D., Methodologist Thomas P. McDonald, Ph.D., Jerry D.
Bailey, Ed.D., Steve Kapp, Ph.D., and Edward Scanlon, Ph.D. First of all, thank you
for saving me from myself and completing this dissertation rather than the three ideas
I had proposed. I sincerely say a silent thank you for that gift at least three times a
week. Chris always made time for me and recognized my struggles to keep work,
family, and school balanced. He helped me recognize the limitations of what could
be done and what I needed to do to create some space for myself. His feedback
always advanced the plot, stretched my thinking, and resulted in a better product.
Tom’s confidence in and support of me to attempt structural equation modeling
awakened my inner geek. Through our discussions about my study and SEM, my
understanding has grown. I’m continually reminded of how much I still have to
learn. I never expected to enjoy the stats part of the process as much as I did. Trying
something out then sharing and discussing it with Tom gave me a sense of
satisfaction that brought me confidence and encouragement to continue. Jerry has
been a mentor and a supporter of me from the day I started at KU. His commitment

xi
to public service and the people he works with is inspiring. When Jerry asked me
several years ago “Where will you be in five years?,” I told him I was a journey kind
of girl and did not know. Six years later, under his loving support and guidance, I am
completing my doctorate. He has given me the freedom and support to explore my
passions and feed my soul. Steve was the first person who took my interest in the
Protective Factors Survey seriously and supervised my independent study. When I
had no practical skills to do the factor analysis, he stood alongside me as the PFS
continued to unfold. He also was the chair for my research qualifying paper and put
up with my extreme anxiety. Ed challenged me to explore prevention and what it was
and was not. My understanding and passion for the topic began in his class. He also
helped me to become comfortable with the style of writer that I am. I felt
comfortable enough in his class to try cute and witty. That did not work.
I also want to thank my coworkers at the Institute, who provided me with
loving support and helped out in any way they could (including chocolate). Dana
Goble, Melody Lawrence, Sheryl Lang, and Barbara Brennan kept me sane in both
my professional and student life. My lunch club buddies gave me something to look
forward to every Wednesday. Becky Eason has been my reader since I started this
program and has been instrumental to my growth as a writer.
The J-Team members over the past several years—Elenor Buffington, Cristi
Cain, Karin Chang-Rios, Rebecca Gillam, Teri Garstka, Hilary Harms-Logan, Erin
Obermeier, Heather Rasmussen, and Stephanie Wallio—have lived the protective
factors. They have been involved with the Strengthening Families work and previous

xii
versions of the PFS. Together we have created something that we all believe will
make a difference in prevention work. They have epitomized social support and have
provided me unlimited assurance, confidence, and laughter. I am honored to be a part
of such a smart and sassy team of women who are and will continue to do great things
in this world.
I would also like to thank and acknowledge the national partners, who have
been so gracious in their support of me and this project. Toby Hyman and Jodi Tyson
from the Nevada Department of Health and Human Services, as pioneers in
community prevention work, implemented the PFS with all parent education
programs. They allowed me to use their efforts to contribute nationally to what we
know about the PFS. They made adjustments to their process and indulged my
zillions of emails to accommodate my needs for this project. Casandra Firman at the
FRIENDS National Resource Center for Community-Based Child Abuse and Neglect
Prevention, introduced me to the PFS workgroup along with Donna Norris. The PFS
idea was the brainchild of Donna, who thought such an instrument would be useful to
community-based programs. Melissa Brodowski, the Program Officer for
Community-Based Child Abuse and Neglect Prevention has encouraged me all along
the way and stretched my thinking. As a complexity thinker, she sees the connections
between programs, ideas, and evaluation, and is creating the federal environment to
realize these connections. Judy Langford and Nilofer Ashan at the Center for the
Study of Social Policy have been extremely supportive of this project and have

xiii
responded to my countless requests about the history and progression of the
Strengthening Families Initiative.
I want to acknowledge my colleagues at the State level who have tolerated
and supported my detour into academic life. Jim Redmon at the Kansas Children’s
Cabinet and Trust Fund has spent hours talking with me about the nuances of the
protective factors and what it means for prevention. He indulges my ideas, supports
the transfer of research to practice, and accordingly, encourages community-
university collaborations to bring research to life. Linda Kenney gave me the
opportunity to do early childhood work that deepens my thinking about maltreatment
from a public health perspective. The cooperation from community and state partners
has been overwhelming and gives me hope for continued change for children and
families.
My friends at the Center on Research Methods and Data Analysis started me
on this quantitative journey. Todd Little’s vision to support students to learn and use
SEM and other methods are a great resource to social workers and could greatly
expand how we think. Kris Preacher, good naturedly responds to my many emails
and has patiently answered questions that are never as simple as I had hoped. Alex
Schoemann has been my statistical consultant and probably dreams about the PFS.
His style of teaching and coaching builds both understanding and confidence. His
commitment to me and my timelines has enabled me to complete this work in a
relatively short period of time. I am grateful.

xiv
My parents, Marion and Geraldine Counts, have given me opportunities they
never had. As a first generation college student, I am blessed to have parents who
always believed in me and encouraged me to follow my dreams. They have shown
me that hard work, with a healthy dose of heart, makes all the difference. They have
lovingly supported me through this process and never had any doubt that I would
finish. My in-laws, Glee and Raleigh Eggers, have encouraged me all along the way
and have nurtured Bruce when I was otherwise occupied. I thank them for their
patience and understanding.
My dear friends— Becky Eason, Terry Helmick, Kelly Hearnen, Pat Kuester,
Cecilia Mills, Mary Pat Pellett, and many others—have given me a sabbatical from
friend responsibilities. I have missed them terribly and look forward to some serious
deck-sitting this summer. My kickboxing buddies have given me a weekly outlet to
release stress. My bookclub friends and cooking pals allowed me to show up as I
could, but never placed any demands on me and understood when I could not make it.
I dedicate this dissertation to my sons Keil and Kane Eggers and husband
Bruce Eggers. I am a very lucky woman. I have three men in my life who provide
daily social support and nurturing and attachment. Their unwavering love, support,
and tolerance are overwhelming. It has been a difficult couple of years juggling
work, family, and school. They have given me the space to do my work and have
picked up the slack in our daily life. Their forgiveness and kindness humbles me. I
hope I can be a similar bottomless fountain of support for them as they continue their
life’s journey. They also need to be credited with talking me into getting our dog

xv
Ruby, who has been at my feet during much of the writing. Finally, I want to thank
my best friend and husband Bruce Eggers. He has been my rock throughout this
process. I would not be at this place in life without him. This success is ours.

xvi
Abstract
Child maltreatment results in long term adverse consequences for victims and
poses significant costs to society. Prevention programs are reframing maltreatment
and focusing on protective factors in addition to risk factors. Easy-to-administer,
affordable, and psychometrically sound instruments that measure multiple protective
factors are lacking. The present study explored the reliability and validity of the
Protective Factors Survey (PFS), a tool developed to measure protective factors in
parents and caregivers. Confirmatory factor analyses were conducted with a sample
of 1,078 participants, who completed a parent education program in Nevada. Results
provide psychometric data that support a valid and reliable four-factor solution,
consisting of family functioning, social support, concrete support, and nurturing and
attachment. The present study contributes to the knowledge base of protective factors
and has implications for the field as a paradigm and tool for evaluation and research.

1
Chapter 1: Introduction
The existence of child maltreatment has been documented throughout history
and across cultures. In the 21st
Three interrelated problems are discussed in the Introduction to provide
context for the study—child maltreatment itself, a traditional focus on risk rather than
protective factors, and a lack of valid and reliable instruments to measure protective
factors in parents and caregivers. The first section describes the problem of
maltreatment along with prevention approaches, specifically parent education. Risk
and protective factors are discussed, and the case is made for focusing on protective
factors, rather than risk factors only. The second section describes the Strengthening
Families approach that is built around five protective factors, each of which has an
evidence base supporting them. While the approach resonates with the prevention
field, there is a need for more research and evaluation on the approach itself to
increase protective factors within families or on the combination of the protective
century, the American public and policy makers
agree that child maltreatment is an unpalatable social ill. Although it is difficult to
isolate a specific reason, rates of maltreatment appear to be declining. Recently, the
field of prevention began to reframe prevention and has developed a strengths-based
approach that focuses on protective factors. At present, however, there are no brief
instruments that measure multiple protective factors specific to the Strengthening
Families approach, which has been at the forefront of the reframing movement. This
study addresses that need by adding to the reliability and validity evidence of a
promising instrument that measures multiple protective factors.

2
factors to reduce child maltreatment. One potential cause for this is the dearth of
psychometrically-sound instruments to measure protective factors. A review of
available instruments and their limitations is provided along with a rationale for the
need for a brief instrument that measures multiple protective factors. The third
section describes the development of the Protective Factors Survey. The last sections
of this chapter describe the present study and research questions to assess the validity
and reliability of the Protective Factors Survey with a large sample of participants in
parent education programs.
The Problem of Child Maltreatment
Child maltreatment is defined as “an act or failure to act which results in
significant harm or risk of harm to a minor” (North Carolina Institute of Medicine,
2005, p. 2). There are four types of child maltreatment: physical abuse, neglect,
sexual abuse, and emotional/psychological abuse. The ecological perspective, which
provides an integrative theory of the etiology of child maltreatment, is the most
widely used in the child maltreatment field, acknowledges multiple causes of
maltreatment, and offers a framework to systematically address interrelated causes
(Belsky, 1980; Center for Disease Control 2007; Dahlberg & Krug, 2002). The
model encompasses four levels—individual, family, community, and societal
(Belsky, 1980; Center for Disease Control 2007). Accordingly, child maltreatment is
a result of complex interactions of protective and risk factors at the child, family,
community, and societal levels. On each level, risk factors increase the likelihood of
abuse, and protective factors insulate individuals and families from stress and

3
mitigate negative influences (National Research Council: Panel on Research and
Child Abuse and Neglect, 1993). A more detailed discussion of risk and protective
factors in the prevention of maltreatment and measurement of effectiveness is
presented later. Figure 1 shows the ecological model with risk and protective factors
at each level.

4
Fi
gure
1
Ecol
ogic
al M
odel
and
Ris
k an
d Pr
otec
tive
Fact
ors (
Nor
th C
arol
ina
Inst
itute
of M
edic
ine,
200
5)

5
Adverse consequences for maltreated children are well-documented and
include minor injuries and permanent injuries such as burns, brain injuries,
development delays, psychiatric disorders, and in the most severe cases—death
(Runyan, Wattam, Ikeda, Hassan, Ramiro, 2002). Trauma resulting from child
maltreatment has long term consequences that impact the victim well beyond the
maltreatment (Shonkoff & Phillips, 2004), including adverse health effects and
behaviors such as smoking, alcohol and drug abuse, eating disorders, obesity,
depression, suicide, sexual promiscuity, and certain chronic diseases (Felitti, Anda,
Nordenberg, Williamson, Spitz, Edwards, Koss, & James, 1998). Exposure to
adverse childhood experiences, which includes child maltreatment, chaotic early
environments, and premature death of a family member, can also result in premature
death, reduce life expectancy, and contribute to an intergenerational cycle of risk
factors (Anda, Dong, Brown, Felitti, Giles, Perry, Valerie, & Dube, 2009).
In addition to the human costs, child maltreatment also imposes significant
financial costs on society, with total annual costs exceeding $104 billion (Wang &
Holton, 2007). Direct costs to society in 2007 were estimated at $33 billion per
year, which includes the associated costs of maintaining a child welfare system, to
include judicial, law enforcement, health, and mental health services. Indirect costs
to society are those associated with the long term adverse effects of child
maltreatment, such as juvenile and adult criminal activity, mental illness, substance
abuse, and domestic violence. Other consequences include loss of productivity due to
unemployment and underemployment, the costs of special education services, and

6
increased use of health care. These other costs are estimated to be more than $71
billion per year. Compared to these billions of dollars, federal expenditures
specifically for child maltreatment prevention programs funded under the Child
Abuse Prevention and Treatment Act, Title II, total $42 million annually (M.
Brodowski, personal communication, September 4, 2009). Cost benefit analyses on
prevention programs found that for every dollar invested in prevention, a range of 19
to 34 dollars could be saved on the treatment and long term consequences of child
maltreatment (Caldwell, 1992; Caldwell & Noor, 2003.) Because child abuse
prevention generates such a substantial return on investment, it is important to
identify and promulgate those programs and practices which achieve positive
outcomes.
Other federal agencies also fund activities that may support child
maltreatment prevention although not designated specifically for that purpose. The
Maternal and Child Health Bureau (2008) launched the Early Childhood
Comprehensive Systems program in 2003 for states to create an early childhood
system integrating funding, services, and decision-making around five goals—health,
social and emotional development, early care and education, parent education, and
family supports. The grant’s intent is to overcome funding and delivery silos to
provide families with coordinated resources to foster positive outcomes in young
children. These goal areas address many of the risk and protective factors associated
with child maltreatment.

7
To support research on child abuse and neglect prevention, the Centers for
Disease Control (CDC) Injury Research Agenda (2009) identified five priorities for
the period 2009 to 2014: 1) explore the context of child maltreatment to identify
modifiable risk and protective factors, 2) identify and quantify the social and
economic burden of child maltreatment, 3) evaluate the effectiveness of parent-
focused strategies to prevent child maltreatment, 4) evaluate public and
organizational policies to prevent child maltreatment, and evaluate the dissemination
and implementation of evidence-based practices to prevent child maltreatment (CDC,
2009).
The encouraging news is that substantiated cases of child maltreatment are on
the decline. While prevention programs cannot be directly tied to population changes
in maltreatment rates, trends confirm that maltreatment is decreasing. In 2007,
794,000 children were maltreated, which is a decrease from 12.5 children per 1,000 in
2001 to 10.6 children per 1,000 in 2007. The Fourth National Incidence Study (NIS-
4: Sedlak, Mettenburg, Basena, Petta, McPherson, Green, & Li, 2010) also
confirmed this downward trend (The study’s methodology is described in more detail
in the following paragraph.) According to the NIS-4 (study year 2005-2006), over
1.25 million children were maltreated in the United States, which represents one of
every 58 children. Although still unacceptable, this number represents a 19 percent
decrease in the incidence of all types of maltreatment since the Third National
Incidence Study in 1993 and returns incidence rates to those of the Second National
Incidence Study in 1986 (Sedlak, et al., 2010).

8
Children under the age of four continue to be the most vulnerable and account
for 76 percent of maltreatment fatalities (National Child Abuse and Neglect Data
System: NCANDS, 2008), suggesting that prevention services in the early years are
critical. However, rates of substantiated cases of child maltreatment should be
interpreted with caution for several reasons. First, the National Incidence Study-4, a
mandated study of the incidence and prevalence of child maltreatment under the
Keeping Children Safe Act of 2003 (H.R. 14--108th
History of prevention. Prior to the 1970’s, few policies focused on child
maltreatment as a social problem. The Child Abuse Prevention and Treatment Act
was passed in 1974 largely in response to a study by Dr. Henry Kempe (1962), which
Congress: Keeping Children and
Families Safe Act of 2003), assumes that cases investigated by Child Protective
Services (CPS) are the “tip of the iceberg.” Based on this assumption, the study’s
methodology relies on sentinels—professionals who work with children—to identify
children who may have been maltreated during the study period who would otherwise
not be identified by CPS. This method enables an unduplicated count of maltreated
children and identifies cases that might not be reported to CPS (Sedlak, Gragg,
Mettenburg, Ciarico, Winglee, Shapiro, Hartge, Li, Greene, McPherson, 2008).
Second, the majority of child abuse goes unreported. For example, in a survey
conducted in North Carolina, mothers reported using harsh punishment 43 times
higher than the child abuse rate (Runyan, et al., 2002). Finally, definitions of child
maltreatment vary by jurisdiction, therefore are not a uniform indicator of child
maltreatment nationally (Ross & Vandivere, 2009).

9
revealed that many childhood injuries thought to be caused by accidents were actually
instances of child abuse. Title II of CAPTA, entitled the Community-Based Grants
for the Prevention of Child Abuse and Neglect (CBCAP), was the first federal child
maltreatment prevention program funding stream and emphasizes community-based
efforts to strengthen families and prevent maltreatment (U.S. Congress, 1973).
Prevention programs proliferated in the 1980s in response to a 24 percent increase in
reported child maltreatment rates in the mid-1970s (National Study on Child Abuse
and Neglect Reporting, 1977) and the presence of the CBCAP funding stream.
Prevention evolved beyond educating mandated reporters and focusing on parenting
deficiencies to include community-based strategies such as parent education
programs and self-help groups (Grazio, 1981).
In 2003, CAPTA was reauthorized as the Keeping Kids Safe Act of 2003
(H.R. 14--108th Congress: Keeping Children and Families Safe Act of 2003). Under
this reauthorization, CBCAP remains the largest federal funding stream for
community-based prevention programs. Prevention advocates and individual
programs will testify to the importance of community-based prevention activities.
However, CBCAP has not demonstrated effectiveness according to federal standards
because there has not been a rigorous national evaluation of the program. A lack of
long-term outcome measures and rigorous program evaluation contributed to a
“results not demonstrated” scoring from the Program Assessment Rating Tool
(PART), a process developed by the U.S. Office of Management and Budget (2007)
to assess and improve program performance.

10
While there is great interest on the national level to evaluate CBCAP
activities, there is neither a federal mandate nor resources to conduct an extensive
evaluation of the program as a whole. The funding itself poses extensive challenges
for a national evaluation. Every state is awarded CBCAP dollars and has wide
latitude to distribute the monies according to the legislated activities described below.
Depending on the funding distribution on the state level, programs may have differing
goals, objectives, and outcomes, making a unified evaluation difficult. The additional
complexities of braided funding, program fidelity, and menu of services offered by
community-based programs pose additional challenges for a national evaluation of
CBCAP.
On the state and program level, many issues may impede the rigorous
evaluation of prevention programs and could have contributed to CBCAP’s
effectiveness rating. Chief among these issues are lack of evaluation capacity and
expertise (Tomison, 2000). Many community-based programs operate on tight
budgets and do not have evaluation knowledge or capacity to conduct a program
evaluation. Further, fragmented funding and the nature of the services themselves
pose evaluation challenges. Many programs offer a continuum of services from
which parents can select, making it difficult to attribute outcomes to any specific
services (Knapp, 1995).
CBCAP legislation promotes a variety of service delivery models, encourages
parent leadership of underrepresented groups, and requires public information
activities, but does not include the types of performance or efficiency measures that

11
would allow for documentation of the federal investment in community-based
programs. Home visitation, parent education, early intervention, family support, and
public awareness campaigns are examples of activities funded by CBCAP (FRIENDS
National Resource Center for Community-Based Abuse Prevention, 2007) and have
been linked to reductions in child maltreatment. This study focuses on parent
education.
Prevention and parent education programs. Parent education programs
are one of many strategies to prevent child maltreatment. However, a strong link
between parent education programs and child maltreatment rates is not well-
established, perhaps due to ethical issues and to the difficulties of tracking program
participants. For example, much of the survey research that has been conducted has
been done with child protective service populations. The service mandate for this
population makes experimental designs that use control or “no treatment” groups
unattainable (Ammerman, 1998). Another reason for the missing link between
parent education programs and a reduction in child maltreatment is the lack of valid
and reliable measures of the incidence of child maltreatment in modest-sized
programs for at-risk families that are not involved in the child welfare system (Ross
& Vandivere, 2009). While large-scale studies such as the National Incidence Study
of Child Abuse and Neglect have developed valid and reliable methods to assess the
incidence of maltreatment for the population on a large scale, this methodology is not
appropriate for small to moderate-sized evaluations (Ross & Vandivere, 2009). For
that reason, indicators, which are a number that measures a concept, are often used to

12
assess program efficacy. Indicators can measure primary outcomes such as
maltreatment or intermediate effects such as reductions in risk factors or increases in
protective factors. When selecting indicators, practitioners and researchers should
select indicators that are culturally-sensitive, easily understood, interpretable, and
have wide acceptance by the field, decision makers, and researchers (Ross &
Vandivere, 2009).
Parent education research. The following section provides a synthesis of
parent education research. Four meta-analyses, a combined total of almost 200
primary and secondary prevention programs with some overlap, report consistent,
moderate effect sizes.
MacLeod and Nelson (2000) used meta-analytic techniques to determine
program effectiveness of 56 programs to promote family wellness and prevent child
maltreatment. Family wellness was defined as the “presence of supportive,
affectionate and gratifying parent-child relationships and a stimulating home
environment that is conducive to positive child development" (p. 1129). Programs
ranged from promotion of wellness at one end to intervention for reoccurrence of
maltreatment at the other. The overall effect size was .41, suggesting that proactive
and reactive approaches achieved better outcomes than 66 percent of the
control/comparison groups.
Lundahl, Nimer, and Parsons (2006) conducted a meta-analysis of 23 studies
to determine the effectiveness of parent training programs to reduce the risk of child
maltreatment and the effect of moderators to influence outcomes. The outcomes

13
were parents’ emotional adjustment, child-rearing attitudes, child-rearing behaviors,
and documented abuse. Standardized measures were used in each of these areas.
Overall, parenting program results showed moderate effects (d=.45-.60) and
significant, positive gains in all areas. Conclusions suggest that parent training
programs were effective in reducing risk factors of maltreatment.
Geeraert, Noortgate, Grietens, & Onghena (2004) searched an international
database for studies between 1975-2002 on selective prevention programs for at risk
families. Included studies focused on decreasing maltreatment risk by having a
positive effect on the child’s functioning, parent-child interaction, parent’s
functioning, family functioning, and the family context (socioeconomic and social
network). The overall effect size was estimated to be .29, and provides evidence that
prevention programs to reduce maltreatment generally have a positive effect on the
proxy variables mentioned above.
The Centers for Disease Control and Prevention conducted a meta-analytic
review to determine what specific components of parent training programs yield the
largest effect sizes (Kaminski, Valle, Filene, & Boyle, 2008). Seventy-seven
published evaluations of parenting training to prevent or minimize early childhood
behavior problems were selected. Effect sizes ranged from .13 to .88 with a
significant overall effect size similar to those found in the above referenced meta-
analyses. The effect sizes of parent outcomes (knowledge of parenting, attitudes,
behavior, and self-efficacy) were larger than child effect sizes. Program components
related to positive parent behavioral outcomes were opportunities to practice skills

14
with their child, positive parent-child interactions and emotional communication, and
positive discipline techniques. Program elements consistently associated with
smaller effect sizes were a focus on problem solving and communication, the parental
promotion of cognitive and academic outcomes, and ancillary services.
Risk and protective factors and limitations of the literature. The terms
risk and protective factors describe conditions under which problems thrive and
wither (Fraser, Richman, & Galinsky, 1999). Risk is the probability of a future event
occurring given a certain set of conditions. Risk factors are causes or markers of the
problem. As the number of risk factors increases, so does the likelihood of the
problem. Protective factors are the opposite of risk factors, also predict future
outcomes, and modify or buffer risk factors (Rutter, 1987).
Most parent education programs target attitudes and behaviors known to
reduce the risk of maltreatment. Participation in these programs has been linked to
improved emotional well-being, changed parent beliefs about corporal punishment as
an effective discipline technique, more realistic expectations for children, and
increased skills to communicate and interact with children (Geeraert, et al., 2004;
Lundahl, Nimer, & Parsons, 2006; Repucci, Britner, & Woolard, 1997; MacLeod &
Nelson, 2000; Kaminski et al., 2008; Thomas & Zimmer-Gembeck, 2007). Although
not specifically described in this manner, these reductions in risk factors often
indicate an increase in protective factors.
The limited research on the effectiveness of parent education programs to
increase protective factors has narrowly focused on family functioning and

15
knowledge of child development with less attention on social and concrete support
and nurturing and attachment. Although Geeraert, et al. (2004) described outcomes
as reductions in risk factors, the increases in parent functioning and family
functioning and improvements in the family context could be considered protective
factors. Kaminski et al. (2008) did not specifically mention protective factors,
however problem solving and communication are components of family functioning.
MacLeod & Nelson’s (2000) review on family wellness included social and concrete
support as moderator variables or components of programs, but not as outcomes.
Interestingly, as a moderator variable, programs that included social support and
concrete support as program components resulted in lower effect sizes. A possible
explanation is that the presence of a social network may result in more observation
and reporting of child maltreatment.
In a systematic review of the literature on maltreatment from 1980-2004, 188
studies were explored to identify gaps in prevention strategies and suggest future
directions for implementation (Klevins & Whitaker, 2007). Only a few of these
studies mentioned protective factors. In those that did, definitions and the
exploration of protective factors were not consistent across the studies. Because of
the inconsistent definitions and limited mention of protective factors in the 188
studies, protective factors were not a focus of the Klevins & Whitaker review.
The majority of studies on child maltreatment, including the meta-analyses of
these studies, occurred prior to the development of the Strengthening Families (SF)
approach and the movement to reframe the focus on protective factors, which are

16
described in detail below. The following section discusses why a focus on the
protective factors is important and has the potential to move the field forward.
Limitations of a risk perspective and potential of a protective factors
perspective. While the statistical techniques used to collect and analyze data on risk
and protective factors are virtually indistinguishable from each other, a protective
factors lens has the potential to overcome the limitations of a risk model and
significantly alter the reach and potentially, the outcomes of child maltreatment
prevention efforts. Prevention programs organized predominantly around risk
schema may be imposing the following practice constraints that limit the impact of
services.
First, selective prevention programs based on risk criteria engage a small
segment of the population. Prevention programs such as home visitation, parent
education, and family support programs serve approximately two million children
under the age of five annually, which is approximately 11 percent of the 21 million
children under the age of five (U.S. Census Bureau, 2008). For parents to be
referred to and engaged in these programs, they have to acknowledge deficits or be
court-mandated to participate in services. As a result, participating in a program
based on a risk-model may be stigmatizing to parents and reduce participation in
programs. The protective factors approach, on the other hand, may help overcome
the stigma of participating in prevention programs. A more universal approach based
on protective factors would enlarge the breadth of partners to include child care and
early education programs and providers. While parents may be resistant to

17
acknowledging deficits or inadequacies in risk-focused programs, most parents,
including those who utilize child care or early education programs, can relate to
feeling overwhelmed at times and want to be better parents. They may be more open
to and accepting of approaches that acknowledge and build on their strengths.
Further, most parents have trusting relationships with the people who care for their
children, so may be more likely to lean on them for support. A trusting relationship
with non-threatening and accepting staff is more likely to engage parents (Oynskiw,
Harrison, Spady, & McConnan, 1999; Toban & Lutzker, 2001) and result in higher
levels of retention.
In summary, protective-focused models may engage larger numbers of
children and families because of greater reach, less stigma, and strong relationships
with providers. For example, over 12 million children under the age of six spend
time in some type of child care or early education setting each week. The average
time spent in these settings is 37 hours per week (National Association of Child Care
Resource and Referral Agencies, 2009). By linking early care and education
program with prevention programs, the number of children and families engaged in
efforts to strengthen families could increase seven-fold to 14 million children, which
is over two thirds of the population of children under the age of five (U.S. Census
Bureau, 2008).
Second, in many practice settings, risk assessments are conducted at a static
point in time, and services are based on the results. However, the child and the
family constantly change. The family may develop risk factors that warrant different

18
or additional services from other agencies or systems (Sidebotham, 2001; Asawa,
Hansen, & Flood, 2008). For example, a family screened at the birth of a child may
not be at risk at this time. Changes in marital or employment status in the first year of
the child’s life may place stressors on the family that could be mitigated through
parent education, home visitation, or other family supports. Until the family asks for
help or is referred to child welfare, the family would go without services because they
were at low risk when screened. A protective-factors approach that includes a larger
tent of prevention partners could elongate the continuum of screening points and
result in multiple entry points for families. Families would benefit from ongoing
support of the provider and would be referred for more intensive services, if needed.
Third, risk factors are not always reliable as predictors of maltreatment.
Many parents with multiple risk factors do not abuse their children, while the reverse
is also true. That is, families with no identified risk factors maltreat their children
(Ross & Vandivere, 2009). Studies of children at high risk for maltreatment found
that the majority of parents who were abused or neglected as children do not maltreat
their own children (Egeland, Bosquet, and Chung , 2002; Parker, Piotrowski, & Peay,
1987; Higgins, 1994). In a study of intergenerational violence, researchers found
that protective factors distinguished individuals who repeated the cycle of violence
from those who broke it (Dixon, Browne & Hamilton-Giachritsis, 2009). Therefore,
a mixed model of prevention—including programs based on risk and universal
protective factors—would be the most comprehensive method to reach parents.

19
Fourth, many risk factors such as low maternal age, maltreatment as a child,
and marital status at child’s birth, are static, therefore cannot be influenced by
programmatic strategies (Ross & Vandivere, 2009). The protective factors identified
by the Center for the Study of Social Policy (CSSP) in the following section, on the
other hand, are malleable and can be addressed by a continuum of programming,
including traditional prevention programs plus early care and education settings.
Finally, a focus on protective factors is consistent with the strengths-based
perspective of social welfare and could increase the involvement of the field of social
welfare in early childhood, support early intervention and a public health approach to
child maltreatment, and potentially reduce the need for tertiary interventions for child
maltreatment. Seeing prevention through a protective factors lens makes sense from
a practice and research standpoint and has significant potential to increase the reach
of prevention programs and contribute to reductions in child maltreatment. The
following section describes an emerging, feasible, and appealing approach to promote
protective factors in families in a variety of settings.
Reframing Prevention: Strengthening Families and the Protective Factors
In early 2003, Prevent Child Abuse developed a national reframing strategy to
communicate and advocate on behalf of child prevention to shift the public perception
about child maltreatment from a condition that will always be present in society to
one that is preventable (Kirkpatrick, 2004). They partnered with the Frameworks
Institute to better understand the public’s frame of reference on child maltreatment.
The Frameworks Institute began a research process that included a meta-analysis of

20
existing public awareness, understanding and opinion on child abuse from 1983 to
2003, one-on-one interviews with individuals exploring how people think about child
maltreatment, six focus groups in three locations across the United States, analysis of
marketing materials used by prevention advocates, and a news content analysis of
media coverage of child abuse and neglect.
These research activities resulted in a final report and several working
hypotheses for a strategic reframing of child maltreatment. In summary, the
hypotheses found that public awareness of child maltreatment and an understanding
of the root causes are high. When the public thinks about maltreatment, it is only
about the most extreme cases. Less severe types of causes confuse the general public
and are often attributed to accidents or circumstances beyond the parents’ control.
Although the general public wants to avoid judgment, there is little sympathy for
abusive or neglectful parents. Parents, however, possibly as a defense mechanism to
insulate themselves from judgment, acknowledge that parenting is a tough job.
Despite the acknowledgement of parenting as a challenging job, parents are hesitant
to ask for help. Finally, outside of reporting abuse to authorities, the public feels it
has little power to do anything about child maltreatment either individually or
systematically (Kirkpatrick, 2004).
Building on this work, the reframing movement continued to evolve by
communicating that parenting is a difficult job and that all families need help. The
movement has been largely influenced by the Strengthening Families Initiative (SFI)
work of the Center for the Study of Social Policy (CSSP, 2004a), which reframed

21
child abuse and neglect prevention by using a strengths-based approach with early
care and education programs. Funded by the Doris Duke Charitable Foundation, the
CSSP was charged with the task of developing a systemic, high-impact primary
prevention strategy that targeted children under the age of five and their families
(Langford & Harper-Browne, in press). The intention was to identify a feasible
approach to child maltreatment prevention that could be disseminated nationally,
reach a large number of very young children and have impact long before abuse or
neglect occurred. The guiding hypothesis was that early care and education
programs could be a central point of influence because staff have daily contact with
parents and children, have strong, intimate relationships with families, offer a
universal approach to provide positive encouragement and education to families, and
could provide an early warning and response system at the first sign of problems.
The CSSP process involved four steps: 1) Conduct an extensive literature review to
identify what factors reduce child maltreatment, 2) Explore the connection between
factors that prevent maltreatment and what early childhood programs do to build
them, 3) Identify programs that build the factors and learn how they do it, and 4)
Learn about policy and practice changes needed to infuse the model statewide
through a partnership with seven pilot states (CSSP, 2004b).
The CSSP Strengthening Families’ literature review was conducted by the
Erickson Institute and proposed five protective factors asserted to be linked, both
conceptually and empirically, to a reduction in child maltreatment. The protective
factors were: social support, concrete support in times of need, parental resilience,

22
knowledge of parenting and child development, and healthy social and emotional
development of young children (CSSP, 2004a). Table 1 shows the original
protective factors and definitions proposed by the CSSP.
Table 1
Strengthening Families’ Protective Factors and Definitions
Protective Factor Definition
Parental Resilience The ability to cope and bounce back from all types of challenges
Social Connections Friends, family members, neighbors, and other members of a community
who provide emotional support and concrete assistance to parents
Knowledge of Parenting
and Child Development
Accurate information about raising young children and appropriate
expectations for their behavior
Concrete Support in Times
of Need
Financial security to cover day-to-day expenses and unexpected costs
that come up from time to time, access to formal supports like TANF
and Medicaid, and informal support from social networks
Children’s Social and
Emotional Development
A child’s ability to interact positively with others and communicate his
or her emotions effectively
(CSSP, 2004a)
Input was gathered from the field through dialogue sessions at national
conferences and in consultation with leaders at national child maltreatment prevention
and early childhood organizations. The purpose of the dialogue sessions was to
present the identified protective factors to the national organization leaders in the
field of early childhood and child maltreatment prevention to determine if the
protective factors: 1) are aligned with practitioners’ experience, 2) would engage a
variety of partners who were connected to families, and 3) are supported by the

23
research presented in the Erickson Institute literature review. In these sessions,
participation ranged from groups of 10 to 100. Participant organizations included
Community Based Child Abuse and Neglect Prevention Programs, Child Trends,
Child Welfare League of America, Family Support America, Free to Grow, the
National Alliance of Children’s Trust Funds, the National Association of Education
for Young Children, the National Association of Child Care Resource and Referral
Agencies, the National Child Care Association, Prevent Child Abuse America, USA
Child Care, and Zero to Three. (Descriptions of the participant organizations can be
found in Appendix A.)
Information from the dialogue sessions was used to refine the protective
factors framework, assess whether there would be the interest and energy to embrace
this approach in the field, and start building a base of awareness and knowledge about
the protective factors as a framework for thinking about child abuse and neglect
prevention. The first step was to identify programs that already built protective
factors in families and to document how they do so. A national study was designed
to capture this process. Across the nation, 500 individuals from the fields of early
childhood and child abuse and neglect prevention were asked to nominate exemplary
early care and education programs that built protective factors in their day-to-day
practice with children and families. Nominated programs were asked to fill out an
extensive survey describing their work to build the protective factors described above,
as well as to submit supplementary materials such as calendars of activities, curricula,
resource materials for parents, and so on. One hundred child care and early care and

24
education programs responded to the nominations by filling out the survey and
sending materials. Out of these, 25 were selected and received two-day site visits
from CSSP. Programs reflected diversity in: region of country, program model and
auspices, budget size, and target population. The site visits involved structured
observation of pick-up and drop-off, focus groups with staff, parents, and community
partners, interviews with the director and key staff members, and individual
interviews with selected parents.
Based on the information collected, a number of tools were developed to
support programmatic implementation of Strengthening Families in early childhood
settings. The most important of these was a guidebook and self-assessment for early
childhood programs. The guide and self-assessment provide specific areas of
practice where an early childhood program can increase their capacity to build
protective factors for families. These tools allow flexibility in implementation while
creating a structured framework to guide Strengthening Families practice at the local
level.
The next step in the development of the Strengthening Families Initiative was
a two year pilot that enlisted states to create partnerships that would explore the
policy, training, and capacity building framework needed to support program capacity
to build protective factors. States participating in the pilot received no additional
funds, only technical assistance and support. To qualify for the pilot, states had to
demonstrate collaboration between the early childhood, child abuse and neglect
prevention, and child welfare sectors (as demonstrated in shared submission of the

25
proposal) and to have developed an initial implementation plan. The response from
states was surprising. Forty-three states expressed interest, 27 states applied and,
finally, seven were selected (Alaska, Arkansas, Illinois, Missouri, New Hampshire,
Rhode Island and Wisconsin)
Several points of influence to implement sustainable systems change were
identified:
. CSSP offered technical assistance, provided tools for
the promotion of Strengthening Families, coordinated cross-site learning, and
documented lessons learned. Throughout the two year period, the pilot states
developed new tools and materials to promote the protective factors, tested
implementation strategies, and shared knowledge through a learning network. The
evaluation of the pilot project used mixed methods to document “hallmarks” or
evidence of diffusion strategies of Strengthening Families rather than programmatic
outcomes. In other words, the evaluation identified the pilot states’ ability to
implement the approach. Effectiveness of implementation strategies to increase
protective factors was not addressed (CSSP, 2004b).
parent partnerships, state infrastructure, professional development, early
childhood systems building, and child welfare linkages (Langford & Harper-Browne,
in press). It became evident that Strengthening Families had utility beyond a
universal approach limited to early care and education, a reach that greatly exceeded
the expectations of the developers. Today, Strengthening Families has a presence in
all 50 states and serves as a guiding framework for Community-Based Child Abuse
and Neglect Prevention programs, child welfare systems, Head Start, family child
care homes, afterschool programs, and state and community prevention plans

26
(
Despite this broader reach, Strengthening Families has its limitations. It is
important to clarify what Strengthening Families is and is not. Strengthening
Families is an approach with the end goal of increasing protective factors in families
to prevent child maltreatment. Strengthening Families is not an evidence-based
model with clearly defined implementation elements. Strengthening Families can be
integrated into existing programs. Programs subscribing to the approach may utilize
differing strategies, resources, and partners. The flexibility of the approach is
attractive to many in the prevention field because it builds on existing strategies, is
easily understandable, and also translates well to parents (Strengthening Families
Illinois, 2007). Nationally, all 50 states are implementing or integrating the
Strengthening Families approach in some manner as a primary prevention child
maltreatment strategy (National Alliance of Children’s Trust Funds, 2009). Despite
this broad uptake of the protective factors’ philosophy, there remains a gap in the
research to document its effectiveness to increase protective factors in families, and
ultimately lead to a sustainable reduction in child maltreatment.
Langford & Harper-Browne, in press; National Alliance of Children’s Trust Funds,
2009). The protective factors framework resonates with a much wider audience than
a risk model and multiples the number of stakeholders who work with families to
prevent maltreatment.
The inclusiveness of the approach leads to an elusiveness when attempting to
document the quantity of Strengthening Families within a program. Although the SF
guidebook and self-assessment suggest strategies to strengthen families, the lack of a

27
program implementation guide does not allow for measures of fidelity. Therefore,
while there is theoretical support for the protective factors, questions remain about the
quantity of SF and combination of strategies necessary to affect change. Finally, it
remains to be seen whether adding Strengthening Families to an evidence-based
program creates an additive or dilutive effect on outcomes.
One of the first needs to answer the aforementioned questions and build an
evidence base for the Strengthening Families approach is a way to measure the
protective factors as specified by CSSP. The following section provides a review of
instruments developed prior to the Strengthening Families initiative and demonstrates
the need for an instrument that measures multiple protective factors that align with
the Strengthening Families approach.
Instrument review. A review of 59 instruments included in the FRIENDS
Compendium of Annotated Measurement Tools (FRIENDS National Resource
Center, 2008) was conducted by the researcher to identify instruments that measure
protective factors against child maltreatment. FRIENDS, the National Resource
Center for Community-Based Child Abuse and Neglect Prevention Programs
(CBCAP), provides technical assistance to the state lead agencies that receive
CBCAP funding. The purpose of their Compendium was to assist programs funded
under CBCAP with evaluation plans by providing them with annotations of tools used
to measure prevention outcomes. The Compendium is comprised of instruments
used by community agencies to document prevention outcomes. To be included in
this researcher’s review, tools had to measure one or more protective factors, focus on

28
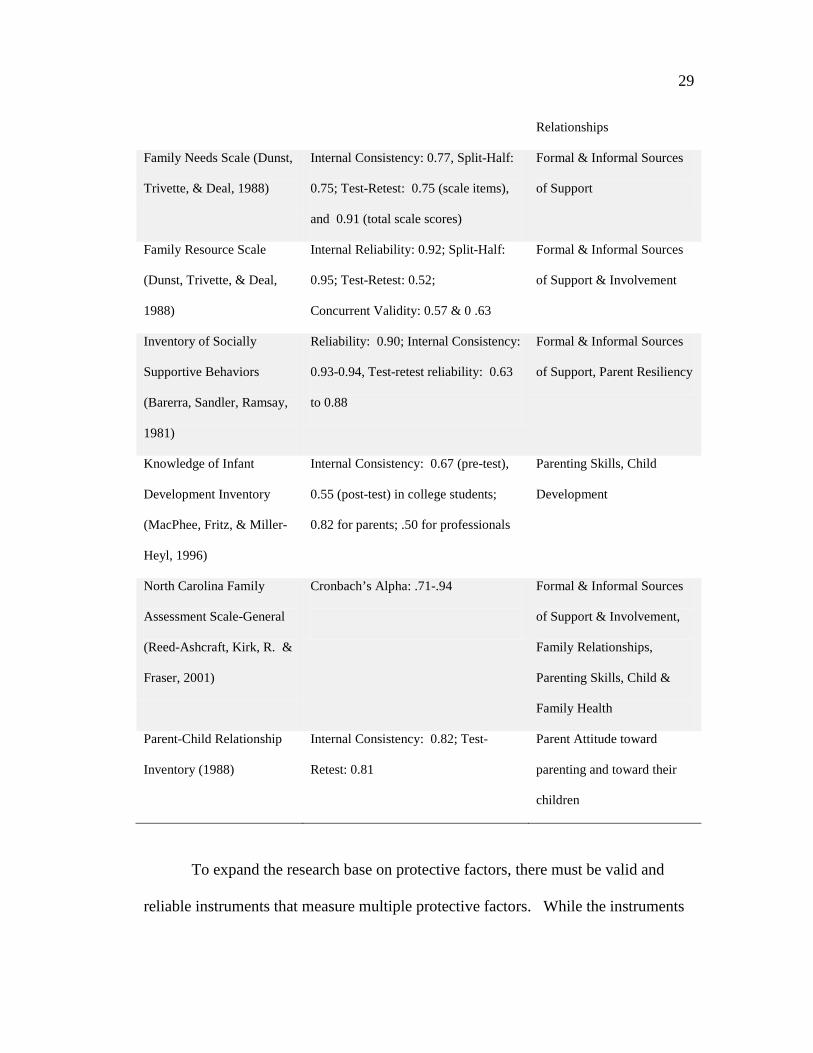
the parents/caregivers, and demonstrate validity and reliability. Table 2 shows the 10
valid and reliable self-report instruments for parents, caregivers, or families that met
the inclusion criteria and measured at least one of the CSSP protective factors.
Table 2
Instrument Review
Instrument Psychometrics Domains
Coping Health Inventory for
Parents (McCubbin,
McCubbin, Patterson,
Cauble, & Warwick, 1983)
Internal Consistency:
Subscale 1: 0.79; Subscale 2: 0.79;
Subscale 3: 0.71
Child Health, Parenting a
child with Special Needs,
Formal and Informal Sources
of Support, Parent & Family
Resiliency
Family Adaptability and
Cohesion Evaluation Scale
(Olson, Gorall, & Tiesel,
2004)
Internal Consistency:
Disengaged :0.87; Enmeshed: 0.77;
Rigid: 0.83; Chaotic : 0.85;
Balanced Cohesion: 0 .80; Balanced
Flexibility: 0 .80; Validity: 0.91-.93
Family Relationships
Family Assessment Form
(McCroskey, Sladen, &
Meezan, 1997)
Construct Validity: 0.63; Inter-Rater
Reliability: 75-80 percent; Inter-Item
Reliability: 0.68-.90
Child &Family Health,
Family Relationships,
Parenting, Sources of
Support
Family Environment Scale
(Moos & Moos, 1983)
Internal Consistency: 0.61-.78
(manual reports) & 0 .31-.72 (Boyd
Study)
Child & Family Health,
Formal & Informal Sources
of Support & Community
Involvement, Family
29
Relationships
Family Needs Scale (Dunst,
Trivette, & Deal, 1988)
Internal Consistency: 0.77, Split-Half:
0.75; Test-Retest: 0.75 (scale items),
and 0.91 (total scale scores)
Formal & Informal Sources
of Support
Family Resource Scale
(Dunst, Trivette, & Deal,
1988)
Internal Reliability: 0.92; Split-Half:
0.95; Test-Retest: 0.52;
Concurrent Validity: 0.57 & 0 .63
Formal & Informal Sources
of Support & Involvement
Inventory of Socially
Supportive Behaviors
(Barerra, Sandler, Ramsay,
1981)
Reliability: 0.90; Internal Consistency:
0.93-0.94, Test-retest reliability: 0.63
to 0.88
Formal & Informal Sources
of Support, Parent Resiliency
Knowledge of Infant
Development Inventory
(MacPhee, Fritz, & Miller-
Heyl, 1996)
Internal Consistency: 0.67 (pre-test),
0.55 (post-test) in college students;
0.82 for parents; .50 for professionals
Parenting Skills, Child
Development
North Carolina Family
Assessment Scale-General
(Reed-Ashcraft, Kirk, R. &
Fraser, 2001)
Cronbach’s Alpha: .71-.94
Formal & Informal Sources
of Support & Involvement,
Family Relationships,
Parenting Skills, Child &
Family Health
Parent-Child Relationship
Inventory (1988)
Internal Consistency: 0.82; Test-
Retest: 0.81
Parent Attitude toward
parenting and toward their
children
To expand the research base on protective factors, there must be valid and
reliable instruments that measure multiple protective factors. While the instruments

30
reviewed met the inclusion criteria and measured protective factors against child
maltreatment, they do not meet the need of community-based agencies for easy-to-
administer and affordable instruments, nor do they measure multiple protective
factors as described by CSSP. Limitations of the instruments are discussed below.
Limited inclusion of protective factors and population fit. These
instruments, as a whole, are valid and reliable and assess such constructs as concrete
support, coping, flexibility, family cohesion, problem solving and communication,
social/emotional support, family functioning, and knowledge of infant development.
However, none of the measures provides an assessment of multiple protective factors
in one easily-administered instrument. Community-based agencies interested in
measuring multiple protective factors against child maltreatment would have to use
several measures. Such an endeavor could become costly and time prohibitive.
Further, some instruments such as the Coping Health Inventory (McCubbin et al.,
1983) were designed for specific populations such as children with special needs.
Finally, many of the instruments measure the source, quantity, and quality of support.
This is problematic because it is the perception rather than the aforementioned
attributes of support that is important as a predictor of child maltreatment (Belsky,
1993; Egeland, et al., 2002).
Lengthy administration and qualifications of administrator. Some
measures present additional barriers for use by community-based agencies. For
example, the Family Adaptability and Cohesion Evaluation Scale (FACES IV) is a
42-item, self-report instrument with six scales that is used to measure family cohesion

31
and flexibility (Olson, et al., 2004). The scales demonstrate adequate reliability.
This measure, however, requires specific training and education in order to administer
the survey—a minimum of a master’s degree—that may pose challenges for
community-based programs, particularly in rural areas with a scarcity of agency staff
with advanced degrees. The Family Assessment Form (FAF) is also a six-scale
instrument with adequate reliability (McCroskey, et al., 1997). The scales are
administered by a home visitor or family support worker over three to four contacts
with the family. The administration time of more than one hour may make it
difficult for community-based programs with limited staff resources.
The Development of the Protective Factors Survey
The focus on protective factors is gaining momentum as a necessary and
productive approach to child maltreatment prevention because protective factors
benefit all families, help build positive relationships with service providers, and draw
on natural support systems that contribute to long-term success (Child Welfare
Information Gateway, 2009). Nationally, CBCAP and national partner
organizations, including BUILD: Strong Foundations for Children, FRIENDS, the
National Association for the Education of Young Children, the National Alliance of
Children’s Trust and Prevention Funds, the National Child Care Information and
Technical Assistance Center, United Way, and Zero to Three have endorsed the
Strengthening Families approach and are integrating it into their work (Strengthening
Families, 2009). The adoption of the approach by both national organizations and
prevention programs on the state and community level warrants a need for tools to

32
measure multiple protective factors in families. As mentioned earlier, it is critical to
document the Strengthening Families approach’s effectiveness to increase protective
factors in families and ultimately lead to a sustainable reduction in child
maltreatment. The following section describes the development of the Protective
Factors Survey (PFS) and this researcher’s involvement in the development and
subsequent testing of the PFS.
Three factors contributed to this researcher’s involvement with the PFS: 1)
national interest in Strengthening Families and the protective factors, 2) the
researcher’s participation in the CBCAP Program Assessment Rating Tool (PART)
workgroup, and 3) the researcher’s interest in evaluating and conducting research on
prevention.
At the annual CBCAP conference in 2006, CSSP presented on the
Strengthening Families Initiative and the protective factors. The approach was
endorsed by CBCAP, and states were encouraged to incorporate the approach into
prevention frameworks. During the same time period, the researcher was a member
of the CBCAP Protective Factors Survey Subcommittee. This group was formed in
response to the inconclusive rating of CBCAP through the PART process, as
described earlier. This subcommittee was charged with making recommendations on
a data collection process that would document how currently-funded programs
increase protective factors. Program staff led by Donna Norris at the Texas
Department of Health and Human Services proposed the development of a brief
survey tool that would measure multiple protective factors. The CBCAP

33
subcommittee, under the leadership of FRIENDS staff Casandra Firman, proposed a
set of items that could be used as a tool to measure protective factors. Because of an
interest in research and survey development, this researcher suggested that the
psychometric properties of the PFS be examined before the tool was widely
distributed. The group concurred and the testing of the PFS began and is described
fully in the methods section.
Alignment with Center for the Study of Social Policy protective factors.
Because of the national interest in and adoption of the SF approach, it was important
for the Protective Factors Survey to align with the CSSP protective factors to the
extent possible. Three of the CSSP protective factors—social connections, concrete
support in times of need, and knowledge of parenting and child development—
correspond directly with the PFS (See definitions in Table 3.) Differences between
the CSSP model and this study are the conceptualization of parental resilience, the
addition of nurturing and attachment, and the absence of children’s social and
emotional competence.
Parental resilience was originally defined by the CSSP as “the ability to cope
and bounce back from all types of challenges” (CSSP, 2004a). Definitions of
resilience include adaptation to extraordinary circumstances and positive outcomes in
the face of diversity (Fraser, Richman, & Galinsky, 1999), a process that results in
positive coping in the face of adversity (Gilligan, 2004), the ability to bounce back
from negative emotional experiences, and to be flexible and adaptive in stressful
situations (Tugade & Fredrickson, 2004). Resilience has been characterized by three

34
strands of successful functioning—overcoming the odds, sustaining competence
under pressure, and recovering from trauma. Strengthening Families is a primary
prevention strategy that occurs prior to maltreatment, therefore the authors of the PFS
focused on the malleable components of resilience—overcoming the odds and
sustaining competence under pressure. Further, it would be beyond the scope of a
brief pre-post instrument to capture the number and types of stressful situations the
parent was exposed to and their reactions and actual behaviors to overcome them.
There is substantial research on the other strand—recovering from trauma and
resilient children. Studies of children at high risk for maltreatment found that the
majority of parents who were abused or neglected as children do not maltreat their
own children (Egeland, Bosquet, & Chung, 2002; Parker, Piotrowski, & Peay, 1987;
Higgins, 1994), suggesting that something occurred in the victims’ lives to overcome
the odds, maintain competence under pressure, or recover from the initial trauma
(Fraser et al., 1999).
Because of the focus on malleable components, primary prevention, and
needs of prevention programs for an easy-to-use instrument, the authors of the PFS
decided to focus on family functioning and competencies associated with resilient
adults—adaptive coping, problem solving (Hetherington & Blechman, 1996), and
feelings of mastery about parenting. The research supporting family functioning is
summarized below in the Protective Factors Survey literature review. Nurturing and
attachment were also identified as a protective factor against child maltreatment in an
additional literature review (Counts, Buffington, Chang-Rios, Rasmussen, &

35
Preacher, in press), which is described in the following section. The protective
factor—children’s social and emotional competence—was not included in the PFS or
this study because the focus is on increases in protective factors of parents and
caregivers rather than children.
The protective factors literature review. This study and the PFS focus on
protective factors that can be targeted for change in parents or caregivers. For that
reason, only parental protective factors—family functioning, social support, concrete
support, nurturing and attachment, and knowledge of parenting—are included in the
literature review.
Family functioning. Family functioning is the well-being or performance of
the family unit in such domains as relationships within the family (Geeraert, et al.,
2004), health/ competence, conflict resolution, cohesion, leadership, and
expressiveness (Beavers & Hampson, 1990). Research has shown that neglectful
families show significantly lower levels of functioning than non-neglectful families
(Gaudin, Polansky, Kilpatrick, & Shilton, 1996). Studies have also shown that
assessments of family functioning—including structure, organization, cohesion,
conflict management, and communication and corresponding interventions—can lead
to improved parenting quality (Gaudin, et al., 1996). Further, a meta-analysis of 40
evaluation studies reported that parent education programs are effective at improving
family functioning, thus reducing the risk of child maltreatment (Geeraert, et al.,
2004). In the PFS, family functioning is operationalized as having adaptive skills
and strategies to persevere in times of crisis. Manifest variables to measure family
36
functioning include items that tap adaptive coping, problem solving, and feelings of
mastery about parenting and family.
Social support. The definition of social support is multi-faceted and includes
structural components such as characteristics of a social network and functional
aspects like emotional, instrumental, or informational support (Thoit, 1982; Cameron,
1990; Gottlieb, 1985; DePanfilis, 1996). Social support buffers against child
maltreatment when members of the social network do not condone neglect and
provides feedback that lets people know what is expected from them (Belsky, 1993;
DePanfilis, 1996). Individuals who experienced abuse as a child were less likely to
abuse if they perceived access to social networks (Belsky, 1993; Egeland, Bosquet, &
Chung, 2002). In a study on intergenerational violence, social support was identified
as a distinguishing factor between those who continued the cycle of violence and
those who broke it (Dixon, Browne & Hamilton-Giachritsis, 2009).
Social networks, including family and non-family support, benefit families by
providing parents with information on appropriate childrearing methods
(Bronfenbrenner & Crouter, 1983; Moncher, 1995), moderating maladaptive
parenting and stresses (Voight, Hans, & Bernstein, 1996; DePanfilis, 1996), and
supporting positive environments for infants and children. On the other hand,
abusive parents report limited access to informal support and dissatisfaction with the
social networks they do have (Corse, Schmid, & Trickett, 1990; Coohey, 1996).
Social networks are critical to maintain gains made by families after times of crisis or
stress because these informal support systems are available to parents after formalized
37
services have ceased (Rzepnicki, 1991). It must also be noted that social networks
can have negative effects and influences on parents (Korbin, Coulton, Chard, Platt-
Houston, & Su, 1998; Hill, 2002). In the PFS, social support is operationalized as
perceived informal support (from family, friends, and neighbors) that helps provide
for emotional needs. Survey items measure the caregiver’s perception of the
availability of support from members in his/her network.
Concrete support. Concrete support consists of tangible resources, including
food, cash, child care assistance, and clothing that social networks may provide as
buffers against parenting stresses (Cochran & Niego, 1995). Stressors related to
poverty can be overwhelming for families. Parents experiencing financial difficulties
suffer from elevated levels of depression and, in turn, lower psychological
functioning (Jackson, Brooks-Gunn, Chien-Chung, & Glassman, 2000). These
elements contribute to less than optimal home environments and heightened parenting
stress, increasing the likelihood of inconsistent, coercive, and punitive discipline
(McLoyd, 1995; 1998; Cole & Cole, 1993).
Half of children living in poverty endure stressful home environments
(Anderson-Moore & Vandivere, 2000). In a 1996 study, families living in poverty
($15,000 annual income) were 22 times more likely to experience maltreatment than
families making twice that income (Sedlak & Broadhurst, 1996). During the recent
economic recession, reports of severe abuse and fatalities have spiked (Pratt, 2009).
Concrete supports can moderate financial strain and lower risk factors for abuse. In
the study on intergenerational violence mentioned above, financial solvency (concrete

38
support) was identified as the other distinguishing protective factor (in addition to
social supports) between those who continued the cycle of violence and those who
broke it (Dixon, Browne & Hamilton-Giachritsis, 2009). Poverty and a lack of
resources are significant stressors to families and increase the likelihood of
maltreatment. Prevention programs do not have the resources to make societal
changes to address inequities; however, providing concrete or instrumental support is
one avenue for programs to insulate parents against the consequences of poverty and
lack of resources. In the PFS, concrete support was operationalized as access to
tangible goods and services to help families cope with stress, particularly in times of
crisis or intensified need. Items measure the awareness of, and opportunities for,
parents to find and utilize concrete supports.
Nurturing and attachment. Early research on attachment explored aspects of
infant behavior and also focused on the relationship between the child and caregiver
(Ainsworth, Blehar, Waters & Wall, 1978). All infants develop some attachment to
their caregivers; however, the quality and strength of this relationship varies.
Researchers focus on the constructs of security, confidence, and trust to understand
the “attachment security” between infant and caregiver (Shonkoff & Phillips, 2004).
Maltreated children show lower quality attachment than non-maltreated children and
exhibit higher rates of aggression, lower social competence, and less empathy
(Crittenden, 1988; George & Main, 1979; Morton & Browne, 1998; Shonkoff &
Phillips, 2004). Some argue that the window to establish quality attachments remains
open during the early childhood years (Shonkoff & Phillips, 2004), offering

39
opportunities to develop and strengthen bonds between the child and caregivers.
Prevention efforts such as home visitation focus on parent-child bonding and include
strategies to strengthen early relationships (Olds, Robinson, O’Brien, Luckey, Pettitt,
Henderson, Ng, Sheff, Korfmacher, Hiatt, & Talmi, 2002). The operational
definition of nurturing and attachment is the emotional tie, along with a pattern of
positive interaction between the parent and child that develops over time. Survey
items explore how parents perceive the strength of the attachment with their child.
Knowledge of parenting and child development. Many parent education
services have the goal of increasing knowledge of child development and
management skills to manage child behaviors. While increasing knowledge of child
development alone may not lead to changes in behavior, parenting programs may
translate such knowledge into appropriate parenting skills that diminish the risk of
abuse (Kaminski, et al., 2008). Most parent education programs target attitudes and
behaviors thought to reduce the risk of maltreatment. Items written for the PFS
measure parents’ and caregivers’ expectations of their child, confidence in parenting,
and understanding of child development. For this study, the operational definition of
knowledge of parenting and child development is how parents understand child
development, utilize effective child management techniques, and have age-
appropriate expectations for children’s abilities.
The PFS was developed to measure the constructs described in the previous
section: family functioning, social support, concrete support, and nurturing and

40
attachment. Specific items that were written to measure the protective factors are
provided in the Research Methodology section (See Table 10).
Revision of the CSSP protective factors. Since their initial publication on
the protective factors and the development of the Protective Factors Survey, CSSP
has revised the definition of parental resilience from “the ability to cope and bounce
back from all types of challenges (CSSP, 2004a)” to “the ability to establish positive
relationships, including attachment to a child; capacity to cope with stresses of daily
life and recover from challenges (Langford & Harper-Browne, in press). In the
current publication, CSSP also mentions nurturing and attachment as a component of
parental resilience (Langford & Harper-Browne, in press). In a recent request for
proposals for a demonstration project for the Quality Improvement Center on Early
Childhood (Daro, Barringer, English, 2009), nurturing and attachment was identified
as a sixth protective factor. The CSSP revisions more closely align with the PFS
than the original operational definitions. Table 3 presents the alignment of the PFS
constructs with the revised CSSP protective factors.

41
Table 3
Alignment of CSSP and PFS Constructs
CSSP Construct and Operational
Definition
Alignment between CSSP
and PFS
PFS Construct and Operational
Definition
Parental Resilience: The ability to
establish positive relationships,
including attachment to a child;
capacity to cope with stresses of daily
life and recover from challenges.
Family Functioning: Having
adaptive skills to persevere in
times of crisis. Family ability
to openly share positive and
negative experiences and
mobilize to accept, solve, and
manage problems.
Nurturing & Attachment:
The emotional tie along with a
pattern of positive interaction
between the parent and child
that develops over time.
Social Connections: Friends, family
members, neighbors, and others who
provide emotional support and
concrete assistance to parents.
Social Support: Perceived
informal support (from family,
friends, and neighbors) that
helps provide for emotional
needs.
Concert Support in Times of Need:
Financial security to cover basic needs
and unexpected costs; formal supports
like Temporary Assistance to Needy
Families; Medicaid and job training;
Concert Support in Times of
Need: Perceived access to
tangible goods and services to
help families cope with stress,
particularly in times of crisis or

42
crisis services, including mental
health, domestic violence and
substance abuse.
intensified need.
Knowledge of Parenting and Child
Development: Accurate information
about child development, appropriate
developmental expectations, and
knowledge of alternative discipline
techniques.
(not included in
Confirmatory Factor
Analysis)
Knowledge of Parenting and
Child Development:
Understanding and utilizing
effective child management
techniques and having age-
appropriate expectations for
children’s abilities.
Children’s Social and Emotional
Competence: A child’s ability to
interact positively with others and
communicate his/her emotions
effectively.
Not included in the PFS because
the intent was to develop an
easy-to-administer measure of
protective factors in parents and
caregivers.
Purpose of the Study
Many community-based programs funded under CBCAP are implementing
parent education programs. Most of these programs conduct little to no research and
minimal evaluation on their programs. What is done often consists of satisfaction
surveys or documentation of outputs. As a result, states cannot report overall effects
of prevention expenditures and are searching for valid and reliable, easy-to-
administer, and affordable instruments to measure the protective factors known to
reduce the likelihood of child maltreatment. Such was the case with 12 parent
education programs in Nevada funded under CBCAP. The programs, offering parent

43
education programs ranging from two-hour workshops to intensive multiple-week
sessions, each used different tools to document change. All of the programs
incorporate the Strengthening Families approach into their parent education program.
The Nevada Department of Health and Human Services (2008), Grants Management
Unit, decided to utilize the PFS as a common measure across all programs. The
director of the Grants Management Unit, Tobi Hyman, and this researcher both
served on the PFS Subcommittee and forged a partnership to assess the psychometric
properties of the PFS with a large sample with over 1,000 participants in one of the
twelve parent education programs. A full description of the Nevada context is
provided in the Methodology section.
Although the PFS holds promise as a valid and reliable tool to measure
multiple protective factors, the factor structure of the PFS needed to be confirmed
with a population receiving parent education before it could be used to evaluate
program effectiveness. Further, the stability of the instrument at multiple points in
time also needed to be established. The overall purpose of the study was to
contribute to the validity and reliability of the PFS. Types of reliability explored
were instrument stability and internal consistency. While the protective factors have
been well-documented individually as insulating children from abuse, limited
research had been done to evaluate the relationships between the protective factors in
the PFS. Convergent validity, which posits that similar constructs should be related
to one another (Shadish, Cook, & Campbell, 2002), was addressed by exploring the
relationships between the protective factors. As specified in the research questions

44
and hypotheses below, some of the constructs in the PFS were expected to be
positively moderately or highly correlated with one another.
Research Questions and Hypotheses
To establish the PFS as a psychometrically-sound instrument to measure
multiple protective factors, the overall research question was: To what extent is the
PFS a valid and reliable instrument of multiple protective factors? Several additional
research questions were posed to evaluate the psychometric properties of the PFS.
1) To what extent do the items (manifest variables) in the PFS define the
protective factors constructs (content validity and reliability)?
Hypothesis 1: The manifest variables will load highly on the appropriate
factors.
2) What are the underlying relationships among the protective factors as
measured by the items in the PFS (convergent validity)?
Hypotheses 2a: Family functioning and social support will be highly
positively correlated (Jack, 2000).
Hypothesis 2b: Social support and concrete supports will be positively
moderately correlated (Coohey, 1996).
Hypothesis 2c: Social support and nurturing and attachment will be highly
positively correlated (Crockenberg, 1981).
3) To what extent does the underlying structure of the PFS remain stable across
time?

45
Hypotheses 3a: The factor loadings for each construct will remain
stable across time.
Hypothesis 3b: The relationships between the constructs will remain stable
across time.
Hypothesis 3c:
4) What is the internal consistency of the items in each of the subscales?
Latent mean scores will differ from Time One to Time
Two.
Hypothesis 4: Internal consistency for each subscale will exceed a
Cronbach alpha of .8.

46
Chapter 2: Research Methodology
Procedure
The researcher partnered with The Nevada Department of Health and Human
Services (DHHS) Grants Management Unit study to obtain additional data
independent from previous PFS studies to evaluate reliability and validity of an
instrument to measure multiple protective factors in families. DHHS is the lead
agency, as designated by Governor Jim Gibbons for the Community-Based Child
Abuse and Prevention Program (CBCAP) and also directs child maltreatment
prevention activities in Nevada. DHHS promotes the health and well-being of
Nevadans by delivering and facilitating essential services to ensure that families are
strengthened, public health is protected, and individuals achieve the highest level of
self-sufficiency (DHHS, 2008). The Grants Management Unit (GMU) is an
administrative unit within DHHS that manages grants to local, regional, and statewide
programs in the State. The GMU is responsible for several state and federal
initiatives, including the Children’s Trust Fund (CTF).
The CTF was established in 1985 by Chapter 432 of Nevada Revised Statutes
to fund primary and secondary child maltreatment prevention programs. CTF
monies are comprised of funds from CBCAP and a three dollar fee on Nevada birth
and death certificates and total approximately one million dollars per year. Two
external policy groups advise the GMU—the Advisory Committee on Problem
Gambling and the Grants Management Advisory Council (GMAC). The DHHS and
GMAC release a Request for Applications every two years to disperse the CTF

47
monies. Grants are awarded competitively to community-based programs in Nevada
that propose services to prevent child maltreatment and strengthen families.
Awardees are required to participate in quarterly networking meetings, as well as
meet the federal reporting requirements of CBCAP.
Nationally, CBCAP incorporated the protective factors into their conceptual
framework for prevention work (Child Welfare Information Gateway, 2008). As a
result, many states, including Nevada, embedded the protective factors into existing
programming. In fiscal year 2009 (July 1, 2008) the GMU began requiring grantees
that receive CTF funds for parenting programs to use the Protective Factors Survey,
so that GMU could obtain common outcomes from the grantees by using a valid and
reliable instrument across all parent education programs. The use of a common
instrument would enable GMU to report statewide results on their annual CBCAP
Federal report, inform technical assistance decisions, and compare the level of
protective factors across programs prior to and after receiving services.
Prior to data collection, staff received the PFS Users Manual (See Appendix
B) and participated in a webinar on administering the PFS and using the database,
which is downloadable at http://www.friendsnrc.org/outcome/resources.htm.
Programs administered the PFS before services were offered (pre) and at the
conclusion of the parent education program (post). Staff from each program entered
pre- and post-data for each quarter utilizing the FRIENDS database and transferred
the data quarterly to GMU. FRIENDS, the National Resource Center for
Community Based Child Abuse Prevention, created the database to assist agencies in

48
managing data and creating reports (FRIENDS National Resource Center for
Community-Based Child Abuse Prevention, 2008). This researcher was actively
involved in data collection efforts and provided technical assistance to the GMU on
survey administration and data integrity throughout the study period. Human
subjects’ approval was obtained from the Human Subjects Committee-Lawrence to
receive and analyze the secondary data. Staff from the GMU provided the database
to the researcher in a compressed Access file.
Participants
The GMU attempted to collect data on every person participating in parenting
education programs funded between July 1, 2008 and September 30, 2009. Parent
education programs ranged from day-long workshops (Love & Logic) to eight to
twelve week classes such as Parenting Wisely and the Nurturing Parenting Program.
All program staff received training on the protective factors as defined by the
Strengthening Families Initiative and incorporated the approach into their evidence-
based program. Over a thousand parents or caregivers in Nevada began a parenting
education program. Of these 1,078 participants, 762 completed a parent education
program and provided pre and post survey data. All individuals who completed the
parent education program also completed the PFS. The program completion rate was
71 percent, meaning that 316 individuals dropped out of the program or did not finish
it. Reasons for attrition were not made available. Completion rates of agencies
ranged from zero percent to 100 percent. Five agencies reported troublesome dropout
rates, with more than half of participants leaving the program prior to completion—

49
Area Health Education Center, Churchill County School District, Family Resource
Center of Northeast Nevada, Ron Wood Family Resource Center, and Salvation
Army. Table 4 displays the agency, the type of parent education program, and the
number of participants and completion rates by agency.
Table 4
Agency and Number of Participants
Agency Name Parent Education Program Participants Completers (Rate)
Area Health Education Center Parenting Wisely 32 6
(19%)
Advocates to End Domestic
Violence
STEP Parenting Program 29 27
(93%)
Committee to Aid Abused Women Parenting Wisely 15 15
(100%)
Clark County Dept. of Family
Services
Nurturing Parenting Program 638 416
(65%)
Churchill County School District Shaken Baby Program; Parenting
Wisely and Parents as Teachers
22 2
(9%)
Family Resource Center of Northeast Nevada
Active Parenting Now/Teens; 1, 2, 3, 4 Parents
24 10
(42%)
No To Abuse Nurturing Parenting Program 16 13
(81%)
Shade Tree Nurturing Parenting Program 128 127
(99%)
Washoe County Family Resource Center
Nurse Family Partnership 87 87
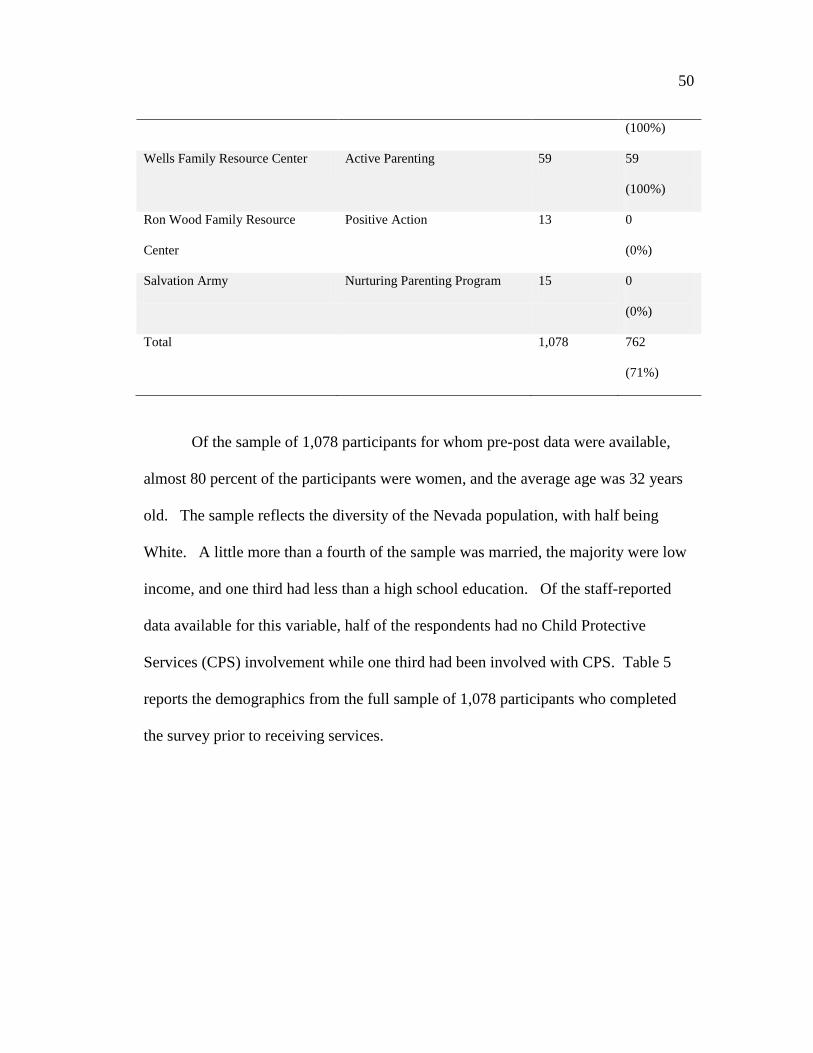
50
(100%)
Wells Family Resource Center Active Parenting 59 59
(100%)
Ron Wood Family Resource
Center
Positive Action 13 0
(0%)
Salvation Army Nurturing Parenting Program 15 0
(0%)
Total 1,078 762
(71%)
Of the sample of 1,078 participants for whom pre-post data were available,
almost 80 percent of the participants were women, and the average age was 32 years
old. The sample reflects the diversity of the Nevada population, with half being
White. A little more than a fourth of the sample was married, the majority were low
income, and one third had less than a high school education. Of the staff-reported
data available for this variable, half of the respondents had no Child Protective
Services (CPS) involvement while one third had been involved with CPS. Table 5
reports the demographics from the full sample of 1,078 participants who completed
the survey prior to receiving services.

51
Table 5
Demographic Characteristics
Characteristic N=1078
Age n=1061
M=32.02
SD=10.40
Gender n=1067
Female 78.3%
Male 21.7%
Race n=1066
Native American 4.3%
African American 18.5%
Hispanic or Latino 19.1%
White 49.2%
Multi-Racial 5.3%
Other 3.6%
Marital Status n=1075
Married 27.3%
Partnered 11.9%
Single 40.7%
Divorced 12.6%
Other (Widowed, Separated) 7.5%

52
Education n= 1064
Elementary or junior high school 4.3%
Some high school 25.6%
High school diploma or GED 35.5%
Trade/vocation school 4.1%
Some college 21.1%
Associates or above 9.4%
Income Level n=1058
$0-10,000 48.0%
$10,001-20,000 14.7%
$20,001-30,000 9.9%
$30,001-40,000 9.5%
$40,001-50,000 6.8%
More than $50,000 11.1%
Housing n=1066
Own 18.2%
Rent 39.6%
Shared housing 15.0%
Temporary/Homeless 27.2%
How Completed n=822
Face to face 11.6%
Staff available 86.2%
No staff present 2.2%

53
Measures—The Protective Factors Survey
The Protective Factors Survey (See Appendix C) begins with demographic
items about program participation, some of which are completed by staff and some by
the participant himself/herself. The demographics section contains questions about
the individual completing the survey, family composition, level of involvement with
services, and ancillary services the participant may be receiving. Participants are then
asked to respond to a series of 20 statements about their family, using a seven-point
frequency or agreement scale. This study uses four of the subscales in the PFS—
family functioning, social support, concrete support, and nurturing and attachment.
Development of the PFS. Prior to the present study, the PFS has undergone
four rounds of field-testing to explore and assess the content validity of the
instrument, internal structure of the subscales, relationships among the protective
factors and other measures of risk of abuse, the stability of the instrument, and the
validity of the PFS as a measure of change over time. These phases were conducted
primarily with participants in home visitation programs.
Phase I. A mixed methods approach, including survey research and focus
groups, guided the initial development of the PFS. For example, items were
preliminarily tested by asking participants to complete the instrument along with a
CPS Involvement n=760
No 51.4%
Yes 33.5%
Not sure 15.1%

54
survey assessment form evaluating each of the individual items across four areas: the
participants’ interpretation of the meaning of the question, the cultural
appropriateness/offensiveness of the items, necessary revisions for questions, and the
appropriateness of the answer options. Focus groups were then conducted to gather
input on the items as written and suggestions for revisions. The resulting items were
field tested with CBCAP-funded programs in Texas (N=272) and Healthy Families
programs in Kansas (N=74) Kansas. Forty nine items were included in this original
version, many of which exhibited marked skewness and moderate kurtosis, cross-
loaded on multiple factors, and did not meet a minimum factor loading of .3 or .4,
which is considered to be a minimum loading (Brown, 2006; Hair, Anderson,
Tatham, & Black, 1998). No clear factor structure emerged, therefore researchers
decided to conduct a more extensive literature review, refine the item pool, and
conduct additional analyses with other samples (Counts, Buffington, Chang-Rios, &
Rasmussen, & Preacher, in press).
Phase II. The purposes of this phase were to 1) generate a pool of items
aligned with the protective factors as defined in the extended literature review, 2)
evaluate the internal structure of the instrument using exploratory factor analysis, and
3) establish criterion-related validity by examining the relationships between the
protective factors and other measures of risk for child abuse and neglect. The intent
was to retain a small, integrated set of items with at least three to four highly
correlated items per construct.

55
Community-based agencies across the nation were recruited through the
distribution of a recruitment flyer on numerous national electronic-mail based
listservs, including Early Childhood Comprehensive Systems (ECCS), Community-
Based Child Abuse Prevention (CBCAP), Child Abuse Prevention Partners, Child
Welfare League of America Southern Region, Circle of Parents, National Alliance of
Children’s Trust and Prevention Funds, and FRIENDS National Resource Center for
Community-Based Child Abuse Prevention. Interested agencies completed a web-
based registration survey and received technical assistance on survey administration
via a webinar. Eleven home visitation agencies opted to participate and administered
the PFS, the Brief Child Abuse Potential Inventory, and one of three validation
measures between February and May 2007. Of the 249 participants, a majority of
participants were female (87.1 percent), spoke English (99.6 percent), and were birth
parents to their children (96 percent). The average age of participants was 28 years
old. Participants were poor, with 80 percent reporting annual household incomes of
less than $30,000. The sample was ethnically diverse—61.8 percent White (Non-
Hispanic/European American), 12 percent Native American (American
Indian/Alaskan Native), 14.8 percent African American, 5.6 percent Hispanic or
Latino/a, 2.8 percent Multi-Racial 2.8 percent and less than 1 percent Asian and
Native American/Pacific Islander. Thirty-four percent of participants were referred
by Child Protective Services (N = 85) (Counts, et al, 2008a).
Each agency received a survey packet composed of three instruments: the
Protective Factors Survey, the Brief Child Abuse Potential Inventory (BCAP:

56
Ondersma, Chaffin, Simpson, & LeBreton, 2005), and one validation instrument (a
measure of coping, depression, or stress) to assess criterion related validity.
Completion order of the PFS subscales and the validation measures was
counterbalanced to reduce the possibility of order effects (Shadish, Cook, &
Campbell, 2002). All respondents were asked to complete the PFS, BCAP, and one
of the other validation instruments to reduce participant burden.
An exploratory factor analysis (EFA) using MPlus v. 5 (Muthén & Muthén,
1998-2007) was conducted to explore the theoretical underpinnings of the 45 items
and to determine if the items loaded on the subscales as predicted. MPlus was used
to fit the model, using a robust weighted least squares estimator (WLSMV; Flora &
Curran, 2004; West, Finch, & Curran, 1995) to account for nonnormality. A scree
plot (Gorsuch, 1983), comparative fit, and interpretability were used to determine the
number of factors to retain. Although not definitive, the scree plot suggested that
five factors be retained. Loadings above .3 were considered noteworthy. However,
based on a combination of standard factor retention criteria, model fit, and
interpretability, a four-factor EFA solution was chosen as the most appropriate model
for the retained items (RMSEA = .09 and SRMR = .047). Additional items were
removed due to low loadings, cross-loadings, and parsimony, yielding a final scale
with 27 items. Power estimates were calculated with the sample size of 249 (df=249)
and returned a value approaching 1.0 (Preacher & Coffman, 2006), indicating that
there was sufficient power to detect good model fit. Three subscales demonstrated
adequate levels of internal consistency—family functioning=.94, social support=.86,
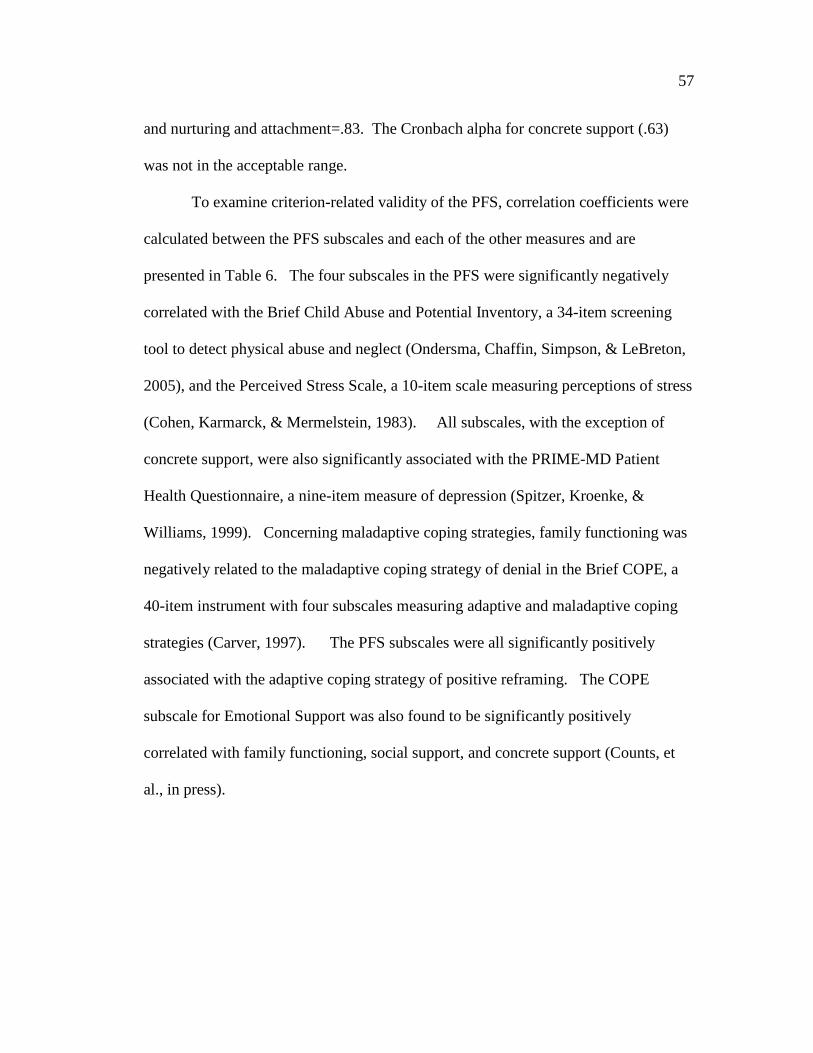
57
and nurturing and attachment=.83. The Cronbach alpha for concrete support (.63)
was not in the acceptable range.
To examine criterion-related validity of the PFS, correlation coefficients were
calculated between the PFS subscales and each of the other measures and are
presented in Table 6. The four subscales in the PFS were significantly negatively
correlated with the Brief Child Abuse and Potential Inventory, a 34-item screening
tool to detect physical abuse and neglect (Ondersma, Chaffin, Simpson, & LeBreton,
2005), and the Perceived Stress Scale, a 10-item scale measuring perceptions of stress
(Cohen, Karmarck, & Mermelstein, 1983). All subscales, with the exception of
concrete support, were also significantly associated with the PRIME-MD Patient
Health Questionnaire, a nine-item measure of depression (Spitzer, Kroenke, &
Williams, 1999). Concerning maladaptive coping strategies, family functioning was
negatively related to the maladaptive coping strategy of denial in the Brief COPE, a
40-item instrument with four subscales measuring adaptive and maladaptive coping
strategies (Carver, 1997). The PFS subscales were all significantly positively
associated with the adaptive coping strategy of positive reframing. The COPE
subscale for Emotional Support was also found to be significantly positively
correlated with family functioning, social support, and concrete support (Counts, et
al., in press).

58
Ta
ble
6
Cor
rela
tions
bet
wee
n PF
S Su
bsca
les a
nd V
alid
atio
n Sc
ales
Not
e. B
CA
P =
Brie
f Chi
ld A
buse
Pot
entia
l Inv
ento
ry; P
SS =
Per
ceiv
ed S
tress
Sca
le; P
HQ
= P
RIM
E-M
D P
atie
nt H
ealth
Q
uest
ionn
aire
; Cop
e Sc
ales
– D
= D
enia
l; SU
= S
ubst
ance
Use
; ESS
= E
mot
iona
l Soc
ial S
uppo
rt; IS
S =
Inst
rum
enta
l So
cial
Sup
port;
PR
= P
ositi
ve R
efra
min
g. F
F =
Fam
ily F
unct
ioni
ng; S
ocia
l Sup
port
= So
cial
Sup
port;
CS
= C
oncr
ete
Supp
ort;
NA
= N
urtu
ring
and
Atta
chm
ent;
KPC
D =
Kno
wle
dge
of P
aren
ting/
Chi
ld D
evel
opm
ent.
a *p<
.05,
**p
<.01
.
Item
was
reve
rse
code
d fo
r cor
rela
tiona
l ana
lyse
s
BC
AP
(N=2
04)
PSS
(N=6
0)
PHQ
(N=6
7)
CO
PE -
D
(N=8
7)
CO
PE -
SU
(N=8
7)
CO
PE -
ESS
(N=8
7)
CO
PE -
ISS
(N=8
7)
CO
PE -
PR
(N=8
7)
FF
-.54*
* -.3
8**
-.35*
-.2
6**
-.17
.38*
* .2
6**
.39*
*
SS
-.43*
* -.2
8*
-.54*
* -.0
7 -.2
1 .5
8**
.52*
* .3
6**
CS
-.35*
* -.5
4**
-.09
-.17
-.10
.24*
.2
5*
.32*
NA
-.3
4**
-.30*
-.2
7*
.16
-.16
.21
-.03
.24*
59
Phase III. The purposes of this phase were to 1) to confirm the factor
structure found in Phase II, 2) evaluate the stability of the instrument over time, and
3) examine predictive validity of the protective factors and health and other measures
of risk for child abuse and neglect. Once again, agencies were recruited through
national listservs. Additionally, a flyer was distributed at the national 2007 CBCAP
grantees’ conference. Participation was open to any prevention program that could
administer the survey at two points in time. Seventy-one interested agencies
completed a web-based registration survey. Of the registered agencies, about one
quarter (19) were able to meet the study requirements and participated in this round.
The average time lag between surveys was 34 days. A total of 689 surveys were
collected from the 19 agencies for Time One survey administration, and 291 surveys
from 15 agencies were collected for Time Two survey administration. States
participating in both survey administration time points were Georgia, Illinois, Kansas,
Kentucky, Maine, New York, South Carolina, Virginia, and Washington (Counts,
Buffington, Chang-Rios, Preacher, & Rasmussen, 2008b).
The sample was predominantly female (89.3 percent), and the average age
was 30.4 years. Again, the sample was ethnically diverse—62.5 percent White, 1.4
percent Native American (American Indian/Alaskan Native), 24.7 percent African
American, 8.2 percent Hispanic or Latino/a, 2.4 percent Multi-Racial, and less than 1
percent Asian and Native American/Pacific Islander. Twenty-four percent of
participants were referred by Child Protective Services (N = 71). Four-fifths of the
sample reported annual incomes under $30,000.

60
A confirmatory factor analysis (CFA) using MPlus v. 5 (Muthén & Muthén,
1998-2007) was conducted with this new data set (N=689) to see if results and the
factor structure could be replicated in an independent sample. The factor loadings
and fit were similar to those in the EFA, suggesting that the factor structure held and
could be generalized to a new sample of home visitation program participants.
Power estimates were calculated with the sample size of 689, df=98, alpha of .05, null
value of .05 and alternative value of .08 and returned a value approaching 1.0
(Preacher & Coffman, 2006), indicating that there was sufficient power to detect good
model fit. Cronbach alphas of the subscales in the CFA were above adequacy for
three of the subscales at Time One and Time Two: family functioning (.87, .90),
social support (.89, .88), and nurturing and attachment (.81, .82). The Cronbach
alpha for concrete support was adequate at both time points (.76, .79).
The primary reason for collecting data at two time points was to establish the
degree to which the PFS subscales remain stable over time. Authors expected the
factors to be significantly correlated over time, providing evidence for construct
stability. The within-factor correlations were hypothesized to be stronger than the
between-factor correlations. Within-factor correlations ranged from .624 to .829.
Between-factor correlations ranged from .147 to .628. Correlations are reported in
Table 7.

61
Table 7
Time One – Time Two Correlations of PFS Factors
FFT1 SST1 CST1 NAT1 FFT2 SSTS CST2 NAT2
FFT1 1.000
SST1 .605 1.000
CST1 .265 .376 1.000
NAT1 .451 .359 .180 1.000
FFT2 .829 .578 .234 .364 1.000
SST2 .495 .764 .300 .228 .628 1.00
CST2 .271 .364 .624 .164 .197 .276 1.00
NAT2 .344 .241 .169 .814 .429 .249 .147 1.000
Note. All correlations are significant at p = .05. FFT1 = Family Functioning Time One, SST1= Social Support Time One, CST1 = Concrete Support Time One, NAT1 = Nurturing & Attachment Time One, FFT2 = Family Functioning Time Two, SST2= Social Support Time Two, CST2 = Concrete Support Time Two, NAT2 = Nurturing & Attachment Time Two. Within time correlations are italicized.
To examine predictive validity of the PFS, each of the three criterion validity
measures was correlated with the Time One PFS subscales. The PRIME-MD Patient
Health Questionnaire (PHQ: Spitzer, Kroenke, & Williams, 1999) is a brief measure
of depression, consisting of nine items based on DSM-IV diagnostic criteria. The
Perceived Stress Scale (PSS; Cohen, Karmarck, & Mermelstein, 1983) is a 10-item
scale assessing the participant’s experienced level of stress and depression. The
Physical Health and Functioning instrument is a 19-item scale designed to measure
caregiver health and functioning. The scale consists of items drawn primarily from
the RAND 36-Item Health Survey 1.0 (Hays, Sherbourne, & Mazel, 1993). The PFS

62
subscales at Time One were significantly negatively correlated with Time Two stress
and depression scores and positively related to the health subscales. Two exceptions
must be noted—concrete support at Time One was not significantly related to Time
Two depression, and Time One nurturing and attachment was not significantly related
to physical functioning (health subscale). Time One PFS subscales were negatively
related to Time Two stress. Further, the PFS was positively related to all six
subscales of the Rand Health Survey at Time Two. Table 8 shows the correlations
(Counts, et al., 2008b).
Table 8
Time One PFS – Time Two Criterion Scale Correlations
General Physical Role Social Pain Energy/
Stress Depr. Health Funct. Limit. Funct. Pain Fatigue
FF1 –.452* –.283* .325* .144* .228* .223* .214* .281*
SS1 –.321* –.297* .305* .145* .267* .295* .209* .232*
CS1 –.253* –.107 .147* .140* .118* .209* .121* .133*
NA1 –.229* –.185* .175* .073 .120* .173* .159* .135*
Note. *Correlations are statistically significant at p=.05. FF1 = Time One Family Functioning, SS1= Time One Social Support, CS1 = Time One Concrete Support, NA1 = Time One Nurturing & Attachment.
Phase IV. The purposes of this phase were to 1) assess the validity of the
PFS as a measure of change over time, 2) examine convergent and discriminant
validity, and 3) compare results from a pre-post design with a retrospective pre-post

63
design. Agencies were recruited via national listservs, and flyers were distributed at
the national 2007 CBCAP grantees’ conference. Nineteen agencies from 13 states
completed a web-based registration survey. To be eligible for participation, agencies
had to be able to administer the surveys at two different time points within a six
month field-testing period. To obtain a “true” pre-test score, the surveys had to be
administered prior to receiving services. The time lag between pre-program and post-
program surveys was required to be a minimum of one month and a maximum of five
months, and varied depending on the services provided. Because of the time
constraints, the Time Two tests were not necessarily administered after the
completion of the program. At Time One, 218 surveys were collected from nine
agencies. States participating in both survey administration time points were
California, Connecticut, Tennessee, Utah, and Vermont. Fewer than half completed
the post- survey (N=94). The average time lag between pre-program and post-
program surveys was 67 days (Counts, et al., 2008b).
The average age of the 94 participants who completed Time One and Time
Two surveys was 32.4 years. The majority were female (68.1 percent) and almost 80
percent of the sample was White (Non-Hispanic). Fifty-three percent of participants
were referred by Child Protective Services (N = 50). A majority of the sample (65.9
percent) reported annual incomes equal to or less than $30,000.
Each agency received two survey packets: a pre-program packet and a
follow-up packet. The pre-program survey packet contained the PFS and validation
measures on affect, social desirability, and optimism. The post-program survey
64
packet contained the same validation measures and a PFS retrospective pre-test
version. In this format, participants were instructed to respond to the items from the
perspective of how they felt on the day of the survey. Participants were then
presented with the same 23 statements about their family and asked to respond to the
items from the perspective of how they felt when they started the program.
Four sets of analyses were conducted: factor analyses to examine the factor
structure of the pre-test, retrospective, and post-test responses; paired sample t-tests to
evaluate the comparability of the traditional pre-test and retrospective pre-test
subscales; a series of t-tests to examine a change over time comparison of pre-test and
post-test subscale scores; and correlational analyses to assess convergent and
discriminant validity. Mplus v. 5 (Muthén & Muthén, 1998-2007) was used to fit
CFA models using maximum likelihood estimation. The resulting loadings
conformed closely to the expected four-factor structure found in other phases for the
pre-test, post-test, and retrospective subscale items. Power estimates were calculated
with the sample size of 94, df=98, alpha of .05, null value of .05 and alternative value
of .08 and returned a value approaching 1.0 (Preacher & Coffman, 2006), indicating
that there was sufficient power to detect good model fit.
All four subscales, with the exception of pre-test concrete support,
demonstrated adequate levels of internal consistency. During Phase IV, one item was
removed from the nurturing and attachment subscale and two knowledge of parenting
items were dropped, resulting in the current, 20-item version. Cronbach's alphas for
each subscale were, for pre-test, retrospective pre-test, and post-test respectively,

65
family functioning (.89, .94, .91), social support (.90, .93, .91), concrete support (.67,
.86, .77), and nurturing and attachment (.84, .84, .81). It is interesting to note that the
concrete support subscale registered the highest Cronbach alpha in the field tests on
the retrospective version, given its low score on the other versions and in previous
testing phases.
Paired sample t-test results of the true pre-test and retrospective pre-test found
no mean differences between family functioning, concrete support, or nurturing and
attachment. However, the social support subscale showed a statistically significant
difference between the two types of pre-tests. Change over time was examined for
both versions. On the true pre-test, change scores were only significant for family
functioning. Using the retrospective pre-test as a baseline resulted in statistically
significant change scores on family functioning, nurturing and attachment, and social
support.
Convergent and discriminant validity were examined through PFS subscale
correlations with positive and negative affect, optimism, pessimism, and social
desirability. Based on previous research, a positive relationship was expected
between the protective factors and positive affect and optimism and a negative
relationship between the protective factors and negative affect and pessimism. With
the exception of concrete support, the PFS pre-test subscales were significantly
positively correlated with the positive affect items of the Positive and Negative
Affectivity Scale (PANAS: Thompson, 2007) a 10–item survey to measure positive
and negative affect. The retrospective-pre-test and PFS post-test were not

66
significantly related to optimism. In all three versions of the PFS, family functioning
and social support were positively correlated with the Life Orientation Test-Revised
(LOT-R: Scheier, Carver, and Bridges, 1994), a ten-item measure of individual
differences in dispositional optimism-pessimism. Concrete support was positively
associated with optimism in the retrospective pre-test, and nurturing and attachment
was related to optimism in the pre-test. Family functioning, social support, and
nurturing and attachment were negatively related to negative affect using all three
instruments, with the exception that nurturing and attachment was unrelated to
negative affect on the post-test. Family functioning and social support were
negatively related to pessimism using all three instruments, except that social support
was unrelated to negative affect using the retrospective instrument. Due to the low
reliability of the Marlowe Crowne Social Desirability Scale (Crowne & Marlowe,
1960) in the sample, the relationship between protective factors and social desirability
could not be explored.
In summary, the factor structure of the three versions was consistent.
However, there were differences between how the retrospective pre and true pre-tests
functioned both with the validation scales and on change scores. Mean scores on the
retrospective pre-test tended to be lower than those of the true pre-test, resulting in
larger change scores for the retrospective version. It was not possible to determine
the cause of the differences in versions or to identify the type of bias that could
influence the results. As a result, there was no conclusive evidence of which
version—true or retrospective—is the most valid (Counts, et al., 2008b).
67
Limitations. The four phases of PFS testing have established the instrument
as a valid and reliable tool to measure multiple protective factors. However, some
major limitations remain and are addressed through the present study. First, the PFS
has predominantly been tested with home visitation programs, therefore cannot be
generalized to participants in parent education programs or other settings. Second,
the small sample sizes in Phase II and Phase IV may affect the confidence in the
accuracy of the parameter estimates (Kelley, Maxwell, Rausch, 2003). Although the
sample sizes had power to detect good model fit, the fit statistics do not guarantee
meaningful parameter estimates (Schumacker & Lomax, 2004). Third, in Phase IV,
correlations were examined between Time One and Time Two administration of the
protective factors. When estimating the within-factor correlations, the between-
factor correlations were not controlled for, consequentially, the relationships between
Time One and Time Two may have been inflated. To look at stability in the present
study, between-factor correlations will be controlled for, and the unique attributes of
each factor will be extracted. Finally, to date, time constraints have not allowed for
an administration of the PFS to one population both prior to services and after
services have been completed. Thus, the instrument’s ability to measure change over
time has not been examined. The present study addresses this issue by administering
the PFS prior to services and again at post with a large sample of participants in
parent education.

68
Analytic Strategy
Power. To determine the sample size needed to achieve power of .80 for
detecting good fit, the MacCallum, Browne, & Sugawara (1996) method for power
analysis and determination of sample size was used. In this method, effect size is
defined as the difference between a null value and alternative value of the root-mean
square error of approximation (RMSEA; Steiger, 1990). The null value of .05
represents a close fit and the alternative value of .08 is a not-close fit. The sample
size (N=1078) is more than adequate to reject the hypothesis that the model is a close
fit with the data when the actual model fit is not close. Using the Preacher &
Coffman Power and Sample Size Calculator for RMSEA (2006), the minimum
sample size required to reject the null hypothesis of close fit (.05) when the fit is poor
(.08), is 60 cases. Power estimates were calculated with the sample size of 1078,
df=362, alpha of .05, null value of .05 and alternative value of .08 and returned a
value of 1.0 (Preacher & Coffman, 2006). (RMSEA and degrees of freedom
calculations are fully discussed in later sections.)
Data preparation and screening. Data were imported into SPSS from
Access, and demographic variables were re-coded as string variables. The number of
children was calculated for each participant. Because the PFS was designed for
caregivers or parents, those individuals who were pregnant at the time of survey
administration were removed from the data set. Items 8, 9, and 11 were reverse
scored. Frequencies were run for all variables using SPSS (2009). Outliers, missing
data, and out-of-range values can greatly affect the variance-covariance among

69
variables, and bias analysis results (Schumacker & Lomax, 2004). An Access form
was used for data entry, therefore there were no responses outside the range of 1-7 for
the PFS items.
Normality. In inferential statistics, data are assumed to be distributed
normally (Schumacker & Lomax, 2004), thus data were examined for skew and
kurtosis prior to the examination of missing values and data imputation. A sample is
considered to be normally distributed when the values of a variable are symmetrically
dispersed or in a bell-shaped curve (Weinbach & Grinell, 2001). In structural
equation modeling, parameter estimates and standard errors are more accurate when
normality assumptions are met (Enders, 2001). SPSS was used to examine
multivariate normality for the 30 items included in this study. The post-test item in
the nurturing and attachment subscale “I am happy being with my child” exhibited
negative skew
(-3.23) and kurtosis (13.54). Descriptive statistics and distributional data, including
skewness and kurtosis, are presented in the results section.
Missing data. Prior to addressing missing data, the researcher explored data
on non-completers of the post-test to determine if there were systematic differences
between the two groups. Of the 1,078 participants who took the PFS at pre test, 71
percent or 762 completed the parent education program and the PFS at both time
points. These individuals are labeled as “completers.” The other 316 participants, or
29 percent of the sample, dropped out of the program and did not complete the
program or the PFS at two time points. These individuals were termed “non-

70
completers.” Comparison tests were conducted between the completers and non-
completers to determine if there were major differences between the two groups.
The total amount of missing data was 15.3 percent. The maximum amount of
missing data for one variable was 29.4 percent, which is equivalent to the number of
individuals who did not complete the parent education program or the PFS post-test.
Common approaches such as listwise deletion, pairwise deletion, and similar response
pattern imputation to treating missing values are problematic in research and can
reduce power and lead to biased estimates (Acock, 2005; Schafer & Graham, 2002).
Full Information Maximum Likelihood (FIML) is superior to the aforementioned
missing data techniques and results in unbiased parameter estimates (Enders &
Bandolos, 2001) and was used to treat the missing data in this study. FIML does not
deal with missing data by imputation. Rather than imputing data, the method
incorporates a mean-structure and estimates all parameters and standard errors
directly by using all the observed data. By including the partially completed cases,
the method guides the estimator algorithm toward a more accurate set of parameters
by accounting for the relationships between the variables in the model (Enders, 2001;
Enders, 2006). When the input data and models are the same (Collins, Schafer, &
Kam, 2001) and the number of imputations is sufficiently large or as Schafer &
Graham (2002) write, “approaches infinity” (p. 1), the results of MI and FIML are
equal. In essence, the exact number of imputations needed to reach equivalency is
unknown. However, it is generally thought that the greater the number of
imputations, the more accurate are the results (Graham, Olchowski, & Gilreath,

71
2007). Because of the relative ease in using FIML and the better results unless one
has achieved the sufficient number of imputations (unknown), FIML was used in this
study to address missing data.
The research design. The study used a One-Group Pre-test-Post-test Design
(Shadish, Cook, & Campbell, 2002) and is presented in Table 9. Participants
received parent education represented by X in the design. All participants received
the PFS (O) prior to receiving any parent education and again after they completed
the program.
Table 9 Research Design Outcome Assignment to Parent Education Outcome
O X 1 O2
Structural equation modeling (SEM ). Structural equation modeling was
the statistical analysis procedure used to answer the research questions. SEM is a
generic term that describes four models—path analysis, confirmatory factor analysis,
structural regression, and latent change (Raykov & Marcoulides, 2000). Unique
characteristics of SEM are 1) the inclusion of variables that are not directly
observable, 2) corrections for measurement error, 3) the ability to fit models to
covariance or correlation matrices (Raykov & Marcoulides, 2000), and 4) the
evaluation of an entire model (Kline, 1998), which enables the evaluation of the PFS

72
measurement model as a whole rather than only as a sum of individual subscales.
This study utilized a measurement model and a structural model.
Confirmatory factor analysis. Confirmatory factor analysis is the
measurement model of SEM, and enables the researcher to specify and test a model
for how the hypothesized constructs are reflected by observed variables that are
directly measured (Raykov & Marcoulides, 2000). CFA will contribute to the
reliability and validity evidence of the PFS as an instrument to measure multiple
protective factors (Mueller, 1996). CFA enables the mathematical testing of the items
in the PFS to measure the hypothesized constructs of the protective factors and the
stability of the underlying factor structure at two time points (Schumacker & Lomax,
2004). The protective factors are latent constructs or variables that cannot be directly
observed, and therefore must be measured indirectly through observed or indicator
variables (Schumacker & Lomax, 2004). Like intelligence and achievement, the
presence of family functioning, social support, concrete support, and nurturing
achievement cannot be directly observed. However, latent variables can be measured
indirectly through indicator or observed variables. The purpose of CFA, unlike
exploratory factor analysis, is to add evidence in support of a hypothesized factor
structure. The development of a CFA model begins with theory or research-based
hypotheses about how observable variables measure their corresponding latent
constructs, and permits testing the model’s consistency with the observed data using
SEM software (Raykov & Marcoulides, 2000).

73
In this study, MPlus v. 5 (Muthén & Muthén, 1998-2007) was used to
conduct the CFA due to the non-normality of the data and the availability of the
FIML estimation method in this statistical package. Mplus uses a Maximum
Likelihood Robust (MLR) estimator for samples departing from normality, which is
needed in this study because of the moderate skew and kurtosis of one item (Muthén
& Muthén, 2006). Mplus adjusts the Chi-Square fit statistic and adjusts standard
errors (West, Finch, & Curran, 1995) so that other estimates are not biased. As
previously stated, FIML was used to treat missing data. When using the FIML
estimator, the presence of missing data with non-normal data does not exacerbate the
issue and results in similar confidence intervals with zero percent and 25 percent
missing data rates. FIML is nominally affected by the shape of the distribution, so is
the method of choice for non-normal missing data (Enders, 2001).
Based on the research base and the operational definitions of the constructs,
four factors were expected to emerge from the data. Table 10 shows the factors, the
operational definitions, and the items that are expected to load on each factor. These
factors—family functioning, social support, concrete support, and nurturing and
attachment—are considered to be reflective or uni-dimensional. These four scales
are expected to contain items that have a common core, which can be explored
statistically (Bagozzi, 1982 ; Bagozzi, & Fornell, 1982). Thus, internal consistency
of these scales is of interest. The other factor—knowledge of parenting and child
development—on the other hand, is considered to be formative in nature. That is, the
items written for this factor are expected to explore various dimensions, including an

74
understanding of child development, effective child management techniques, and
realistic expectations for the child. Because this factor is formative, there is no
theoretical reason to expect the items to conform to any particular factor structure
(Bollen & Lennox, 1991), hence it was not included in the CFA. For this formative
factor, internal consistency is irrelevant. Rather, content validity is of concern.
Table 10
Constructs, Operational Definition, & Expected Items to Load
Construct Operational definition Items
Family
functioning
Having adaptive skills to persevere in times of crisis. Family ability
to openly share positive and negative experiences and mobilize to
accept, solve, and manage problems.
1-5
Social support Perceived informal support (from family, friends, and neighbors)
that helps provide for emotional needs.
6, 7, 10
Concrete support Perceived access to tangible goods and services to help families cope
with stress, particularly in times of crisis or intensified need.
8, 9, 11
Nurturing and
attachment
The emotional tie along with a pattern of positive interaction
between the parent and child that develops over time.
17- 20
(Counts, et al, 2007)
The longitudinal CFA or measurement model is presented in Figure 2. The
pre-test is indicated by T1 and the post-test as T2. The circles represent the latent
constructs of the protective factors and are labeled for each subscale (FF: Family
Functioning, SS: Social Support, CS: Concrete Support, and NA: Nurturing and
Attachment). The 30 items in the PFS (15 at Time One and 15 at Time Two) are

75
represented by squares, with arrows indicating the predicted construct on which they
are expected to load.

76
Fi
gure
2
One
Gro
up L
ongi
tudi
nal C
FA w
ith A
ll Pa
ram
eter
s Est
imat
ed (i
nclu
ding
resi
dual
s)

77
Six rules specify the parameters in an SEM model and are represented by
directional arrows, which are predictive or causal and bi-directional arrows.
Parameters are a generic term that represent characteristics of a population. Because
the overall characteristics are difficult to obtain, sample statistics are used to estimate
the parameters. In SEM, parameters are the unknown aspects of the phenomenon
under study and are estimated in the model. The bi-directional arrows represent
covariance or correlation (Raykov & Marcoulides, 2000). Applying these rules to
the one-group longitudinal model results in 103 parameter estimates. Degrees of
freedom are calculated by p(p+1)/2 – (number of parameters) (Raykov &
Marcoulides, 2000). The p is the number of observed variables in each group, or in
this case 30. The p(p+1)/2 represents the number of known variances/covariances of
observed variables. Thus, the degrees of freedom for this model are 30(30+1)/2 – 103
= 362. CFA models are under-identified if the number of summary statistics (means,
variances, and covariances) are fewer than estimated parameters, just-identified if
statistics and estimated parameters are equal, and over-identified if the number of
statistics is fewer than the number of estimated parameters. Models must be either
just-identified or over-identified to yield accurate estimates (Mueller, 1996). In this
model, the number of known parameters greatly exceeds the number of parameters to
be estimated; therefore the model is over-identified.
Structural model. Structural regression models are similar to CFA models
except they allow explanatory or predictive relationships between latent variables
(Raykov & Marcoulides, 2000). This model can be used to test hypothesized

78
relationships of the Protective Factors Survey. The same six rules for determining
model parameters were applied to this model. This model is also overidentified and
has 362 degrees of freedom. The main difference between the two models is that the
latent variables at Time One are hypothesized to predict the latent variables at Time
Two; hence the arrows are uni-directional rather than bi-directional. Figure 3 shows
the structural regression model.
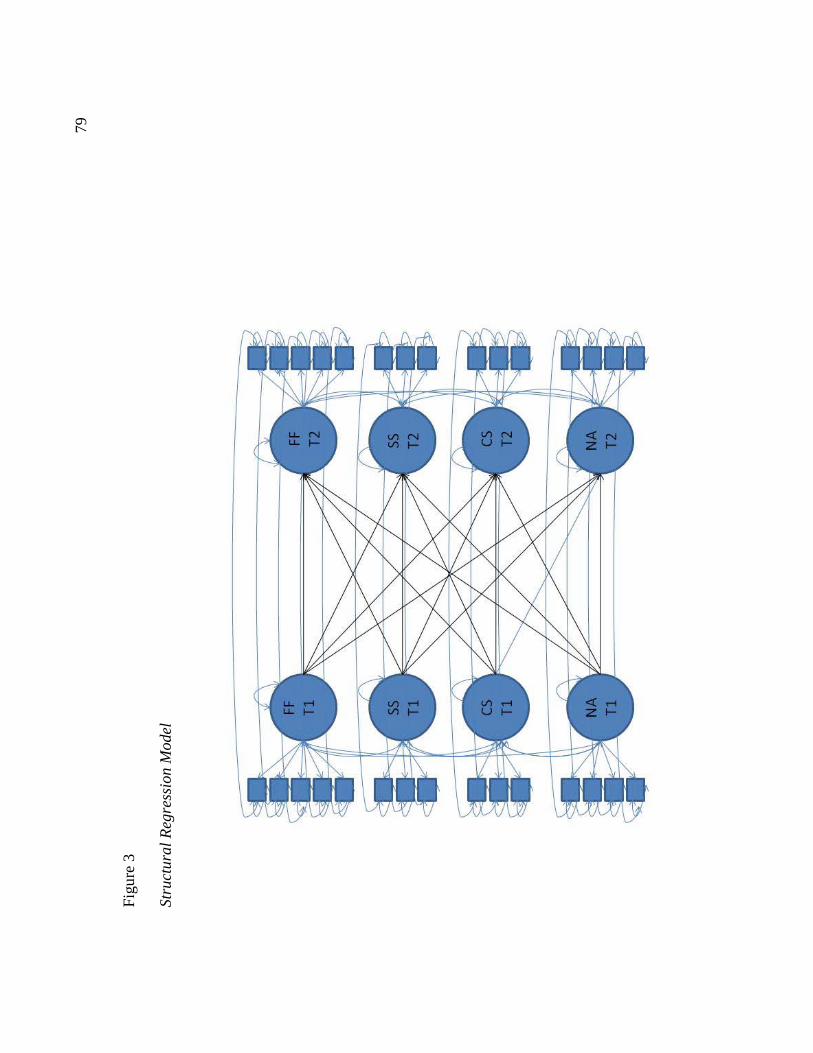
79
Fi
gure
3
Stru
ctur
al R
egre
ssio
n M
odel

80
Goodness of fit. Fit indices determine the degree to which the observed
values are predicted by the estimated model. In other words, the fit indices indicate
how well the model reflects the data. In this study, four indices are used: χ2, the
Non-Normed Fit Index (NNFI; Bentler, 1990), the Comparative Fit Index (CFI;
Bentler, 1990), and the Root-Mean-Square-Error of Approximation (RMSEA: Hu &
Bentler, 1998). The χ2 statistic was one of the first fit indices and is a rough
estimation of model fit. A large value relative to the number of degrees of freedom
indicates that the model does not fit the data well, whereas a small value indicates a
good fit (Hu & Bentler, 1998). The χ2
statistic is very sensitive to sample size,
therefore it is recommended to supplement it with other indices (Kline, 1998). The
NNFI represents the improvement in model fit relative to a null model (Bentler,
1990). To be considered a good fit, values must be above .90. The CFI is similar to
the NNFI and is also included because it is less affected by sample size (Kline, 1998).
Finally, RMSEA evaluates the absolute fit of a model and allows the calculation of a
confidence interval. Values less than .05 indicate a close fit, while values above .10
indicate potentially serious errors in model specification (Browne & Cudeck, 1993).
The Research Questions and Models
Although there is strong preliminary evidence to support the internal
consistency, stability, and construct validity of the PFS subscales, the present study
examined these psychometric properties with a large sample of participants in parent
education programs at a true pre and post survey administration. Table 11 shows

81
how each research question was addressed by the models. The fourth question was
addressed using SPSS.
The measurement model (CFA) enables the researcher to examine the factor
structure and to determine if the observed variables load onto the four factors as
hypothesized and to examine the relationships between the protective factors. To
determine if the instrument is stable across time points, measurement equivalence was
examined. Measurement equivalence means that the characteristics of the items and
the latent constructs are consistent across various conditions (Horn & McArdle,
1992). In this case, measurement equivalence across time points was investigated.
Nested models were used to compare a null model with an alternative model (Kline,
1998). The null model estimates all parameters, and the alternative model constrains
relationships.
Several types of measurement invariance can be used to evaluate metric
equivalence and were examined to look at model fit and determine stability of the
instrument. In other words, it must be determined that the psychometric
relationships between the observed items and latent constructs are the same at both
time points (Lee, 2009). Since the chi-square statistic rarely shows model fit because
of its sensitivity to sample size, other fit indices such as CFI were used in addition to
chi-square (Cheung & Rensvold, 2002) to compare fit. CFI is independent of model
complexity and sample size. A change in the CFI value smaller than or equal to .01
indicates that the null model of invariance should not be rejected. Stated differently,
a CFI change value of less than .01 means that the models are the same. (The change

82
score of .01 was established by conducting a large simulation study comparing 20
general fit indices and their ability to detect model change (Cheung & Rensvold,
2002)).
In this study, the progression of measurement invariance was as follows.
First, configural invariance tests were conducted to assess the overall fit of the model
to see if the conceptual constructs are the same at both time points. Second, item-
level invariance was examined by constraining corresponding loadings at each time
point to be equivalent in this model. Third, equivalence of construct covariance was
examined by constraining the covariances between the latent constructs within time
points to equality. In both of these models, it was expected that the model fit would
be equivalent with the constraints. Finally, equivalence of latent means was
examined by fixing the latent means to be equal. Because it was expected that the
means would change over time, it was not expected that these constraints would result
in the same model fit. In this alternative model, a change in CFI was desired and
would indicate that there was a change in construct scores, perhaps as a result of the
intervention.
The structural model allowed the researcher to examine the predictive
attributes of the protective factors and to assess the ability of the protective factors at
Time One to predict the protective factors at Time Two. Table 11 shows the
questions, the model used, and the explanation for why the model is appropriate to
answer the research question.

83
Table 11
Research Questions, Model, and Explanation
Question Model Explanation
1) To what extent do the items (manifest
variables) in the PFS define the protective
factors constructs (content validity and
reliability)?
Measurement High factor loadings provide
evidence that the indicators
converge on a construct
(Little & Card, 2009).
2) What are the underlying relationships
among the protective factors as measured
by the items in the PFS (convergent
validity)?
Measurement &
Structural
Convergent validity posits
that similar constructs should
be related to one another
(Shadish, Cook, & Campbell,
2002).
3) To what extent does the underlying
structure of the PFS remain stable across
time?
Measurement Measurement invariance will
be examined to determine if
the PFS versions measure the
same constructs consistently
across time points (Cheung &
Rensvold, 1999).
4) What is the internal consistency of the
items in each of the subscales?
SPSS—
Cronbach Alpha
Cronbach's alpha estimates
how well the items in the
subscale reflect the same
construct or protective factor
(Cronbach, 1951). To be
considered a reliable
subscale, Cronbach's alpha
must be above .80.

84
Chapter 3: Results
This chapter presents the results of the PFS Time One to Time Two study
with a large sample of participants in parent education programs in the State of
Nevada. Results are presented as follows: 1) sample, 2) examination of normality,
and 3) research question to answer the overall research question of the study: To
what extent is the Protective Factors Survey Version a valid and reliable instrument
of multiple protective factors? Based on the results, it is briefly noted whether the
hypotheses for each question are supported or not supported. (Chapter 4 considers
the research questions in detail, connects them to the literature, and explores potential
reasons for the findings.) The measurement and structural models that were used to
answer the research questions are presented, along with fit statistics. Finally,
additional analyses conducted to explore predictive relationships are presented.
Sample
As mentioned above, 1,078 participants completed the PFS at pre-test only
and 71 percent or 762 participants completed the PFS at both time points.
Comparison tests were conducted between the completers and non-completers to
determine if there were significant differences between the two groups. Table 12
displays the results.

85
Table 12
Comparison of Completers and Non-Completers on Pre-test
Characteristic Completers N=762
Non-Completers N=316
Comparison Test
Age n=761 n=300 t(1059)=1.19, p=.236
M=31.80 M=32.58
Income Level n=755 n=303 t(1056)=1.43, p=.153
M=2.41 M=2.58
Gender n=762 n=305 χ2
Female
(1, N=1067)=.871, p=.351
76.4% 79.0%
Male 23.6% 21.0&
Race n=760 n=306 χ2
Native American
(5, N=1066)=5.91, p=.315
5.1% 2.3%
African American 17.8% 20.3%
Hispanic or Latino 18.4% 20.9%
White 50.0% 47.4%
Multi-Racial 5.1% 5.6%
Other 3.6% 3.6%
Marital Status n=760 n=315 χ2
Married
(4, N=1075)=6.95, p=.139
27.5% 26.7%
Partnered 10.8% 14.6%
Single 41.6% 38.4%
Divorced 11.7% 14.6%

86
Other (Widowed, Separated)
8.4% 5.7%
Education n= 758 n=306 χ2
Elementary or junior high school
(5, N=1064)=4.22, p=.518
4.0% 5.2%
Some high school 25.6% 25.5%
High school diploma or GED
36.8% 32.4%
Trade/vocation school 4.1% 4.2%
Some college 19.9% 24.2%
Associates or above 9.6% 8.5%
Income Level n=755 n=303 χ2
$0-10,000
(5, N=1058)=8.13, p=.149
49.1% 45.2%
$10,001-20,000 15.6% 12.5%
$20,001-30,000 9.1% 11.9%
$30,001-40,000 8.3% 12.2%
$40,001-50,000 7.2% 5.9%
More than $50,000 10.6% 12.2%
Housing n=759 n=307 χ2
Own
(4, N=1066)=60.43, p=.000
18.4% 17.6%
Rent 34.9% 51.1%
Shared housing 14.1% 17.3%
Temporary/Homeless 32.5% 14.0%

87
On the majority of the demographics—age, gender, race, marital status,
education, and income level—there were no statistically significant differences
between the completers and non-completers. However, on the housing variable, the
Chi-square revealed that completers and non-completers differed significantly in
terms of where they live. Completers had more than twice the rate of non-completers
who were either homeless or lived in temporary arrangements. V was
calculated to evaluate the effect size, or if the difference between the housing status
of participants was V = .238, p=000).
V ranges from -1 to 1, with zero indicating no relationship, the association
can be related to sample size and number of categorical variables (Agresti, 2002).
Accordingly, this effect size is considered to be moderate.
Independent sample t-tests were conducted to determine if there were
statistically significant differences between the completers and non-completers on the
PFS subscales: family functioning, social support, concrete support, and nurturing
and attachment. Table 13 shows the results. On the family functioning and concrete
support subscales, completers and non-completers reported similar mean scores.
Non-completers reported statistically significant lower mean scores on the social
support and nurturing and attachment subscales. Cohen’s d was calculated to
determine if the effect size or difference between the subscale means is of practical
concern (Cepeda, 2008). On both of the subscales, the effect size was minor and
does not meet Cohen’s threshold for even a small effect (SS: d=.16; NA: d=.16),
(Cohen, 1992).

88
Table 13
Comparison of Completers and Non-Completers on PFS Pre Subscale Scores
PFS Subscale Completers
(Pre and Post)
N=762
Non-Completers
(Pre Only)
N=316
Comparison Test
Family functioning (FF) M=4.94 M=4.82 t(1074)=-1.39, p=.165
Social support (SS) M=5.50 M=5.27 t(1074)=-2.33, p=.020
Concrete support (CS) M=5.06 M=4.99 t(1074)=-.588, p=.557
Nurturing and
Attachment (NA) M=6.10 M=5.94 t(1054)=-2.33, p=.020
Examination of Normality
The maximum-likelihood estimate produces more accurate parameter
estimates, fit statistics, and standard errors when normality assumptions are met
(Enders, 2001), therefore the 30 items included in the measurement and structural
models were examined for normality. A normal distribution is a symmetrical
dispersion of the values of a variable, or a bell-shaped curve (Weinbach & Grinell,
2001). Descriptive statistics are presented in Table 14. Items with skew values
above 3.0 were considered extremely skewed and items with kurtosis values above
10.0 problematic (Kline, 1998). With the exception of one item, the items showed
minimal skew and kurtosis and were normally distributed. The post-test item “I am
happy being with my child” exhibited negative skew (-3.23) and kurtosis (13.54).
This item is in the nurturing and attachment subscale. To account for the nonnormal

89
data, maximum-likelihood estimation with robust standard errors (MLR) was used.
In simulations, MLR has been found to produce satisfactory results with missing data
and non-normal data distributions (Muthén & Asparouhov, 2002).

90
Ta
ble
14
Des
crip
tive
Stat
istic
s for
the
PFS
Item
s inc
lude
d in
the
conf
irm
ator
y fa
ctor
ana
lysi
s Ite
ms
N
Mea
n SD
Sk
ewne
ss
Kur
tosi
s Pr
e Pr
e Pr
e Pr
e Pr
e Po
st
Post
Po
st
Post
Po
st
1. I
n m
y fa
mily
, we
talk
abo
ut o
ur p
robl
ems.
10
76
4.93
1.
51
-0.3
9 -0
.27
762
5.23
1.
33
-0.5
2 -0
.07
2. W
hen
we
argu
e, m
y fa
mily
list
ens t
o “b
oth
side
s of t
he st
ory.
” 10
74
4.64
1.
65
-0.2
3 -0
.53
762
5.03
1.
40
-0.3
4 -0
.21
3. I
n m
y fa
mily
, we
take
tim
e to
list
en to
eac
h ot
her.
1072
4.
89
1.57
-0
.37
-0.4
7 76
2 5.
25
1.34
-0
.46
-0.2
1 4.
My
fam
ily p
ulls
toge
ther
whe
n th
ings
are
stre
ssfu
l.
10
76
5.24
1.
62
-0.6
3 -0
.36
762
5.56
1.
35
0.70
0.
07
5. M
y fa
mily
is a
ble
to so
lve
our p
robl
ems.
10
73
4.83
1.
54
-0.3
8 -0
.26
762
5.28
1.
32
0.47
-0
.12
6. I
hav
e ot
hers
who
will
list
en w
hen
I nee
d to
talk
abo
ut m
y pr
oble
ms.
1076
5.
53
1.59
-1
.15
0.68
76
2 5.
75
1.33
-1
.29
1.78
7.
Whe
n I a
m lo
nely
, the
re a
re se
vera
l peo
ple
I can
talk
to.
10
75
5.26
1.
75
-0.9
1 -0
.13
762
5.63
1.
45
-1.1
9 1.
12
8. I
wou
ld h
ave
no id
ea w
here
to tu
rn if
my
fam
ily n
eede
d fo
od o
r hou
sing
. 10
71
5.38
1.
93
-0.9
7 -0
.31
761
5.68
1.
79
-1.3
0 0.
58
9. I
wou
ldn’
t kno
w w
here
to g
o fo
r hel
p if
I had
trou
ble
mak
ing
ends
mee
t.
1072
4.
99
2.08
-0
.65
-0.9
4 76
1 5.
42
1.92
-1
.05
-0.1
5 10
. If
ther
e is
a c
risis
, I h
ave
othe
rs I
can
talk
to.
10
76
5.51
1.
64
-1.1
5 0.
53
762
5.76
1.
38
-1.3
6 0.
18
11.
If I
need
ed h
elp
findi
ng a
job,
I w
ould
n’t k
now
whe
re to
go
for h
elp.
10
74
4.75
1.
17
0.47
-1
.22
760
4.72
2.
20
0.45
-1
.25
17.
I am
hap
py b
eing
with
my
child
.
1054
6.
54
0.93
-2
.31
5.58
74
6 6.
60
0.89
-3
.23
13.5
4 18
. M
y ch
ild a
nd I
are
very
clo
se to
eac
h ot
her.
10
53
6.19
1.
25
-1.6
2 2.
20
747
6.37
1.
09
-2.0
6 4.
57
19.
I am
abl
e to
soot
he m
y ch
ild w
hen
he/s
he is
ups
et.
10
53
5.80
1.
35
-1.0
5 0.
43
747
6.03
1.
17
-1.1
9 1.
08
20.
I spe
nd ti
me
with
my
child
doi
ng w
hat h
e/sh
e lik
es to
do.
10
55
6.69
1.
34
0.90
0.
32
747
6.04
1.
13
-1.4
2 2.
64

91
The Measurement Model (CFA)
As described in the Research Methodology, confirmatory factor analysis, the
measurement model of SEM, was used to see how well the hypothesized constructs were
reflected by the observed variables or in this case, the PFS items. Additionally, the
measurement model provides evidence of the reliability and validity of the PFS. Before
examining each question independently, it is important to look at the overall fit of the null model
depicted in Figure 2. In the null model, all parameters are allowed to be estimated. In
comparison to other models, the null model is often referred to as configural invariance (Cheung
& Rensvold, 2002) and is labeled as such in Table 15.
Examining fit indices helps determine the degree to which the observed values are
predicted by the estimated model. In other words, the fit indices provide a statistical way to
quantify the degree to which the observed data (responses on PFS items at pre and post) coincide
with theoretical expectations. As suggested in the literature, model fit was evaluated using
several general fit indices (Kline, 1998). The model chi-square fit statistic for the four-factor
model indicates poor model fit, however it is very sensitive to large samples sizes and tends to
result in large Chi-Square values (Kline, 1998). Because of the chi-square statistic’s sensitivity
to large sample sizes, other fit indices were examined, including the NNFI, CFI, and RMSEA.
To be considered a good fit, NNFI values must be above .90, CFI .90, and RMSEA less than .05.
Results for the configural invariance or null model were NNFI=.968, CFI=.973, and
RMSEA=.028. Overall, the fit indices indicate that the measurement model exhibits extremely
good fit. Thus, it can be said that the PFS items functioned as expected and corresponded with
the theoretical assumptions. Fit values for the configural invariance model and subsequent
alternative models are presented in Table 15.

92
Ta
ble
15
Fit I
ndic
es
χ
df
2 p
ΔχΔ
df
2*
p R
MSE
A
NN
FI
CFI
Δ
CFI
C
onfig
ural
Inva
rianc
e 66
4.79
8 36
2 <.
001
.0
28
.968
.9
73
Lo
adin
g In
varia
nce
729.
907
377
<.00
1 56
.65
15
<.00
1 .0
29
.964
.9
69
.004
Eq
ualit
y of
Cor
rela
tions
St
abili
ty
731.
016
383
<.00
1 2.
42
6 .8
8 .0
29
.965
.9
69
<.00
1
Late
nt m
ean
Inva
rianc
e 84
9.28
6 38
7 <.
001
125.
87
4 <.
001
.033
.9
54
.959
.0
1 FF
Inva
rianc
e 75
9.83
7 38
4 <.
001
32.1
0 1
<.00
1 0.
30
.962
.9
67
.002
SS
Inva
rianc
e 74
1.43
7 38
4 <.
001
10.4
7 1
<.00
1 .0
29
.964
.9
68
.001
C
S In
varia
nce
805.
218
384
<.00
1 75
.41
1 <.
001
.032
.9
58
.963
.0
06
NA
Inva
rianc
e 75
2.23
9 38
4 <.
001
23.5
8 1
<.00
1 .0
30
.963
.9
67
.002
*B
ecau
se M
LR w
as u
sed,
chi
-squ
are
diff
eren
ce sc
ores
wer
e co
mpu
ted
usin
g a
scal
ing
fact
or (S
ator
ra, 2
000)
.
93
Fit statistics may demonstrate that the model conforms to the data, however
the fit statistics do not provide information about the validity of the parameter
estimates. Figure 2 presented the model, in which all the parameters are freely
estimated. In SEM, parameters are the relationships between observed variables,
latent variables, and errors. Six rules specified the parameters and resulted in 103
estimates, which are defined as all the uni and bi-directional arrows in the figure.
Models may exhibit good fit and acceptable structure despite poor or meaningless
parameter estimates (Schumacker & Lomax, 2004). For that reason, parameters
were examined because they address research questions 1 and 2.
Question 1: To what extent do the items (manifest variables) in the PFS
define the protective factors constructs (content validity and reliability)?
The measurement model was used to answer this question because high factor
loadings provide evidence that the indicators converge on a construct or stated
differently, that the observed variables measure a latent construct. Based on the
literature, items were expected to load onto one of the four protective factors.
Hypothesis 1: The manifest variables will load highly on the appropriate
factors. Table 16 presents the latent construct with hypothesized items, the loading
estimates from MPlus, standardized loadings, standard errors, p-values, and R2. All
30 items were statistically significant, and standardized estimates ranged from .455 to
.883. With the exception of the item in the concrete support subscale, “If I needed
help finding a job, I wouldn’t know where to go for help,” the items exhibited high
loadings above .650. In a confirmatory factory analysis, one rule of thumb is that

94
loadings should be .7 or higher. The rationale is that a loading of that magnitude
indicates that almost half of the variance of the indicator is explained by that factor.
Some researchers acknowledge that this standard is difficult to achieve in real world
situations, therefore accept levels as low as .3 or .4 (Brown, 2006; Hair, Anderson,
Tatham, & Black, 1998).
Summary. Using the higher standard of .7, 27 out of the 30 factor loadings
met this threshold. R2
Table 16
output is also provided to show the amount of variance in the
item accounted for by the latent variable. Hypothesis 1 is supported.
PFS Items and Factor Loadings
Factor
Item
Estimate Standardized
Loading
Std. Error p-
value
R2
Family functioning Time 1
Item 1 1.096 .727 .047 .000 .528
Item 2 1.341 .816 .042 .000 .666
Item 3 1.373 .873 .038 .000 .762
Item 4 1.237 .763 .045 .000 .582
Item 5 1.133 .735 .046 .000 .541
Social support Time 1
Item 6 1.305 .819 .049 .000 .670
Item 7 1.499 .853 .048 .000 .728
Item 10 1.291 .789 .052 .000 .622
Concrete support Time 1
Item 8 1.735 .833 .057 .000 .694

95
Item 9 1.568 .812 .059 .000 .659
Item 11 1.010 .466 .070 .000 .217
Nurturing and attachment Time 1
Item 17 .647 .696 .041 .000 .484
Item 18 1.038 .832 .041 .000 .692
Item 19 1.042 .778 .045 .000 .605
Item 20 .990 .734 .046 .000 .539
Family functioning Time 2
Item 1 1.082 .807 .043 .000 .651
Item 2 1.238 .876 .038 .000 .768
Item 3 1.175 .869 .041 .000 .755
Item 4 .995 .732 .048 .000 .536
Item 5 .972 .735 .047 .000 .540
Social support Time 2
Item 6 1.144 .853 .057 .000 .727
Item 7 1.292 .883 .054 .000 .780
Item 10 1.112 .802 .059 .000 .643
Concrete support Time 2
Item 8 1.484 .830 .069 .000 .690
Item 9 1.608 .836 .065 .000 .700
Item 11 .998 .455 .080 .000 .207

96
*(labeled according to PFS item number in Appendix C).
Question 2: What are the underlying relationships among the protective
factors as measured by the items in the PFS (convergent validity)? Convergent
validity means that similar constructs should be related to one another (Shadish,
Cook, & Campbell, 2002). The measurement model was used to examine
relationships between the constructs (protective factors). Correlations are reported in
Table 17. Between-factor correlations within each time point were all significantly
positively correlated and ranged from .067 to .472. Predictive relationships of the
factors across time were examined through a structural model and are presented later
in this chapter.
Three hypotheses were made about the relationships between the protective
factors. Results for each are presented below. A discussion of the findings within a
broader context is provided in the Discussion and Conclusions chapter.
Hypotheses 2a: Family functioning and social support will be highly
positively correlated (Jack, 2000). The literature suggests a relationship between
social support and family functioning (Walsh, 2002; Jack, 2000; Bronfenbrenner, &
Crouter, 1983; Dunst, 2000), however the strength of the relationship is unspecified .
Nurturing and attachment Time
2
Item 17 .582 .655 .052 .000 .429
Item 18 .912 .825 .046 .000 .681
Item 19 .874 .739 .048 .000 .546
Item 20 .856 .746 .053 .000 .557

97
This study hypothesized a strong correlation between the two protective factors.
Results indicated a moderate relationship between family functioning and social
support at Time One (.472) and Time Two (.429).
Summary. The relationship between the family functioning and social
support is in the direction specified and is moderate, not strong. The hypothesis is
not supported and is discussed at length in the Discussion and Conclusions.
Hypothesis 2b: Social support and concrete support will be positively
moderately correlated (Coohey, 1996). Social support and concrete support are
described as inter-woven concepts in the literature (Thoit, 1982; Cameron, 1990;
Gottlieb, 1983; DePanfilis, 1996). Therefore, it was hypothesized that the
relationship between the protective factors would be positively moderately correlated.
Results of this study indicated a weak relationship in the direction predicted (Time
One: .270; Time Two: .233).
Summary. The relationship between social support and concrete support is in
the direction specified and is weak, not moderate. The hypothesis is not supported
and is discussed fully in the final chapter.
Hypothesis 2c: Social support and nurturing and attachment will be highly
positively correlated (Crockenberg, 1981). Early studies of nurturing and
attachment identified social support as a strong predictor of nurturing and attachment
(Crockenberg, 1981). Accordingly, the relationship between the protective factors
of social support and nurturing and attachment was hypothesized to be highly
positively correlated. Relationships between the factors varied at the time points.

98
At Time One, the relationship was the strongest and can be described as moderate
(.354). The relationship between social support and nurturing and attachment was
smaller at Time Two, and approached moderate (.270).
Summary. The relationship between social support and nurturing and
attachment is in the direction specified and is moderate, not strong. The hypothesis
is not supported and is discussed fully in the final chapter.
Table 17
Time One – Time Two Correlations of PFS Factors
FFT1 SST1 CST1 NAT1 FFT2 SSTS CST2 NAT2
FFT1 1.000
SST1 .472 1.000
CST1 .260 .270 1.000
NAT1 .445 .354 .165 1.000
FFT2 .719 .359 .228 .371 1.000
SST2 .321 .642 .255 .196 .429 1.000
CST2 .197 .247 .722 .106 .211 .233 1.000
NAT2 .318 .262 .084 .775 .391 .270 .067 1.000
Note. All correlations are significant at p = .000. FF1 = Time One Family functioning, SS1= Time One Social support, CS1 = Time One Concrete support, NA1 = Time One Nurturing & Attachment, FF2 = Time Two Family functioning, SS2= Time Two Social support, CS2 = Time Two Concrete support, NA2 = Time Two Nurturing & Attachment.
Question 3: To what extent does the underlying structure of the PFS
remain stable across time? Measurement invariance was examined to determine if
the PFS was stable and measured the four protective factors consistently across time

99
points. Stability is critical to compare results of treatment effectiveness across
groups or longitudinally (Pentz & Chou, 1994). Without stability, results are
untrustworthy. As indicated above, the measurement model examining configural
invariance indicated a close fit to the sample data and showed that the PFS had the
same factor structure at Time One and Time Two. To examine instrument stability,
three increasingly restrictive models were fit to the data to assess whether the PFS is
equivalent across time points. As described in the methodology section,
measurement invariance was examined by equating the factor loadings in Time One
to Time Two (loading invariance), equating the correlations (Equality of
Correlations—Stability), and equating the latent means (latent mean invariance). A
CFI change (from the progressively constrained models) of equal to or less than .01
indicates that the models are essentially the same (Cheung & Rensvold, 2002).
Correspondingly, Hypothesis 3a is addressed by loading invariance, Hypothesis 3b by
equality of correlations, and Hypothesis 3c by latent mean invariance. Results of the
increasingly constrained models are presented in Table 15.
Hypotheses 3a: The factor loadings for each construct will remain stable
across time. When the loadings were set to be equal, the CFI change (.004) between
the constrained and baseline model was less than .01 indicating that the loadings are
the same across time points (See Table 15). Table 18 shows the equated estimates
and standardized loadings. It must be noted that Mplus uses the variances of the
indicators and the latent variables to standardize loadings. Therefore, even when the
loadings are constrained to be equal, indicators at Time One and Time Two will have

100
slightly different variances. Only very strong factorial invariance (loadings,
indicator means, and indicator variances all equal across time), which is rare and not
of interest here, will result in the standardized loadings being the same (Muthén &
Muthén, 1998-2007). Since changes in subscale scores were expected as a result of
the intervention, strong factorial invariance was neither expected nor desired.
Summary. The CFI change of less than .01 indicates that the factor loadings
function similarly across time points. In order words, they measure the constructs
consistently regardless of administration point. The hypothesis is supported, and
factor loadings are stable across time.

101
Table 18
Measurement Invariance: PFS Items and Equated Factor Loadings
Factor
Item
Estimate Std.
Loading*
Std.
Error
p-value
Family functioning T1 T2
Item 1 1.105 .731 .809 0.035 .000
Item 2 1.308 .811 .885 0.033 .000
Item 3 1.293 .858 .890 0.033 .000
Item 4 1.136 .731 .778 0.039 .000
Item 5 1.067 .712 .767 0.038 .000
Social support T1 T2
Item 6 1.244 .805 .871 0.040 .000
Item 7 1.415 .837 .902 0.042 .000
Item 10 1.221 .771 .828 0.043 .000
Concrete support T1 T2
Item 8 1.613 .801 .866 0.050 .000
Item 9 1.588 .824 .820 0.048 .000
Item 11 0.999 .461 .453 0.061 .000
Nurturing and Attachment T1 T2
Item 17 0.626 .684 .682 0.038 .000
Item 18 0.992 .819 .847 0.039 .000
Item 19 0.979 .754 .777 0.039 .000
Item 20 0.938 .714 .777 0.041 .000

102
Hypothesis 3b: The relationships between the constructs will remain stable
across time.
Summary. The change in CFI was miniscule and is far below the minimum
threshold of .01that would indicate a difference between the two models. Thus, this
hypothesis is supported, and the relationships between the constructs are consistent or
stable across regardless of administration time point.
Equivalence of latent covariances was examined by constraining the
covariances between the latent constructs within time points. Correlations were set
to be equal to examine the stability of the instrument across time points. The change
in CFI between the loading invariance and the equality of correlations models was
less than .001 and indicates that the relationships between factors at Time One are
similar to relationships between factors at Time Two (See Table 15). All
correlations are significant at p = .000, with the exception of concrete support at Time
One with nurturing and attachment at Time Two (p=.046). Table 19 shows the
correlations at Time One and Time Two constrained to be equal, as well as the
relationships between factors at Time One and Time Two.

103
Table 19
Measurement Invariance: Equated Correlations at Time One and Time Two
FF1 SS1 CS1 NA1 FF2 SS2 CS2 NA2
FF1 1.000
SS1 .462 1.000
CS1 .243 .262 1.000
NA1 .430 .331 .132 1.000
FF2 .721 .365 .224 .381 1.000
SS2 .333 .649 .258 .218 .462 1.000
CS2 .213 .259 .721 .124 .243 .262 1.000
NA2 .326 .270 .086 .779 .430 .331 .132 1.000
Note. FF1 = Time One Family functioning, SS1= Time One Social support, CS1 = Time One Concrete support, NA1 = Time One Nurturing & Attachment, FF2 = Time Two Family functioning, SS2= Time Two Social support, CS2 = Time Two Concrete support, NA2 = Time Two Nurturing & Attachment. Within time correlations are italicized.
Hypothesis 3c: Latent mean scores will differ from Time One to Time Two.
To determine if the scores from pre-post were truly different, the means were set to be
equal between Time One and Time Two. Table 20 shows the equated mean
estimates.

104
Table 20
Measurement Invariance: Equated Latent Means
Estimate S.E. Est./S.E. p-value
Family functioning 4.542 .153 29.597 .000
Social support 4.480 .166 27.019 .000
Concrete support 4.748 .301 15.768 .000
Nurturing and Attachment 5.962 .257 23.158 .000
For Hypothesis 3a and 3b, it was desired that the CFI change scores were
below .01 because that indicates that the instrument is stable. However, for
Hypothesis 3c, the desired CFI change score between the equality of correlations
stability and the latent mean invariance models is above .01. A change in fit index
would indicate that the models are different and that the protective factors have
changed from Time One to Time Two. Such a change is expected and preferred
when there is an intervention between administration points of the survey. In the
present study, some type of parent education intervention occurred between the pre-
and post-tests of the PFS. Therefore, setting the latent mean scores to be equal
should, if the parent education programs are effective, result in worse model fit from
the equality of correlations stability model. Results show a change in CFI of .01,
which is the maximum threshold identified by (Cheung & Rensvold, 2002) for
declaring the models to be equal.
Setting latent means to be equal across time points did not result in changes in
model fit, which indicates that there was little change in the subscale scores.

105
However, this overall fit statistic does not enable closer examination of changes in
model fit by factor. Therefore, differences in latent mean scores were more fully
explored through constrained models in the CFA. To examine change in subscale
scores across time points, four separate models were run—each equating the latent
means while allowing the others to be estimated. Fit indices results are presented in
Table 15. For family functioning, the change in CFI was .002, for social support
.001, for concrete support .006, and for nurturing and attachment .002. The small
changes in the CFI for each factor suggest that in this model, the latent means are the
same across time points. These results may suggest that the interventions were not
strong enough to result in substantive changes in the mean scores.
Because the overall change in CFI approached the threshold for difference
between models, additional testing was done using SPSS to provide another
perspective and enable the calculation of effect sizes and interpretation of the
differences. Paired sample t-tests were conducted to determine if there were
statistically significant differences between Time One and Time Two on the PFS
subscales: family functioning, social support, concrete support, and nurturing and
attachment. Table 21 shows the results. Cohen’s d was calculated for each subscale
to determine if the effect size was of practical significance (Cepeda, 2008).
Respectively, effect sizes were family functioning d=.33, social support d=.17,
concrete support d=.14, and nurturing and attachment d=.22. The effect sizes for the
subscales, social support, concrete support, and nurturing and attachment were minor

106
and do not meet Cohen’s threshold for even a small effect. Family functioning
exhibited a small effect size (Cohen, 1988).
Table 21
Comparison Time One to Time Two PFS Subscale Scores
PFS Subscale Time 1 Time 2 Comparison Test
Family functioning (FF) M=4.94 M=5.27 t(761)= -9.05, p=.00
Social support (SS) M=5.50 M=5.71 t(760)= -4.73, p=.00
Concrete support (CS) M=5.06 M=5.27 t(760)= - 3.97, p=.00
Nurturing and
Attachment (NA) M=6.10 M=6.26 t(739)= -6.10, p=.00
Summary. The change in CFI (.01) means that latent mean scores are
essentially the same at both time points, possibly suggesting that the parent education
program, coupled with Strengthening Families, had little to no impact on the
protective factors (See Table 15). Paired sample t-tests in SPSS detected minor effect
sizes with the exception of family functioning, which reported a small effect size.
The results of both the invariance test of equated latent means in the CFA and the
paired sample t-tests in SPSS imply that there is little change between the protective
factors from Time One to Time Two, indicating that the hypothesis is not supported.
Question 4: What is the internal consistency of the items in each of the
subscales? When measuring concepts such as the protective factors, it is critical to
know if the items within each subscale consistently reflect the construct that the items
are intended to measure. The most accepted way to determine scale reliability or

107
internal consistency is by examining the Cronbach alpha of the scale (Cronbach,
1951). While there is no definitive threshold for internal consistency, a Cronbach of
.90 is considered excellent, .80 very good, and .70 adequate (Kline, 1998).
In the field tests, Cronbach alphas of the subscales in the measurement model
were above .80 for family functioning, social support, and nurturing and attachment.
Concrete support has ranged from .63 to .86, the latter score on the retrospective pre-
test.
Hypothesis 4: Internal consistency for each subscale will exceed a
Cronbach alpha of .8. As described above, .70 is considerate adequate for a scale’s
internal consistency. However, the authors of the PFS desired a higher standard of
internal consistency exceeding .80. In the current study, three of the subscales
exceeded the .80 standard of very good at Time One and Time Two: family
functioning (.89, .90), social support (.86, .88), and nurturing and attachment (.84,
.82). The Cronbach alpha for concrete support was determined to be adequate at
both time points (.73, .72).
Summary. The internal consistency of the family functioning, social support,
and nurturing and attachment subscales exceeds the desired standard of .80,
suggesting that the items consistently reflect the concepts they were intended to
measure. The concrete support subscale, while adequate, does not meet the standard
preferred by this researcher. Potential reasons for the lower internal consistency of
the concrete subscale are discussed at length in the final chapter. Because one of the
four subscales did not exceed the .80 threshold, the hypothesis was not supported.

108
Additional Analyses: The Structural Model
In addition to examining the relationships between the protective factors, the
researcher determined that it would also be informative to examine the ability of
protective factor scores at Time One to predict protective factor scores at Time Two.
A structural regression model was run to determine the ability of Time One subscale
scores to predict Time Two subscale scores. Results are presented in Table 22. The
shaded cells represent the independent variables at Time One. Under each subscale,
the dependent variables (subscales at Time Two) are listed. The model chi-square fit
statistic for the structural model was χ2 (383)
= 1025.265, p<.000. The significant chi-
square value indicates poor model fit, which is common in large samples sizes (Kline,
1998). Other fit indices examined were the NNFI (.935), CFI (.943), and RMSEA
(.039). To be considered a good fit, NNFI values must be above .90, CFI .90, and
RMSEA less than .05. Overall, the fit indices indicate that the measurement model
exhibits extremely good fit. For each subscale, the Time One score predicted the
Time Two score. All other paths were non-significant, meaning that only the factor
itself at Time One predicts the mean score of that factor at Time Two. In other
words, the mean score of family function at Time One will not predict the mean score
of social support at Time Two, and so on.

109
Table 22
Structural Regression Model
Estimate S.E. Est./S.E. p-value
Family functioning T1
Family functioning T2 .599 .042 14.219 .000
Social support T2 .025 .039 .646 .518
Concrete support T2 .008 .044 .176 .860
Nurturing and Attachment T2 -.018 .026 -.668 .504
Social support T1
Family functioning T2 .009 .036 .248 .804
Social support T2 .536 .0942 12.614 .000
Concrete support T2 .074 .046 1.594 .111
Nurturing and Attachment T2 .004 .031 .143 .886
Concrete support T1
Family functioning T2 .027 .033 .819 .413
Social support T2 .066 .034 1.950 .051
Concrete support T2 .642 .047 13.699 .000
Nurturing and Attachment T2 -.041 .028 -1.456 .145
Nurturing and Attachment T1
Family functioning T2 .050 .032 1.567 .117
Social support T2 -.042 .036 -1.186 .236
Concrete support T2 -.034 .039 -.864 .388
Nurturing and Attachment T2 .677 .043 15.931 .000

110
Chapter 4: Discussion and Conclusions
This chapter revisits the progression of the research study and begins with a
summary of the contextual issues, the unique attributes of this work, and a brief
summary of the study’s findings. Following is an in-depth discussion by research
question and hypothesis, including how the findings relate to previous research and
any potential issues that contributed to the findings. Finally, this chapter concludes
with limitations, implications for practice, and directions for future research.
Context
In the first chapter, three contextual issues for this study were presented—1)
the problem of child maltreatment and prevention programs, including parent
education programs to decrease risk factors and increase protective factors, 2) the
Strengthening Families approach, which suggests a protective factors lens to address
child maltreatment, and 3) the lack of psychometrically sound, brief instruments that
measure multiple protective factors specific to the Strengthening Families approach.
The present study addresses the third issue and is unique in several ways. First, this
study is the first large scale study of the Protective Factors Survey (PFS) with parent
education programs. Second, although several states are using the PFS with
prevention programs, this study is the first to examine the psychometric properties of
an entire state’s administration of the instrument. Third, this study is the first to
examine the PFS in the natural context and flow of prevention programs. Previous
field tests explored reliability and validity of the instrument, but the post-test was
often at a contrived end date to meet the deadlines of the study.

111
In addition to design issues, this study contributes a valid and reliable
instrument to explore effectiveness of an approach that has seen wide uptake in the
field. In some ways the Strengthening Families approach has taken on the
characteristics of a viral marketing campaign (Viral Marketing, 2010), an approach
that relies on pre-existing social networks to spread the philosophy. In this case,
conferences, organizations, webinars, state networks and other mechanisms within the
maltreatment field have contributed to the broad uptake of the Strengthening Families
approach. The spread has been quick. Organizations “catch it” in a way that is
similar to the spread of pathological or computer viruses. The protective factors
seem to make intuitive sense to practitioners and are imbedded in prevention
approaches with little hesitation. Research and evaluation of the approach, however,
have not spread as rapidly. As mentioned previously, there remains a gap in the
research to document the approach’s effectiveness to increase protective factors in
families and lead to a sustainable reduction in child maltreatment. In particular,
many community-based programs that implement parent education programs lack the
necessary resources to conduct evaluation efforts, including staff evaluation capacity
and easy-to-administer instruments.
Brief Summary
The present study seeks to contribute further evidence of the sound
psychometric properties of the PFS to measure multiple protective factors. To that
end, the present study was designed to answer the overarching research question: To
what extent is the PFS a valid and reliable instrument of multiple protective factors?

112
Sub-questions were posed to examine the reliability and validity of the instrument: 1)
To what extent do the items (manifest variables) in the PFS define the protective
factor constructs? 2) What are the underlying relationships among the protective
factors as measured by the items in the PFS? 3) To what extent does the underlying
structure of the PFS remain stable across time? and 4) What is the internal
consistency of the items in each of the subscales?
Overall, the study provides psychometric data that supports a valid and
reliable four-factor measurement and structural regression model to measure multiple
protective factors in parents and caregivers who participate in parent education
programs. Question 1 explored to what extent the observed variables in the PFS
define the protective factors constructs (content validity and reliability). The items
loaded on the hypothesized factors as predicted (see Table 16), and the model
exhibited extremely good fit. With the exception of one of the concrete support
loadings, the loadings on the latent variables were extremely high, indicating that
more than half of the variance of the item is explained by the respective protective
factor. These findings suggest that the items in all of the scales—family functioning,
social support, concrete support, and nurturing and attachment are tapping the
protective factors they were intended to measure.
With respect to Question 2, the measurement model explored the underlying
relationships of the protective factors within time points. Overall, the relationships
were in the directions predicted. Within time correlations between factors ranged
from .067 to .472. However, relationships between the protective factors were not as

113
strong as predicted. For example, family functioning and social support were
hypothesized to be highly correlated. The two factors exhibited moderate
relationships at Time One and Time Two. Social support and concrete supports were
hypothesized to be moderately correlated. Within time points, however,
relationships were low. Social support and nurturing and attachment were predicted
to be highly positively correlated, however in the models, the correlations were
moderate at best. To further explore the relationships between the protective factors,
a structural model was conducted to determine if scale scores at Time One were
predictive of scale scores at Time Two. Although factors were correlated and
exhibited weak to moderate relationships, only the score on the subscale itself at Time
One was predictive of the score at Time Two. When within time correlations were
controlled for, all other structural paths were not statistically significant. In other
words, a high score on nurturing and attachment at Time One is not predictive of high
scores on concrete support or any of the other scales at Time Two. This is of note
because it suggests that although related, the PFS measures distinct constructs.
Invariance testing with increasingly constrained models was conducted to
determine if the underlying factor structure of the PFS remained stable across time
(Question 3). That is, do participants understand and respond to the PFS questions in
the same manner when taking the PFS prior to receiving services and at the
completion of services? Based on the results, the PFS functions in the same manor
regardless of if it is a pre-test or a post-test. When both the loadings and the
correlations between the constructs were set to be equal, the model fit was essentially

114
the same, indicating that the model measures the protective factors in a similar
manner at pre- and post-test.
Because an intervention occurred between time points, it was hypothesized
that latent mean scores at Time Two would be higher than at Time One. The
Confirmatory Factor Analysis did not support that hypothesis. When latent means
were equated, the change in model fit was .01, which meets the threshold for a
difference in models. Additional tests were conducted to focus individually on the
scale scores. In four separate sub-models, each of the latent means was equated
across time points. If the latent means were equated, but the data reflected a change
in scores, then the model fit should have become worse. In this case a “worse”
model fit would signify that there was a change in mean scores perhaps as a result of
in intervention such as parent education. That did not happen. Essentially, there
was no change in model fit for any of the latent mean scores from Time One to Time
Two.
Although the model fit in these tests fell within the Comparative Fit Index
(CFI) change of less than .01, it must be noted that there was some change in the
latent means scores. To gain another perspective and enable reporting of effect sizes,
comparison tests from Time One to Time Two were conducted in SPSS. In each of
these tests, changes from pre to post were statistically significant, albeit exhibited
weak to small effect sizes. Thus, there are two conflicting perspectives on whether
there were increases in the protective factors from Time One to Time Two. The
incongruity of the change scores is discussed in detail in the following section and

115
suggests that future research should focus on the intervention and include controls for
frequency and duration of services and fidelity of the intervention.
Internal consistency of the subscales (Question 4) supports previous research.
Three of the subscales exhibit high internal consistency (family functioning, social
support, and nurturing and attachment). Concrete support continues to fall below the
desired .80 threshold.
Discussion
The results of each research question and hypothesis that were presented in
Chapter 3: Results are discussed in detail in the following section. The overall
question “To what extent is the PFS a valid and reliable instrument of multiple
protective factors” is addressed by considering each question and hypothesis
individually, tying it back to the literature, and exploring potential reasons for the
findings.
Research Question 1: To what extent do the items (manifest variables) in
the PFS define the protective factors constructs (content validity and reliability)?
CFA enables the researcher to psychometrically evaluate an instrument’s conceptual
foundation. In the CFA model in this study, the researcher examined factor loadings
to assess each item’s reliability to measure the hypothesized protective factor.
Squaring the standardized factor loadings indicates the amount of variance accounted
for in the latent variable by each item (Brown, 2006). A standardized factor loading
above .7 means that over half of the variance of that item is explained by the
hypothesized factor. The following section discusses the factor loadings in the PFS

116
and notes that all standardized loadings, with the exception of one concrete support
item, are evidence of the items’ reliability (Brown, 2006). Content validity concerns
the representativeness of the items to measure or capture the construct. Although it
is not possible to evaluate content validity statistically, the literature review and
reliability of the indicators support the content validity of the PFS. The literature
review supported the operational definition and writing of the items, which were then
tested in the measurement model.
Hypothesis 1: The manifest variables will load highly on the appropriate
factors. This hypothesis was supported by the loadings in the CFA. As mentioned
previously, items comprising three of the subscales exhibited extremely high loadings
that suggest that the items are tapping the intended protective factors. The family
functioning loadings ranged from .727 to .873 at Time One and .732 to .876 at Time
Two. They were written to tap items that describe a family’s adaptive skills and
strategies to operate and persevere in times of crisis. Specifically, items measure the
family’s perceived ability to solve problems, listen to each other, and overcome
adversity. The social support loadings ranged from .789 to .853 at Time One and
.802 to .853 at Time Two. Items were intended to measure the parent or caregiver’s
perceived availability of informal and emotional support from family and friends.
Results indicate that the items function as intended. Nurturing and attachment items
ranged from .696 to .832 at Time One and .655 to .825 at Time Two. These items
were designed to capture the parent or caregiver’s perceived emotional tie and

117
positive interaction between them and their child. The high factor loadings suggest
that the items function as intended.
Concrete support loadings ranged from .466 to .833 at Time One and .455 to
.836 at Time Two. Items were written to measure the parent’s awareness of and
ability to utilize tangible goods and services that could help them cope during times
of need. Specifically, the PFS examines three types of concrete support—where to
go to secure food or housing, where to go to secure cash assistance to help pay bills,
and where to go to find employment. The first two loadings were high, however the
third one was markedly lower than all the others in the instrument (.466 and .455
respectively). Within the context of the current economy, this item may be
interpreted differently than when it was originally conceptualized in 2006, when the
economy, as measured by Gross Domestic Product (GDP), was growing (Bureau of
Economic Analysis, 2010). GDP is an indicator of the overall health of the economy
(Amadeo, 2010), and beginning in the third quarter of 2008, the GDP started
showing signs of a struggling economy—as demonstrated by four consecutive
quarters of declines (Bureau of Economic Analysis, 2010).
Specific to this study’s participants, the unemployment rate in Nevada
exceeded 13 percent during the study period (U.S. Bureau of Labor Statistics, 2009).
This fact may have influenced the responses on the item about employment options.
In the past, employment agencies, workforce centers, and other job services may have
been a logical place to turn when one was out of work. However, in the current
economy, participants may have perceived that there were no easy answers or jobs to

118
be had. The lack of available jobs and high number of qualified unemployed
workers may have confounded the responses on this item.
Research Question 2. What are the underlying relationships among the
protective factors as measured by the items in the PFS (convergent validity)?
Research and theory suggests a complex, multi-faceted, and interactive relationship
between these concepts (Jack, 2000; Dunst, 2000; Brofenbrennor, 1986).
Hypotheses 2a, 2b, and 2c explored relationships between social support and family
functioning, concrete support, and nurturing and attachment. Social support is a
popular aspect of prevention approaches and programs. It is not well understood,
however, how social support is influenced by prevention strategies and affects
behaviors that result in a reduction in maltreatment (Budde & Schene, 2004). Budde
and Schene (2004) suggest an evaluation agenda to explore interventions that target
social support as an outcome. Evaluation questions would include: 1) Do social
support interventions result in higher levels of social support and other related
behaviors? 2) How do social support interventions contribute to violence prevention
mechanisms (improved parenting and reduced stress)? 3) How does the economic
context influence social support interventions and outcomes? and 4) How do
relationships change as a result of social support interventions? The present study
does not provide definitive answers to these questions but does contribute to what is
known about parent education programs infused with the Strengthening Families
approach. Specifically, this study documents the strength of relationship between
social support and family functioning, concrete supports, and nurturing and

119
attachment. Although relationships were not as strong as hypothesized, they are
noteworthy.
Hypothesis 2a: Family functioning and social support will be highly
positively correlated (Jack, 2000). Family systems theory (Walsh, 2002), the
ecological model (Jack, 2000; Bronfenbrenner, & Crouter, 1983), and social systems
theory (Dunst, 2000) acknowledge a relationship between social support and family
functioning. The nature of that relationship is understood to be highly complex. In
addition to an interactive, positive relationship between the two factors, social support
has been explored as a method of predicting or mediating family functioning
(Armstrong, Birnie-Lefcovitch, & Ungar, 2005). Using hierarchical multiple
regression analyses, researchers found that although results supported the literature,
social support had less mediating effects on family functioning than expected (Dunst,
Trivette, & Cross, 1985). Social support had more influence on personal well-being
and attitudes towards their children than family functioning. Authors concluded that
the relationships between social support and family and child outcomes were multi-
faceted and complex.
In a study on ecological correlations and their ability to predict family
functioning, researchers explored relationships between parents’ demographic
characteristics, social relationships, and mental health and their ability to predict
family function. Mixed-methods, including self-report, caseworker ratings, and
researcher observation were used to assess the participants’ level of family
functioning. As predictors of family functioning, these variables performed in the

120
expected direction. However, social support played a minor and insignificant role as
a predictor of family functioning (Meyers, Varkey, & Aguirre, 2002).
The present study supports previous theoretical assumptions and contributes
to the research base of the strength of the relationship between the two factors. The
researcher hypothesized a highly positive correlation, however the hypothesis was not
supported. Results registered a moderate relationship between the factors at Time
One (.472) and Two (.429). Interestingly, social support at Time One did not predict
family functioning at Time Two, which supports the research discussed above and
notes a minor role of social support in the prediction of family functioning. Family
functioning at Time One did not predict social support at Time Two. This finding
was consistent with the literature, which posited a uni-directional predictive
relationship between social support and family functioning.
Hypothesis 2b: Social support and concrete supports will be positively
moderately correlated (Coohey, 1996). As defined earlier, social support is multi-
faceted and includes both structural and functional components such as emotional,
instrumental, or informational support (Thoit, 1982; Cameron, 1990; Gottlieb, 1983;
DePanfilis, 1996). The present study focuses on the functional aspects of social
support. For the purposes of this study and alignment with Center for the Study of
Social Policy’s protective factors, emotional support is called social support and
instrumental support is called concrete support. The majority of research focuses on
social support as a mediator or moderator variable (MacLeod & Nelson, 2000;
Meyers, Varkey, & Aguirre, 2002; Dunst, Trivette, & Cross, 1986), with less

121
attention paid to the effects of concrete support (MacLeod & Nelson, 2000). A study
of intergenerational maltreatment identified protective factors that differentiated
individuals who broke the cycle of violence from those who perpetuated it. These
factors were financial support (concrete) and social support (Dixon, Browne &
Hamilton-Giachritsis, 2009). Documentation of the relationship between
Results of this study support a positive, albeit, a weak relationship between
social and concrete support (Time One: .270; Time Two: .233). Although results do
not support the hypothesized moderate relationship, the study contributes to the
literature and suggests a tenuous relationship. When looking at the structural model,
neither type of support at Time One (social or concrete) predicted the other at Time
Two. This finding may mean that although weakly related, perceived social support
does not lead to perceptions of knowing how to access needed resources. Conversely
and although not suggested by the literature, in this study, the perception of having
material resources does not dictate how supported one feels. As mentioned earlier,
this finding may be confounded by the economic downturn and context during which
the study occurred. During more affluent and stable times, perhaps the perception of
the types of
support, however is lacking. Coohey (1996) surmised that when social support is
minimal—that is fewer individuals, fewer contacts with them, and less proximity—
there are fewer opportunities to receive instrumental support such as material
resources or help with child care, housework, etc. Following this reasoning, the
higher the social support, the higher the concrete support would be.

122
resources available from a social network and from more formal sources such as
social agencies would be greater.
Despite these turbulent economic times, the perception of social and concrete
support was high (slightly to mostly agree). The findings of the present study are
important because in spite of economic times, it appears that in general, families feel
supported emotionally and know where to go to get the resources they need.
Hypothesis 2c. Social support and nurturing and attachment will be highly
positively correlated (Crockenberg, 1981). Of infant temperament, maternal
responsiveness, and social support, the latter was the greatest predictor of nurturing
and attachment (Crockenberg, 1981). The researcher based the hypothesis on this
early work from the 1980’s and strived to replicate the findings. The current study
neither supports the hypothesis nor Crockenberg’s uni-directional, predictive
relationship. The strongest relationship, characterized as moderate (Cohen, 1988)
between social support and nurturing and attachment was found at Time One (.354).
At Time Two, the relationship approached moderate but was smaller (.270).
Predictive relationships were non-significant.
A study of the relationship between social networks and infant-mother
attachment did not confirm Crockenberg’s findings (Levitt, Weber, & Clark, 1986).
Spousal and other support were not related to the bond developed by the mother and
infant. These findings and the present study support evidence of a complicated web
of factors that influences the bond between mother and child. A meta-analysis of 66
studies explored parental antecedents of infant attachment and concluded that the

123
early relationship between mother and child can be influenced by changes in maternal
sensitivity, marital conflict, life events, and environmental factors (DeWolff & Van
Ijzendoorn, 1997).
It must also be noted that the majority of research focuses on maternal
attachment of the infant and child. The present study included not just mothers, but
also fathers and other caregivers of a child under the age of 18. Prior to the nurturing
and attachment questions in the PFS, the question was asked, “What is the age and
date of birth of the child you hope will benefit most from your involvement in our
services?” To more comparably explore the relationship between social support and
nurturing and attachment as explored in the previously mentioned studies, it would be
necessary to run the same models or correlations with a subset of parents and
caregivers with children under 12 months of age. However, in the current study this
was not possible because the variable on age of child lacked reliability and validity.
Many of the parents and caregivers in the study had multiple children. Although the
parents self-reported the child they were thinking about when answering the PFS
questions about nurturing and attachment, it was not possible to verify that they were
able to isolate their thinking and only report on their relationship with that particular
child.
Also, some of the responses may have been subject to social desirability. For
example, item 17, “I am happy being with my child” exhibited moderate skew and
kurtosis. This may have been because parents and caregivers believe that societal
norms would expect them to enjoy being with their child. Again, responses on this
124
item may be affected by the age of the child, with parents of infants and parents of
teenagers answering differently. An observational instrument and analysis by age of
child would help tease out these questions and will be further discussed in the
limitations and future research sections.
Research Question 3: To what extent does the underlying structure of the
PFS remain stable across time? In other words, does the PFS measure the same
concepts or in this case, protective factors, regardless of time administration? To
determine stability or “sameness” psychometrically, invariance was examined by
equating or constraining various elements of the model and then seeing how much the
fit changes. If the models are the same, changes in the CFI fit index should be small
(less than or equal to .01) (Cheung & Rensvold, 1999). However, if the change in
CFI is greater than .01, that means the models are not the same. In the case of
longitudinal research or pre-post, such a finding would indicate that the instrument is
not stable and functions differently at pre-post.
The stability or partial invariance of an instrument is important in the use of
longitudinal research that uses experimental or quasi-experimental designs to
compare treatment effects on one group to effects on another. Without evidence of
stability, results may be confounded and interpretation inaccurate (Pentz & Chou,
1994). Further, an instrument would not be considered stable or reliable across time
points, therefore could not be trusted to measure changes in factors as a result of
intervention. Hence, for the PFS to be used to evaluate a program’s effectiveness to

125
strengthen protective factors in parents and caregivers, it was critical to establish
metric invariance of the PFS at pre- and post-administration.
However, total measurement invariance beyond loading and correlational
invariance was neither expected nor desired in the present study. In longitudinal
research involving subjects and an intervention, changes in latent mean scores would
indicate that the intervention or some mediating factor was related to those change
scores. Therefore, if invariance was tested, model fit would be expected to worsen.
That is, because changes occurred in the latent means, when equating them in the
invariance testing, the model would not fit as well as before (Pentz & Chou, 1994).
The present study explored two types of measurement invariance to determine
if the psychometric relationships between the observed items and latent constructs
were consistent across time points. If the scales function consistently across time
points, fit should be essentially the same. In this instance, “sameness” is defined as
differences in CFI fit of equal to or less than .01 (Cheung & Rensvold, 2002). As
described in more detail below, the PFS is stable across time points and could be used
longitudinally. That is, the constraints in the loading invariance and equality of
correlations stability models did not result in changes in model fit.
Hypothesis 3a: The factor loadings for each construct will remain stable
across time. Hypothesis 3a in the current study explored item-level metric variance
or whether the strength of the relationship between each item in the PFS and the
factor is the same at both time points. For ease, this testing of invariance is referred
to as Loading Invariance in Table 15. In the CFA model in Figure 2, the loadings or

126
arrows coming from FFT1 were equated to those of FFT2 and so on for each set of
loadings and factors. The change in CFI was .004, indicating that for all practical
purposes, the loadings can be considered to be the same from Time One to Time
Two. Another way to compare the loadings is to visually compare the standardized
loadings for each factor from Time One to Time Two in Table 16. Minimal
differences can be detected. The invariance testing in the CFA confirms these
observations statistically. Given that some researchers say that this type of
invariance is difficult to attain (
Hypothesis 3b:
Byrne, Shavelson, & Muthen, 1989; Marsh &
Hocevar, 1985), the results of this study provide evidence that the items in the PFS
consistently associate with the theoretically-hypothesized constructs regardless of
time point administration.
The relationships between the constructs will remain stable
across time. Hypothesis 3b in the present study explored equivalence of construct
covariance. This type of invariance testing explored whether the relationships or
covariance between latent constructs are the same at Time One and Time Two. In
other words, the relationships between the protective factors were explored to see
whether they were consistent across time points. In the CFA model in Figure 2, the
bi-directional arrows between the factors at Time One were made equal to the bi-
directional arrows between the factors at Time Two. This type of invariance is
critical and must be supported before researchers can compare relationships across
time points or groups (Byrne, 1994; Jackson, Wall, Martin, & Davids, 1993; Marsh,
1993). In the present study, after constraining the covariance, the change in CFI was

127
less than .001, suggesting that the relationships or covariance between the protective
factors are the same regardless of administration time. As mentioned previously, this
type of invariance is necessary before change scores in the latent means can be
compared across time points and across groups. Without this type of invariance,
change scores and effect scores cannot be trusted. Thus demonstrated, latent mean
scores were examined in Hypothesis 3c through two methods.
Hypothesis 3c: Latent mean scores will differ from Time One to Time Two.
To further explore changes in latent scores, four additional constrained models
were run, individually setting each latent mean to be equal. Each test supported the
Once instrument stability is established, it is possible to evaluate change scores as a
result of interventions (Pentz & Chou, 1994). While invariance was expected in the
aforementioned models (Hypothesis 3a and 3b), it was not expected when equating
the latent means. In the present study, participants received some type of parent
education program coupled with Strengthening Families strategies between the pre-
test and the post-test. Because of the intervention, an increase in the protective
factors was expected from Time One to Time Two. No change in model fit when the
means are set to be equal would mean that there is little or no change in the protective
factor scores from Time One to Time Two. The models were essentially the same in
the CFA (change in CFI=.01), suggesting that there was relatively little change as a
result of the parent education programs. It must be noted, however, that the change
in CFI was at the maximum range of what Cheung and Rensvold (2002) set as the
value for not rejecting the null hypothesis of invariance.

128
assertion of no change (Change in CFI: FF=.002, SS=.001, CS=.006, NA=.002).
Although these changes in CFI indicate that there is minimal change in the overall fit,
hence little change in mean scores, it does not allow easy interpretation. For that
reason, effect sizes were calculated in SPSS for each factor. Cohen’s d was
computed for each scale score. On three of the scale scores, effect sizes were below
Cohen’s threshold of a small effect (social support d=.17, concrete support d=.14,
and nurturing and attachment d=.22). Family functioning, however, demonstrated a
small effect size (d=.33). While these effect sizes are not monumental, they are
acceptable for the present study for a couple of reasons. First, the present study was
a measurement piece and did not focus on or control for variations in frequency and
duration of services or fidelity of the parent education programs. Second, the effect
sizes are within the range of reported effect sizes for the recent Center Disease
Control (CDC) meta-analysis of parent education (Kaminski, et al., 2008). In the
CDC study of 77 programs that focused on parent education or training, effect sizes
ranged from .13 to .88. The results of the present study fall within that range.
Finally, the family functioning effect size is comparable to that found in Geerart et
al.’s study of parenting education programs between 1975 and 2002, which found a
small effect size on family functioning (d=.29).
The incongruity of the change score results from the CFA and SPSS analyses
overall suggest that if there was any change in the protective factors from pre to post,
it was minimal. One explanation for this finding is that the parent education
interventions themselves may not have been strong enough to result in substantive
129
change in protective factors from Time One to Time Two. Also, the infusion of
Strengthening Families may not have additive effects on parent education programs.
Without controls for frequency and duration of services and fidelity of the parent
education intervention and the adherence level to Strengthening Families’ strategies,
it is not possible to make conclusions about change scores. The establishment of the
PFS as a psychometrically sound instrument to measure multiple protective factors
provides a resource to examine change as a result of interventions and is discussed
more fully in the implications for practice and future research sections.
Research Question 4: What is the internal consistency of the items in
each of the subscales? When measuring a concept, it is important to know that the
items within the scale consistently reflect the construct, or if they are reliable. A
common way to evaluate internal consistency is through Cronbach’s (1951) alpha.
This statistic provides a co-efficient ranging from 0 (no reliability) to 1.0 (perfect
reliability) that demonstrates item-to-item consistency of a scale (Kline, 1998). The
amount of variance explained by the type of reliability under study can be determine
by subtracting the Cronbach alpha from 1.0. For example, the internal consistency
on the family functioning scale was .90. This means that only 10 percent of the
variance of this scale is caused by random effects of content heterogeneity (Kline,
1998). There is no definitive gold standard for this scale, however, .90 is considered
excellent, .80 very good, and .70 adequate (Kline, 1998). While .70 is adequate, the
authors of the PFS desired high internal consistency exceeding .80.

130
Hypothesis 4: Internal consistency for each subscale will exceed a
Cronbach alpha of .8. According to the standards referenced above, the family
functioning scale demonstrated excellent internal consistency (.89, .90), while social
support approached excellence (.86, .88). Nurturing and attachment exhibited very
good internal consistency (.84, .82). Although not as strong, the Cronbach alpha for
concrete support met Kline’s (1998) definition of adequacy at both time points (.73,
.72).
In the research on the PFS to date, the concrete support subscale does not
meet the threshold of internal consistency desired. One potential reason for this
could be that the three items in the scale are all negatively worded. Including
positive and negatively worded items in survey instruments is meant to overcome
response bias. Respondents tend to agree with more with positively worded items
than negatively worded items (Cronbach, 1951). Balanced approaches that include
positive and negatively worded items are intended to overcome this tendency and to
keep the respondent’s attention on the content under study (Anastasi, 1981).
However, a substantial body of research suggests that negatively worded items may
result in a methods effect that diminishes the internal consistency of the scale
(Schriesheim, Eisenbach, and Hill, 1991). One potential reason for this is that
negatively worded items are not necessarily interpreted as the polar opposite of
positive items (Barnette, 2000). To overcome the loss in internal consistency and
subsequent reduction in validity of the scale, Barnette (2000) recommends against
using negatively worded items, instead using positive or directly worded items and

131
then varying the order of the responses. Stated differently, the responses could be
ordered differently from strongly dislike to strongly like and then from strongly like
to strongly dislike. Changes in the progression of the responses should be clearly
marked.
Limitations
While the PFS has demonstrated reliability and validity, some limitations
must be noted, including the internal consistency of the concrete support scale,
limited criterion-related validity, reliance on self-report, social desirability of the
nurturing and attachment items, lack of an experimental design, and sample issues.
Although considered adequate by some standards (Kline, 1998), the internal
consistency of the concrete support subscale is not on par with the other subscales in
the PFS. The negative wording of the items, coupled with the potential contextual
influence of the item about where to seek help finding a job, suggest caution when
interpreting findings.
Contributions to the validity of the PFS through this study are limited to
content and convergent validity. Because the State of Nevada only assessed
protective factors as an outcome of parent education programs, only an examination
of convergent validity was feasible in this study. Evidence of convergent validity was
provided by examining the hypothesized relationships between the protective factors,
which were in the direction predicted. The use of only the PFS could result in mono-
method bias, which occurs when only one method or instrument is used to measure an

132
outcome (Trochim, 2006). With only one measure, it was not possible to verify that
the PFS is fully measuring the protective factors. Although discriminant validity
with measures of risk factors has been demonstrated in previous studies, the lack of
risk measures in the present study did not contribute to the body of evidence.
The Protective Factors Survey relies on self-report to measure the parent’s or
caregiver’s perception of the presence of family functioning, social support, concrete
support, and nurturing and attachment in their own life. The findings in this study
may be different from how parents actually behave in certain situations. Pairing the
PFS with an observation tool such as the HOME (Caldwell & Bradley, 1984) would
lead to a stronger design and contribute to validity. This limitation, however, may
not be as large of an issue as in other cases of self-report because it is the perception
of social support and nurturing and attachment that are the strongest predictors of
maltreatment rather than the quality or quantity of either factor.
Interpretation of the nurturing and attachment scale should also take into
account distribution non-normality, potential social desirability, and the difficulty of
isolating one child when answering the questions. The moderate skew and kurtosis
of one item in the nurturing and attachment scale, “I am happy being with my child”
should be considered when interpreting factor scores. The nonnormality may be a
result of social desirability, since most people may think it is expected and desired
that they enjoy spending time with their child. It also does not account for how those
societal expectations may differ for parents of infants, as compared to parents of

133
teenagers. The unreliability of the variable on the child’s age in the survey did not
allow for further examination of sub-group differences.
This study was a measurement piece to examine the psychometric properties
of the PFS. One of the research questions explored latent mean differences. The
hypothesis was that there would be an increase in post scores as a result of the parent
education intervention, which included Strengthening Families. While interventions
were not a focus in this study, an experimental design that controlled for frequency
and duration of services and fidelity would have provided more insight on the PFS’
sensitivity and ability to document change over time. The lack of change scores
could mean that the interventions were not strong enough to register effect sizes.
Without assessing elements of implementation such as frequency and duration of
services and fidelity, it is not possible to assess whether the instrument is not sensitive
enough to document changes or whether the interventions do not result in substantive
changes in protective factors.
In addition to the lack of controls for frequency or duration of services and
fidelity, the disparity in program completion rates from agency to agency may also be
an issue. Agency completion rates ranged from zero to 100 percent, suggesting that
there may be factors specific to the agency that support retention or in converse,
contribute to attrition.
Implications for Practice
The protective factors are gaining momentum as a necessary and productive
approach to child maltreatment prevention because protective factors benefit all

134
families, help build positive relationships with service providers, and draw on natural
support systems that contribute to long term success (Child Welfare Information
Gateway, 2009). However, despite broad adoption of the protective factors
philosophy, there remains a gap in the research to document its effectiveness to
increase protective factors in families and ultimately lead to a sustainable reduction in
child maltreatment. The present study contributes to the knowledge base of
protective factors and has implications for the field as a paradigm and tool for
evaluation and research. As mentioned in the Introduction, programs organized
around a predominantly-focused risk model may encounter practice constraints such
as limited reach, stigma, a small window of entry for intervention, and the static
nature of some risk factors. A protective factors approach addresses these practice
challenges, but programs have lacked valid and reliable instruments to measure
protective factors as defined by the Strengthening Families Initiative. The PFS
addresses that need.
To document effectiveness, programs must have a way to measure changes in
multiple protective factors as a result of services. As mentioned earlier, once
instrument stability is established, it is possible to evaluate change scores as a result
of interventions. Currently, programs targeting multiple protective factors have to
piece together several instruments to assess effectiveness. This study establishes the
PFS as a valid and reliable instrument with parent education programs and provides
community-based staff and researchers with an affordable and easy-to-administer tool
that measures multiple protective factors. Because it was aligned with the CSSP

135
model, the PFS can be used by CBCAP programs and others adopting the
Strengthening Families approach to begin to develop an evidence base for the
protective factors as a prevention paradigm.
Because of the evidence provided through four field tests and the present
study, the PFS has well-documented psychometric properties and can now be used
with confidence as an evaluation and research tool. The PFS can serve both
formative and summative functions. The formative function enables service
providers a reliable and valid assessment instrument that can inform practice
decisions. Given prior to services, the PFS provides a snapshot of the presence of
protective factors in the families being served. Staff can utilize the data to identify
target areas and to select strategies that are aligned with the protective factor levels of
their clients. Analysis of subscale scores gives programs a detailed look at the types
of changes participants are experiencing as a consequence of program participation.
Program staff can also use the tool for continuous improvement purposes. In
conjunction with program implementation data, PFS data can be utilized to highlight
effective practices or identify areas in need of improvement.
As a summative measure, the PFS can be used to assess effectiveness. The
administration of the instrument at the beginning and end of services provides
programs with information about changes in protective factors and enables
researchers to calculate effect sizes. In order for programs to assess whether the
Strengthening Families approach makes a difference when added to an evidence-
based program, a reliable and valid instrument tool that aligns with the identified

136
protective factors was needed. This study provides evidence of the validity and
reliability of the PFS for the field. As described below, the PFS can be used to begin
addressing the critical question of whether the Strengthening Families approach adds
value to evidence-based programs or dilutes the effects. Finally, the documentation
of protective factors will enable programs to determine if changes in the presence of
these protective factors moderates the relationship between risk factors and abuse.
Future Research
Although this study contributes to the reliability and validity of the PFS as a
tool to measure the presence of multiple protective factors in parents and caregivers,
more research is needed to establish the instrument in the prevention field. Several
areas of research would add to the protective factors knowledge base and the ability
of the PFS to capture changes as a result of services, especially those infused with
Strengthening Families.
The demographic variables, specifically frequency and duration of services,
and age of child, should be revised to explore possible mediating or moderating
relationships between them and the protective factors. Convergent validity needs to
be addressed by exploring relationships between the PFS and other measures of
individual protective factors (Table 2). Instruments should be carefully examined
and selected to mirror the essence of the protective factors as operationalized in the
PFS and reflect the literature review. For example, it is not the quantity nor the
quality of social support that is important in the prevention of maltreatment. It is the
perception of the availability that matters most. Thus, to assess convergent validity,

137
constructs in instruments would have to be similarly defined. Adding an observation
tool such as the HOME (Caldwell & Bradley, 1984) or NCFAS-G (Reed-Ashcraft, et
al., 2001) to future studies would also allow comparison of the PFS as a self-report
instrument with practitioner ratings. In the case of nurturing and attachment, an
observation tool could overcome the social desirability bias that may be present in the
nurturing and attachment items. Results could inform future revisions of those items.
Previous studies have documented the predictive validity of the PFS on risk
factors; however, the predictive validity of the PFS to reduce maltreatment has not
been explored. If the protective factors in the PFS reflect the research, then it is
hypothesized that families with high levels of protective factors are less likely to
abuse their children. This elusive question is the crux of prevention programs and
one that needs to be addressed. A predictive validity study is needed to determine
the relationship between PFS factor scores and confirmed cases of abuse and neglect.
The PFS has now been tested with home visitation and parent education
programs and has proven to be a valid and reliable tool with these populations. The
PFS is a psychometrically-sound instrument that could be used in experimental
designs to evaluate whether such prevention programs result in increases in protective
factors. A rigorous research design using evidence-based programs could evaluate
the sensitivity of the PFS to document change over time. Additionally, research
should explore “how much” Strengthening Families is enough to influence positive
parent outcomes and lead to a reduction in child maltreatment. Although
Strengthening Families makes strong intuitive sense and the individual protective

138
factors are supported in the research, the question ”Does Strengthening Families
have an additive or dilutive effect when paired with evidence-based programs?” must
be posed. To do this, Strengthening Families must be quantified. Parsons (2009)
identifies several domains of influence where the Strengthening Families framework
can be applied—policy, formal and informal organizational connections, professional
development for practitioners, programs and activities, and changes in families’ use
of protective factors. These domains operate on a continuum, and once a tipping
point or threshold is reached, non-linear, systemic changes begin to occur. To
capture these changes and document them statistically, several things must happen.
First and foremost, the amount of Strengthening Families within a program must be
articulated. Next, frequency and duration of services and fidelity of the evidence-
based program must be examined and documented. These items and others could be
included as covariates in Structural Equation Models to explore the effectiveness of
parent education programs to influence protective factors and ultimately reductions in
child maltreatment.
Finally, to address the changing demographics of service populations, it would
be beneficial to translate the PFS into other languages to tap protective factors in
other cultural-linguistic groups and determine what, if any, cultural-linguistic group
differences exist in these factors. The changing demographics of the United States
require that instruments are available in multiple languages.
In the present study, there was a significant need for a Spanish version, since
over 25% of the parent education participants were native Spanish speakers. Based

139
on this demand, the PFS was translated into Spanish by a native speaker, who was a
bi-lingual human service counselor working with parent education programs in
Nevada. The translation was vetted with bilingual program staff at 16 agencies in the
State. While the literature supports similar constructs in Latino populations (Coohey,
2001), no psychometric testing was conducted on the Spanish version used in the
Nevada sample. This lack of testing is problematic for several reasons. First, the
translation may not be accurate in capturing the essence of the protective factors.
Second, the factors may not function in the same way in Spanish as in English. If
this is the case, the results do not mean the same thing for English and Spanish
clients. The reliability and validity of a Spanish tool must be established. Future
studies should utilize structural equation modeling to conduct a two-group
longitudinal confirmatory factor analysis and structural regression of the English and
Spanish versions of the PFS. Such a study would compare the models of each
language version to determine if the factor structures have measurement equivalence.

140
References
Acock, A. (2005). Working with missing values. Journal of Marriage and Family,
67, 1012-1028.
Agresti, A. (2002). Categorical data analysis
Ainsworth, M. S., Blehar, M. C., Waters, E., & Wall, S. (1978). Patterns of
attachment: A psychological study of the strange situation. Hillsdale, NJ:
Erlbaum.
, 2nd Ed. Hoboken, NJ: Wiley-
Interscience.
Amadeo, K. (2009). What exactly is the U.S. economy? Retrieved March 1, 2010
from http://useconomy.about.com/od/grossdomesticproduct/p/GDP.htm
Ammerman, R. (1998). Methodological issues in child maltreatment research. In J.
Lutzker (Ed.), Handbook of child research and treatment. New York:
Plenum Press.
Anastasi, A. (1982). Psychological testing, 5th Ed., New York: Macmillan.
Anda, R., Dong, M., Brown, D., Felitti, V., Giles, W., Perry, G., Valerie, E., & Dube,
S. (2009). The relationship of adverse childhood experiences to a history of
premature death of family members. Retrieved December 28, 2009 from
http://www.biomedcentral.com/content/pdf/1471-2458-9-106.pdf
Anderson-Moore, K. & Vandivere, S. (2000). Stressful family lives: Child and
parent well-being. Washington, D.C.: Child Trends.
Armstrong M.I., Birnie-Lefcovitch S, Ungar M.T. (2005). Pathways between social

141
support, family well being, quality of parenting, and child resilience; What we
know. Journal of Child Family Studies, (14), 269–281.
Asawa, L., Hansen, D., & Flood, M. (2008). Early childhood intervention programs:
Opportunities and challenges for preventing child maltreatment. Education
and Treatment of Children, 31(1), 73-110.
Bagozzi, R. P. (1982). A field investigation of causal relationships among cognitions,
affect, intentions, and behaviour. Journal of Marketing Research. 19, 562- 584.
Bagozzi, R. P., and Fornell, C. (1982). Theoretical concepts, measurements and
meaning. In C. Fornell (Ed.), A Second Generation of Multivariate Analysis,
New York: Praeger.
Barerra, M., Sandler, I., & Ramsay, T. (1981). Preliminary development of a scale of
social support: Studies on college students. American Journal of Community
Psychology, 9, 435-441.
Barnette, J. J. (2000). Effects of stem and Likert response option reversals on internal
consistency: If you feel the need, there is a better alternative to using those
negatively worded stems. Educational and Psychological Measurement, 60,
361-370.
Beavers, W. R., & Hampson, R. B. (1990). Successful families: Assessment and
intervention. New York: Norton.
Belsky, J. (1980). Child maltreatment: An ecological model. American Psychologist,
35(4), 320-335.

142
Bentler, P. (1990). Comparative fit indexes in structural models. Psychological
Bulletin, 107(2), 238-246.
Bollen, K., & Lennox, R. (1991). Conventional wisdom on measurement: A structural
equation perspective. Psychological Bulletin, 110, 305-14.
Bronfenbrenner, U., & Crouter, A. C. (1983). The evolution of environmental models
in developmental research. In W. Kessen (Ed.), P. H. Mussen (Series Ed.),
Handbook of child psychology: Vol. 1. History, theory, and methods (pp. 357-
414). New York: Wiley.
Bronfenbrenner, U. (1986). Ecology of the family as a context for human
development: Research perspectives. Developmental Psychology, 22, 723-
742.
Brodowski, M.
Brown, T.A. (2006). Confirmatory factor analysis for applied research. New York:
The Guilford Press.
(personal communication, September 4, 2009).
Browne, M. & Cudeck, R. (1993). Alternative ways of assessing model fit.
Sociological Methods Research, 21, 230-258.
Budde, S. P. Schene. (2004). Informal social support interventions and their role in
violence prevention: An agenda for future evaluation. Journal of
Interpersonal Violence 19, 341–355.
Byrne, B. M. (1994). Testing for the factorial validity, replication, and invariance of a
Bureau of Economic Analysis, U.S. Department of Commerce. (2010). U.S. economy at a
glance. Retrieved March 1, 2010 from http://www.bea.gov/newsreleases/glance.htm

143
measurement instrument: A paradigmatic application based on the Maslach Burnout Inventory. Multivariate Behavioral Research, 29, 289–311.
Caldwell, B. M., & Bradley, R. H. (1984). Home observation for measurement of the
environment. Little Rock: University of Arkansas Press. Caldwell, R.A. (1992). The costs of child abuse versus child abuse prevention:
Michigan's experience. Retrieved October 23, 2009 from http://pilot.msu.edu/user/caldwel9/costs.html
Caldwell, R. & Noor, I. (2003).
return on investment. Retrieved March 13, 2010 from
Zero to Three secondary prevention FY-05 report
http://www.michigan.gov/documents/0-3_ROI_Report-WEB_158972_7.pdf
Cameron, G., 1990. The potential of informal social support strategies in child
welfare. In: Rothery, M.A. and Cameron, G., Editors, 1990. Child
maltreatment: Expanding our concept of helping, Lawrence Erlbaum,
Hillsdale, NJ, pp. 145–167.
Carver, C. S. (1997). You want to measure coping but your protocol’s too long:
Consider the Brief COPE. International Journal of Behavioral Medicine, 4,
92-100.
Centers for Disease Control and Prevention. (April, 2007). The social-ecological
model: A framework for prevention. Retrieved August 8, 2008 from
http://www.cdc.gov/ncipc/dvp/Social-Ecological-Model_DVP.htm
Centers for Disease Control and Prevention (2009). CDC injury research agenda.

144
Retrieved March 26, 2010 from
http://www.cdc.gov/injury/ResearchAgenda/CDC_Injury_Research_Agenda-
a.pdf
Center for the Study of Social Policy. (2004a). Protecting children by strengthening
families: A guidebook for early childhood programs. Washington, D.C:
Author.
Center for the Study of Social Policy. (2004b). Hallmarks of the Strengthening
Families Pilot States. Washington, D.C.: Author.
Center for the Study of Social Policy. (2009). National partner organizations.
Retrieved January 12, 2010 from
http://www.strengtheningfamilies.net/index.php/main_pages/partner_organiza
tions
Cepeda, N. (2008). Effect size calculator. [Computer software]. Retrieved January
7, 2010 from http://www.cognitiveflexibility.org/effectsize/
Cheung, G. W., & Rensvold, R. B. (1999). Testing factorial invariance across groups:
A reconceptualization and proposed new method. Journal of Management, 25,
1-27.
Cheung, G. W. and Rensvold, R.B. (2002) Evaluating goodness-of-fit indexes for
testing measurement invariance, Structural Equation Modeling: A
Multidisciplinary Journal, 9(2), 233-255.
Child Trends (2010). Research to improve children’s lives. Retrieved January 20,
2010, from http://www.childtrends.org/_catdisp_page.cfm?LID=124.

145
Child Welfare Information Gateway, Children’s Bureau. (2008). Strengthening
families. Retrieved October 5, 2009 from
http://www.childwelfare.gov/preventing/promoting/
Child Welfare Information Gateway, Children’s Bureau, FRIENDS National
Resource Center for Community-Based Child Abuse Prevention. (2009).
Strengthening families and communities: 2009 resource guide. Retrieved
June 22, 2009, from
http://www.childwelfare.gov/pubs/res_guide_2009/ch_one_protective.cfm.
Child Welfare League of America (n.d.). CWLA: Together making children and
families a national priority. Retrieved January 19, 2010 from
http://www.cwla.org/whowhat/default.htm.
Cochran, M. & Niego, S. (1995). Parenting and social networks. In M. Bornstein
(Ed.), Handbook of parenting (pp.393-418). Mahwah, NJ: Erlbaum.
Cohen, S., Kamarck, T., & Mermelstein, R. (1983). A global measure of perceived
stress. Journal of Health and Social Behavior, 24, 385-396.
Cohen, J. (1988). Statistical power analysis for the behavioral sciences (2nd ed.).
Hillsdale, NJ: Lawrence Earlbaum Associates.
Cole, M. & Cole, S.R. (1993). The development of children. New York: Scientific
American Books.
Collins, L. M., Schafer, J. L., & Kam, C. M. (2001). A comparison of inclusive and
restrictive strategies in modern missing data procedures. Psychological
Methods, (6), 330–351.

146
Coohey, C. (1996). Child maltreatment: Testing the social isolation hypothesis.
Child Abuse and Neglect, 20, 241-254.
Coohey, C. (2001). The relationship between familism and child maltreatment in
Latino and Anglo families. Child Maltreatment, 6, 130-142.
Corse, S. J., Schmid, K., & Trickett, P. K. (1990). Social network characteristics of
mothers in abusing and nonabusing families and their relationships to
parenting beliefs. Journal of Community Psychology, 18, 44-59.
Counts, J., Buffington, E., Chang-Rios, K.L., & Rasmussen, H. N. (2007). Protective
factors survey, pilot phase. Lawrence, KS: Institute for Educational Research
and Public Service, University of Kansas, School of Education.
Counts, J., Buffington, E., Chang-Rios, K., Rasmussen, H., & Preacher, K. (in press).
The development and validation of the protective factors survey: A self-
report measure of protective factors against child maltreatment.
Counts, J., Buffington, E., Chang-Rios, K.L., Preacher, K., & Rasmussen, H. (2008a).
The development and validation of the protective factors survey: A self-report
measure of protective factors against child maltreatment, phase III report.
Lawrence, KS: Institute for Educational Research and Public Service,
University of Kansas, School of Education.
Counts, J., Buffington, E., Chang-Rios, K.L., & Rasmussen, H. N. (2008b).
Protective factors survey, phase IV. Lawrence, KS: Institute for Educational
Research and Public Service, University of Kansas, School of Education.

147
Crittenden, P. M. (1988). Relationships at risk. In J. Belsky & T. Nezworski (Eds.),
Clinical implications of attachment (pp. 136-174). Hillsdale, NJ: Erlbaum.
Crockenberg, S. (1981). Infant irritability, mother responsiveness, and social support
influences on the security of infant-mother attachment. Child Development,
52(3), 857-865.
Cronbach L J. (1951). Coefficient Alpha and the internal structure of tests.
Psychometrika 16:297-334.
Cohen, J. (1992). A power primer. Psychological Bulletin,
112(1), 155-159.
Crowne, D. P., & Marlowe, D. (1960). A new scale of social desirability independent
of psychopathology. Journal of Consulting Psychology, 24, 349-354.
Dahlberg, L. & Krug, E. (2002). Violence—a global public health problem. In:
Krug, E.G., Dahlberg, L.L., Mercy, J.A., Zwi, A.B., Lozano, R, (Eds.) World
report on violence and health (pp. 1-56). Geneva, Switzerland: World Health
Organization.
Daro, D., Barringer, E., & English, B. (2009). Key trends in prevention: Report for
the Quality Improvement Center on Early Childhood, Quality Improvement
Center on Early Childhood. Retrieved February 1, 2010 from http://www.qic-
ec.org/images/uploads/Daro,_Key_Trends_in_Prevention.pdf
DePanfilis, D. (1996). Social isolation of neglectful families: a review of social
support assessment and intervention models. Child Maltreatment, 1(37), 37-
52.

148
Department of Health and Human Services (DHHS) (US), Administration on
Children, Youth, and Families (ACF). (2003). The child abuse and prevention
and treatment act. Washington, D.C.: Government Printing Office.
DeWolff, M. S., & Van Ijzendoorn, M. H. (1997). Sensitivity and attachment: A
meta-analysis on parental antecedents of infant-attachment. Child
Development, 66, 1100–1106.
Dixon. L., Browne. K., & Hampilton-Giachritsis, C. (2009). Patterns of risk and
protective factors in the intergenerational cycle of maltreatment. Journal of
Family Violence, 24(2), 111-122.
Dunst, C. Trivette, C., & Cross, A. (1986). Mediating influences of social support:
Personal, family and child outcomes. American Journal of Mental Deficiency,
91,403-417.
Dunst, C. J., Trivette, C., & Deal, A. (1988). Enabling and empowering families:
Principles & guidelines for practice. Cambridge: Brookline Books.
Dunst, C. (2000). Revisiting 'rethinking early intervention'. Topics in Early
Childhood Special Education, 20(2), 95.
Egeland, B., Bosquet, M., & Chung, A. L. (2002). Continuities and discontinuities in
the intergenerational transmission of child maltreatment: Implications for
breaking the cycle of abuse. In K. Browne, H. Hanks, P. Stratton, & C.
Hamilton (Eds.), Early prediction and prevention of child abuse: A handbook
(pp. 217-232). West Sussex, England: John Wiley & Sons.
Enders, C.K. (2001). The impact of nonnormality on full information maximum-

149
likelihood estimation for structural equation models with missing data.
Psychological methods, 6(4), 352-370.
Enders, C.K.& Bandalos, D. (2001). The relative performance of full information
maximum likelihood estimation for missing data in structural equation
models. Structural Equation Modeling, 8(3), 430–457.
Enders, C. K. (2006). Analyzing structural equation models with missing data. In G.
R.Hancock & R. O. Mueller (Eds.), Structural equation modeling: A second
course (pp. 313-342). Greenwich, CT: Information Age Publishing.
Family Support America. (2007) Family Support America. Retrieved January 20,
2010 from
http://www.familysupportamerica.org/content/aboutus_dir/staff.htm
Felitti, V., Anda, R., Nordenberg, D., Williamson, D., Spitz, A., Edwards, V., Koss,
M., & James, S., (1998). Relationship of childhood abuse and household
dysfunction to many of the leading causes of deaths in adults. American
Journal of Preventive Medicine, 14:4, pp. 245-258.
Flora, D. B., & Curran, P. J. (2004). An empirical evaluation of alternative methods
of estimation for confirmatory factor analysis with ordinal data. Psychological
Methods, 9, 466-491.
Fraser, M. W., Richman, J. M., & Galinsky, M. J. (1999). Risk, protection, and
resilience: Toward a conceptual framework for social work practice. Social
Work Research, 22(3), 131-143.

150
Free to Grow. (2007). Free to Grow: Head Start partnerships to promote
substance-free communities. Retrieved January 20, 2010 from
http://www.freetogrow.org/.
FRIENDS National Resource Center for Community Based Child Abuse Prevention,
(n.d.) Retrieved February 27, 2007 from http://www.friendsnrc.org/.
FRIENDS National Resource Center for Community-Based Child Abuse Prevention.
(2008). Compendium of annotated measurement tools. Retrieved October 1,
2008 from http://www.friendsnrc.org/outcome/toolkit/annot.htm
FRIENDS National Resource Center for Community-Based Child Abuse Prevention.
(2008). Outcomes accountability—PFS database. Retrieved February 10,
2010 from http://www.friendsnrc.org/outcome/pfs.htm
Gaudin, J.M., Polansky, N.A., Kilpatrick, A.C. and Shilton, P. (1996). Family
functioning in neglectful families. Child Abuse & Neglect 20,
Geeraert, L., Noortgate, W., Grietens, H., & Onghena, P. (2004). The effects of early
363–377.
prevention programs for families with young children at risk for physical child
abuse and neglect: A meta-analysis. Child Maltreatment, 9, 277-291.
George, C., & Main, M. (1979). Social interactions of young abused children:
Approach, avoidance, and aggression. Child Development, 50, 306-318.
Gilligan, R. (2004). Promoting resilience in child and family social work: Issues for
social work practice, education, and policy. Social Work Education, 23(1),
93-104.
Gorsuch, R. L. (1983). Factor analysis, 2nd Ed., Hillsdale, NJ: Erlbaum.

151
Gottlieb, B. (1985). Theory into practice: Issues that surface in planning
interventions that mobile support. In I.G. Sarason & B.R. Sarason (Eds.),
Social support: Theory, research and applications. (pp. 417-437).
Dordrecht, Holland: Martines Niffhof.
Graham, J.W., Olchowski, A.E., & Gilreath, T.D. (2007). How many imputations
are really needed? Some practical clarifications of multiple imputation
theory. Prevention Science, 8, 206-213.
Grazio, T. (1981). New perspectives on child abuse/neglect community education.
Child Welfare, LX(5), 343-353.
Hair, J.F., Jr., Anderson, R. E., Tatham, R. L., & Black, W. C. (1998). Multivariate
data analysis with readings, 5th Ed., Englewood Cliffs, NJ: Prentice-Hall.
Hays, R. D., Sherbourne, C. D., & Mazel, R. M. (1993). The RAND 36-Item Health
Survey 1.0. Health Economics, 2, 217-227.
Hetherington, E. M., & Blechman, E. A. (Eds.). (1996). Stress, coping, and resiliency
in children and families. Hillsdale, NJ: Lawrence Erlbaum Associates, Inc.
Higgins, G.O. (1994). Resilient adults: Overcoming a cruel past. San Francisco:
Jossey-Bass.
Hill, M. (2002). Network assessment and diagrams—a flexible friend for social
work practice and education, Journal of Social Work, 2(2), 233-254.
Horn, J.L. & McArdle, J.J. (1992). A practical guide to measurement invariance in
aging research. Experimental Aging Research, 18 (3), 117‑144.
H.R. 14--108th Congress: Keeping Children and Families Safe Act of 2003.

152
(2003). n GovTrack.us (database of federal legislation). Retrieved March 13,
2010, from http://www.govtrack.us/congress/bill.xpd?bill=h108-14
Hu, L., & Bentler, M. (1998). Fit indices in covariance structure modeling:
sensitivity to underparameterized model misspecification. Psychological
Methods, 3, 424 – 453.
Jack, G. (2000). Ecological influences on parenting and child development. British
Journal of Social Work, 30, 703-720.
Jackson, A. Brooks-Gunn, J, Chien-Chung, H., & Glassman, M. (2000). Single
mothers in low-wage jobs: Financial strain, parenting, and preschoolers'
outcomes. Child Development, 71(5), 1409-1423.
Jackson, P.,Wall, T., Martin, R., & Davids, K. (1993). New measures of job control,
cognitive demand, and production responsibility. Journal of Applied Psychology, 78, 753–762.
Kaminski, J.W., Valle, L.A., Filene, J.H., & Boyle, C.L. (2008). A meta-analytic
review of components associated with parent training program effectiveness.
Journal of Abnormal Child Psychology, 36(4), 567-589.
Kelley K., Maxwell S.E., Rausch J.R. (2003). Obtaining power or obtaining
precision: Delineating methods of sample-size planning. Evaluation of Health Professionals. 26(3), 258–87.
Kempe, H. (1962). The battered child syndrome. The Journal of the American
Medical Association, 181, 17-24.
Kirkpatrick, K. (2004). Reframing child abuse & neglect for increased

153
understanding & engagement: Defining the need for strategic reframing
[White paper]. Retrieved March 22, 2010 from
http://www.preventchildabuse.org/about_us/reframing/downloads/reframing%
20revised.pdf
Klevens, J., & Whitaker, D. (2007). Primary prevention of child physical abuse and
neglect: Gaps and promising directions. Child Maltreatment, 12, 364-377.
Kline, R. (1998). Principles and practice of structural equation modeling. New
York: The Guilford Press.
Knapp, M.S. (1995). How shall we study comprehensive, collaborative services for
children and families? Educational Research, 24(4), 5-16.
Korbin, J. E., Coulton, C. J., Chard, S., Platt-Houston, C., & Su, M. (1998).
Impoverishment and child maltreatment in African American and European
American neighborhoods. Development and Psychopathology, 10(2), 215-
233.
Langford, J. & Harper-Browne, C. (in press). Strengthening families through early
care and education: Engaging families in familiar places to prevent child
maltreatment.
Lee, J. (2009). Type I error and power of the mean and covariance structure
confirmatory factor analysis for differential item functioning detection:
methodological issues and resolutions. (Doctoral dissertation, University of
Kansas, 2009). UMI Microform 3354604.
Levitt, M. I, Weber, R. A., & Clark, M. C. (1986). Social network relationships as

154
sources of maternal support and well-being. Developmental Psychology, 22,
310-316.
Little, T., & Card, N. (2009, June). Structural Equation Modeling: Foundations &
Extended Applications. Presentation at the 7th
Lundahl, B., Nimer, J., & Parsons, B. (2006). Preventing child abuse: A meta-
Annual Summer Institutes on
Advance Quantitative Analyses, University of Kansas, Lawrence, KS.
analysis of parenting training programs. Research on Social Work Practice,
16, 251-262.
MacLeod, J., & Nelson, G. (2000). Programs for the promotion of family wellness
and the prevention of child maltreatment: A meta-analytic review. Child
Abuse & Neglect, 24, 1127-1149.
MacCullum, Browne, M. & Sugawara, H. (1996). Power analysis and determination
of sample size for covariance structure modeling. Psychological Methods,
1(2), 130-149.
MacPhee, D., Fritz, J., & Miller-Heyl, J. (1996). Ethnic variations in personal social
networks and parenting. Child Development, 67, 3278-3795.
Marsh, H.W. (1993). The multidimensional structure of academic self-concept:
Invariance over Gender and age. American Educational Research Journal, 30, 841–860.
Marsh, H. W., & Hocevar, D. (1985) The application of confirmatory factor analysis
to the study of self-concept: First- and higher-order factor models and their
invariance across groups. Psychological Bulletin, 97, 562-582.

155
Maternal and Child Health Bureau. (2008). The early childhood comprehensive
systems initiative. Retrieved October 28, 2008 from http://www.state-
eccs.org/
McCroskey, J., Sladen, S., & Meezan, W. (1997). Family Assessment Form: A
practice based approach to assessing family functioning. Washington DC:
CWLA Press.
McCubbin, H. I., McCubbin, M. A., Patterson, J. M., Cauble, A. E., Wilson, L. R., &
Warwick, W. (1983). CHIP-Coping Health Inventory for Parents: An
assessment of parental coping patterns in the care of the chronically ill child.
Journal of Marriage and Family, 45(2), 359-370.
McLoyd, V. C. (1995). Poverty, parenting and policy: Meeting the support needs of
poor parents. In H. Fitzgerald, B. Lester, & B. Zuckerman (Eds.), Children of
poverty: Research, health, and policy issues (pp. 269-303). New York:
Garland Press.
McLoyd, V. C. (1998). Socioeconomic disadvantage and child development.
American Psychologist, 53, 185-204.
Meyers, S., Varkey, S., & Aguirre, A, M. (2002). Ecological correlates of family
functioning. The American Journal of Family Therapy, 30(3), 257-273.
Moos, R., & Moos, B. (1983). Clinical applications of the family environment scale.
In E. Filsinger (Ed.), A sourcebook of marriage and family assessment (pp.
253-273). Beverly Hills, CA: Sage.
Moncher, F.J. (1995). Social isolation and child-abuse risk. Families in Society, 76,

156
421-433.
Morton, N., & Browne, K. (1998). Theory and observation of attachment and its
relation to child maltreatment: A review. Child Abuse & Neglect, 22, 1093-
1104.
Mueller, R. (1996). Basic principles of structural equation modeling: An
Introduction to LISREL and EQS. New York: Springer.
Muthén, L. K., & Muthén, B. O. (1998-2007). Mplus user's guide, 4th Ed., Los
Angeles, CA: Muthén & Muthén.
Muthén, B. and Asparouhov, T. (2002). Latent variable analysis with categorical
outcomes: Multiple-group and growth modeling in Mplus. Mplus Web Notes:
No. 4. www.statmodel.com.
Muthén, L. K., & Muthén, B. O. (2006). Mplus Version 4 user's guide. Los Angeles:
Author.
National Alliance of Children’s Trust & Prevention Funds. (2009). National
Alliance of Children’s Trust Funds. Retrieved January 20, 2010 from
https://www.msu.edu/user/nactpf/about.htm.
National Association of Education for Young Children. (n.d.) NAEYC. Retrieved
January 20, 2010 from http://www.naeyc.org/.
National Association of Child Care Resource and Referral Agencies. (2009).
NACCRRA, Our nations leading voice for child care. Retrieved January 20,
2010 from http://www.naccrra.org/about/
National Child Abuse and Neglect Data System (NCANDS). (2008). Summary child

157
maltreatment 2007. Retrieved September March 30, 2009 from
http://www.acf.hhs.gov/programs/cb/pubs/cm07/chapter1.htm
National Child Care Association. (n.d.) National child care association, about us.
Retrieved January 20, 2010 from
http://www.nccanet.org/displaycommon.cfm?an=1&subarticlenbr=7.
National Research Council: Panel on Research on Child Abuse and Neglect. (1993).
Understanding child abuse and neglect. Washington DC: National Academy
Press.
National Study on Child Abuse and Neglect Reporting. (1977). Annual statistical
analysis of child neglect and abuse reporting. Englewood, CO: American
Humane Association, 3.
Nevada Department of Health and Human Services. (2009). FFY09 Nevada
community-based child abuse and neglect prevention grant application (Grant
Application).
North Carolina Institute of Medicine. (2005). New directions for North Carolina: A
report of the NC institute of medicine task force on child abuse prevention.
September 2005.
Olds, D. L., Robinson, J., O’Brien, R., Luckey, D.W., Pettitt, L. M., Henderson, C.
R., Jr., Ng, R. K., Sheff, K. L., Korfmacher, J., Hiatt, S., & Talmi, A. (2002).
Home visiting by paraprofessionals and by nurses: A randomized, controlled
trial. Pediatrics, 110, 486–496.

158
Olson, D. H., & Gorall, D. M., Tiesel, J.W. (2004). FACES IV & the circumplex
model. Retrieved September 14, 2008, from
http://www.facesiv.com/pdf/3.innovations.pdf
Ondersma, S. J., Chaffin, M., Simpson, S., & LeBreton, J. (2005). The brief child
abuse potential inventory: Development and validation. Journal of Clinical
Child and Adolescent Psychology, 34, 301-311.
Oynskiw, J.E., Harrison, M.J. Spady, D., and McConnan, L. (1999). Formative
evaluation of a collaborative community-based child abuse prevention project.
Child Abuse & Neglect, 23:11, 1069-1081.
Parent-Child Relationship Inventory. (1998). In The thirteenth mental measurements
yearbook
Parker, F. L., Piotrowski, C. S., & Peay, L. (1987). Head Start as a social support for
mothers: The psychological benefits of involvement. American Journal of
Orthopsychiatry, 57, 220-233.
. Retrieved September 24, 2008 from EBSCO Host Mental
Measurements Yearbook database.
Parsons, B. (2009). Evaluating patterns of change in complex systems:
Strengthening families example. Retrieved January 2, 2010 from
http://www.insites.org/publications_resources/pub_InSites.09.SFexample.pdf
Pentz, M.A. & Chou, C.P. (1994). Measurement invariance in longitudinal clinical
research assuming change from development and intervention. Journal of
Consulting and Clinical Psychology, 62(3), 450-462.

159
Pratt, T. (2009, June 26). Child abuse escalates with money woes. Las Vegas Sun.
Retrieved July 1, 2009 from
http://www.lasvegassun.com/news/2009/jun/26/child-abuse-escalates-money-
woes/
Preacher, K. J., & Coffman, D. L. (2006, May). Computing power and minimum
sample size for RMSEA [Computer software]. Retrieved June 8, 2009 from
http://www.quantpsy.org/
Prevent Child Abuse America, (2009). Prevent child abuse America brochure.
Retrieved January 9, 2010 from
http://www.preventchildabuse.org/about_us/downloads/PCA_America_o9_br
ochure.pdf
Raykov, T. & Marcoulides, G. (2000). A first course in structural equation
modeling. Mahwah, NJ: Lawrence Erlbaum Associates.
Reed-Ashcraft, K., Kirk, R. S., & Fraser, M. W. (2001). The reliability and validity of
the North Carolina Family Assessment Scale. Research on Social Work
Practice, 11 (4), 503-520.
Repucci, N., Britner, P., & Woolard J. (Eds.). (1997). Preventing child abuse and
neglect through parent education. Baltimore, MD: Paul Brookes Publishing.
Ross, T. & Vandivere, S. (2009). Indicators for child maltreatment prevention
programs. Child Trends. Retrieved January 20, 2010, from
http://www.childtrends.org/_catdisp_page.cfm?LID=124.

160
Runyan, D., Wattam, C., Ikeda, D., Hassan, F., Ramiro, L. (2002). Child abuse and
neglect by parents and caregivers. In Krug, E., Dahlberg, L, Mercy J., Swi,
A., Switzerland, World Health Organization, pp. 59-86.
Rutter, M. (1987). Psychosocial resilience and protective mechanisms. American
Journal of Orthopsychiatry, 57: 316–331.
Rzepnicki, T. L. (1991). Enhancing the durability of intervention gains: A challenge
for the 1990s. Social Service Review, 65(1), 92-111.
Satorra, A. (2000). Scaled and adjusted restricted tests in multisample analysis of
moment structures. In D.D.H. Heijmans, D.S.G. Pollock, & A. Satorra
(Eds.),Innovations in multivariate statistical analysis: A Festschrift for Heinz
Neudecker (pp. 233–247). Dordrecht, The Netherlands: Kluwer Academic
Publishers.
Schafer, J. L., & Graham, J. W. (2002). Missing data: Our view of the state of the art.
Psychological Methods, 7,147-177.
Scheier, M. F., Carver, C. S., & Bridges, M. W. (1994). Distinguishing optimism
from neuroticism (and trait anxiety, self mastery, and self-esteem): A
reevaluation of the life orientation test. Journal of Personality and Social
Psychology, 67, 1063-1078.
Schumacker, R. & Lomax, R. (2004). A beginner’s guide to structural equation
modeling. Mahwah, NJ: Lawrence Erlbaum Associates.
Schriesheim, C. A., Eisenbach, R. J.,&Hill, K. D. (1991). The effect of negation and

161
polar opposite item reversals on questionnaire reliability and validity: An
experimental investigation. Educational and Psychological Measurement, 51,
67-78.
Sedlak, A.J. & Broadhurst, D.D. (1996). The third national incidence study of child
abuse and neglect, NIS-3, Washington, D.C.: US Department of Health and
Human Services.
Sedlak, A., Gragg, F., Mettenburg, J., Ciarico, L., Winglee, M., Shapiro, G., Hartge,
J., Li, S., Greene, A., McPherson, K. (2008). The fourth national incidence
study of child abuse and neglect (NIS–4): Design and Methods Summary.
Retrieved December 28, 2009 from
https://www.nis4.org/DOCS/Nis4Design_Method_Summary.pdf
Sedlak, A., Mettenburg, J., Basena, M. Petta, I., McPherson, K. Green, A., and Li, S.
(2010). The fourth national incidence study of child abuse and neglect (NIS–
4): Report to Congress, executive Summary. Washington, DC: U.S.
Department of Health and Human Services, Administration for Children and
Families.
Shadish, W., Cook, T., & Campbell, D. (2002). Experimental and quasi-
experimental designs. Boston, MA: Houghton Mifflin Company.
Shonkoff, J. P., & Phillips, D. A. (Eds.). (2004). From neurons to neighborhoods:
The science of early childhood development. Washington, D.C.: National
Academy Press.

162
Spitzer, R. L., Kroenke, K., & Williams, J. B. (1999). Validation and utility of a self-
report version of PRIME-MD: The PHQ primary care study. The Journal of
the American Medical Association, 282(18), 1737-1756.
Sidebotham, P. (2001). An ecological approach to child abuse: A creative use of
scientific models in research and practice. Child Abuse Review, 10, 97-112.
SPSS Inc. (2009). SPSS base 17.0 for windows user's guide. Chicago: SPSS Inc.
Strengthening Families. (2008). National partner organizations. Retrieved January
26, 2010 from
http://www.strengtheningfamilies.net/index.php/main_pages/partner_organiza
tions
Strengthening Families Illinois. (2007). Love is not enough to keep your family
strong. Retrieved January 29, 2010 from
http://www.strengtheningfamiliesillinois.org/
Steiger, J. H. (1990). Structural model evaluation and modification: An interval
estimation approach. Multivariate Behavioral Research, 25, 173-180.
Thoit, P. (1982). Conceptual, methodological, and theoretical problems in studying
social support as a buffer against life stress. Journal of Health & Social
Behavior, 23, 145-159.
Thomas, R., & Zimmer-Gembeck, M. (2007). Behavioral outcomes of parent-child
interaction therapy and Triple P-Positive Parenting Program: A review and
meta-analysis. Journal Abnormal Child Psychology, 35, 475-495.
Thompson, E. R. (2007). Development and validation of an internationally reliable

163
short-form of the positive and negative affect schedule (PANAS). Journal of
Cross-Cultural Psychology, 38, 227-242.
Toban, N. & Lutzker, J. (2001). Consumer evaluation of an ecobehavioral program
for prevention and intervention of child maltreatment. Journal of Family
Violence, 16:3, 323-330.
Tomison, A. (2000). Evaluating child abuse prevention programs. The National
Child Protection Clearinghouse, 12, pp. 1-18.
Trochim, W. (2006). Research methods knowledge base. Retrieved June 26, 2009,
from http://www.socialresearchmethods.net/kb/constval.php
Tugade, M. & Fredrickson, B. (2004). Resilient individuals use positive emotions to
bounce back from negative emotional experiences. Journal of Personality
and Social Psychology, 86(2), 320-333.
U.S. Census Bureau. (2008) Statistical abstract of the United States, 127th Edition.,
Retrieved January 25, 2010 from http://www.census.gov/statab/www/
U.S. Bureau of Labor Statistics. (2009). Bureau of labor statistics economy at a
glance—Nevada. Retrieved February 23, 2010 from http://www.stat-
usa.gov.www2.lib.ku.edu:2048/online.nsf/vwNoteIDLookup/NT00A0CC02/$
File/ECONOMY_NV.HTM?OpenElement
U.S. Congress, Senate Committee on Labor and Public Welfare, Subcommittee on
Children and Youth, 93rd Congress. (1973). Child abuse prevention and
treatment act, 1973, S. 1191, Parts 1 and 2. Washington, D.C.: U.S.
Government Printing Office.

164
U.S. Office of Management and Budget, (n.d.) Retried February 27, 2007 from
http://www.whitehouse.gov/omb/expectmore/index.html.
Voight, J., Hans, S., & Bernstein, V. (1996). Support networks of adolescent mothers:
Effects of parenting experience and behavior. Infant Mental Health Journal,
17, 58–73.
Viral Marketing. (2010, February 15). In Wikipedia, The Free Encyclopedia.
Retrieved 14:31, February 23, 2010, from
http://en.wikipedia.org/w/index.php?title=Viral_marketing&oldid=344139752
Wang, C. & Holton, J. (2007). Total estimated cost of child abuse and neglect in the
United States. Chicago, IL: Prevent Child Abuse America.
Walsh, F. (2002). A family resilience framework: Innovative practice applications.
Family Relations, 51(2) 130-137.
Weinbach, R., & Grinnell, R. (2001). Statistics for social workers. MA: Allyn &
Bacon.
West, S. G., Finch, J. F., & Curran, P. J. (1995). Structural equation models with
nonnormal variables: Problems and remedies. In R. H. Hoyle (Ed.), Structural
equation modeling: Concepts, issues, and applications. (pp. 56-75). Thousand
Oaks, CA: Sage.

Appendices
165

Appendix A
Participant organizations in development of the Strengthening Families Protective Factors
Organization and Description
Community Based Child Abuse and Neglect Prevention Programs (CBCAP) is a federally
funded program to prevent child maltreatment. The purpose of CBCAP is two-fold: 1) support
community-based efforts to develop, operate, expand, enhance, and support networks that
coordinate resources to strengthen and support families and reduce the likelihood of child abuse
and neglect, and 2) foster an understanding, appreciation, and knowledge of diverse populations
to prevent maltreatment (National Resource Center for Community Based Child Abuse
Prevention, 2007).
Child Trends: Child Trends is a nonprofit, nonpartisan research center that studies children at all
stages of development. The center’s mission is to improve outcomes for children by providing
research, data, and analysis to the people and institutions whose decisions and actions affect
children, including program providers, the policy community, researchers and educators, and the
The
media (Child Trends, 2010).
Child Welfare League of America (CWLA) is the nation’s oldest member-based child
welfare whose mission is to lead the country in building public will to ensure safety,
permanence, and well-being of children, youth, and their families by advancing public policy,
defining and promoting practice excellence and delivering superior membership services (.Child
Welfare League of America, n.d.)
Family Support America is a national organization that provides information and support to
families on child maltreatment prevention, substance abuse, disciplining children, and divorce
(Family Support America, 2007).
166

Free to Grow
The
was a national demonstration program of Head Start programs to explore
innovative approaches to reduce two public health problems—substance abuse and child
maltreatment. The organization identifies promising ideas and practices in the field of
maltreatment prevention and brings together community partners to use community-specific
integrated approaches to strengthen families and the community. The organization closed in
April, 2007 (Free to Grow, 2007).
National Alliance of Children’s Trust Funds
The
is a membership organization of Children’s
Trust and Prevention Funds and provides training, technical assistance, and peer consulting
opportunities to its members to prevent child abuse. The organization supports CBCAP states to
promote community-based strategies to prevent maltreatment and strengthen families (National
Alliance of Children’s Trust Funds, 2008).
National Association of Education for Young Children (NAEYC)
The
is dedicated to the well-
being of all young children and focuses on quality education and developmental services for
children from ages birth to eight (National Alliance of Education for Young Children, n.d.)
National Association of Child Care Resource and Referral Agencies
The
(NACCRRA) is an
organization to provide voice for child care providers nationally and works with over 700 child
care resources and referral agencies across the nation. The association leads projects that
increase quality and availability, conduct research, and advocate for child care policies to ensure
that families have access to high-quality, affordable child care National Association of Child
Care Resource and Referral Agencies, 2010).
National Child Care Association provides a voice for private, licensed child care and early
education providers across the nation. The Association represents the needs and specific
interests of private providers. (The National Child Care Association, n.d.).
167

Prevent Child Abuse America is a national organization with 41 state chapters that focuses on
reframing prevention, engaging communities, and promoting public policies to prevent child
maltreatment. The organization promotes healthy child development as a building block for
community and economic development.
USA Child Care: USA Child Care was a national association of child care centers (now
defunct). Mission statement: USA Child Care is an organization for child care providers who
believe that all children deserve high quality care. Our mission is to bring the voice of direct
services providers to national and state policy dialogue.
Zero to Three is a national non-profit organization headquartered in Washington, DC with a
mission to promote the health and development of infants and toddlers. This is accomplished by
translating research and knowledge – specifically information about the kinds of early
experiences that help children thrive – into a range of practical tools and resources for use by the
adults who influence the lives of young children.
168

Appendix B
Protective Factors Survey User Manual
169

The Protective Factors Survey
User Manual
FRIENDS National Resource Center for Community Based Child Abuse Prevention A Service of the Children’s Bureau
FRIENDS National Resource Center for Community-Based Child Abuse Prevention • Chapel Hill Training Outreach Project, Inc. • 800 Eastowne Drive • Suite 105 • Chapel Hill, NC 27514
• (919) 490-5577 • (919) 490-4905 (fax) • www.friendsnrc.org
1
170

The Protective Factors Survey
A guide to administering the Protective Factors Survey
March 2008
Prepared by the Institute for Educational Research and Public
Service at the University of Kansas
This product was prepared by the Institute for Educational Research and Public Service at the University of Kansas under a subcontract with the FRIENDS National Resource Center. FRIENDS is funded by the U.S. Department of Health and Human Services, Administration for Children, Youth and Families, Office of Child Abuse and Neglect, under discretionary Grant 90CA1729. The contents of this publication do not necessarily reflect the views or policies of the funders, nor does mention of trade names, commercial products or organizations imply endorsement by the U.S. Department of Health and Human Services. This information is in the public domain. Readers are encouraged to copy portions of the text that are not the property of copyright holders and share them, but please credit the FRIENDS National Resource Center.
2
171

3
Authorization for Use This product was prepared by the Institute for Educational Research and Public Service at the University of Kansas under a subcontract with the FRIENDS National Resource Center. FRIENDS is funded by the U.S. Department of Health and Human Services, Administration for Children, Youth and Families, Office on Child Abuse and Neglect, under discretionary Grant 90CA1729. The contents of this publication do not necessarily reflect the views or policies of the funders, nor does mention of trade names, commercial products or organizations imply endorsement by the U.S. Department of Health and Human Services. This information is in the public domain. Readers are encouraged to copy portions of the text that are not the property of copyright holders and share them, but please credit the FRIENDS National Resource Center.
172

4
Introduction
Though there are numerous instruments designed to measure individual protective factors, there is not currently a single instrument that assesses multiple protective factors against child abuse and neglect. In 2004, The FRIENDS National Resource Center for Community-Based Child Abuse Prevention began a project to develop a Protective Factors Survey (PFS) for its network of federally-funded Community Based Child Abuse Prevention (CBCAP) programs. This project was initiated to help programs better assess changes in family protective factors, a major focus of prevention work. The PFS is a product of the FRIENDS Network in collaboration with the University of Kansas Institute for Educational Research and Public Service. The instrument was developed with the advice and assistance of researchers, administrators, workers, and experts specializing in family support and maltreatment and psychological measurement. The survey has undergone three national field tests.
Purpose and Use The PFS is designed for use with caregivers receiving child abuse prevention services. The instrument measures protective factors in five areas: family functioning/resiliency, social emotional support, concrete support, nurturing and attachment, and knowledge of parenting/child development. Workers can administer the survey before, during, or after services. The primary purpose of the Protective Factors Survey is to provide feedback to agencies for continuous improvement and evaluation purposes. The survey results are designed to provide agencies with the following information: • A snapshot of the families they serve • Changes in protective factors • Areas where workers can focus on increasing individual family
protective factors The PFS is not intended for individual assessment, placement, or diagnostic purposes. Agencies should rely on other instruments for clinical use.
173

Description The Protective Factors Survey is a pencil and paper survey. The instrument is divided into two sections, the first section to be completed by a staff member and the second section to be completed by a program participant. Protective Factors Survey – For Staff Use Only Form The purpose of the Protective Factors Survey – For Staff Use Only Form is to gather demographic information about the participant. Program staff who are knowledgeable about the participant are asked to complete this section. The Staff Form contains two sets of questions: 1) participant’s survey experience, including the administration date, supports provided, and language version used, and 2) program dosage, specifically participant’s length of involvement and types of services received.
Protective Factors Survey The Protective Factors Survey contains the core questions of the survey. This part is designed for program participants who have received or are currently receiving prevention services. In the demographic section, participants are asked to provide details about their family composition, income, and involvement in services. In the family protective factors section, participants are asked to respond to a series of statements about their family, using a seven-point frequency or agreement scale. The following table provides a brief summary of the multiple protective factors covered in the survey. Protective Factors Covered in the PFS
5
Protective Factor Definition
Family Functioning/
Resiliency Having adaptive skills and strategies to persevere in times of crisis. Family’s ability to openly share positive and negative experiences and mobilize to accept, solve, and manage problems.
Social Emotional Support Perceived informal support (from family, friends, and neighbors) that helps provide for emotional needs.
Concrete Support Perceived access to tangible goods and services to help families cope with stress, particularly in times of crisis or intensified need.
Child Development/
Knowledge of Parenting Understanding and utilizing effective child management techniques and having age-appropriate expectations for children’s abilities.
Nurturing and Attachment The emotional tie along with a pattern of positive interaction between the parent and child that develops over time.
174

6
Section I
Instructions for Staff
Preparing the Survey Administering the Survey
175

7
Preparing the Survey
The PFS survey kit contains all the materials that staff will need to prepare the surveys. Although materials can be shared among staff, it is highly recommended that one person be responsible for preparing the survey materials for the agency. Agencies should prepare the surveys several days prior to survey administration, following the steps listed below: 1. Prepare the Informed Consent Statement. Staff will need to
create an Informed Consent Statement to fit the consent requirements of their organization. Each agency probably has a protocol or statement for collecting data. Agencies should only use the statement approved by their agency or IRB. If agencies do not have an informed consent statement, an example is included in the survey kit (see Section IV). Agencies can modify this one or write their own.
2. Create survey packets. Using the master CD located in the survey kit, staff should make one copy of the survey materials for each program participant. Copies of the Informed Consent Statement should also be made. Staff should staple the survey materials together and double-check the page numbers to make sure survey questions are presented in the order as they appear on the electronic copy given to each agency.
3. Put participant ID number on surveys. A participant ID number is required to process the survey data. Agencies should use existing case/client ID numbers. This number will allow staff to administer the second round of surveys to the same participants. There are two places that the participant ID needs to be provided (on the cover sheet of the Protective Factors Survey – For Staff Use Only Form and on the first page of the Protective Factors Survey).
Administering the Survey
The survey will take approximately 10-15 minutes to complete. The survey should be administered in a comfortable setting at a time when participants are not easily distracted and can concentrate on the items. Staff are welcome to provide refreshments to participants as long as access to refreshments is not tied directly to completion of the survey. The survey is designed to be administered in person. Surveys can be administered in a group setting or in one-on-one interviews. The role of staff in the survey process is to facilitate understanding, but not to tell participants how to answer. It is critical that staff members present the survey in a consistent way to all participants. We strongly recommend that staff review the
176

8
manual prior to survey administration so that all participants receive the same instructions. Below is a list of recommended steps for the survey process to ensure consistent data collection. These steps have been written for staff administering the survey in a group setting. Modifications can be made if a different format (i.e. interviews) is used.
1) Hand out survey packets. Each participant should receive
a survey packet with his/her participant ID number at the top of the survey. Staff should make sure the participant ID number that is written on the packet corresponds with the participant.
2) Introduce the survey. Staff should introduce the survey by reading the introductory statement to participants (see “Introducing the Survey” on page 10). After the introduction, staff should give participants a few minutes to read the Informed Consent Statement and sign it if necessary.
3) Provide alternative arrangements for non- participants. Alternative arrangements should be provided to participants who decide not to complete the survey. This might include leaving early or providing other activities for them. Staff should discretely provide instructions to non-participants.
4) Direct participants to the second page of the survey. The survey starts on the second page of the packet for participants. Staff should instruct participants to skip the cover sheet (For Staff Use Only) and proceed to page one of the survey.
5) Review general survey instructions with participants. Staff should review general instructions with participants using the script provided in the manual (see “Reviewing Instructions with Participants” on page 11). It is important that staff provide instructions regarding identification of the target child to all participants.
6) Start survey. The participant demographic questions start on page one of the survey packet. Staff should instruct participants to begin the survey. If participants have questions about specific items, staff should provide assistance. Staff can utilize the paraphrasing provided in the manual (Section III) to answer questions.
7) Collect surveys. Upon completion, surveys should be collected from participants. If there were any unusual circumstances surrounding the survey administration, staff should note that on the survey.
8) Complete “For Staff Use Only” Form. The cover sheet of the survey contains the demographic questions that must be completed by a staff member familiar with the program participant. Instructions for completing the demographic questions are provided in the next section.
177

9
Section II
Survey Scripts
Introducing the Survey Reviewing Instructions with Participants
178

10
Introducing the Survey
“I am going to ask you to complete a survey. This survey will help us better understand the needs of the families we serve. We want to provide the best services that we can to all of our parents and families, and this is one way to help us keep on track. The survey contains questions about your experiences as a parent and your outlook on life in general. The content of the survey should cause no more discomfort than you would experience in everyday life. All of the information that you share with us will be kept confidential and you do not have to put your name anywhere on the survey. The services you receive will not be affected by any answers that you give us in this survey. Do you have any questions about the survey?” (Answer participant questions)
[FOR AGENCIES WITH INFORMED CONSENT REQUIREMENTS] “On the front page of the survey is an Informed Consent Form. This is a document for our records that will be kept separate from the survey. This document tells us whether or not you have agreed to participate in the survey. You do not need to take this survey if you do not want to and the services you receive will not be taken away or changed if you do not take the survey. Please take a few minutes to read the first page of the survey. When you are finished, please check off the appropriate box and sign the form.”
(Check to make sure informed consent forms are completed before proceeding)
179

11
Reviewing Instructions with Participants
“This survey contains two different sections that you will need to complete. The first section asks for background information about you and your family. You may have already given us some of this information, and we thank you for giving it to us again today so that our survey information can be as complete as possible. The second section asks about your parenting experiences and your general outlook on life. Please remember that this is not a test, so there are no right or wrong answers. You should choose the best answer for you and your family. You will notice that the answer choices are on a number scale. Please respond by circling the number that best describes your situation. If you do not find an answer that fits perfectly, circle the one that comes closest.
There is one section in the survey that asks you to focus on the child that you hope will benefit most from your participation in our services. For these questions, it is important that you answer only with that child in mind. Please remember to fill in the space with the child’s age so that we can better understand your responses. When you are finished with the survey you can pass it back to me. If at any time you have questions about the survey, just let me know and I can help you.”
180

12
Section III
Survey Clarifications
Clarifications on the “For Staff Use Only” Form Paraphrasing Instructions
181

13
Clarifications on the “For Staff Use Only” Form
Agency ID Please provide the name of your agency. Participant ID#
Participants do not need to give their names, however a unique participant ID is necessary to process the survey. The participant ID number should be the case/client ID number that the agency uses to track the participant.
Is this a Pretest or Post test?
Please indicate whether the survey being administered is a pretest (given at the initiation of services) or a post test (given at the end of services).
1) Date survey completed
Provide the month, date and year that the survey was completed. Please use the four-digit year (for example, 2007 instead of 07).
2) How was the survey completed? Please check the most appropriate response:
“Completed in a face to face interview” if you met individually with the participant and filled it out together.
“Completed by participant with program staff available to explain items as needed” if the participant filled it out with help from staff.
“Completed by participant without program staff present” if the participant had no staff assistance.
3) Has the participant had any involvement with Child Protective Services? Check the most appropriate box:
NO if you know that the participant has not had involvement with CPS. YES if you know that the participant has had involvement with CPS. NOT SURE if you do not know whether or not the participant has had involvement with CPS.
4A) Date participant began program (complete for pretest)
Provide the month, date and year that the participant began receiving services from your program. Please use the four-digit year (for example, 2007 instead of 07).
4B) Date participant completed program (complete for post test) Provide the month, date and year that the participant completed services from your program. Please use the four-digit year (for example, 2007 instead of 07).
5) Type of Services Identify all of the services that the participant is currently receiving. If you do not find one that matches your program’s services, select “other” and provide a two- to four-word description of the program.
6) Service Intensity
A. (COMPLETE AT PRETEST) Estimate the number of hours of service the participant will be offered during the program. You should add up the hours across all services that the participant receives. B. (COMPLETE AT POST TEST) Estimate the number of hours of service the participant has received since he/she started the program. You should add up the hours across all services that the participant receives.
182

14
PROTECTIVE FACTORS SURVEY
FOR STAFF USE ONLY: Agency ID Participant ID # ____________________
Is this a Pretest? Post test? 1. Date survey completed: / / 2. How was the survey completed? Completed in face to face interview
Completed by participant with program staff available to explain items as needed Completed by participant without program staff present
3. Has the participant had any involvement with Child Protective Services? NO YES NOT SURE 4. (A) Date participant began program (complete for pretest) / / 4. (B) Date participant completed program (complete at post test) / / 5. Type of Services: Identify the type of program that most accurately describes the services the participant is receiving. Check all that apply.
Parent Education
Parent Support Group
Parent/Child Interaction
Advocacy (self, community)
Fatherhood Program
Planned and/or Crisis Respite
Homeless/Transitional Housing
Resource and Referral
Family Resource Center
Skill Building/Ed for Children
Adult Education (i.e. GED/Ed)
Job Skills/Employment Prep
Pre-Natal Class
Family Literacy
Marriage Strengthening/Prep
Home Visiting
Other (If you are using a specific curriculum, please name it here)
6.) Participant’s Attendance: (Estimate if necessary)
A) Answer at Pretest: Number of hours of service offered to the consumer: _______
B) Answer at Post-test: Number of hours of service received by the consumer: _______
183

15
Paraphrasing Instructions for the Participant Form
Occasionally participants need further clarification in order to answer the questions. It is important that staff provide the same explanations to participants so that the survey administration is consistent. The paraphrasing provided below is intended for use by staff during the survey process. If a question arises, staff should rely on the paraphrasing to assist participants. Demographic Information, Questions 1 - 10
Agency ID # [The Agency ID # will be provided by the program staff]
Participant ID# [The Participant ID # will be provided by the program staff] 1) Date survey completed Write today’s date. Please use the four-digit year (for example, 2007 instead of 07). 2) Sex Are you a male or a female? 3) Age (in years) Write your current age. 4) Race/Ethnicity Select the race/ethnicity that best describes you. If the categories do not describe your race/ethnicity, select “other” and provide a description. 5) Marital Status Select the box that best describes your current marital status. 6) Family Housing Select the box the best describes what type of home your family current lives in. “Temporary” means that you have places to stay, but that you do not have an on-going residency in a household. 7) Family Income
The family income refers to the combined annual income of all family members in the household and could include earned income, child support, and Social Security payments among other sources.
8) Highest Level of Education
Select the box that best describes the highest level of education that you completed. 9) Which of the following do you currently receive?
Select all categories of assistance that you or anyone in your household currently receives. 10) Children in Your Household
List all of the children that are a part of your household. For each child, identify the child’s gender, date of birth, and your relationship to that child. If you have more than four children, continue the list on the back of the sheet.
184

16
Agency ID Participant ID # ____________________ 1. Date Survey Completed: / / 2. Sex: Male Female 3. Age (in years): _______ 4. Race/Ethnicity. (Please choose the ONE that best describes what you consider yourself to be)
A Native American or Alaskan Native B Asian
C African American D African Nationals/Caribbean Islanders
E Hispanic or Latino F Middle Eastern G Native Hawaiian/Pacific Islanders H White (Non Hispanic/European American) I. Multi-racial J Other
5. Marital Status:
A Married B Partnered C Single D Divorced E Widowed F Separated 6. Family Housing:
A Own B Rent C Shared housing with relatives/friends D Temporary (shelter, temporary with friends/relatives) E Homeless
7. Family Income:
A $0-$10,000 B $10,001-$20,000 C $20,001-$30,000 D $30,001-$40,000 E $40,001-$50,000 F more than $50,001
8. Highest Level of Education:
A Elementary or junior high school B Some high school C High school diploma or GED D Trade/Vocational Training E Some college F 2-year college degree (Associate’s) G 4-year college degree (Bachelor’s) H Master’s degree I PhD or other advanced degree
9. Which, if any, of the following do you currently receive? (Check all that apply)
A Food Stamps B Medicaid (State Health Insurance) C Earned Income Tax Credit D TANF E Head Start/Early Head Start Services F None of the above
10. Please tell us about the children living in your household. Child 1: Male Female
DOB / / Your relation-ship to child
A Birth parent B Adoptive parent C Grand/Great Grandparent D Sibling E Other relative F Foster-parent G Other
Child 2: Male Female
DOB / / Your relation-ship to child
A Birth parent B Adoptive parent C Grand/Great Grandparent D Sibling E Other relative F Foster-parent G Other
Child 3: Male Female
DOB / / Your relation-ship to child
A Birth parent B Adoptive parent C Grand/Great Grandparent D Sibling E Other relative F Foster-parent G Other
Child 4: Male Female
DOB / / Your relation-ship to child
A Birth parent B Adoptive parent C Grand/Great Grandparent D Sibling E Other relative F Foster-parent G Other
If more than 4 children, please use space provided on the back of this sheet.
185

17
Paraphrasing Instructions for the Participant Form Protective Factors Survey, Questions 1-11
1) In my family, we talk about problems.
When your family has a problem, how often does your family sit down and talk about it? 2) When we argue, my family listens to “both sides of the story.”
When there are disagreements in your family, how much of the time does each person get to share their side in an argument?
3) In my family, we take time to listen to each other.
How much of the time does your family listen to each other? 4) My family pulls together when things are stressful.
When your family is facing a hard time, how much of the time do you work together? 5) My family is able to solve our problems.
When your family has a problem, how much of the time are you able to come up with solutions? 6) I have others who will listen when I need to talk about my problems. Do you have family, friends, neighbors or professionals who you can tell your problems to? 7) When I am lonely, there are several people I can talk to. Do you have family, friends, neighbors, or professionals who you can talk to when you are lonely? 8) I would have no idea where to turn if my family needed food or housing. When you need food or housing, you don’t know about any available resources. 9) I wouldn’t know where to go for help if I had trouble making ends meet. You don’t know where to get assistance when you need help paying your bills. 10) If there is a crisis, I have others I can talk to. If you are faced with an emergency or an urgent situation, you have others you can talk to. 11) If I needed help finding a job, I wouldn’t know where to go for help. I don’t where to get help when I need work.
186

18
Part I. Please circle the number that describes how often the statements are true for you or your family. The numbers represent a scale from 1 to 7 where each of the numbers represents a different amount of time. The number 4 means that the statement is true about half the time.
Never Very
Rarely Rarely About Half the Time Frequently
Very Frequently Always
1. In my family, we talk about problems. 1 2 3 4 5 6 7
2. When we argue, my family listens to “both sides of the story.”
1 2 3 4 5 6 7
3. In my family, we take time to listen to each other. 1 2 3 4 5 6 7
4. My family pulls together when things are stressful. 1 2 3 4 5 6 7
5. My family is able to solve our problems. 1 2 3 4 5 6 7
Part II. Please circle the number that best describes how much you agree or disagree with the statement.
Strongly Disagree
Mostly Disagree
Slightly Disagree Neutral
Slightly Agree
Mostly Agree
Strongly Agree
6. I have others who will listen when I need to talk about my problems.
1 2 3 4 5 6 7
7. When I am lonely, there are several people I can talk to. 1 2 3 4 5 6 7
8. I would have no idea where to turn if my family needed food or housing.
1 2 3 4 5 6 7
9. I wouldn’t know where to go for help if I had trouble making ends meet.
1 2 3 4 5 6 7
10. If there is a crisis, I have others I can talk to. 1 2 3 4 5 6 7
11. If I needed help finding a job, I wouldn’t know where to go for help.
1 2 3 4 5 6 7
187

19
Paraphrasing Instructions for the Participant Form Protective Factors Survey, Questions 12-20 NOTE: Questions 12-20 ask participants to focus on the child that they hope will benefit most from your participation in our services. You can help participants identify the target child by asking, “What child do you think will benefit most from you being here?” or “Which child were you referred for services?” Remind them that they need to provide the child’s age first before they answer the questions. Child’s Age or DOB What is the age and date of birth of the child you hope will benefit most from your involvement in our services? 12) There are many times when I don’t know what to do as a parent. I am often unsure what to do to be a good parent to my child.. 13) I know how to help my child learn. Do you know what your child needs to learn? 14) My child misbehaves just to upset me. Do you think that your child acts up just to upset you? 15) I praise my child when he/she behaves well. Do you praise your child for good behavior? If your child behaves well, do you tell him/her how happy you are? 16) When I discipline my child, I lose control. Do you have a hard time controlling your temper when you discipline your child? 17) I am happy being with my child. How much of the time do you enjoy being with your child? 18) My child and I are very close to each other. How much of the time do you feel that your relationship with your child is strong? 19) I am able to soothe my child when he/she is upset. How much of the time are you able to calm your child down when he or she is upset? 20) I spend time with my child doing what he/she likes to do. How often do you do activities with your child that he or she enjoys?
188

20
Part III. This part of the survey asks about parenting and your relationship with your child. For this section, please focus on the child that you hope will benefit most from your participation in our services. Please write the child’s age or date of birth and then answer questions with this child in mind. Child’s Age ____________ or DOB ____/____/____
Strongly Disagree
Mostly Disagree
Slightly Disagree Neutral
Slightly Agree
Mostly Agree
Strongly Agree
12. There are many times when I don’t know what to do as a parent.
1 2 3 4 5 6 7
13. I know how to help my child learn. 1 2 3 4 5 6 7
14. My child misbehaves just to upset me. 1 2 3 4 5 6 7
Part IV. Please tell us how often each of the following happens in your family.
Never Very
Rarely Rarely
About Half the
Time Frequentl
y
Very Frequentl
y Always
15. I praise my child when he/she behaves well. 1 2 3 4 5 6 7
16. When I discipline my child, I lose control. 1 2 3 4 5 6 7
17. I am happy being with my child. 1 2 3 4 5 6 7
18. My child and I are very close to each other. 1 2 3 4 5 6 7
19. I am able to soothe my child when he/she is upset. 1 2 3 4 5 6 7
20. I spend time with my child doing what he/she likes to do. 1 2 3 4 5 6 7
189

21
Section IV
Sample Informed Consent Form
190

22
Sample Informed Consent Statement (Name of Program) is conducting an evaluation to make sure that the families we serve are benefiting from our program. It is also a way for us to see what we are doing well and if there are areas in which we can improve. We want to provide the best possible services to our families and this is one way to keep us on track. Part of the evaluation involves asking program participants to complete a survey about how our services affect them and their families. If you choose to participate in this evaluation, your identity will be kept confidential. No identifying information will be shared with anyone outside of this program. Other information about the evaluation Your participation is voluntary. Your services will not be affected by your participation or lack of participation. Your privacy will be protected. Your name will not appear on the survey. If you are given a case ID, only authorized program personnel will know it and it will not be shared with anyone. Once you have completed the survey, the information on it will be transferred to a database and the survey will be destroyed. We hope you will help us by participating in this evaluation. Your participation will help us to improve services to all families who may need it.
□ I agree to participate in the evaluation by responding to the PFS survey. □ I choose not to participate at this time.
__________________________________________ ________________________ Participant’s Signature Date __________________________________________ ________________________ Program Staff Signature Date
191

23
Section V
Subscale Scores
Computing Subscale Scores Technical Data
192

24
Computing Subscale Scores The following are directions for calculating the scores by hand. Step #1: Reverse score selected items
Before subscales can be calculated, all items need to be scored in the same direction such that a higher score reflects a higher level of protective factors. The following items require reverse-scoring: 8, 9, 11, 12, 14, 16. To reverse-score the items listed above, use the following scoring transformation: A score of 1 is rescored 7, a score of 2 is rescored 6, a score of 3 is rescored 5, a score of 5 is rescored 3, a score of 6 is rescored 2, a score of 7 is rescored 1.
Step #2: Calculate the subscale scores
Family Functioning/Resiliency The FFPSC subscale is composed of items 1 through 5. If fewer than 4 of items 1 through 5 were completed don’t compute a score. If 4 or more items were completed sum the items responses and divide by the number of items completed. Social Support The SS subscale is composed of items 6, 7, and 10. If fewer than 2 of these items were completed don’t compute a score. If 2 or more items were completed sum the items responses and divide by the number of items completed. Concrete Support The CS subscale is composed of items 8, 9, and 11. If fewer than 2 of these items were completed don’t compute a score. If 2 or more items were completed sum the items responses and divide by the number of items completed. Nurturing and Attachment The NA subscale is composed of items 17, 18, 19, and 20. If fewer than 3 of these items were completed don’t compute a score. If 3 or more items were completed sum the items responses and divide by the number of items completed. Child Development/Knowledge of Parenting The knowledge of parenting and child development factor is composed of five unique items (12, 13, 14, 15, 16). Because of the nature of these items, calculation of a subscale score is not recommended. Means, standard deviations, and percentages should be used to assess an agency’s progress in this area.
193

25
Technical Data The reliability of each subscale of the PFS has been estimated using an internal-consistency measure of reliability, Cronbach’s coefficient alpha. Reliabilities for each subscale are provided below. For further information about the psychometric properties of the PFS, please refer to the technical report, available upon request from the University of Kansas Institute for Educational Research and Public Service. Subscale Reliability Family Functioning/Resiliency .89 Social Support .89 Concrete Support .76 Nurturing and Attachment .81
194

Appendix C
The Protective Factors Survey
195

PROTECTIVE FACTORS SURVEY (Program Information-- For Staff Use Only)
This survey was developed by the FRIENDS National Resource Center for Community-Based Child Abuse Prevention in partnership with the University of Kansas Institute for Educational Research & Public Service through funding provided by the US Department of Health and Human Services.
Agency ID Participant ID # ____________________
Is this a Pretest? Post test? 1. Date survey completed: / / 2. How was the survey completed? Completed in face to face interview
Completed by participant with program staff available to explain items as needed Completed by participant without program staff present
3. Has the participant had any involvement with Child Protective Services? NO YES NOT SURE 4. (A) Date participant began program (complete for pretest) / / 4. (B) Date participant completed program (complete at post test) / / 5. Type of Services: Identify the type of program that most accurately describes the services the participant is receiving. Check all that apply.
Parent Education
Parent Support Group
Parent/Child Interaction
Advocacy (self, community)
Fatherhood Program
Planned and/or Crisis Respite
Homeless/Transitional Housing
Resource and Referral
Family Resource Center
Skill Building/Ed for Children
Adult Education (i.e. GED/Ed)
Job Skills/Employment Prep
Pre-Natal Class
Family Literacy
Marriage Strengthening/Prep
Home Visiting
Other (If you are using a specific curriculum, please name it here)
6.) Participant’s Attendance: (Estimate if necessary)
A) Answer at Pretest: Number of hours of service offered to the consumer: _______
B) Answer at Post-test: Number of hours of service received by the consumer: _______
196

PROTECTIVE FACTORS SURVEY
Page 1 Agency ID Participant ID # ____________________ 1. Date Survey Completed: / / 2. Sex: Male Female 3. Age (in years): _______ 4. Race/Ethnicity. (Please choose the ONE that best describes what you consider yourself to be)
A Native American or Alaskan Native B Asian C African American D African Nationals/Caribbean Islanders E Hispanic or Latino F Middle Eastern G Native Hawaiian/Pacific Islanders H White (Non Hispanic/European American) I. Multi-racial J Other
5. Marital Status:
A Married B Partnered C Single D Divorced E Widowed F Separated 6. Family Housing:
A Own B Rent C Shared housing with relatives/friends D Temporary (shelter, temporary with friends/relatives) E Homeless
7. Family Income:
A $0-$10,000 B $10,001-$20,000 C $20,001-$30,000 D $30,001-$40,000 E $40,001-$50,000 F more than $50,001
8. Highest Level of Education:
A Elementary or junior high school B Some high school C High school diploma or GED D Trade/Vocational Training E Some college F 2-year college degree (Associate’s) G 4-year college degree (Bachelor’s) H Master’s degree I PhD or other advanced degree
9. Which, if any, of the following do you currently receive? (Check all that apply)
A Food Stamps B Medicaid (State Health Insurance) C Earned Income Tax Credit D TANF E Head Start/Early Head Start Services F None of the above
10. Please tell us about the children living in your household. Child 1: Male Female
DOB / / Your relation-ship to child
A Birth parent B Adoptive parent C Grand/Great Grandparent D Sibling E Other relative F Foster-parent G other
Child 2: Male Female
DOB / / Your relation-ship to child
A Birth parent B Adoptive parent C Grand/Great Grandparent D Sibling E Other relative F Foster-parent G other
Child 3: Male Female
DOB / / Your relation-ship to child
A Birth parent B Adoptive parent C Grand/Great Grandparent D Sibling E Other relative F Foster-parent G other
Child 4: Male Female
DOB / / Your relation-ship to child
A Birth parent B Adoptive parent C Grand/Great Grandparent D Sibling E Other relative F Foster-parent G other
If more than 4 children, please use space provided on the back of this sheet.
This survey was developed by the FRIENDS National Resource Center for Community-Based Child Abuse Prevention in partnership with the University of Kansas Institute for Educational Research & Public Service through funding provided by the US Department of Health and Human Services.
197

PROTECTIVE FACTORS SURVEY Page 2
This survey was developed by the FRIENDS National Resource Center for Community-Based Child Abuse Prevention in partnership with the University of Kansas Institute for Educational Research & Public Service through funding provided by the US Department of Health and Human Services.
Part I. Please circle the number that describes how often the statements are true for you or your family. The numbers represent a scale from 1 to 7 where each of the numbers represents a different amount of time. The number 4 means that the statement is true about half the time.
Never Very
Rarely Rarely About Half the Time Frequently
Very Frequently Always
1. In my family, we talk about problems. 1 2 3 4 5 6 7
2. When we argue, my family listens to “both sides of the story.”
1 2 3 4 5 6 7
3. In my family, we take time to listen to each other. 1 2 3 4 5 6 7
4. My family pulls together when things are stressful. 1 2 3 4 5 6 7
5. My family is able to solve our problems. 1 2 3 4 5 6 7
Part II. Please circle the number that best describes how much you agree or disagree with the statement.
Strongly Disagree
Mostly Disagree
Slightly Disagree Neutral
Slightly Agree
Mostly Agree
Strongly Agree
6. I have others who will listen when I need to talk about my problems.
1 2 3 4 5 6 7
7. When I am lonely, there are several people I can talk to. 1 2 3 4 5 6 7
8. I would have no idea where to turn if my family needed food or housing.
1 2 3 4 5 6 7
9. I wouldn’t know where to go for help if I had trouble making ends meet.
1 2 3 4 5 6 7
10. If there is a crisis, I have others I can talk to. 1 2 3 4 5 6 7
11. If I needed help finding a job, I wouldn’t know where to go for help.
1 2 3 4 5 6 7
198

PROTECTIVE FACTORS SURVEY
Page 3 Part III. This part of the survey asks about parenting and your relationship with your child. For this section, please focus on the child that you hope will benefit most from your participation in our services. Please write the child’s age or date of birth and then answer questions with this child in mind. Child’s Age ____________ or DOB ____/____/____
Strongly Disagree
Mostly Disagree
Slightly Disagree Neutral
Slightly Agree
Mostly Agree
Strongly Agree
12. There are many times when I don’t know what to do as a parent.
1 2 3 4 5 6 7
13. I know how to help my child learn. 1 2 3 4 5 6 7
14. My child misbehaves just to upset me. 1 2 3 4 5 6 7
Part IV. Please tell us how often each of the following happens in your family.
Never Very
Rarely Rarely
About Half the
Time Frequently Very
Frequently Always
15. I praise my child when he/she behaves well. 1 2 3 4 5 6 7
16. When I discipline my child, I lose control. 1 2 3 4 5 6 7
17. I am happy being with my child. 1 2 3 4 5 6 7
18. My child and I are very close to each other. 1 2 3 4 5 6 7
19. I am able to soothe my child when he/she is upset. 1 2 3 4 5 6 7
20. I spend time with my child doing what he/she likes to do. 1 2 3 4 5 6 7
This survey was developed by the FRIENDS National Resource Center for Community-Based Child Abuse Prevention in partnership with the University of
Kansas Institute for Educational Research & Public Service through funding provided by the US Department of Health and Human Services.
199

Appendix D
MPlus Syntax
TITLE: PFS measurement factorial invariance DATA: FILE IS jackieformplus.csv; VARIABLE: NAMES ARE T1_FF1 T1_FF2 T1_FF3 T1_FF4 T1_FF5 T1_SS6 T1_SS7 T1_SS8 T1_CS9 T1_CS10 T1_CS11 T1_NA12 T1_NA13 T1_NA14 T1_NA15 T2_FF16 T2_FF17 T2_FF18 T2_FF19 T2_FF20 T2_SS21 T2_SS22 T2_SS23 T2_CS24 T2_CS25 T2_CS26 T2_NA27 T2_NA28 T2_NA29 T2_NA30; MISSING ARE All (-999); !Uses robust ML estimation to deal with skew and kurtosis ANALYSIS: ESTIMATOR IS MLR; MODEL: !Factor loadings for time 1 FFT1 BY T1_FF1*(1); FFT1 BY T1_FF2(2); FFT1 BY T1_FF3(3); FFT1 BY T1_FF4 (4); FFT1 BY T1_FF5 (5); SST1 BY T1_SS6* (6); SST1 BY T1_SS7 (7) ; SST1 BY T1_SS8 (8); CST1 BY T1_CS9* (9); CST1 BY T1_CS10 (10); CST1 BY T1_CS11 (11); NAT1 BY T1_NA12* (12); NAT1 BY T1_NA13 (13); NAT1 BY T1_NA14 (14); NAT1 BY T1_NA15 (15); !Factor loadings for time 2 FFT2 BY T2_FF16*(1); FFT2 BY T2_FF17 (2); FFT2 BY T2_FF18 (3); FFT2 BY T2_FF19 (4); FFT2 BY T2_FF20 (5); SST2 BY T2_SS21* (6); SST2 BY T2_SS22 (7); SST2 BY T2_SS23 (8); CST2 BY T2_CS24* (9);
200

CST2 BY T2_CS25 (10); CST2 BY T2_CS26 (11); NAT2 BY T2_NA27* (12); NAT2 BY T2_NA28 (13); NAT2 BY T2_NA29 (14); NAT2 BY T2_NA30 (15); !Residual correlations between timepoints T1_FF1 WITH T2_FF16; T1_FF2 WITH T2_FF17; T1_FF3 WITH T2_FF18; T1_FF4 WITH T2_FF19; T1_FF5 WITH T2_FF20; T1_SS6 WITH T2_SS21; T1_SS7 WITH T2_SS22; T1_SS8 WITH T2_SS23; T1_CS9 WITH T2_CS24; T1_CS10 WITH T2_CS25; T1_CS11 WITH T2_CS26; T1_NA12 WITH T2_NA27; T1_NA13 WITH T2_NA28; T1_NA14 WITH T2_NA29; T1_NA15 WITH T2_NA30; !Set latent variance to 1 for identification FFT1@1; SST1@1; CST1@1; NAT1@1; FFT2@1; SST2@1; CST2@1; NAT2@1; !Within time correlations (equated) FFT1 WITH SST1 (a); FFT1 WITH CST1 (b); FFT1 WITH NAT1 (c); SST1 WITH CST1 (d); SST1 WITH NAT1 (e); CST1 WITH NAT1 (f); FFT2 WITH SST2 (a); FFT2 WITH CST2 (b); FFT2 WITH NAT2 (c); SST2 WITH CST2 (d); SST2 WITH NAT2 (e); CST2 WITH NAT2 (f); !Structural Pathways FFT2 ON FFT1 SST1 CST1 NAT1; SST2 ON FFT1 SST1 CST1 NAT1; CST2 ON FFT1 SST1 CST1 NAT1; NAT2 ON FFT1 SST1 CST1 NAT1; OUTPUT: TECH1 TECH4; STDYX;
201