delamination investigation for novel damage states …epubs.surrey.ac.uk/812318/1/mphil corrected...
TRANSCRIPT

Delamination investigation for novel
damage states within coupon and
structural elements.
Charlotte Foreman
Department of Mechanical Engineering Sciences
University of Surrey
A dissertation submitted for the partial fulfilment of the requirements for
the degree of Master of Philosophy
May 2016

Charlotte Foreman: 2
Abstract
This thesis focuses on the subject of damage in composite materials and
structures, in particular delaminations arising from an impact event and
subsequent Mode I and Mode II loading and fatigue delamination growth.
Interlaminar fracture toughness values have been calculated from an
experimental study for DCB and ENF specimens. Specimens with artificial
inserts at two different interfaces were used along with specimens with
delaminations introduced from an impact event. The standard analysis
method for both Mode I and Mode II has been adapted to account for the
delamination away from the mid plane. For Mode I loading, the load to
initiate delamination growth from experimental results is in good agreement
with the predicted results from the adapted Mode I equation. For Mode II
loading, crack migration did not appear obvious from the experimental
study, and an adapted equation accounting for delaminations away from
the mid plane has been successfully used.
A fatigue study on a structural element loaded both in-plane and out of
plane has highlighted the complex nature of damage growth in composite
structures. The study has highlighted the issues of delamination
investigation using the ultrasonic NDT technique, whereby non-critical
delamination growth is sometimes masked by the more dominant
delamination and as such the complex growth of delaminations within a
structure is difficult to quantify using this technique.

Charlotte Foreman: 3
Dedication
To my wonderful husband Andy, who has supported me throughout my long
study, making sure I persevered when life got in the way and keeping me
well fed and watered at busy times of study.
To my two wonderful boys, Aidan and Finlay, without whom, I would have
finished this thesis sooner, but who bring such joy to my life.
To my incredibly supportive parents, especially my Dad who inspired me to
study engineering and sparked my interest in materials science and who
has made me realise that we never stop learning, no matter how old we
are!

Charlotte Foreman: 4
Acknowledgements
The author would like to thank QinetiQ, Farnborough for providing the
material and use of the test machine throughout this study. The author
would also like to thank the Non-destructive testing personnel at QinetiQ
who carried out the Ultrasonic C-Scans. Particular thanks should be given
to the supervisors Prof P.Smith and Prof S.Ogin who have provided
motivation and advice throughout the study.

Charlotte Foreman: 5
Table of Contents
1. Introduction 9
1.1. Aims 12
1.2. Structure of thesis 12
2. Literature Review 14
2.1. Fundamental aspects of composites – the fibre, matrix and interface 14
2.1.1. The fibre 15
2.1.2. Continuous reinforcing fibre 18
2.1.3. Matrix 20
2.1.4. Fibre / matrix interface 21
2.2. Damage 21
2.2.1. Definition 21
2.2.2. Impact damage – a major challenge for composites 22
2.2.3. Impact testing 24
2.3. The nature of impact damage 25
2.3.1. Matrix failure 26
2.3.2. Delamination 28
2.3.3. Fibre Failure 31
2.3.4. Penetration 32
2.3.5. Factors affecting impact damage in composite materials 33
2.3.6. Effect of geometry on impact damage 34
2.4. Detection of damage in composites 35
2.4.1. Introduction 35
2.4.2. Acoustic Impact 35
2.4.3. Laser Shearography 36
Charlotte Foreman: 6
2.4.4. Ultrasonic C-scan 36
2.4.5. Thermography 38
2.4.5.1. Selectively Heating Thermography 38
2.4.6. X-radiography 39
2.4.6.1. X-ray microtomography (micro-CT) 39
2.5. Fatigue 40
2.5.1. Introduction 40
2.5.2. Fatigue testing 41
2.5.3. Damage in components under fatigue loading 42
2.5.4. Delamination growth under fatigue loading 45
2.6. Fracture mechanics and its application to delamination in composites 48
2.6.1. The Energy Criterion approach 48
2.6.2. The Stress intensity approach 49
2.6.3. Mode I and Mode II tests 51
2.7. Summary of literature Review 54
3. Interlaminar fracture toughness testing of Non Crimp Fabrics 58
3.1. Introduction 58
3.2. Material and Preparation of Test Specimen 59
3.2.1. Introduction 59
3.2.2. Materials 59
3.2.3. Specimen Preparation 62
3.3. Mode I: Double Cantilever Beam (DCB) 65
3.3.1. Introduction 65
3.3.2. Test Method 65
3.3.3. Data Reduction 68
3.3.3.1. Introduction 68
3.3.3.2. The Corrected beam theory data reduction method 69
Charlotte Foreman: 7
3.3.3.3. Modification for Crack path not at mid plane 70
3.4. Mode II: End Notch Flexure (ENF) 72
3.4.1. Introduction 72
3.4.2. Test Method 72
3.4.3. Data Reduction 73
3.4.3.1. The Direct Beam Theory 74
3.4.3.2. The modified Beam theory 74
3.4.3.3. Modified beam with asymmetric correction (Zhou & He (1993)) 74
3.5. Mode I DCB Test results 76
3.5.1. Introduction 76
3.5.2. Standard Specimen with PTFE Inserts 76
3.5.3. Impact Specimens 81
3.6. Mode II ENF Test Results 84
3.6.1. Introduction 84
3.6.2. Standard Specimen with Artificial Insert 84
3.6.3. Impact specimens 86
3.7. Discussion 88
3.7.1. Mode I 88
3.7.2. Mode II 90
4. Experimental Work on Structural Element 93
4.1. Introduction 93
4.2. Manufacture of the structure 94
4.3. Laminate quality 96
4.4. Impacting 96
4.5. Non destructive testing 97
4.6. Experimental arrangement 98
4.7. Loading arrangement and results of element testing 99

Charlotte Foreman: 8
4.8. Summary 134
5. Concluding Remarks and Recommendations 139

Charlotte Foreman: 9
1. Introduction
Composite materials can be defined as materials comprising two or more
constituents (chemically distinct) which, when combined, have properties
which are greater than the properties of the individual constituents.
They occur naturally in forms such as bone and wood, however man-made
composites were first used in aircraft construction in the 1960s and 1970s.
The first generation of composites used in load-bearing safety critical
aerostructures employed low toughness epoxy (thermoset) resin systems
which resulted in laminated structures with a poor tolerance to low-energy
impact. The low toughness of early composite aerostructures, combined
with high probability of impact from threats such as runway debris lofted
by aircraft wheels, or tool impacts during maintenance, necessitated overly
conservative design and aircraft structures which were far heavier than
theoretically possible. Whilst maintaining a focus on mass (and cost)
reduction it therefore became paramount for material suppliers to develop
composites with higher impact resistance and damage tolerance, as well as
delivering a balanced set of other mechanical and physical properties, such
as compression strength and wet Tg, and resistance to the harsh
environmental conditions present in aerospace applications.
As the performance of composite materials, and associated design and test
methodologies, have been improved so the use of composites within the
aircraft industry has also increased. The A380 utilises 30 metric tonnes of
structural composites in a total airframe weight of 170 metric tonnes
(16%), whereas the A350XWB utilises 53% of composites in its airframe
[Airbus (2015)]. Figure 1 illustrates the growth in the use of composites in
Airbus and Boeing aircraft since 2009; showing an annual growth rate of
over 10% per year.

Charlotte Foreman: 10
Figure 1 –Composite use in aircraft
http://compositesmanufacturingmagazine.com/2015/01/what-will-drive-
composites-growth-in-2015/3/
The mechanisms involved in the initiation and growth of damage in
composites are complex; this is due to the architectural complexity and
intrinsic inhomogeneity of composites, as well as their anisotropic nature.
Bulk structural failure of composites occurs due to a summation of a number
of damage mechanisms, including matrix cracking, delamination, fibre /
matrix de-bonding and fibre failure. The complexity of this failure process
causes difficulty in the pursuit of robust numerical prediction techniques for
use in safety critical aerostructures design, especially when compared to
more traditional metallic materials. As a result, although a vast amount of
academic and industrial studies have been published that aim to deliver
robust composite failure predictions, designers are still forced to use a very
conservative approach to design of composites, by regulatory authorities
such as EASA (European Aviation Safety Authority). For civil aircraft,
generally a safe life approach is adopted, in which the component has to
remain defect free for the lifetime of the component, or more precisely that
any non-detectable defect that exists, or may be undetectably formed
whilst in service, must exist throughout the components life without
growing (Attia et al (2001)). As a consequence, when designing with
composites, a working strain of approximately 2700 (design-limit strain

Charlotte Foreman: 11
level of 4000is employed (Attia et al (2001)). The limit strain is the
maximum strain that the structure is likely to experience during its design
life, without experiencing any permanent deformation. The working strain
is set by factors such as hot/wet notched compressive strength and static
compressive strength after impact. At these low levels of working strain,
composites have very good fatigue properties, allowing designs to be
statically determined. In fact, at these low strain levels, any damage that
is initiated does not usually grow under subsequent fatigue loading,
therefore meeting the safe life design approach. The low strain levels used
to date has led to the assumption that composites are highly fatigue
damage tolerant. However, in order to meet the increasing demand for
higher fuel efficiency, and as confidence in design increases, the overall
structural weight of aerospace structures is likely to be reduced, with an
associated reduction in thickness of some of the load bearing structures
becoming a necessity. Reducing the thickness of such structures may lead
to an increase in the operational strain, and as a consequence, fatigue may
then become a more significant issue.
There has been considerable research conducted on delamination growth
and damage mechanisms arising from an impact event; however, the focus
has been on coupon specimens, which do not accurately reflect real damage
processes in real structures. Very little work has been carried out on more
representative structural specimens. Structures generally fail due to either
oversights during design, construction or operation of the structure, or due
to application of a new design or material, which produced an unexpected
result (Anderson (2005)). Regarding oversights during design, construction
or operation, the existing procedures should be sufficient to avoid failure;
however if the procedures are not followed, failure may occur. When a new
design or new material is introduced, the problem is more complex, and
there are often factors that the designer is not expecting. As a result, a new
design or material should only be placed into service once extensive testing
and analysis has been carried out. The expected service performance must
be assessed before the structure enters service. This assessment is in the
form of structural testing, which will ensure and substantiate structural
integrity as per certification criteria for either civil or military requirements

Charlotte Foreman: 12
(Niu (1992)). The basic “building block” approach (Figure 2) which builds in
complexity from coupon tests to full scale tests, should be established in
the early stages of development because the validation process is
dependent on testing of all levels of the fabrication process (Niu (1995)).
Figure 2 – Building Block Testing Approach (Niu (1995))
The purpose of structural testing of all levels is to establish failure modes,
demonstrate compliance with design criteria and correlate test results with
theoretical predictions, therefore ensuring confidence that the part or
overall structure, will perform satisfactorily throughout its service life.
1.1. Aims
The overall aim of this research project was twofold, firstly to investigate
and carry out novel experimental testing techniques to understand damage
behaviour at both the coupon level and the structural level in order to
compare the results with standard analysis. Secondly to determine if
standard analysis can be used and adapted to generate interlaminar
fracture data from delminations more representative of those seen in real
structures.
1.2. Structure of thesis
This document consists of 5 chapters. The first introduces the thesis and
outlines the aims of the study. Chapter two presents the literature review,
chapter three outlines the experimental test methods for Double Cantilever
Beam (DCB) specimens and End Notch Flexure (ENF) specimens which
COUPONS
Modulus
Static Strength
Fatigue
Damage sensitivity
Moisture & Temperature effects
ELEMENTS
Joints
Crippling
Shear Webs
Structural details
COMPONENTS
Stiffened panels
Major Joints
Full scale sections
FULL SCALE
Static
Fatigue
Damage Tolerance
COUPONS
Modulus
Static Strength
Fatigue
Damage sensitivity
Moisture & Temperature effects
COUPONS
Modulus
Static Strength
Fatigue
Damage sensitivity
Moisture & Temperature effects
ELEMENTS
Joints
Crippling
Shear Webs
Structural details
ELEMENTS
Joints
Crippling
Shear Webs
Structural details
COMPONENTS
Stiffened panels
Major Joints
Full scale sections
COMPONENTS
Stiffened panels
Major Joints
Full scale sections
FULL SCALE
Static
Fatigue
Damage Tolerance
FULL SCALE
Static
Fatigue
Damage Tolerance

Charlotte Foreman: 13
contained either artificial inserts at the mid plane of the laminate or at 1/3
thickness of the laminate, or delaminations caused by a 50J impact event.
Chapter four presents the work carried out on the structural testing.
Structural testing has been carried out in the form of fatigue tests for a
structural panel with impact damage, loading both in plane and out of plane
in order to evaluate the damage growth. Bringing these two novel test
experiments together should provide an overview of the nature of damage
behaviour at both the coupon level (from a non-standard test) and the
structural level.
Chapter five is a summary of the thesis and includes recommendations for
future work.

Charlotte Foreman: 14
2. Literature Review
This section of the thesis starts by discussing the fundamentals of
composite materials and summarises the key work carried out in the field
of damage of composite materials, focussing on delamination and impact
damage along with fatigue failure.
2.1. Fundamental aspects of composites – the fibre,
matrix and interface
A composite material can be defined as a material comprising two or more
constituents (chemically distinct) which, when combined, have properties
which are greater than the properties of the individual constituents.
Many composites are composed of just two phases, a matrix phase and a
reinforcement phase. The properties of the composite are a function of the
constituent phases, their type, amount and the geometry of the
reinforcement. A flow chart (Figure 3) displays the classification of
composites in terms of the reinforcement type (Matthews et al (1995)).
Figure 3 – Classification of reinforced polymer composite materials
Within the three main headings; particulate, fibre and structural, of greatest
interest to this study are the fibre and structural classifications, due to their
relevance to the aeronautical industry.
Large particle
Composite
Particle-reinforced Fibre –reinforced
(large length to diameter ratio)
Structural
Dispersion
strengthened
Continuous
(aligned)
Dis-continuous
(short)
Laminates Sandwich panels
Aligned Randomly orientated

Charlotte Foreman: 15
2.1.1. The fibre
For the purpose of this thesis, when referring to the fibres, it is continuous
fibres that are being discussed. The fibres perform the load carrying task
and are primarily responsible for the structural properties, such as tensile
and flexural strength and stiffness. Generally, the smaller the diameter the
fibre, the greater the strength of the fibre, due to the larger surface area
provided for the interface bond with the composite matrix (Matthews et al,
(1995)). The fibres occupy the largest volume fraction in a composite
laminate, with a typical aerospace fibre volume fraction being 65% to
achieve the best balance of mechanical properties. The principal fibre
materials of interest in aerospace components are glass, carbon or aramid
fibres, however recently natural fibres such as flax, hemp, and jute are
gaining increased importance in industrial applications due to their
competitive specific tensile properties (Anandjiwala R (2015)). Glass fibres
are low cost fibres which have good strength. They are typically only used
for aircraft components that do not have to carry heavy loads or operate
under large stresses, due to their relatively low tensile modulus, relatively
low fatigue resistance and sensitivity to abrasion during handling (Mallick
(2008)). Typical uses for glass fibres are for fuselage interior components
as well as for wing fairings and wing fixed trailing edge panels. Aramid fibres
have high toughness and energy absorbing capacity, tensile strength and
stiffness with low density; however, the low compressive properties, as a
result of fibre buckling at a low percentage of the tensile load, as well as
poor environmental performance, has limited the use of aramids for major
structural applications. When carbon fibres are combined with polymer
matrix materials to create carbon fibre reinforced polymer composites the
resulting composites are among the strongest and stiffest materials, which
has led to their increasing use for high performance structures. With proper
selection of carbon fibres and matrices, structures manufactured from
composites can achieve greater strength and stiffness than equivalent
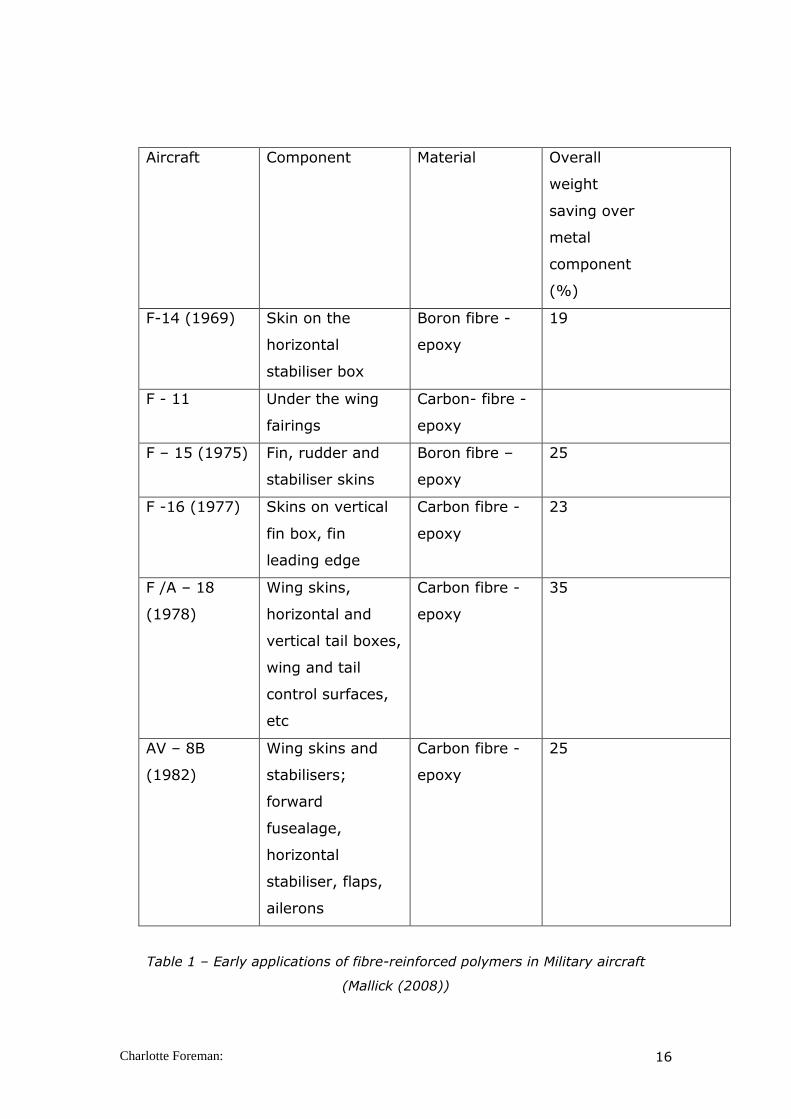
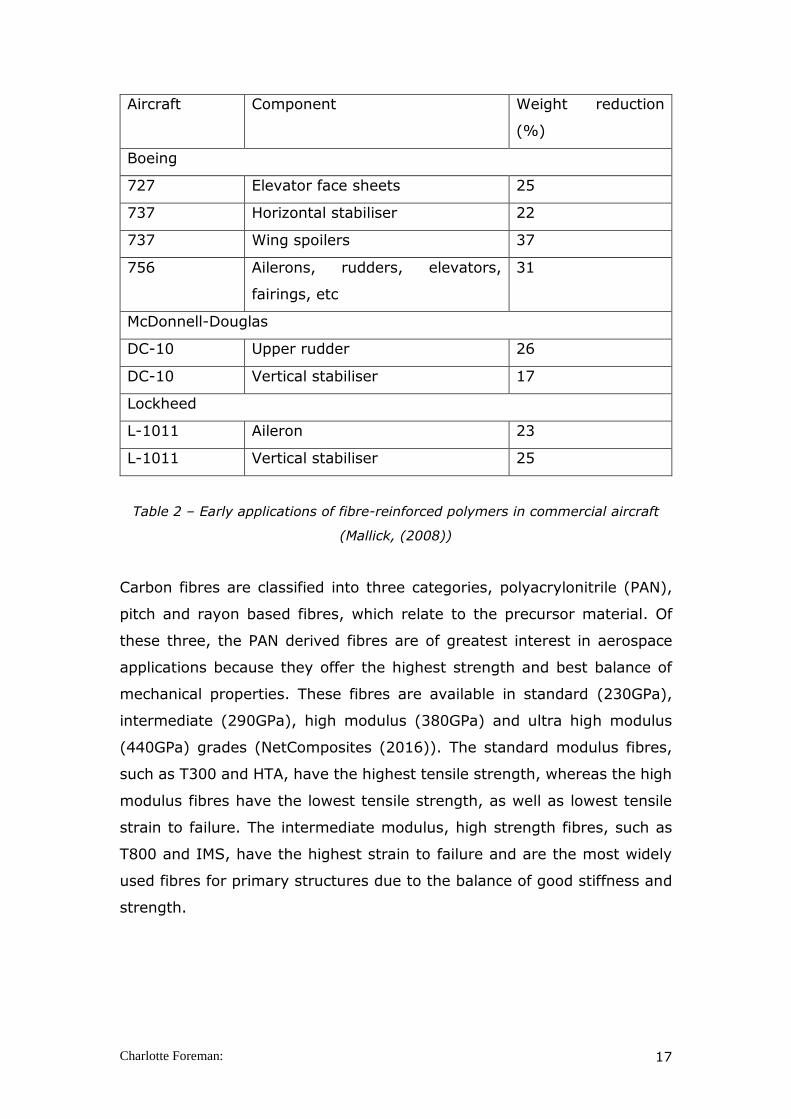
metallic parts. Analysis by Mallik (2008) revealed that, an overall weight
saving of approximately 40% was achieved in early application of
composites compared to metallic (Table 1 and Table 2).
Charlotte Foreman: 16
Aircraft Component Material Overall
weight
saving over
metal
component
(%)
F-14 (1969) Skin on the
horizontal
stabiliser box
Boron fibre -
epoxy
19
F - 11 Under the wing
fairings
Carbon- fibre -
epoxy
F – 15 (1975) Fin, rudder and
stabiliser skins
Boron fibre –
epoxy
25
F -16 (1977) Skins on vertical
fin box, fin
leading edge
Carbon fibre -
epoxy
23
F /A – 18
(1978)
Wing skins,
horizontal and
vertical tail boxes,
wing and tail
control surfaces,
etc
Carbon fibre -
epoxy
35
AV – 8B
(1982)
Wing skins and
stabilisers;
forward
fusealage,
horizontal
stabiliser, flaps,
ailerons
Carbon fibre -
epoxy
25
Table 1 – Early applications of fibre-reinforced polymers in Military aircraft
(Mallick (2008))
Charlotte Foreman: 17
Aircraft Component Weight reduction
(%)
Boeing
727 Elevator face sheets 25
737 Horizontal stabiliser 22
737 Wing spoilers 37
756 Ailerons, rudders, elevators,
fairings, etc
31
McDonnell-Douglas
DC-10 Upper rudder 26
DC-10 Vertical stabiliser 17
Lockheed
L-1011 Aileron 23
L-1011 Vertical stabiliser 25
Table 2 – Early applications of fibre-reinforced polymers in commercial aircraft
(Mallick, (2008))
Carbon fibres are classified into three categories, polyacrylonitrile (PAN),
pitch and rayon based fibres, which relate to the precursor material. Of
these three, the PAN derived fibres are of greatest interest in aerospace
applications because they offer the highest strength and best balance of
mechanical properties. These fibres are available in standard (230GPa),
intermediate (290GPa), high modulus (380GPa) and ultra high modulus
(440GPa) grades (NetComposites (2016)). The standard modulus fibres,
such as T300 and HTA, have the highest tensile strength, whereas the high
modulus fibres have the lowest tensile strength, as well as lowest tensile
strain to failure. The intermediate modulus, high strength fibres, such as
T800 and IMS, have the highest strain to failure and are the most widely
used fibres for primary structures due to the balance of good stiffness and
strength.
Charlotte Foreman: 18
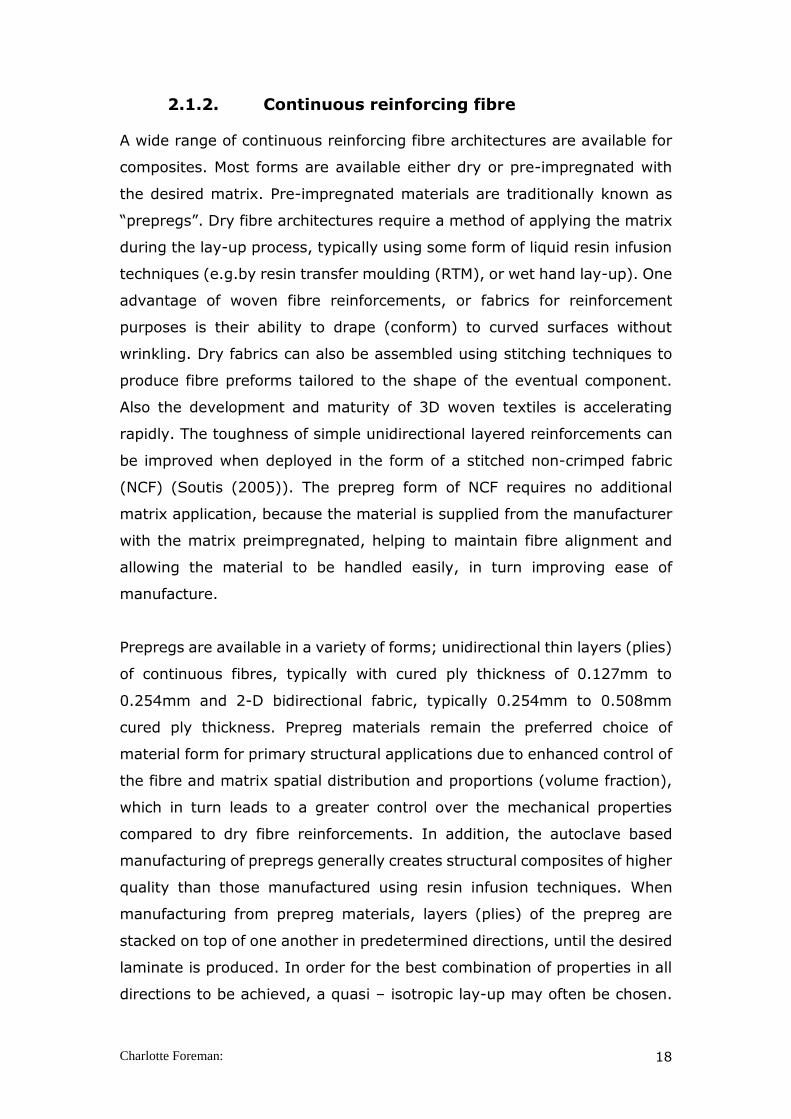
2.1.2. Continuous reinforcing fibre
A wide range of continuous reinforcing fibre architectures are available for
composites. Most forms are available either dry or pre-impregnated with
the desired matrix. Pre-impregnated materials are traditionally known as
“prepregs”. Dry fibre architectures require a method of applying the matrix
during the lay-up process, typically using some form of liquid resin infusion
techniques (e.g.by resin transfer moulding (RTM), or wet hand lay-up). One
advantage of woven fibre reinforcements, or fabrics for reinforcement
purposes is their ability to drape (conform) to curved surfaces without
wrinkling. Dry fabrics can also be assembled using stitching techniques to
produce fibre preforms tailored to the shape of the eventual component.
Also the development and maturity of 3D woven textiles is accelerating
rapidly. The toughness of simple unidirectional layered reinforcements can
be improved when deployed in the form of a stitched non-crimped fabric
(NCF) (Soutis (2005)). The prepreg form of NCF requires no additional
matrix application, because the material is supplied from the manufacturer
with the matrix preimpregnated, helping to maintain fibre alignment and
allowing the material to be handled easily, in turn improving ease of
manufacture.
Prepregs are available in a variety of forms; unidirectional thin layers (plies)
of continuous fibres, typically with cured ply thickness of 0.127mm to
0.254mm and 2-D bidirectional fabric, typically 0.254mm to 0.508mm
cured ply thickness. Prepreg materials remain the preferred choice of
material form for primary structural applications due to enhanced control of
the fibre and matrix spatial distribution and proportions (volume fraction),
which in turn leads to a greater control over the mechanical properties
compared to dry fibre reinforcements. In addition, the autoclave based
manufacturing of prepregs generally creates structural composites of higher
quality than those manufactured using resin infusion techniques. When
manufacturing from prepreg materials, layers (plies) of the prepreg are
stacked on top of one another in predetermined directions, until the desired
laminate is produced. In order for the best combination of properties in all
directions to be achieved, a quasi – isotropic lay-up may often be chosen.
Charlotte Foreman: 19
The typical convention for describing the stacking sequence of a quasi-
isotropic lay-up is as follows; [(+45, 0, -45, 90)4]s. In total within this lay-
up there would be eight off +45 plies, eight off 0 plies, eight off -45 plies
and eight off 90 plies. This lay-up is a balanced and symmetrical lay-up
with 90 degree fibres at the mid plane.
Prepregs require curing to create structurally useful materials, which
typically takes place in an autoclave at elevated temperature and pressure.
In order to reduce energy costs, out-of-autoclave prepregs are becoming
available, although currently their properties remain slightly lower than
those cured in an autoclave. Out of autoclave resin infusion manufacturing
techniques also offer lower cost production opportunities compared with
autoclaves, but similarly the mechanical properties of the materials tend to
be lower. Despite this many primary aerospace structural components are
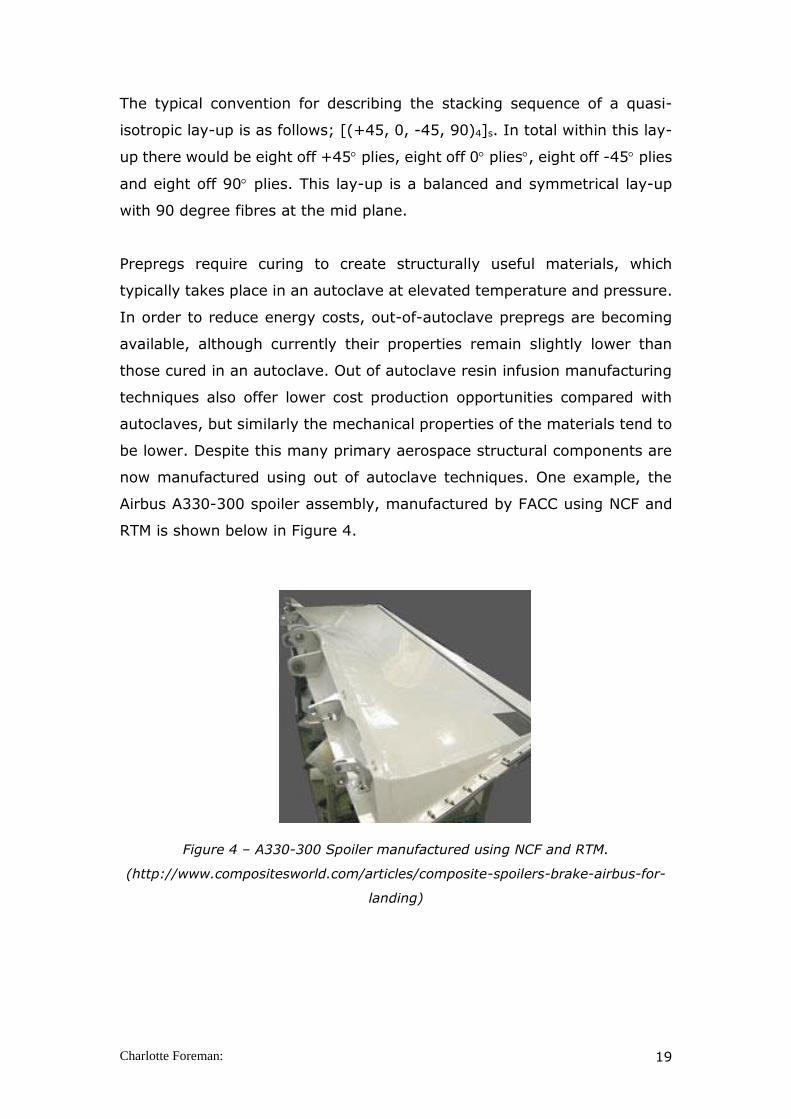
now manufactured using out of autoclave techniques. One example, the
Airbus A330-300 spoiler assembly, manufactured by FACC using NCF and
RTM is shown below in Figure 4.
Figure 4 – A330-300 Spoiler manufactured using NCF and RTM.
(http://www.compositesworld.com/articles/composite-spoilers-brake-airbus-for-
landing)

Charlotte Foreman: 20
2.1.3. Matrix
The matrix (typically a polymer resin) provides support and alignment of
the fibres, as well as acting as a load transfer medium into and out of the
composite. The matrix only plays a minor role in the tensile load carrying
capability of a structure, but has a major influence on the compressive
strength, due to it providing lateral support against fibre buckling. The
matrix also has an influence on the interlaminar shear strength; an
important factor for components under bending loads, as well as in-plane
shear properties (important for structures under torsional loads). The
matrix also provides a barrier to impact damage, corrosion, moisture and
elevated temperatures. The choice of fibre and matrix is extremely
important when designing a structural composite component because the
fibre, matrix and their interfaces dictate the final properties of the
component (Mallick (2008)).
Typically, there are two classes of polymer matricies when considering
aerospace structures; thermosetting and thermoplastic. Thermosetting
resins solidify by forming chemical covalent cross-links to form a tightly
bound three-dimensional network. In order to achieve optimum cross-
linking and hence mechanical properties, it is necessary to cure the
composite at one or more elevated temperatures for a pre-determined
length of time, often with the application of pressure. The conventional
epoxy aerospace resins are designed to cure at 120C – 135C or 180C, in
an autoclave at pressures up to 8 bar, occasionally with a post cure at
higher temperatures (Soutis (2005)). Thermoplastics are not cross-linked,
and instead of the strong covalent bonds seen in thermosets, have weaker
Van der Waals bonds. On application of heat, the chains within the
thermoplastic can flow past each other and the material changes from a
rigid solid to a viscous liquid. Upon cooling the thermoplastic solidifies, and
takes the desired shape (Matthews et al, (1995)).
The mechanical behaviour of thermoset composites and thermoplastic
composites is different. Thermoplastics tend to have high strain to failure,
good chemical resistance and generally good thermal stability, however,

Charlotte Foreman: 21
the properties of thermoplastics are heavily dependent on both the
temperature and strain rate of the test, and under constant applied load
they will creep. Although the toughness of epoxy systems has improved
since the first generation of composites were introduced to aircraft
components in the 1960’s, they are still not as damage tolerant as
thermoplastic materials (Soutis (2005)).
Overall, due to their balanced set of properties (strength, toughness, cost
and processability) thermosetting epoxy resins, are the most heavily
utilised class of matrices used in aerospace structural composite
applications.
2.1.4. Fibre / matrix interface
Improvements in fibre and matrix properties have been made over the
years, with resulting improvements in laminate properties, however, these
properties are heavily dependent upon the strength of the interface bond
between the fibre and the matrix. The load acting on the matrix has to be
transferred to the reinforcement via the interface, therefore the fibres must
be strongly bonded to the matrix if their high stiffness and strength are to
be imparted to the laminate (Soutis (2005)). The translaminar fracture
behaviour is also affected by the interface bond, with a strong bond
resulting in high stiffness and strength but often a low resistance to fracture
(brittle behaviour), whereas a weak bond results in low stiffness and
strength but a high resistance to fracture. It is therefore important to select
the material which meets the design requirement, e.g. high strength or high
fracture resistance (Soutis (2005)).
2.2. Damage
2.2.1. Definition
Damage is a very broad term, and this section of the report has been
divided into sub sections which all relate to damage in composite materials.
This includes the causes of damage such as impact and fatigue, through to
the damage mechanisms exhibited by composite materials.

Charlotte Foreman: 22
The majority of the work reviewed under this section has considered
continuous fibre reinforced composites, because of their growing use in civil
and military aerostructures, where the consequences of damage,
specifically from an impact, are likely to be severe.
Damage in composites can be classified as initial / inherent flaws and in-
service damage. Initial / inherent damage can be considered as damage
that occurs during manufacture, such as contaminants, voids, porosity, de-
bonding, fibre breakage, non-uniform fibre and matrix distribution, fibre
misalignment, foreign inclusions, ply gaps, embedded defects, poor wetting
of the fibres (leading to poor fibre-matrix bonding), or poor consolidation
of the composite laminate, leading to air pockets. Typical in-service damage
includes damage introduced during routine inspections, such as dropping of
tools, along with damage resulting from thermal effects, such as exposure
to temperature above the glass transition temperature (Tg), as well as
foreign object damage (FOD) such as bird strike or runway debris lofted by
aircraft tyres. Damage can also occur due to fluctuating loads, at levels
lower than the ultimate stress of the material.
The most common failure of composites in aerospace arises from the
damage resulting from an impact event, such as runway debris, bird strike,
hail or ice impact. The effect of likely initial and in-service damage, and its
effect on the residual performance of the component, must be considered
in a damage tolerant design.
2.2.2. Impact damage – a major challenge for
composites
Impact damage in aircraft composite structures can arise due to a variety
of events, as discussed above. The damage resulting from these
unexpected loads may remain undetected, in the form of barely visible
impact damage (BVID), which could severely reduce the structural integrity
of the structure. For this reason, current composite aerostructures must be
designed so that non-detectable damage (BVID) can exist in the structure
throughout its service life with no further growth.

Charlotte Foreman: 23
When discussing impact damage, there are two terms that are of
importance; impact damage tolerance, which defines the materials ability
to withstand existing damage, and impact resistance which is the ability of
the material to resist the formation of damage during impact.
The geometry of composite aerostructures is often typified by thin plate like
shapes, which are susceptible to out-of-plane loading and therefore, their
impact resistance is poor. To illustrate this Cantwell and Morton (1985)
showed that impact energies as low as 4J were sufficient to reduce the load
bearing capacity of a composite coupon by over 50%.
Impacts are generally classified as high velocity or low velocity although
there is some confusion as to what these terms actually mean. Sjoblom et
al (1988) and Shivakumar et al (1985), defined low-velocity impact as
events which can be treated as quasi-static, the upper limit of which can
vary from one to tens of meters per second depending upon the material
stiffness and other material properties, as well as the impactor’s mass and
stiffness and the boundary conditions. The researchers’ above defined high-
velocity impact response as being dominated by stress wave propagation
through the material, in which the structure does not have time to respond,
leading to very localised damage. In this instance boundary condition
effects are reduced because the impact event is over before the stress
waves have reached the edge of the structure.
Cantwell and Morton (1991) used a rather different approach to classify the
two impact classifications. In their work, impact techniques were used to
define the classifications, with low velocity impact being defined as those in
which instrumented falling weight impact testing, Charpy or Izod techniques
are used, with velocities being typically 10 m/s. However, Abrate (1991)
stated that low velocity impacts are in the order of 100 m/s and below.
A number of researchers’ (Joshi and Sun (1987) and Liu and Malvem
(1987)), have, as an alternative approach, used the damage mechanism
incurred in the composite laminate as a reference for the type of impact.

Charlotte Foreman: 24
They defined low velocity impact as that in which delamination and matrix
cracking is involved whereas high velocity impact has penetration induced
fibre fracture. This appears to be a rather unusual method of defining the
impact event because, for example, laminate thickness and toughness may
have a dominating effect on damage mechanism formation rather than
impact velocity. For this reason this approach will not be used within this
particular study.
2.2.3. Impact testing
Ideally the impact test should represent, as near as possible, the loading
conditions which a composite component is subjected to in service, and
hence the failure mechanisms should be representative.
Generally, when characterising a material in terms of its impact resistance
or impact damage tolerance for low velocity impact, a drop weight impact
test is carried out. This involves a tower with rails supporting a known
weight, which is dropped from a known height to impact the test specimen
supported in the horizontal plane. By knowing the acceleration due to
gravity, the engineer will know that the weight falling from the set height
will contain a certain amount of impact energy at the point of impact. The
material of interest is clamped / supported and the weight, attached to an
impactor tup (striker) will hit the specimen and rebound or completely
penetrate the specimen. The height of the rebound will be lower than the
original height and the engineer can use the rebound height to calculate the
energy that was absorbed during impact.
In more advanced testing, instrumented drop towers are used. In these
instances, a piezo-electric load cell is attached to the falling weight and a
data acquisition system interrogates the load cell over a given time interval
during the impact event. Integration methods are then used to calculate
specimen deflection and energy absorption from the measured force-time
data.
Charlotte Foreman: 25
2.3. The nature of impact damage
Many researchers have documented that damage initiation is shown on the
load-time history from the impact test as a sudden load drop, due to loss
of stiffness from unstable damage development. Following the drop in load,
damage growth will stop, the composite laminate will be reloaded, and a
cycle of damage propagation and arrest occurs until the impactor begins to
rebound and the laminate is unloaded (Lee and Zahuta (1991) and Zhang
(1998)).
Choi and Chang (1992) investigated the mechanisms of damage initiation
and development in a carbon fibre reinforced epoxy laminate subjected to
low velocity impact loading. They showed that there exists an impact
velocity threshold below which no delamination occurs but above which
significant damage is incurred. They also showed that matrix cracking
represents the initial failure mode in these composites, a failure mechanism
that subsequently triggers delamination at neighbouring interfaces.
Richardson and Wisheart (1996), and Abrate (1991, 1994 and 1998) both
carried out comprehensive reviews on the low velocity impact properties of
composite materials, summarising the work carried out by numerous
researchers, most being concerned with low velocity impact and both the
damage tolerance and damage resistance aspects of it. Richardson and
Wisheart (1996), stated that the heterogeneous and anisotropic nature of
fibre reinforced plastic (FRP) laminates gives rise to four major modes of
failure; matrix mode (cracking occurring parallel to the fibres due to
tension, compression or shear), delamination mode (produced by
interlaminar stresses), fibre failure mode (in tension, fibre breakage and in
compression, fibre buckling) and penetration (the impactor completely
penetrates the laminate). Liu and Malvem (1987) reported that in order to
understand damage initiation and propagation, it is not only the damage
mechanism that is of importance, but also the interactions between all the
failure modes. As can be seen, the majority of work reviewed dates from
the 1990’s; this is due to the fact that a lot of work was carried out during

Charlotte Foreman: 26
this period in order to gain a fundamental understanding of the formation
of impact damage. Having reviewed the current literature in this field, it
relates primarily to non-standard material types, such as a study by
Sarasini et al (2016) on low velocity impact damage of carbon/flax hybrid
composites, in which the natural flax fibres on the outside of a laminate
guaranteed a higher impact damage tolerance, acting as hindrance to crack
propagation in the laminate. A study by Selver et al (2015) investigated
impact damage of non-crimp laminates, finding they absorbed more energy
during low velocity impact compared to woven laminates, possibly due to
extensive tow-level delaminations. On the other hand, a much larger dent
depth was observed in the woven laminate after low energy impact. A
recent study (Vieille et al, 2013), showed that carbon fabric laminates with
different thermoplastic resins (PEEK and PPS) provided smaller delaminated
areas than laminates with epoxy resin after low velocity impact tests; this
result is due to tougher matrix system in thermoplastic composites. Olsson
(2000) stated that the impact response of plates is governed by the impact
/ plate mass ratio, where small mass impactors (impactors weighing ¼ of
the plate) result in a local response controlled by wave propagation with
small deflections, larger impact loads and significantly larger damage for a
given impact energy, whereas large mass impactors result in a quasi-static
response.
2.3.1. Matrix failure
Richardson and Wisheart (1996) stated that matrix damage is the first type
of failure induced by transverse low-velocity impact, and usually takes the
form of matrix cracking as well as de-bonding between fibre and matrix.
Matrix cracks are thought to occur due to property mismatching between
the fibre and matrix, and are usually oriented in planes parallel to the fibre
direction in unidirectional layers. A typical crack and delamination pattern
was shown by Joshi and Sun (1985), Figure 5.

Charlotte Foreman: 27
Figure 5 – Initial damage in a 0/90/0 composite plate (Joshi & Sun, 1985)
The matrix cracks in the upper layers (Figure 5a) and the middle layer
(Figure 5b) start under the edges of the impactor. The shear cracks are a
result of the very high transverse shear stress through the material, and
are inclined at approximately 45. The transverse shear stresses are related
to the contact force and contact area (Choi et al a & b, 1991). Richardson and
Wisheart (1996) and Lee and Sun (1993), stated that the crack on the
bottom layer of Figure 5a is termed a bending crack due to the fact that it
is caused by high tensile bending stresses and is characteristically vertical.
Cantwell and Morton (1989) in their report on geometrical effects
emphasised that the type of matrix cracking that occurs is dependent on
the global structure of the impacted specimens. They reported that for long
thin specimens, bending cracks in the lower layers occur due to excessive
transverse deflection and subsequent membrane effects predominate,
whereas short, thick specimens are stiffer and as a result higher peak
contact forces induce transverse shear cracks under the impactor in the
upper plies. An additional report by Cantwell and Morton (1990) stated that
for thicker laminates, fracture usually initiated at the upper surface of the
target, whereas initial failure in thinner laminates tended to occur in the
lowermost ply, directly under the point of impact.
The review by Richardson and Wisheart (1996), highlighted the efforts from
Chang, Choi and co-workersa&b (1991, 1990, 1992, 1987), who concluded
that the bending crack in the 90 degree layer is a result of stresses (11,13
and 33) for line loading impact damage. It was also concluded from their

Charlotte Foreman: 28
research that 33 is very small in comparison to 13 and 11 during the impact
event.
Sjoblem et al (1988) stated that the presence of matrix cracks do not
dramatically affect the overall laminate stiffness during an impact event,
whereas other forms of damage reduce the laminate stiffness as reported
later.
2.3.2. Delamination
A delamination, or interfacial crack, is a crack that initiates and grows
between the different plies of a composite material in the resin rich area.
Cui and Wisnom (1993), Wang (1979), Wu and Springer, (1988) and Abrate
(1991), all defined delaminations as a crack between plies of different fibre
orientation and not between laminae in the same ply group. Liu and Malvem
(1987), concluded that delamination was a result of the bending stiffness
mismatch between adjacent layers, i.e. the different fibre orientations
between the layers, a similar finding to Cui and Wisnom (1993), Wang
(1979) and Wu (1988). However Hosur et al (1998) do not agree with this
statement, along with others, (Preuss and Clark (1988), Kaczmerek (1995)
and Smith et al (1989)) who have all reported that significant damage
occurs between layers with the same fibre orientation. However, the
severity of the delaminations depends upon the difference in the ply angles
above and below the interface.
Delaminations can be classified into two types, interlayer and intralayer. An
interlayer delamination is a crack that grows in the interface of two plies,
without breaking the two plies, resulting in a crack following the same
direction (Figure 6).

Charlotte Foreman: 29
Figure 6 – Schematic showing interlayer and intralayer delaminations (Stratton
and Pelegri (1999))
An intralayer delamination is a crack that grows in the interface but
occasionally "jumps" to a neighbouring interface. As a result of the crack
migration, it could fracture one, or more, of the plies and it also changes
orientation (Figure 6).
In Liu and Malvem’s (1987) experimental work, it was discovered that
delamination areas were generally oblong shaped, with their major axis
being coincident with the fibre orientation of the layer below the interface.
For 0/90 laminates, the shape became peanut shaped. These characteristics
have been widely reported elsewhere (Joshi (1985), Wu (1988) and Chang
et al, (1990)). In fact, it has been stated by numerous researchers,
including Liu and Malvem (1987), that the stacking sequence 0/90 will
cause the most detrimental effect and have the largest delamination when
subjected to uniaxial loading only. This can be attributed to a greater
stiffness mismatch, which links to different stresses being produced
between the plies, leading to delaminations, compared to laminates with
say a 0/+45 layup. The thickness of the laminate has also been reported to
affect the delamination size (Finn et al, (1993)). Delamination is more likely
to occur when the span lengths are small and when the laminate is thick,
with low interlaminar shear, with Dorey (1986, 1987, 1988) deriving an
equation (Equation 2.3.2-1) for the elastic strain energy absorbed at the
point of delamination failure.
Charlotte Foreman: 30
Equation 2.3.2-1
where t = thickness, = interlaminar shear strength (ILSS), w = width, L
= unsupported length and Ef = flexural modulus.
Chang et al (1990), concluded that delamination was initiated as a mode I
process, due to very high out-of-plane normal stresses caused by the
presence of matrix cracks, and high interlaminar shear stresses along the
interface. Liu S et al (1993), from a fracture mechanics based analytical
model, showed that both bending cracks and shear cracks could initiate
delamination, but that delamination induced by shear cracks is unstable and
that bending crack induced delaminations grow in a stable manner,
proportional to the applied load. Choi and Chang (1992) reported that
delamination growth was governed by interlaminar longitudinal shear stress
(13) and transverse in-plane stress (22) in the layer below the delaminated
interface and by interlaminar transverse shear stress (23) in the layer
above the interface. Razi and Kobayshi (1993), carried out a numerical
simulation of impact induced delamination growth, concluding that mode II
was the dominant failure mode for propagation.
An interesting paper by Wagih et al (2016) outlined the complex nature of
delamination within composites after a quasi static impact event. The paper
focussed on non-crimp fabric, thin-ply laminates (TP) and ultra thin ply
(UTP) laminates, as these are reported to have benefits in terms of reducing
intra-laminar, inter-laminar and splitting damage (Wagih et al (2016)). The
authors combined microscope photographs and C-Scan results with the load
displacement curves from a drop weight impact test and concluded that the
complex mechanisms of the penetration process could be summarised in
five stages. Stage I corresponded to the elastic response of the material,
stage II, damage initiation where for the damage initiation was found to be
dependent upon the thickness of the ply, thinner plies (UTP) showing
delaminations as the first damage whereas slightly thicker plies (TP)
showing matrix cracking. Delamination propagation was linked to stage III
and stage IV showed fibre breakage with a large drop in the load-
tE
wLEnergy
f9
2 32

Charlotte Foreman: 31
displacement curves. Stage V was where fibres sheared out for TP laminates
whereas for the UTP laminates, the fibres failed under tensile and
compressive stresses. The damage onset was seen to occur earlier for the
TP laminates compared to UTP, however fibre breakage occurred earlier in
the UTP laminates. It was shown from this study (Waghir et al (2016)), that
UTP laminates show better damage resistance than TP laminates however
the maximum load capacity is larger for TP laminates.
An FEA study by Craven et al (2010) successfully modelled multiple
delaminations (one at each ply interface) with realistic delamination shapes
(peanut shaped as opposed to elliptical or circular) to determine the effect
of delamination size and shape on buckling load. The boundary conditions
applied to the model simulated compression after impact conditions with
global buckling of the plate being prevented and only local buckling of the
damage region allowed. The plots for the impact damaged regions showed
linear behaviour up to buckling and then non-linear behaviour after buckling
occurred. The authors Craven et al (2010) concluded that the peanut
shaped delaminations buckle at a much lower strain and have a much lower
stiffness compared to elliptical models. At 1% applied compressive strain
the peanut shaped delamination showed a 65% stiffness reduction
compared with the undamaged material. The effect of delamination size
was also investigated in the study (Craven et al (2010)), concluding that
the buckling of the damage region starts at increasing levels of strain the
small the diameter of damage and the larger the delamination, the lower
the residual stiffness compared with the undamaged material. This is
thought to be due to the onset of global buckling buckling of the impact
damage region occurring at lower strains for larger delaminations.
2.3.3. Fibre Failure
Fibre failure occurs later in the fracture process than matrix cracking and
delamination. Fracture of the fibres typically only occurs with high energy
impact, and when this fracture mode is present, it occurs directly under the
impactor due to local stresses and indentation effects governed by shear
Charlotte Foreman: 32
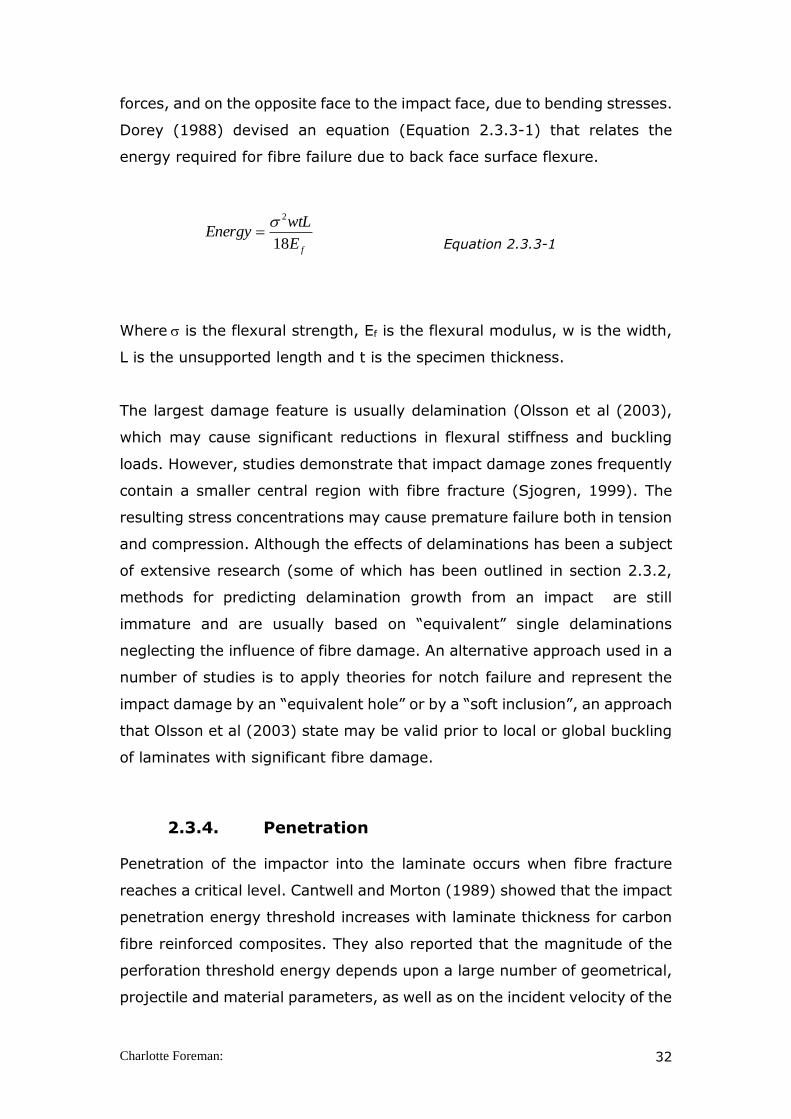
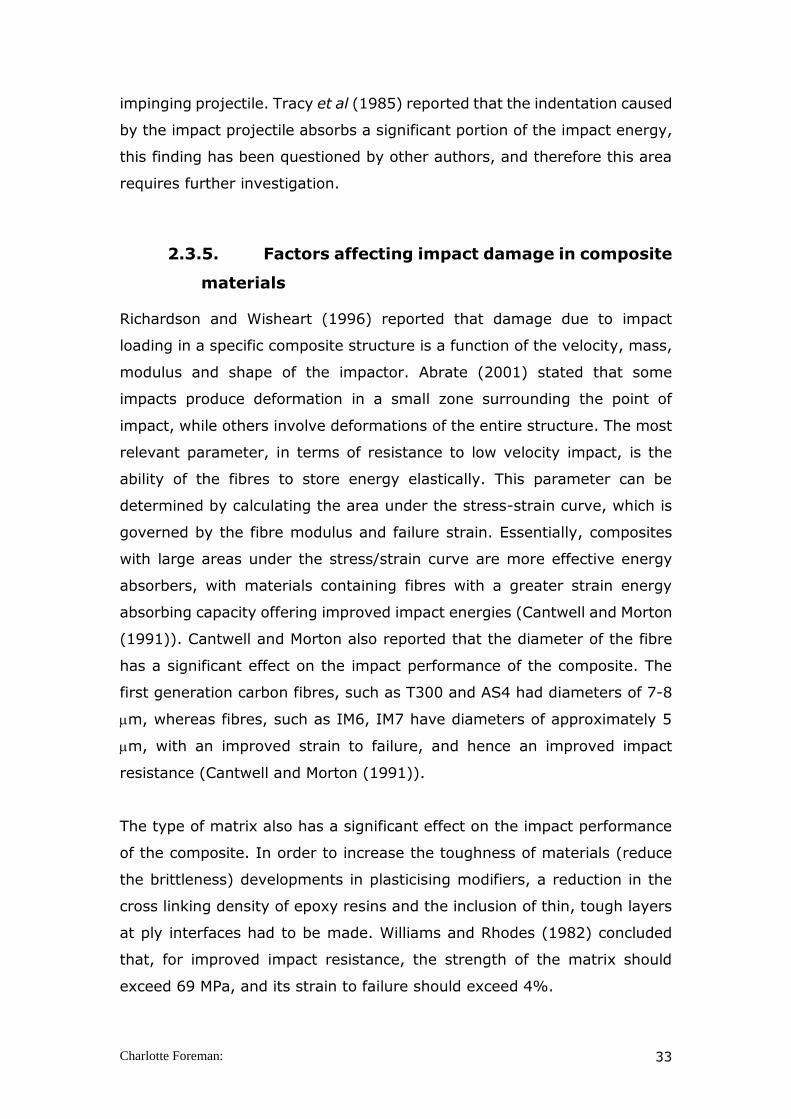
forces, and on the opposite face to the impact face, due to bending stresses.
Dorey (1988) devised an equation (Equation 2.3.3-1) that relates the
energy required for fibre failure due to back face surface flexure.
Equation 2.3.3-1
Where is the flexural strength, Ef is the flexural modulus, w is the width,
L is the unsupported length and t is the specimen thickness.
The largest damage feature is usually delamination (Olsson et al (2003),
which may cause significant reductions in flexural stiffness and buckling
loads. However, studies demonstrate that impact damage zones frequently
contain a smaller central region with fibre fracture (Sjogren, 1999). The
resulting stress concentrations may cause premature failure both in tension
and compression. Although the effects of delaminations has been a subject
of extensive research (some of which has been outlined in section 2.3.2,
methods for predicting delamination growth from an impact are still
immature and are usually based on “equivalent” single delaminations
neglecting the influence of fibre damage. An alternative approach used in a
number of studies is to apply theories for notch failure and represent the
impact damage by an “equivalent hole” or by a “soft inclusion”, an approach
that Olsson et al (2003) state may be valid prior to local or global buckling
of laminates with significant fibre damage.
2.3.4. Penetration
Penetration of the impactor into the laminate occurs when fibre fracture
reaches a critical level. Cantwell and Morton (1989) showed that the impact
penetration energy threshold increases with laminate thickness for carbon
fibre reinforced composites. They also reported that the magnitude of the
perforation threshold energy depends upon a large number of geometrical,
projectile and material parameters, as well as on the incident velocity of the
fE
wtLEnergy
18
2
Charlotte Foreman: 33
impinging projectile. Tracy et al (1985) reported that the indentation caused
by the impact projectile absorbs a significant portion of the impact energy,
this finding has been questioned by other authors, and therefore this area
requires further investigation.
2.3.5. Factors affecting impact damage in composite
materials
Richardson and Wisheart (1996) reported that damage due to impact
loading in a specific composite structure is a function of the velocity, mass,
modulus and shape of the impactor. Abrate (2001) stated that some
impacts produce deformation in a small zone surrounding the point of
impact, while others involve deformations of the entire structure. The most
relevant parameter, in terms of resistance to low velocity impact, is the
ability of the fibres to store energy elastically. This parameter can be
determined by calculating the area under the stress-strain curve, which is
governed by the fibre modulus and failure strain. Essentially, composites
with large areas under the stress/strain curve are more effective energy
absorbers, with materials containing fibres with a greater strain energy
absorbing capacity offering improved impact energies (Cantwell and Morton
(1991)). Cantwell and Morton also reported that the diameter of the fibre
has a significant effect on the impact performance of the composite. The
first generation carbon fibres, such as T300 and AS4 had diameters of 7-8
m, whereas fibres, such as IM6, IM7 have diameters of approximately 5
m, with an improved strain to failure, and hence an improved impact
resistance (Cantwell and Morton (1991)).
The type of matrix also has a significant effect on the impact performance
of the composite. In order to increase the toughness of materials (reduce
the brittleness) developments in plasticising modifiers, a reduction in the
cross linking density of epoxy resins and the inclusion of thin, tough layers
at ply interfaces had to be made. Williams and Rhodes (1982) concluded
that, for improved impact resistance, the strength of the matrix should
exceed 69 MPa, and its strain to failure should exceed 4%.
Charlotte Foreman: 34
The interphase region of composite materials also plays an important role
in the damage mechanisms of composite materials. In general, improving
the adhesion between the fibre and the matrix increases the incident impact
energy required to initiate damage fourfold (Rogers et al (1971)). Bishop
and Curtisa & b (1983) drew attention to the possible improvement in impact
tolerance of carbon fibre laminates, through the selective incorporation of
woven fabric. Woven fabric was used to replace two opposing 45 plies,
which normally provide sites for extensive delamination. This finding was
also confirmed by Cantwell et al (1984).
2.3.6. Effect of geometry on impact damage
The majority of research that has been reviewed has been carried out on
flat laminates, being either clamped or simply supported. By simplifying the
geometry, structural effects are minimised and as a result more information
on the material behaviour can be attained. However, in service, the
structures that are likely to be subjected to an impact event will very rarely
be a simple flat plate, and often will have structural additions such as
stiffeners. Dorey (1986) investigated the impact response of stiffened
panels, and reported that the energy to cause BVID dropped significantly
near the stiffeners, where the structure was less compliant, and the
stiffeners caused the damage to spread asymmetrically. Davies et al (1994)
stated that impact forces will be higher in the stiffened regions, but that
reduced deflections may lead to smaller strain and hence less strain induced
failure. They also showed that at the edge of the stiffeners, delaminations
were formed, whilst impacts directly over the stiffener caused debonding
between plate and stiffener.
Stout et al (1999) reported that damage observed from an impact of an
unsupported plate is very different from that observed in clamped plates.
Within the unsupported structure, the damage was said to be a result of
the elastic compressive and tensile waves generated by the impact event,
rather than a structural bending.
Charlotte Foreman: 35
2.4. Detection of damage in composites
2.4.1. Introduction
In order to gain a better understanding of damage mechanisms in novel
coupons and structures, it is necessary to determine the extent of the
damage that exists in the composite, and any subsequent growth of the
pre-existing damage upon fatigue loading. The technology available for
monitoring damage in composites has increased over the years, and this
section of the review summarises the main methods.
The main types of non-destructive testing include tap testing, mechanical
impedance, thermography, fibre bragg grating, laser shearography, x-ray
radiography and IR thermography (Livingstone and Kilpatrick (1987),
Henneke (1990), Bar-Cohen (1991), Burke et al (1994) Yang and He (2-
16)).
2.4.2. Acoustic Impact
This is a simple technique which has been used for many years. Typically
the technique is known as "coin tapping", the traditional method of testing
aircraft flying surfaces. The vibrations are excited by use of a local impact
(e.g. "tapping" with a hammer). The hammer is tapped onto the surface of
the component by the tester, who then listens to the 'ringing' sounds
generated. Any anomalies in the sound produced, due to the differences in
the characteristic ringing sound are then recorded. When using an
instrumented hammer to measure the force-time response, the results are
more reliable, rather than relying on a subjective assessment of the audible
noise. In the last few years, there have been rapid developments in this
method, with automated computer based systems being used for the
production-line testing of a variety of components.
Different defect types will cause different changes to the response of the
structure. Instrumented acoustic impact systems have the potential to
detect and characterise a variety of defects including; disbonds between
the facesheet and honeycomb core, crushed core due to impact or overload,
voids, inclusions and delaminations in composite repairs, core splice and

Charlotte Foreman: 36
thickness change, potting, ply drop-off, doublers, ribs, spars location and
composite repairs on fan cowling, flaps. The main application of this and
other tap testing methods is in detection of disbonds and delaminations
(Net Composites (2007)).
An interesting study by Bemment et al (2015), involved using acoustic
emission sensors in order to reliably detect, locate and/or quantify the
energy of impacts on a BAE systems HERTI UAV. It was found that using
three sensors along the wingspan was enough to detect very low energy
impacts (~0.5J), attribute them to a particular impact zone and indicate an
estimate of the energy.
2.4.3. Laser Shearography
This technique is a non-contact technique that presents a visual qualitative
map of the strain field of the surface of the structure in response to an
applied stress. Subsurface features such as core splices, bulkheads and
defective areas affect and distort the surface strain field and are therefore
monitored. It is said that this technique is particularly well suited to
detection of impact damage in CFRP components giving a unique defect
signature and can even detect kissing bonds, which the majority of the
other techniques can’t detect. Most shearographic images of CFRP defects
appear and then stay uniform in size with respect to a constant stress
(vacuum) or will reduce in size as the thermal loading effect dissipates in
the material. With impact damage, the time taken for the thermal energy
to penetrate, corresponds with the 'Xmas Tree' effect with the effect that
defect images appear to enlarge with time (Net Composites (2007)).
2.4.4. Ultrasonic C-scan
In this technique components are placed in a bath of water and a combined
emitter and receiver, piezoelectric transducer, also submerged in the bath,
scans over the surface of the component. Ultrasonic pulses are
retransmitted through the component and detected by the scanning head.
The strength of the reflected ultrasonic pulse is then evaluated. If an
ultrasonic pulse is completely reflected at an air gap, it cannot be

Charlotte Foreman: 37
transmitted below it. Therefore, delaminations within laminates prevent the
use of ultrasonic transmission due to air gaps (Saito and Kimpara (2006)).
There are two kinds of data processing in pulse echo C-scanning, echo
amplitude (AMP) view and Time of Flight (TOF) view. The TOF view can be
converted into a delamination depth view through the transverse sound
velocity in CFRP. The TOF files together with image processing software
allow the determination of the delaminated area (Net Composites (2007)).
Williams and Doll (1978) and Shoup et al (1982) were unable to detect
fatigue damage in thin CFRP composites with through-transmission
ultrasonics. However, Williams et al (1982), Bader and Boniface (1983),
Kellas et al (1985), Nayeb-Hashemi et al (1986) and Scarponi and Briotti
(1997) were all able, under certain fatigue conditions, to successfully detect
the initiation and spread of fatigue cracks in CFRP’s with through-
transmission ultrasonics. It was reported that small delamination cracks
induced by fatigue loading could be detected, but only when the cracks grew
in the direction transverse to the transmission path of the ultrasound
waves. Other types of damage, such as fibre splitting (Kellas et al, 1985) or
cracks parallel to the transmission path of the ultrasonic waves (Bader and
Boniface, 1983, Cantwell and Morton (1985)) were harder to detect, this is
thought to be because they do not offer a wide enough reflecting surface
compared to delaminations. A number of researchers (Moran et al (1985),
Wooh and Daniel (1990), Gorman (1991) and Steiner et al (1995), have
shown that transverse cracks running parallel to the fibre direction can be
detected, by orienting the transducer at an angle to the tested surface, so
as to acquire the energy back scattered from damage. Kasap et al (1992)
and Forsyth et al (1994) detected the debonding of fibres from the resin
matrix as well as resin cracks by ultrasonics.
In a study by Hosur et al (1998) it was reported that due to the inherent
inhomogeneous and orthotropic nature of composites, ultrasonic waves
suffer high acoustic attenuation and scattering effect, therefore making
data interpretation difficult. They did however suggest that these difficulties
can be overcome by the proper selection of probe, probe parameter settings

Charlotte Foreman: 38
like pulse width, pulse amplitude, pulse repetition rate, delay, blanking and
gain and data processing including image processing. Within their study,
they also reported that due to the inherent nature of delamination damage
occurring at various interfaces throughout the thickness of the laminate,
the normal practice of just determining the projected area is not sufficient,
therefore a layerwise scanning technique, by locating the depth gate using
time delay to determine the damage at each interface was adopted. A
similar approach was also used by Moran et al (1988), whereby layer by
layer images of delamination in an impacted composite panel were mapped,
by utilising multiple gating, covering each interface, thereby collecting the
information of all the interfaces in one scan.
2.4.5. Thermography
This is a technique based upon the analysis of thermal patterns, induced
either by heating the specimen or by applying a mechanical oscillatory load.
This technique is sensitive to delamination-type defects. The thermography
NDE technique was used by Mitrevesi et al (2005) in order to determine the
overall internal damage area and shape in impacted specimens. They
reported that for specimens that contained permanent indentation, the
thermo-scans were clear in depicting the damage area, however for BVID
the results were not as clear. They did also state that although the
technique is useful in determining the overall damage area induced by
impacts, the technique cannot determine the various internal damage
mechanisms present within the specimen. This technique is also unable to
give information on the through thickness location of the flaw.
2.4.5.1. Selectively Heating Thermography
A study by Yang and He (2016) has shown that Infrared (IR) Thermography
including pulsed thermography, lock in thermography and pulsed phase
thermography shows great potential and advantages due to high inspection
speeds, high resolution and sensitivity and detectability of inner defects due
to heat conduction. Unlike ultrasonics, this method does not require a
couplant and is a non-contact method. The principal of selective heating
thermography involves inductive selective heating whereby an excitation
signal is generated by the excitation module. A small period of high

Charlotte Foreman: 39
frequency alternating current is driven to the inductive coil along the CFRP.
The current induces eddy currents in the CFRP and heat is generated in the
carbon fibres. The heat diffuses to surrounding non-conductive polymer
matrix, and a time delay is seen until the heat is balanced in the CFRP. At
the same time as induction heating, the temperature distribution on the
surface of the CFRP is captured by IR camera (Yang and He, 2016).
2.4.6. X-radiography
This process involves the use of an X-ray opaque fluid to infiltrate the
damaged area. Fracture is usually only detected when reasonably large and
providing that some surface flaw is present to allow the infiltration of the
enhancer. This technique is most suited to the detection of matrix cracks,
where cracks frequently extend for 10mm or more. Detecting fibre fracture
presents greater difficulty, since at low and intermediate impact energies
this damage extends only a few millimetres and is frequently shielded by
planes of delamination above and below the damage. The extent of
delamination detection is poorer in X-radiography compared to the c-
scanning technique, due to the difficulty in ensuring the complete
penetration of the enhancing fluid and also diffraction of the x-rays
(Cantwell and Morton (1985)). The technique can only detect damage at
the surface, internal defects, impossible to fill with the dye, may remain
undetected. When exact through the thickness positions of the defect is
required, stereoscopic X-radiography techniques can be used. Two X-ray
images are obtained from two different angles and then optically
recombined to reconstruct a three dimensional view of the damage state.
The interpretation of this technique is difficult, due to the difficulty in
precisely locating the different delaminated and cracked layers (Aymerich
and Meili (2000)).
2.4.6.1. X-ray microtomography (micro-CT)
A study by Symons (2000) outlines the x-ray microtomography method.
This method is a non-destructive testing technique that allows 3-

Charlotte Foreman: 40
dimensional imaging of the internal structure of a specimen. Symons (2000)
states that it is a useful technique for investigating impact-damaged CFRP
because it reveals the distribution of delaminations and matrix cracks
without the need for physical sectioning and can provide clearer images of
the distribution of damage than optical microscopy.
The method is basically a small scale form of CT scanning, used to create
2D and 3D X-ray attenuation maps of specimens up to a few centimetres in
size, with a resolution typically of the order of tens of microns. For the X-
ray energies used in CT, the dominant attenuation mechanism is Compton
scattering, which is proportional to material density. Therefore, it is a
reasonable approximation to use CT images as a density map of the object.
The study by Symons (2000) concluded that a combination of ultrasonic C-
scan and optical microscopy is a more ̄flexible approach for rapid
assessment. A more recent study by Penumadu et al (2016) has concluded
that the ability to provide high and low resolution imaging non-invasively
using x- ray tomography at multiple fields of view will be very useful for
damage visualisation and quantification. Using selective ranges of
attenuation, different damage features can be isolated in three dimensions.
A study by Schilling et al (2005) reported the benefit of using
microtomography for fibre reinforced polymer composites. This method was
reported to be able to characterise the internal geometry of flaws, including
delamination, matrix cracking, and microcracking, in fibre-reinforced
polymer laminates.
2.5. Fatigue
2.5.1. Introduction
The term fatigue, when relating to materials science, is used to describe the
situation whereby under cyclic loading conditions, the load bearing capacity
of the material falls with time, resulting in failures at stress levels below
ordinary engineering static strength. The susceptibility or resistance of a
given material to this cyclic loading is typically discussed in terms of the
Charlotte Foreman: 41
number of cycles to failure, i.e., the life, N, of the material under a given
cyclic stress amplitude, S, and is generally represented on an S-N curve.
Fatigue occurs generally in all engineering materials and there are common
fatigue characteristics of all materials. The process of fatigue failures begins
with microscopic cracks (often referred to as the initiation site), which, with
each subsequent cycle, grow. This is a phenomenon that can be analysed
by fracture mechanics, whereby the cracks grow under the influence of the
fluctuating loads, until the cracks reach a critical length, exceeding the
fracture toughness and hence failure occurs. The number of cycles required
for failure can vary by, typically, a factor of ten, for nominally identical
samples, due to an inherent statistical variability in fatigue lifetimes.
However, in general, the greater the applied stress, the shorter the life. It
is thought that unlike aluminium, composites exhibit an endurance limit or
fatigue limit, a limit below which repeated stress does not induce failure,
theoretically, for an infinite number of cycles of load.
Within metallic structures the stage of gradual and invisible degradation
spans almost the lifetime and no significant reduction in stiffness is
observed during the fatigue life. Although fibre-reinforced composites have
a rather good rating in terms of fatigue life, the same cannot be said for the
number of cycles to initiate damage or for the evolution of damage
(Cavatorta et al (2006)). In composites, the damage growth often starts
early on in the lifetime, typically during the first 10-20% of the life of the
component.
2.5.2. Fatigue testing
There are various approaches for assessing composites in fatigue. Typically,
S-N curves are developed (stress versus number of cycles to failure), if the
number of cycles to failure at a specific stress amplitude is the parameter
of interest. Interrupted fatigue testing is an alternative test regime in which
a specimen (coupon or structure) is subjected to a predetermined number
of cycles at a specified stress level and the damage within the specimen
monitored through the use of non-destructive testing (NDT). Alternatively,
a specimen could be subjected to a set number of fatigue cycles and then
Charlotte Foreman: 42
a residual strength test carried out, to determine any degradation in the
mechanical properties of the composite.
2.5.3. Damage in components under fatigue loading
The damage mechanisms during fatigue loading in multidirectional fibre
reinforced polymer matrix composites are: matrix cracking, delamination
between the plies and, finally, fibre fracture with associated fibre/matrix
debonding. The first and most prolific form of damage observed is matrix
cracking, which initiate and grow through the polymer matrix, transverse
to the fibre direction in the longitudinal and off axis plies (Attia et al (2001)).
Due to the mismatch between poisson’s ratios of adjacent plies, matrix
cracking parallel to the fibres occurs in the 0 plies throughout the fatigue
cyclic regime (Bailey et al (1979)). The primary factors which affect the
fatigue damage mechanisms of composite materials are the type of matrix
and fibre and the stacking sequence of the laminate, as these affect the
strength and the stiffness. The mode of loading and the frequency of
loading, along with environmental factors also influence the damage
mechanisms and fatigue properties.
Numerous researchers (Reifsnider (1991), El Mahi et al (1995), Ogin et al
(1985), Nairn and Hu (1992) and Tong et al (1997)) have stated that the
importance of matrix cracking is that it is a principal source of stiffness
reduction in composites, with it being the precursor of other damage
mechanisms, such as delamination and fibre fracture. Degrieck and
Paepegem (2001) agreed with this finding, stating that the damage
developed early on in the fatigue life grows steadily, whilst the damage
mechanism in the damage area may change. Within the damage areas, a
loss of stiffness, accompanied by a gradual deterioration of the material,
leading to a continuous redistribution of stress and a reduction of stress
concentrations inside a structural component is reported to occur (Degrieck
and Paepegem (2001)). Symons and Davis (2000) also reported that the
progress of impact damage during fatigue loading involved both a gradual
and larger discrete failure process. The gradual process involved a slow
decrease in the stiffness of the impact damaged region and therefore a

Charlotte Foreman: 43
reduction in the overall stiffness of the panel. The extent of the degradation
in stiffness is dependent on a number of factors such as fibre and matrix
type as well as the stacking sequence of the laminate.
It was observed by Symons and Davis (2000) that the back face blister
created by the initial impact increased in size during the fatigue process.
The large discrete events in the fatigue process were reported to include
the growth of front face tensile cracks early on in the fatigue life, and
delamination buckling of strips of surface ply around the damage zone.
Delamination usually initiates between plies of different orientations and
grows perpendicular to the loading. Delamination occurs due to out of plane
interlaminar shear as well as normal stresses which exist at free edges
(Pagano and Byron (1971)). A study by Clarke (1989), reports that
delaminations often occur in stacks with repeat intervals of four plies, when
there is a four ply repeat in the laminate, indicating that the lay-up exerts
a significant influence on damage distribution.
In most of the fatigue tests conducted by Symons and Davis (2000), rapid
progression of the damage indicated that complete failure was imminent
and was a result of fibre fracture. Debonding of the broken fibres, causes a
load redistribution, leading to an increase in the probability of fracture in
neighbouring fibres. Once a critical number of fibres have broken, fracture
will occur. Jamison (1985) reported that a higher concentration of fibre
breaks is observed at the intersection of transverse ply cracks with the
longitudinal ply. Due to the fact that progression of damage indicates that
failure is imminent, the initial onset of the growth of the impact damage
under cyclic loading is of most interest, as opposed to predicting the steady,
progressive growth of the damage with regards to fatigue damage
prediction.
Although many researchers have concluded that there is a reduction in
stiffness due to the fatigue failure process, the same cannot be said for the
strength. The strength of some composite materials (e.g. glass fibre
reinforced plastics (GFRP) and Aramid) is said to fall with number of cycles,
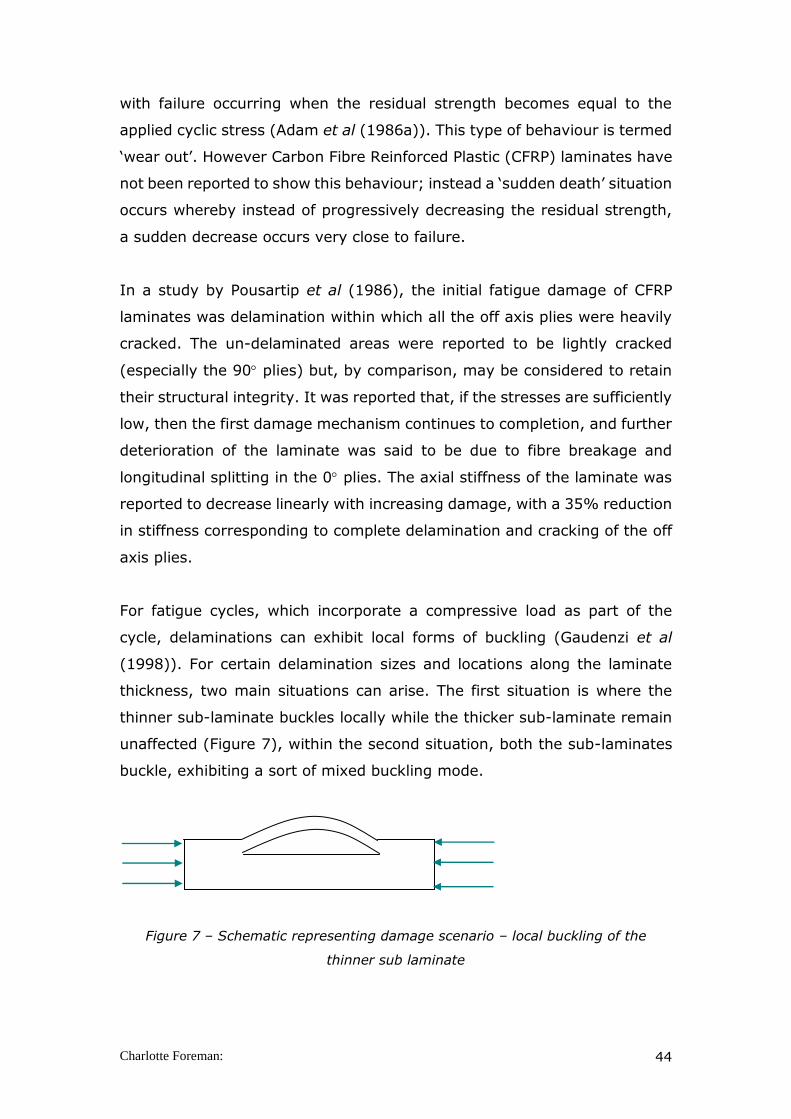
Charlotte Foreman: 44
with failure occurring when the residual strength becomes equal to the
applied cyclic stress (Adam et al (1986a)). This type of behaviour is termed
‘wear out’. However Carbon Fibre Reinforced Plastic (CFRP) laminates have
not been reported to show this behaviour; instead a ‘sudden death’ situation
occurs whereby instead of progressively decreasing the residual strength,
a sudden decrease occurs very close to failure.
In a study by Pousartip et al (1986), the initial fatigue damage of CFRP
laminates was delamination within which all the off axis plies were heavily
cracked. The un-delaminated areas were reported to be lightly cracked
(especially the 90 plies) but, by comparison, may be considered to retain
their structural integrity. It was reported that, if the stresses are sufficiently
low, then the first damage mechanism continues to completion, and further
deterioration of the laminate was said to be due to fibre breakage and
longitudinal splitting in the 0 plies. The axial stiffness of the laminate was
reported to decrease linearly with increasing damage, with a 35% reduction
in stiffness corresponding to complete delamination and cracking of the off
axis plies.
For fatigue cycles, which incorporate a compressive load as part of the
cycle, delaminations can exhibit local forms of buckling (Gaudenzi et al
(1998)). For certain delamination sizes and locations along the laminate
thickness, two main situations can arise. The first situation is where the
thinner sub-laminate buckles locally while the thicker sub-laminate remain
unaffected (Figure 7), within the second situation, both the sub-laminates
buckle, exhibiting a sort of mixed buckling mode.
Figure 7 – Schematic representing damage scenario – local buckling of the
thinner sub laminate

Charlotte Foreman: 45
Such a mode can often be seen as a local mode with respect to the rest of
the surrounding structure; however, it involves the whole delaminated area
(Figure 8).
Figure 8 – Schematic representing global buckling of the delaminated area
The buckling of the thinner sub-laminate occurs first during the loading
process, while the buckling in the thicker sub-laminate is dictated by the
geometrical arrangements of the structure, such as delamination size and
depth (Ricco and Gigliotti (2006)).
A more recent paper by Alderliesten (2015), outlined the improvement in
damage tolerance of hybrid composite materials, in particular fibre metal
laminate (FML) in relation to fatigue damage propagation, stating also their
excellent resistance to impacts.
2.5.4. Delamination growth under fatigue loading
Delamination growth rate can be assumed to have three domains, sub-
critical (slow), linear, and unstable growth. The growth rate depends on
microscopic details of fibre architecture and resin properties in domain 1,
on crack driving force (energy release rate) in domain 2, and on
interlaminar fracture characteristics of the laminate in the unstable domain
3. Considerable research has been conducted on the delamination growth
laws in domain 2, whereas very few studies have tried to model all three
domains of delamination growth rate.
In typical aerospace applications, many structural components are curved,
with tapered thickness containing plies with different orientations, which
make delaminations grow with a mode mix that depends on the extent of
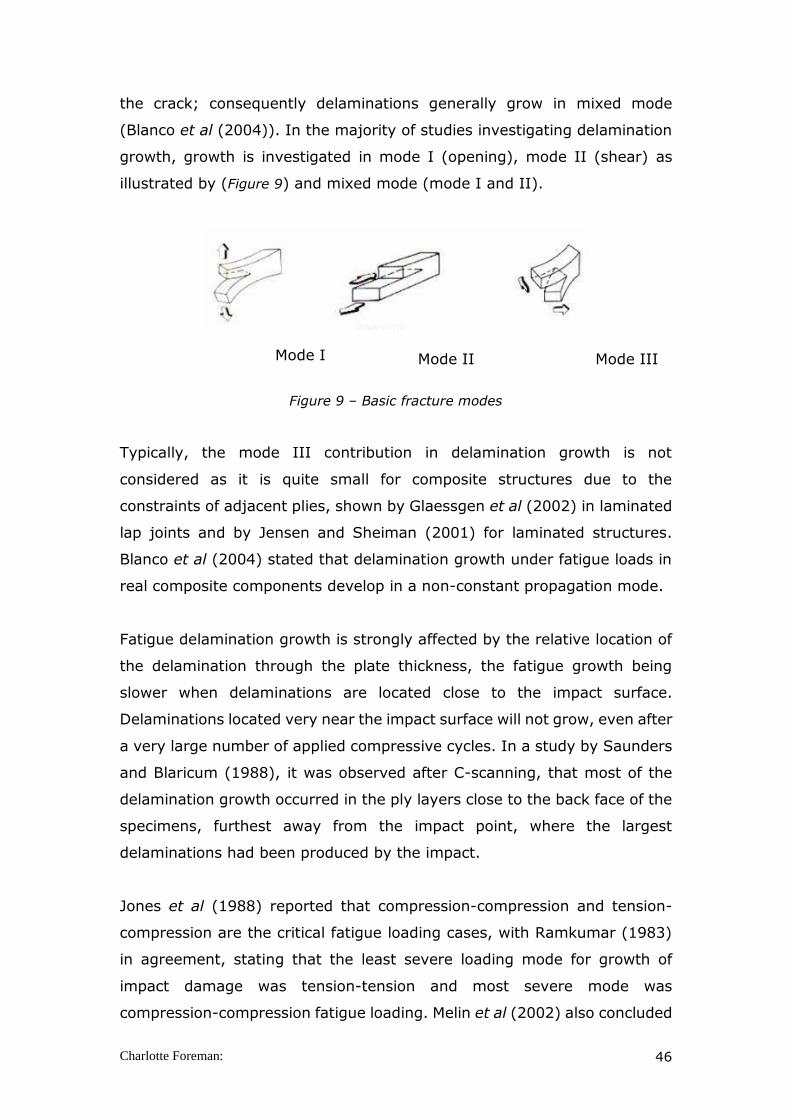
Charlotte Foreman: 46
the crack; consequently delaminations generally grow in mixed mode
(Blanco et al (2004)). In the majority of studies investigating delamination
growth, growth is investigated in mode I (opening), mode II (shear) as
illustrated by (Figure 9) and mixed mode (mode I and II).
Figure 9 – Basic fracture modes
Typically, the mode III contribution in delamination growth is not
considered as it is quite small for composite structures due to the
constraints of adjacent plies, shown by Glaessgen et al (2002) in laminated
lap joints and by Jensen and Sheiman (2001) for laminated structures.
Blanco et al (2004) stated that delamination growth under fatigue loads in
real composite components develop in a non-constant propagation mode.
Fatigue delamination growth is strongly affected by the relative location of
the delamination through the plate thickness, the fatigue growth being
slower when delaminations are located close to the impact surface.
Delaminations located very near the impact surface will not grow, even after
a very large number of applied compressive cycles. In a study by Saunders
and Blaricum (1988), it was observed after C-scanning, that most of the
delamination growth occurred in the ply layers close to the back face of the
specimens, furthest away from the impact point, where the largest
delaminations had been produced by the impact.
Jones et al (1988) reported that compression-compression and tension-
compression are the critical fatigue loading cases, with Ramkumar (1983)
in agreement, stating that the least severe loading mode for growth of
impact damage was tension-tension and most severe mode was
compression-compression fatigue loading. Melin et al (2002) also concluded
Mode I Mode II Mode III

Charlotte Foreman: 47
that the compressive part of the loading cycle was the most severe, and
suggested that this was due to the compressive loading causing local
buckling around the damaged region. Bennati and Valvo (2006) stated that
under compression loading, the instability phenomena may promote further
crack growth from a delamination and in some cases led to failure.
Mitrovic et al (1999) stated that impacted specimens subjected to fatigue
loading need to have widths similar to the distance between two spars on
an aircraft wing for example, if the results are to be readily transferable to
in-service aircraft conditions. If the specimen width is too small, interaction
between the impact damage and the edges might occur, with delaminations
growing from the edge, which highlights the importance of geometry.
Flesher and Herakovich (2006) presented a method for predicting final
failure of composite structures, and showed that delamination is the
predominant mode of failure. Hayes and Lesko (2007) stated that failure
of composites often occurs by buckling or delamination, as opposed to fibre
failure, and commented on the fact that most durability studies have been
limited to coupon level testing, and macro-level coupon studies may fail to
predict ultimate failure at the structural level. Butler et al (2007) presented
an analytical model for predicting the compressive fatigue limit strain of
laminates containing BVID. The model provided the limit strain for the final
rapid stages of growth of the delamination, when fatigue has led to
delamination buckling and hence opening of delaminations at a significant
depth within the laminate. In this model, the complex damage morphology
was represented as a single, circular delamination, the area of delamination
being determined by NDE methods. In this study, a fatigue limit strain of
3600e was found, below which, propagation of the damage would not
occur after 106 cycles.
Hou et al (2001) developed a criterion that suggested that interlaminar
shear stress always assists the initiation and propagation of delamination,
whereas the effect of out-of-plane normal stress is very different. Out-of-
plane tension was said to accelerate the development of delamination,
whereas out-of-plane compression halts the development of delamination.

Charlotte Foreman: 48
The effect of the compression was said to have the effect of the interlaminar
shear stresses needing to be at least two times higher before any
delamination would initiate, and that no delamination would occur once the
compression exceeds a certain value.
Kardomateas et al (1995) outlined the significance of delamination
buckling, in the sense that generally, the design for aircraft structures
consists of thin skins, typically strengthened by longitudinal stiffeners.
Aerodynamic loading induces lateral bending, with one side being subjected
to compression. Any delaminations present on the compressive side within
the skin, due to an impact for example, could incur local buckling, which
effectively induces stress concentrations at the delamination front. Cyclic
loading of compressed panels with delaminations (and hence repeated
delamination buckling) causes a reduction of interlayer resistance as a
result of damage accumulation at the tip. As a consequence, delaminations
that would not propagate under static load, may grow and cause failure
after a sufficient number of compression cycles.
2.6. Fracture mechanics and its application to
delamination in composites
Fracture mechanics is based upon the initiation and growth of critical cracks
that may cause premature failure in a structure. An interest in fracture
mechanics arose as a consequence of the failure of the Liberty ships
(Anderson (1994)). There are two alternative approaches to fracture
analysis; the energy criterion and the stress intensity approach. This section
outlines the principles of these two approaches.
2.6.1. The Energy Criterion approach
As mentioned in the introductory section of this study, the work by Griffith
(1920) in the 1920’s was of major importance regarding fracture mechanics
of materials. Griffiths’ work was a quantitative approach between fracture
stress and flaw size, applying stress analysis of an elliptical hole, to the
unstable propagation of a crack. The approach is based upon the first law
of thermodynamics, a simple energy balance, whereby a flaw becomes

Charlotte Foreman: 49
unstable and fracture occurs when the energy available for crack growth is
large enough to overcome the resistance of the material (surface energy,
plastic work and other energy dissipation associated with the propagating
crack) (Anderson (2005)).
In the energy approach, the energy release rate is denoted as G, defined
as the rate of change in potential energy with the crack area for a linear
elastic material. When fracture occurs G = Gc, which is the critical energy
release rate; a measure of interlaminar fracture toughness. For an infinite
plate subject to a remote tensile stress, with a crack of length 2a, the
energy release rate is given by;
Equation 2.6.1-1 .
At fracture this becomes
Equation 2.6.1-2
Here, E is the Young’s modulus, f is the remotely applied stress at fracture,
and a is half-crack length at fracture.
2.6.2. The Stress intensity approach
An alternative approach is the stress intensity approach, whereby the stress
intensity factor characterises the crack tip stresses in a linear elastic
material. If an assumption is made that a material fails locally at a critical
combination of stress and strain, then fracture must occur at a critical stress
intensity, KIC. Therefore, KIC is an alternative measure of interlaminar
fracture toughness. For the same conditions as stated for G, the stress
intensity factor is given by;
Equation 2.6.2-1
E
aG
2
E
aG
cf
c
2
aK I
Charlotte Foreman: 50
Comparing Equation 2.7.1-2 and 2.7.2-1 results in a relationship between
KI and G:
Equation 2.6.2-2
Therefore, the energy and stress-intensity approaches to fracture
mechanics are essentially equivalent for linear elastic materials (Anderson
(2005)). Irwin (1956) extended the Griffith approach to include energy
dissipated by local plastic flow. The methods by Griffith and Irwin became
known as linear elastic fracture mechanics (LEFM), with the methods
becoming invalid when large plastic deformation precedes failure. Irwins’
work became known as the Irwin plastic zone correction, a relatively simple
extension of LEFM (Anderson (2005)).
Interply delamination is considered to be the most critical failure mode
limiting the long-term fatigue life of certain composite laminates (Wilkins et
al (1980)). Delamination may occur in Mode I (opening mode), Mode II
(sliding / in-plane shear mode), or Mode III (tearing mode) or a
combination of these modes.
The compliance method is used in the calculation of the strain energy
release rate for each mode, which is related to the specimen compliance by
the following equation:
Equation 2.6.2-3
Where
P = applied load
w = specimen width
a = crack length (measured during the test)
E
KG I
2
da
dC
w
PGorG III
2
2

Charlotte Foreman: 51
C = specimen compliance (slope of load-displacement curve for each crack
length)
dC / da = slope of the compliance vs. crack length curve.
In mixed-mode linear elastic fracture mechanics, the fracture energy is
expressed in terms of the Mode I and II stress intensity factors, KI and KII
respectively.
2.6.3. Mode I and Mode II tests
Within this section a number of papers have been reviewed which focus on
Mode I and Mode II testing, in particular novel test techniques and analysis.
A paper by Greenhalgh et al (2009), looking into fractographic observations
on delamination growth and subsequent migration through the laminate,
noted that migration of the crack dictates the delamination growth process
and at a coupon level, by addressing migration, it is feasible to characterise
the fracture toughness values of ply interfaces. It was reported in this paper
that the toughness of 0/0 ply interfaces are not representative of those in
structures but provide a conservative approach, as the toughness is
increased at the 0/ interface. A paper by Brunner et al (Brunner, 2008)
reviewed the standardisation of test methods for fracture mechanics tests
to determine delamination resistance or fracture toughness of fibre-
reinforced, polymer-matrix composites. Developments leading towards new
standardised test procedures were presented. Within the paper (Brunner,
2008), the limits to the ISO standard were outlined; namely the fact that
the method is limited to quasi-static loading of unidirectional CFRP and
GFRP. The applicability of the standard DCB specimen for delamination
resistance testing of laminates with multidirectional lay-up was assessed by
Choi et al (Choi, 1999) and de Morais et al (Morais, 2003, 2004). The
problem that was highlighted within these papers was the issue with the
delamination migrating from the mid plane, which is said to invalidate the
analysis according to the ISO standard. As such, de Morais, 2004, reported
that delamination resistance for multi-directional laminates can probably be
quantified for initiation only, where no significant dependence on the

Charlotte Foreman: 52
delamination interface was observed. Brunner et al (2008) summarised the
report by stating that several test methods offer spreadsheets for data
analysis, including various correction factors and offering the opportunity
to compare different approaches for analysis (e.g. beam theory based
versus experimental compliance). These corrected methods are
investigated in some detail within the data analysis section of the Mode I
and Mode II testing within this thesis.
The majority of the research discussed so far has concentrated on prepreg
materials, however woven fabrics are being increasingly utilised because of
the ease of handling and storage, simpler lay-up procedures and lower cost.
Woven fabrics are also more damage tolerant in the presence of a
delamination, Alif et al (1998). Alif et al report the damage tolerance of
woven fabrics as being attributed to the non-planar interply structure of the
fabric. The delamination being reported to interact with the matrix regions
and the weave structure during its propagation, and as a result,
experiencing substantial growth resistance. In the paper by Alif et al (1998),
the data reduction method used was the empirical compliance method
which is outlined in the ASTM D5528, a test method / data reduction method
that appears to be the most widely used within the literature. A study by
Blackman and Brunner (2013) investigated testing cross ply and woven
fabric laminate materials, in the study it was found that for the woven
materials the failure path of the crack did not deviate from between the
central plies; however, slip stick behaviour was observed during crack
propagation. Blackman and Brunner (2013) therefore highlight the
complications with using the standard test methods in terms of identifying
the initiation values, along with issues connected to recording crack growth
in 1 mm intervals as specified in the test standard. The paper highlighted
the importance of obtaining enough values to make the data analysis valid
(all crack arrest points should be excluded from the analysis), as well as
ensuring initiation occurs from a stable pre-crack.
A number of papers have also outlined a modified test method for
specimens with enhanced fracture toughness by modifying the test
specimen for Mode I testing. This can be achieved by bonding identical
Charlotte Foreman: 53
reinforcing tabs made of conventional metals or composites to either side
of the specimen. This was found to be especially important when dealing
with non-crimp fabric composites due to the flexural modulus being
significantly less than their UD counterparts (Wood et al (2007)). The study
by Wood et al (2007) outlined the fact that for materials with enhanced
mode II delamination toughness, such as those with stitching, a modified
specimen would be needed to avoid the specimen failing in bending prior to
crack propagation. A review by Blackman et al (2013), outlined the
evolution of the ISO Standard test method for Mode I delamination
toughness. The main conclusion was that, whereas the ASTM method
requires testing using a film insert in a mode I test, the European Structural
Integrity Society (ESIS) concluded that mode I pre-cracking was an
essential part of the test as testing directly from the film insert could lead
to unstable crack growth. Interestingly, re-initiating the crack from a mode
I pre-crack yielded lower, conservative results, which led to the inclusion of
this method within the ISO standard.
A recent study by Brunner et al (2016) emphasised the importance of
developing a test methodology for multi-directional laminates for
delamination fatigue of CFRP composites. The study emphasised the need
for data analysis yielding rates or thresholds that can be transferred to
engineering design in order to move to a damage tolerant design, so that
certain amount of delamination or crack propagation is allowed.
Multiple delaminations / asymmetric thin film inserts
As mentioned in section 2.3, damage from an impact event is quite
complex, with regards to modelling such damage, some models are only
applicable to a damage process involving a single delamination. A number
of investigation involving modelling multiple delaminations and transverse
matrix cracks have been carried out by Zou et al (2001, 2002, 2003).
Numerous publications in the literature (Yin (1998)) has reported results in
which delamination propagation models have been formulated based on the
total energy release rate. However, it is well known that the critical total
energy release rate is not a material property, as it varies with the loading
condition (Li et al (2006). As a result, models of this kind are only applicable

Charlotte Foreman: 54
to problems in which the critical total energy release rates are measured
under exactly the same condition. Their applications will be questionable in
problems where the mode ratio changes as the delamination propagates (Li
et al (2006)). This needs to be considered during the analysis of the DCB
tests during this study and is why the emphasis has been placed on the
initiation values as opposed to propagation. An investigation by Li et al
(2006) looks at an improved formula from the standard virtual crack closure
technique which takes into account sublaminates and the position of the
delaminations in terms of sublaminates. The feature of the energy release
rates derived by Li et al (2006) is that they apply equally to problems
involving multiple delaminations as they were derived in the context of
multiple delaminations.
2.7. Summary of literature Review
There are a very large number of papers available which discuss damage in
composites; this review has only been able to summarise some of available
work in this field. However, the core researchers in this field have published
some interesting points, as highlighted in the preceding paragraphs.
The majority of the work discussed in this review has focussed upon carbon
fibre reinforced polymer composites because these materials are most
commonly used for structural applications in the aircraft industry; for this
reason, these materials were selected as the main focus for the thesis. It
was also noted that the most common matrix materials in aerostructures
are the toughened epoxy thermosetting type, consequently, a toughened
epoxy resin was selected as the material of choice for this study. Regarding
the reinforcing fibre architecture and manufacturing technique
considerations, it has been interesting to note that most of the work to date
has concentrated upon UD prepreg materials, and hence, the structural
study will focus upon these forms. However, also noted within the review,
was the need for lower cost manufacturing methods and lower cost
materials, hence non-crimp fabric will also be investigated within the study
in the form of coupon specimens for Mode I and Mode II testing.

Charlotte Foreman: 55
It has been reported that delamination is the predominant mode of failure,
with failure often occurring by buckling or delamination, as opposed to fibre
failure. It is for this reason that this study will concentrate on delamination
behaviour in composites and how buckling can influence the initiation of
growth within these delaminations.
Many reporters stated that delaminations exist as a crack between plies of
different fibre orientation (due to the result of the bending stiffness
mismatch between adjacent layers) and not between lamina in the same
ply group. However, others have reported that significant damage can occur
between layers with the same fibre orientation, with the intensity of the
delaminations depending upon the difference in the ply angles above and
below the interface. It is therefore important to determine the interface in
which the critical delamination lies. This will be achieved here, using time
of flight (TOF) ultrasonic C-scanning methods in order to map the through
thickness delamination pattern.
Once a delamination is present, it has been reported that mode II is the
dominant failure mode for propagation, with the mode mixity changing with
the number of cycles. As a result of this, the experimental method for the
structural testing was developed to provide high mode II levels during
fatigue loading, in order for delamination to grow.
The final stages of delamination growth are reported to occur when fatigue
has led to delamination buckling and hence opening of delaminations at a
significant depth away from the impact point, within the laminate.
Therefore, in order to achieve delamination growth, it is critical to ensure
that the delaminations open, which can be achieved by local buckling of the
composite. The critical depth of delamination occurs where the response
undergoes a change in form, from a mode that opens the delamination, to
one in which it is closed.
It is reported that interlaminar shear stress always assist the initiation and
propagation of delaminations, along with out-of-plane tension, whereas
out-of-plane compression halts the development of delamination. The effect

Charlotte Foreman: 56
of the compression was said to have the consequence that the interlaminar
shear stresses need to be at least two times higher before any delamination
would initiate, and that no delamination would occur once the compression
exceeds a certain value.
The majority of papers reviewed have concentrated on coupon or small-
scale structural elements. However, in order to gain an insight into the
damage mechanisms in real life structures a structure with components
seen in service should be investigated, such as stringers. Loading of a plate
with stringers in compression induces lateral bending, with one side being
subjected to compression. Any delaminations present on the compressive
side within the skin, could incur local buckling, which effectively induces
stress concentrations at the delamination front. Cyclically loading of
compressed panels with delaminations (and hence repeated delamination
buckling) might cause a reduction of interlayer resistance as a result of
damage accumulation at the tip. As a consequence, delaminations that
would not propagate under static load may grow and cause failure after a
sufficient number of compression cycles.
Damage growth is said to start early on in the fatigue lifetime, typically
during the first 10 – 20% of the life of the component. This could mean that
if no damage growth has occurred after this initial time, delamination
growth will be unlikely throughout the lifetime. One study (Butler et al
(2007)), reported that below a fatigue limit strain of 3600e, damage would
not grow after 106 cycles, but this needs to be investigated further. It has
also become apparent that fatigue delamination growth is strongly affected
by the relative location of the delamination through the plate thickness,
with growth being slower, or even a no growth situation, when
delaminations are located close to the impact surface. Most delamination
growth in thin laminates is reported to occur in the ply layers close to the
back face of the specimens, where the largest delaminations had been
produced by the impact.
The literature review highlighted the limited information available on
delamination growth in structural components, and as such, an

Charlotte Foreman: 57
understanding of the response of a sub-element under fatigue loading
following an impact event seems a promising way forward, and is the
approach adopted here.
Regarding woven fabrics, the literature has reported the complications with
using the standard data analysis methods for mode I and mode II testing.
Therefore tests involving (i) woven fabrics with delaminations from inserts
at the mid plane, and at other locations throughout the laminate, (ii)
delaminations caused from an impact event are areas that are investigated
further within this dissertation. Hence, the objectives of the work are as
follows:
To investigate and carry out novel experimental testing techniques to
understand damage behaviour at both the coupon level and the
structural level in order to compare the results with standard
analysis.
To determine if standard analysis can be used and adapted to
determine interlaminar fracture toughness values for delaminations
more representative of those seen in in real structures.

Charlotte Foreman: 58
3. Interlaminar fracture toughness testing of Non Crimp
Fabrics
3.1. Introduction
It is well known that composite materials, in particular laminated fibre-
reinforced composites, have high specific strength and stiffness properties,
and as such, these materials are being utilised to a much greater extent in
airframe structures. The ‘Achilles’ heel of these composite materials is the
through thickness property set. The through thickness tensile strength for
CFRP has been reported as low as 50 MPa (Mespoulet S et al 1996) whilst
the mode I interlaminar toughness may be less than 150 J / m2 for a first
generation epoxy system. It is also well known that airframe structures are
susceptible to impact events, either due to runway debris, ice, hailstones
or more severe impacts such as birdstrikes. These impacts cause through
thickness stresses in a component, and if these stresses exceed the through
thickness strength of the material, delaminations (separation of the plies)
may initiate within the structure. The propagation of these delaminations is
controlled by the interlaminar fracture toughness of the composite material
(Robinson, 2000). There has therefore been extensive experimental work
carried out to determine the interlaminar fracture toughness values of
laminated composite materials with artificial inserts, usually expressed in
terms of the critical energy release rate, Gc, typically measured in mode I
(opening mode, GI) and mode II (shear mode, GII).
Due to the extensive research and experimental work carried out in this
area, it is possible to establish typical values for interlaminar fracture
toughness for a wide variety of carbon fibre and matrix types with relative
ease, however, the data tends to be restricted to unidirectional prepreg
materials. These materials, although offering exceptional properties, are
expensive to manufacture and as such, alternative material systems need
to be investigated which can be manufactured using lower cost techniques.
The aim of this section of the thesis was to use lower cost CFRP materials,
specifically fabrics, containing natural damage caused from an impact event

Charlotte Foreman: 59
and from damage initiated from an artificial method and to compare the
results in terms of the crack growth resistance.
3.2. Material and Preparation of Test Specimen
3.2.1. Introduction
This section of the investigation documents the materials and methods
used in determining the Mode I and Mode II interlaminar fracture
toughness values of non-crimp fabric carbon fibre composites. The nature
of the materials tested is discussed in section 3.2.2. The sections which
follow address the methods used to determine the interlaminar fracture
toughness values. Section 3.3 discusses the double cantilever beam
(DCB) method used for mode I testing and section 3.4 discusses the end
notch flexure (ENF) method used to determine Mode II values.
3.2.2. Materials
The lay up selected for DCB and ENF testing is shown in Figure 10. The
lay up was from 12 layers of intermediate modulus (IM) carbon non crimp
fabric, having an uncured ply thickness of 0.508 mm, with single 5HS
outer plies of 0.36 mm thickness.
The resin used was an epoxy resin which was infused using the liquid
resin infusion method. The panel lay-up was [0/90],[+45/-45, 0/90, -
45/+45, 0/90, +45/-45, 0/90]s [0/90], as illustrated in Figure 10. This
lay-up was chosen as it was representative of the typical lay-ups seen in
service for NCF materials.

Charlotte Foreman: 60
Figure 10 - Panel lay-up showing artificial insert positioning
The panel size was 1890 mm by 794 mm. One artificial insert was located
at the mid plane (90 interface) of the panel and one located between
the 0/90, +/- plies (Figure 10) during manufacture of the panel. After
curing, the panel was impacted using 51 J, an energy level recommended
to produce 50 mm diameter delamination area, a size selected to meet
the requirements of delamination length recommended within the test
specification (discussed in section 3.3 and 3.4). A schematic showing the
location of the impact in relation to the artificial inserts can be seen in
Figure 11.
Figure 11 – Schematic of manufactured panel showing artificial insert location and
impact location
Non-destructive testing, using the ultrasonic C-scanning technique was
carried out by QinetiQ prior to sectioning, with 2D analysis being carried
out on the entire panel (Figure 12).
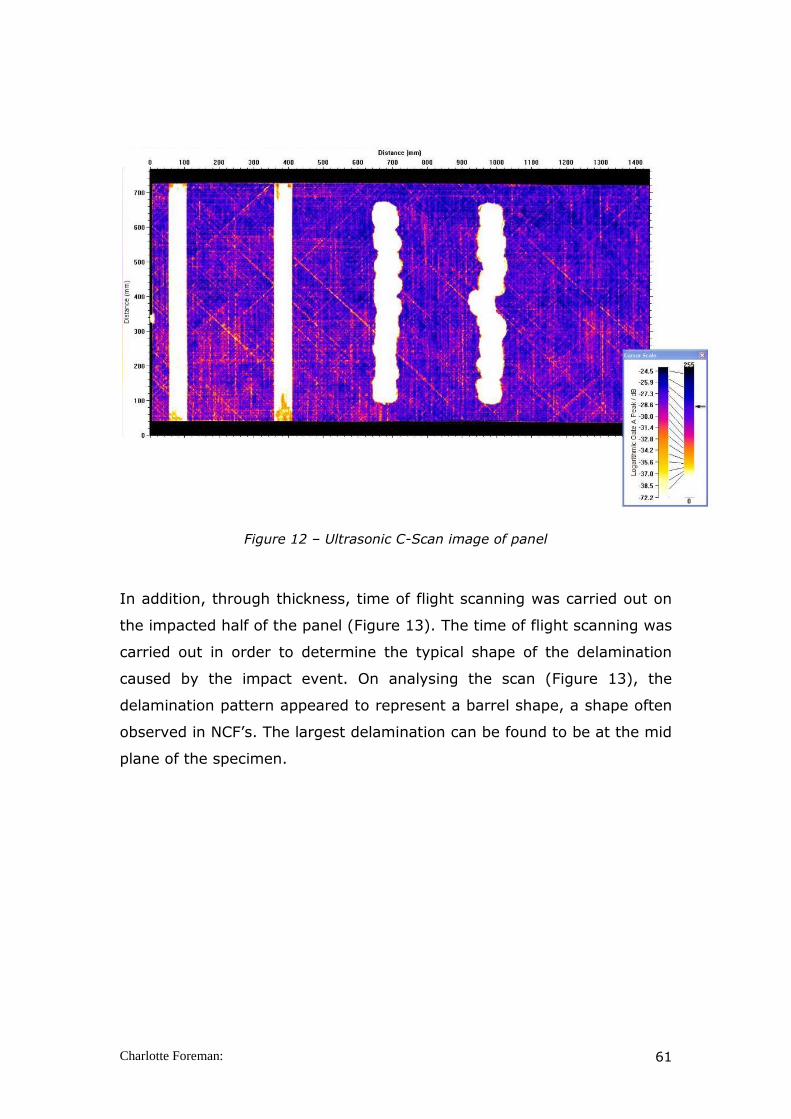
Charlotte Foreman: 61
Figure 12 – Ultrasonic C-Scan image of panel
In addition, through thickness, time of flight scanning was carried out on
the impacted half of the panel (Figure 13). The time of flight scanning was
carried out in order to determine the typical shape of the delamination
caused by the impact event. On analysing the scan (Figure 13), the
delamination pattern appeared to represent a barrel shape, a shape often
observed in NCF’s. The largest delamination can be found to be at the mid
plane of the specimen.

Charlotte Foreman: 62
Figure 13a – Example of time of flight C- Scanning image
3.2.3. Specimen Preparation
The panel (as represented in Figure 11) was cut into sections, as identified
in Figure 14. The section of the panel with the PTFE inserts was trimmed
and thin strips from the edges pulled apart in order to identify the exact
position of the film insert. The position of the delamination front was then
marked on the panel.
200 mm (3 impacts shown for illustration)
6.024mm=
thickness of panel
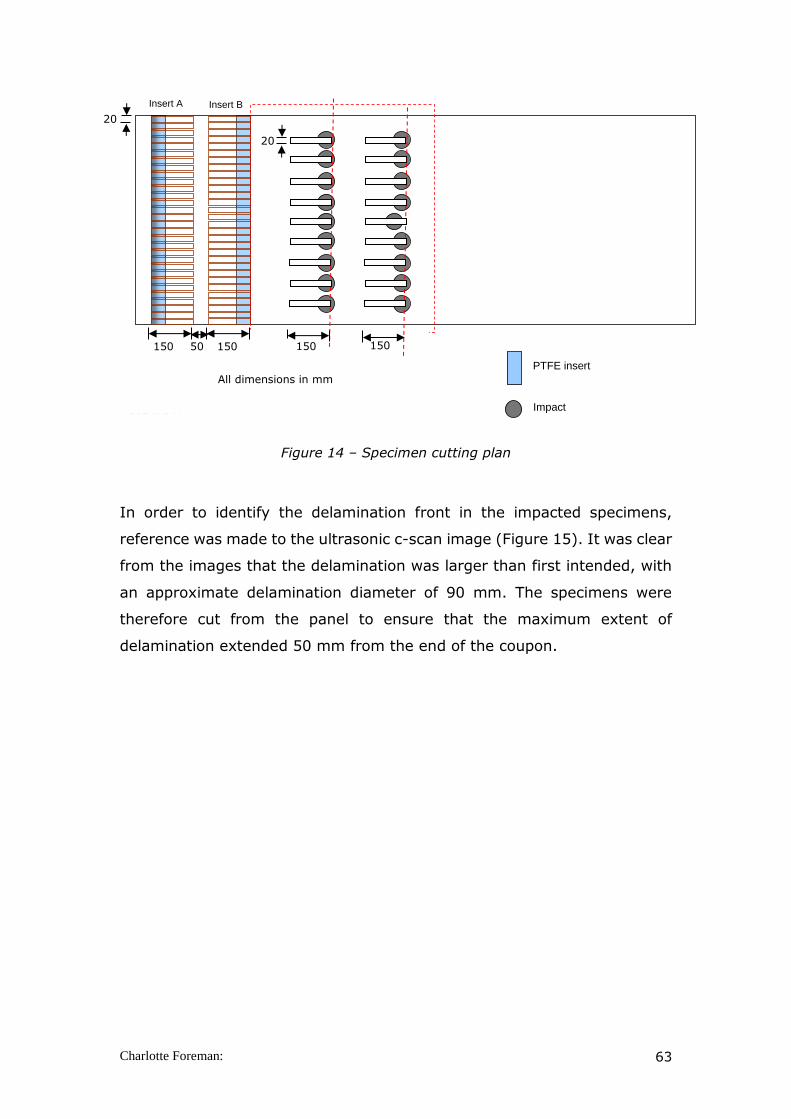
Charlotte Foreman: 63
Figure 14 – Specimen cutting plan
In order to identify the delamination front in the impacted specimens,
reference was made to the ultrasonic c-scan image (Figure 15). It was clear
from the images that the delamination was larger than first intended, with
an approximate delamination diameter of 90 mm. The specimens were
therefore cut from the panel to ensure that the maximum extent of
delamination extended 50 mm from the end of the coupon.
Impact
2. Cut out 20x150mm specimens as shown 3. Number specimens: A01 to A30 and B01 to B30
PTFE insert
1. Cut out impacted part – to be sent to NDE
Retain this off-cut
Insert A Insert B
150
150
50
150
150
All dimensions in mm
20
20
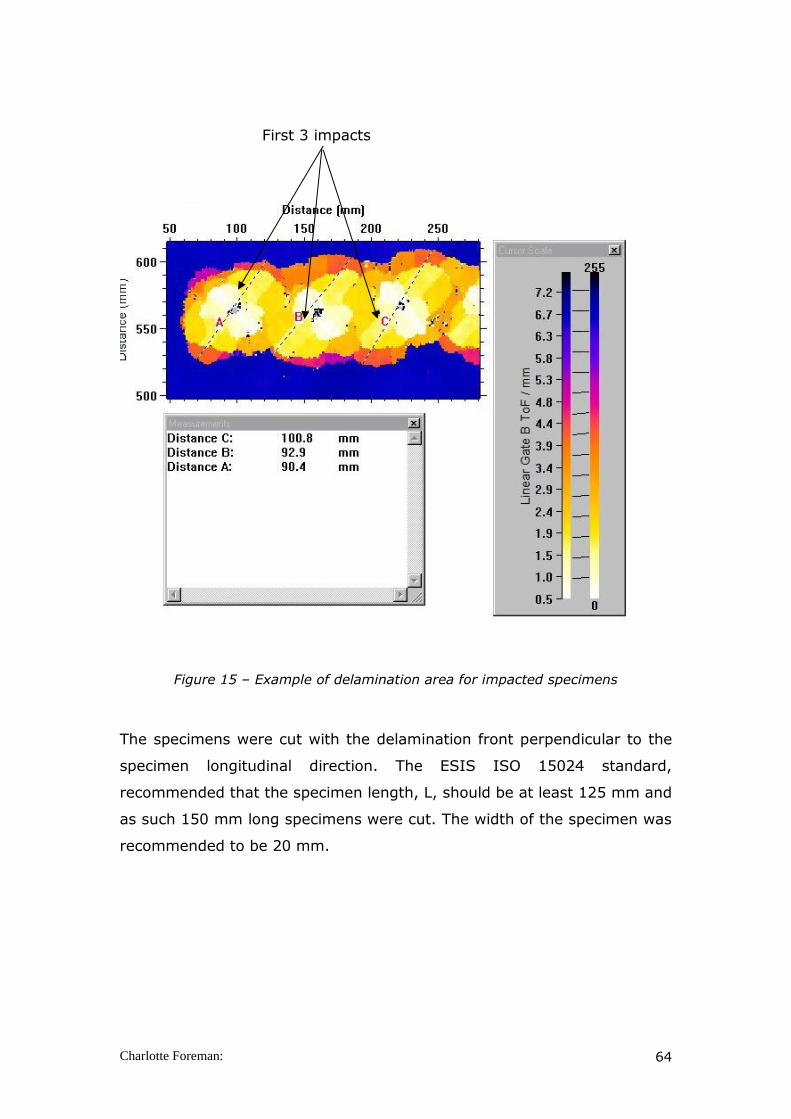
Charlotte Foreman: 64
Figure 15 – Example of delamination area for impacted specimens
The specimens were cut with the delamination front perpendicular to the
specimen longitudinal direction. The ESIS ISO 15024 standard,
recommended that the specimen length, L, should be at least 125 mm and
as such 150 mm long specimens were cut. The width of the specimen was
recommended to be 20 mm.
First 3 impacts

Charlotte Foreman: 65
3.3. Mode I: Double Cantilever Beam (DCB)
3.3.1. Introduction
The double cantilever beam (DCB) test is commonly used to determine the
mode I interlaminar fracture toughness values for composite laminates with
test coupons manufactured to include a thin, non-adhesive film insert at
least 50mm in length at one end of the specimen (Figure 16).
Figure 16 – DCB test specimen geometry (BS ISO 15024 (2001))
The purpose of the embedded thin, artificial insert is to simulate an initial
delamination. This is an imperfect process, not least because of the resin
rich region generated around the finite-thickness insert.
3.3.2. Test Method
The test methods available are designed to be used when testing
unidirectional laminates only. For this study, the European Structural
Integrity Society (ESIS) test method ISO 15024 was used as a basis for the
design of specimen and test specification for mode I testing. One reason
that this test method recommends only using unidirectional lay-up is
because these lay-ups exhibit very little anti-clastic bending (Poissons effect
of beam subjected to bending), with the bending stiffness components
satisfying the condition where the ratio (D12)2/(D11D22) is much less than 1
Charlotte Foreman: 66
(D11, D12 and D22 are components of the bending-stiffness matrix for the
upper and lower arm of the double cantilever beam (BS ISO 15024
(2001))). It is thought that multidirectional lay-ups may not satisfy this
condition, and hence may exhibit significant anti-clastic bending.
Furthermore, multidirectional lay-ups typically exhibit crack branching away
from the specimen mid-plane, and hence are not recommended within the
test standard. However, a study by Fishpool (2013) on mode I testing of
3D woven composites concluded that some of the issues with woven
materials is due to their enhanced toughness, they can suffer failure of the
beam arms rather than through crack progression precluding toughness
measurement. In this case the specimens can be reinforced with adhesively
bonded tabs to prevent failure (Tanzawa et al, 1999, Dransfield et al, 1998,
Tamuzs et al, 2003).
Within this study end blocks were lightly abraded along with the surface of
the specimen and the end blocks were then bonded onto half of the
specimens for each insert location (A and B shown in Figure 14) in order to
provide a means of applying the load. Cyanoacrylate adhesive was used as
the bond medium. In this way the specimen geometry for the mid-plane
insert is consistent with that shown in Figure 16.
All specimen edges were coated with typewriter correction fluid to aid in the
visual inspection of the crack tip and then, starting from the delamination
front mark, 1 mm divisions were marked up to a total of 70 mm.
The length, l, width, B and thickness, 2h of each specimen were measured.
The nominal average dimensions for the specimen can be seen in Table 3.

Charlotte Foreman: 67
Dimensions (mm)
2h h H L1 L2 L3 A ao a l B
6.8 3.4 9.2 8 5 10 50 37 Measured during
test
150 20
Table 3 – Measurements from Mode I specimens
The parameters are defined below:
2h = total thickness of the specimen (each arm of the DCB specimen has
thickness h)
H = thickness of load block
L1 = distance from the centre of the loading pin to the midplane of the
specimen beam to which the load block is attached
L2 = distance between the centre of the pin-hole of the load-block and its
edge, measured towards the tip of the insert
L3 = total length of the load block
A = total length of the insert, distance between end of specimen on which
load block are mounted and tip of the insert.
a0 = initial delamination length, distance between the load line (intersection
of the plane through the pin hole centres of the load blocks and the plane
of delamination) and the tip of the insert on the edge of the specimen.
a = delamination length measured during the test
l = total length of the specimen
B = Width of the specimen
The specimens were mounted in the screw-driven Instron test machine with
a 1 kN load cell. The test machine was equipped with a fixture to introduce
the load to the pins inserted into the load blocks. The end of the specimen
was supported in order to keep the beam orthogonal to the direction of the
applied load.
Testing was carried out at a constant displacement rate of 1 mm / min, with
load and displacement signals being recorded at regular intervals. The
delamination growth was observed using a travelling microscope, with the
specimen being illuminated to aid the visual observation.

Charlotte Foreman: 68
The point of onset of delamination movement from either the insert or the
impact delamination was recorded by noting down the crack length and the
load and displacement values. After this, as many delamination length
increments as possible were recorded in the first 5 mm and then subsequent
delamination lengths were noted every 5 mm until the delamination had
propagated at least 45 mm.
3.3.3. Data Reduction
3.3.3.1. Introduction
Data reduction yields the critical energy release rates, GIC, for initiation and
propagation of a Mode I delamination, plotted as a function of delamination
length. This plot is referred to as a delamination resistance cure, or R-curve.
A typical R-Curve can be seen in Figure 17.
.
Figure 17 – Schematic of an idealised R-curve from a DCB test
Within the test method used (ESIS ISO 15024), it states that if the GIC
initiation values measured from the insert are less than or equal to the
propagation values plotted in the R-curve (as displayed in the schematic in
Figure 17) then the minimum initiation value shall be considered a valid
generic measure of the interlaminar fracture toughness of the composite.
If the initiation values are greater than the propagation values, even though
GIC
Initiation
Propagation
Crack Length, a
Charlotte Foreman: 69
the insert is thin and non-adhesive, then the DCB has to be repeated using
wedge precracking techniques. This has to be assessed after the first test.
The data required for the analysis (see next section) were the initial
delamination length, ao, the delamination lengths, a, where a = ao +
measured delamination length increments, the corresponding loads, P and
displacements, , and the width, B, of the specimen.
3.3.3.2. The Corrected beam theory data reduction
method
The simple beam theory expression for the compliance of a perfectly built
in DCB specimen with a clamped boundary condition will underestimate the
compliance because the beam is not perfectly built in. A way to correct the
effects of this is to treat the beam as if it contains a slightly longer
delamination length a + |∆|, where |∆| may be found experimentally by
plotting the cube root of the normalised compliance, (C/N)1/3 (where the
load block correction, N, is described below) as a function of delamination
length, a. The extrapolation of a linear fit through the data in the plot yields
∆ as the x-intercept. If the ∆ value from the fit is positive, a value of ∆ = 0
shall be used and this would be noted.
The critical energy release rate GIC is given by:
𝐺𝐼𝐶 =3𝑃𝛿
2𝐵(𝑎+|∆|)
𝐹
𝑁 Equation 3.3.3.2-1
Where P is the load, is the displacement, a is the delamination length, B
is the width of the specimen, F is the large displacement correction, and N
is the load block correction. All initiation and propagation values are
calculated.
The large displacement correction F and the load block correction N are
calculated as follows:

Charlotte Foreman: 70
𝐹 = 1 −3
10(
𝛿
𝑎)
2−
3
2(
𝛿𝑙1
𝑎2 ) Equation 3.3.3.2-2
𝑁 = 1 − (𝑙2
𝑎)
3−
9
8[1 − (
𝑙2
𝑎)
2
]𝛿𝑙1
𝑎2−
9
35(
𝛿
𝑎)
2 Equation 3.3.3.2-3
Where l1 is the distance from the centre of the loading pin to the midplane
of the specimen beam and l2 the distance from the loading pin centre to its
edge (Figure 16). The delamination resistance curve (R-curve), consisting
of a plot of GIC versus delamination length, a, was determined for each
specimen.
3.3.3.3. Modification for Crack path not at mid plane
In order to check if the results were to be expected, derivation of the
initiation load and compliance from first principles were applied.
Insert at Mid plane
𝛿𝑜𝑛𝑒 𝑎𝑟𝑚 =𝑃𝑎3
3𝐸𝐼1
𝐼1 = 𝑏ℎ3
12 𝐼1 ∝ ℎ3 Equation 3.3.3.3-1
𝛿𝑡𝑜𝑡𝑎𝑙 = 2𝛿 =2𝑃𝑎3
3𝐸𝐼1 Equation 3.3.3.3-2
Insert at 1/3 plane
𝐼2 = 𝑏(
2ℎ
3)3
12 Equation 3.3.3.3-3
2h h/2
2h 4/3.h
2/3.h

Charlotte Foreman: 71
𝐼2 ∝ 8ℎ3
27 Equation 3.3.3.3-4
𝐼3 =𝑏(
4ℎ
3)
3
12 Equation 3.3.3.3-5
𝐼3 ∝ ℎ3 64
27 Equation 3.3.3.3-6
𝛿𝑡𝑜𝑡𝑎𝑙 =𝑃𝑎3
3𝐸𝐼2+
𝑃𝑎3
3𝐸𝐼3 Equation 3.3.3.3-7
𝐺 =𝑃2
2
𝑑𝑐
𝑑𝑎 Equation 3.3.3.3-8
𝐺 ∝𝑑𝑐
𝑑𝑎 Equation 3.3.3.3-9
(𝑑𝑐
𝑑𝑎)
𝑐𝑟𝑎𝑐𝑘 𝑎𝑡 𝑚𝑖𝑑 𝑝𝑙𝑎𝑛𝑒∝
2
𝐼1 =
2
ℎ3 Equation 3.3.3.3-10
(𝑑𝑐
𝑑𝑎)
𝑐𝑟𝑎𝑐𝑘 𝑎𝑡1
3 𝑝𝑙𝑎𝑛𝑒
∝1
𝐼2+
1
𝐼3 =
27
8ℎ3+
27
64ℎ3∝
243
64ℎ3 Equation 3.3.3.3-11
If 𝐺𝑐 =𝑃2
2
𝑑𝑐
𝑑𝑎 , it follows that the load for crack initiation, Pi:
𝑃𝑖 ∝1
√𝑑𝑐𝑑𝑎
𝑷𝒊(𝒎𝒊𝒅 𝒑𝒍𝒂𝒏𝒆)
𝑷𝒊 (
𝟏𝟑𝒑𝒍𝒂𝒏𝒆)
= √(
𝒅𝒄
𝒅𝒂)𝟏/𝟑
(𝒅𝒄
𝒅𝒂)𝑴𝒊𝒅
Equation 3.3.3.3-12
𝑷𝒊(𝒎𝒊𝒅 𝒑𝒍𝒂𝒏𝒆)
𝑷𝒊(
𝟏𝟑𝒑𝒍𝒂𝒏𝒆)
= √(𝟐𝟒𝟑
𝟔𝟒𝒉𝟑
𝒉𝟑
𝟐) = √
𝟐𝟒𝟑
𝟏𝟐𝟖= √𝟏. 𝟗 ≈ 𝟏. 𝟒 Equation 3.3.3.3-13

Charlotte Foreman: 72
From this derivation, it would be expected that the load for initiation of
delamination at the mid plane would be 1.4 times the load of samples with
the insert at a 1/3 plane.
3.4. Mode II: End Notch Flexure (ENF)
3.4.1. Introduction
The same geometry of specimen was used for mode II testing as was used
for the mode I tests outlined in 3.2.3. The end notch flexure test was used
to determine the mode II fracture toughness values. The ASTM standard
D5528 was followed.
3.4.2. Test Method
Specimens were loaded in a standard three-point bend fixture, as shown in
Figure 18 below.
Figure 18 – End Notch Flexure test rig.

Charlotte Foreman: 73
Figure 19 – Dimensions for End Notch Flexure test
The specimen edges were coated with typewriter correction fluid and the
support location was marked to enable the initial crack length from the load
point to be measured accurately. The loading roller had a radii of 2.5 mm.
In order to assist in crack initiation and to avoid any instability due to
bonding through the release film insert, the specimens were pre-cracked
10 mm prior to the start of the test by placing the specimen in the three
point bending rig attached to an Instron test machine applying the load.
The specimens were located in the fixture so that the crack length was 40
mm. The specimen was loaded until the crack had grown under the mid
point roller (crack growth of 10 mm). The crack tip of the pre crack was
then marked and the specimens were mounted so that the ratio of a/L =
0.5 was obtained for the new crack (film + shear pre crack). The specimen
was loaded using displacement control at a rate of 1 mm/min in order to
enable slow stable crack propagation.
3.4.3. Data Reduction
A number of methods were looked at to interpret the results, the direct
beam theory, modified beam theory and corrected modified beam due to
asymmetric flexure.
50
25
50

Charlotte Foreman: 74
3.4.3.1. The Direct Beam Theory
The equation used for the direct beam theory is given below:
𝐺𝐼𝐼𝐶 =9𝑎2𝑃𝛿
2𝐵(2𝐿3+3𝑎3) Equation 3.4.3.1-1
Where P = Peak load, = displacement at peak load, B = Specimen width,
L = half span and a=crack length.
3.4.3.2. The modified Beam theory
Russell and Street (Russell and Street, 1985) presented a beam theory
solution for compliance and strain energy release rate for the ENF specimen.
𝐺𝐼𝐼𝐶 =9𝑎2𝑃2
16𝐸𝑏2ℎ3 Equation 3.4.3.2-1
In this equation, the value of E is modulus measured during compliance
calibration for a = 0.
𝐸 =𝐿3
4𝐵𝐶ℎ3 Equation 3.4.3.2-2
Where h = half specimen thickness and 1/C = the initial slope of the load
displacement plot, ignoring any initial non-linearity due to compliance
within the fixture.
3.4.3.3. Modified beam with asymmetric correction
(Zhou & He (1993))
An interesting paper by Zhou and He (1993) stated that since the flexure
of ENF specimens is asymmetric, due to the existence of the delamination,
the slope of the centre of the ENF specimen is not zero and therefore the
compliance calculation proposed by Russell and Street may be
unreasonable.

Charlotte Foreman: 75
Figure 20 is a photograph showing the side view of an ENF specimen under
load. It is clear to see that the line of load introduction is not the line of
symmetry. The point at which maximum deflection occurs is in the region
of the cracked half segment from the central point.
Figure 20 – Side view of an end-notched flexure test in progress (Zhou and He
(1993))
Zhou and He (1993) proposed therefore that the ENF specimen should be
modelled as two cantilever beams DE and EA (Figure 21) instead of the
beams BC and CD used in the Russell and Street derivation.
Figure 21 – Bending of the ENF specimen (Zhou and He (1993))
Having analysed the results by Zhou and He (1993) using Macaulays beam
theory method, confidence in the approach was gained (see Appendix 1 for
the analysis). Taking this same approach and considering the beam as two
separate beams in terms of thickness, an alternative equation was derived
to take into account delaminations away from the mid plane.
Maximum deflection

Charlotte Foreman: 76
The resulting expression for the strain energy release rate (derivation can
be found in Appendix 1) was:
𝐺 =3𝑃2𝑎2[
8ℎ3
𝑡13+𝑡2
3−1]
16𝐸𝑏2ℎ3 Equation 3.4.3.3-1
When t1 = t2 = h, the term in the brackets tends to 3 and the standard
result is then found.
𝐺 =9𝑝2𝑎2
16𝐸𝑏2ℎ3 Equation 3.4.3.3-2
3.5. Mode I DCB Test results
3.5.1. Introduction
Results for specimens with PTFE inserts and impacts have been analysed
and the data are presented in tables, along with graphs showing the
response during test.
3.5.2. Standard Specimen with PTFE Inserts
Figure 22 shows the load versus displacement plots for each specimen.
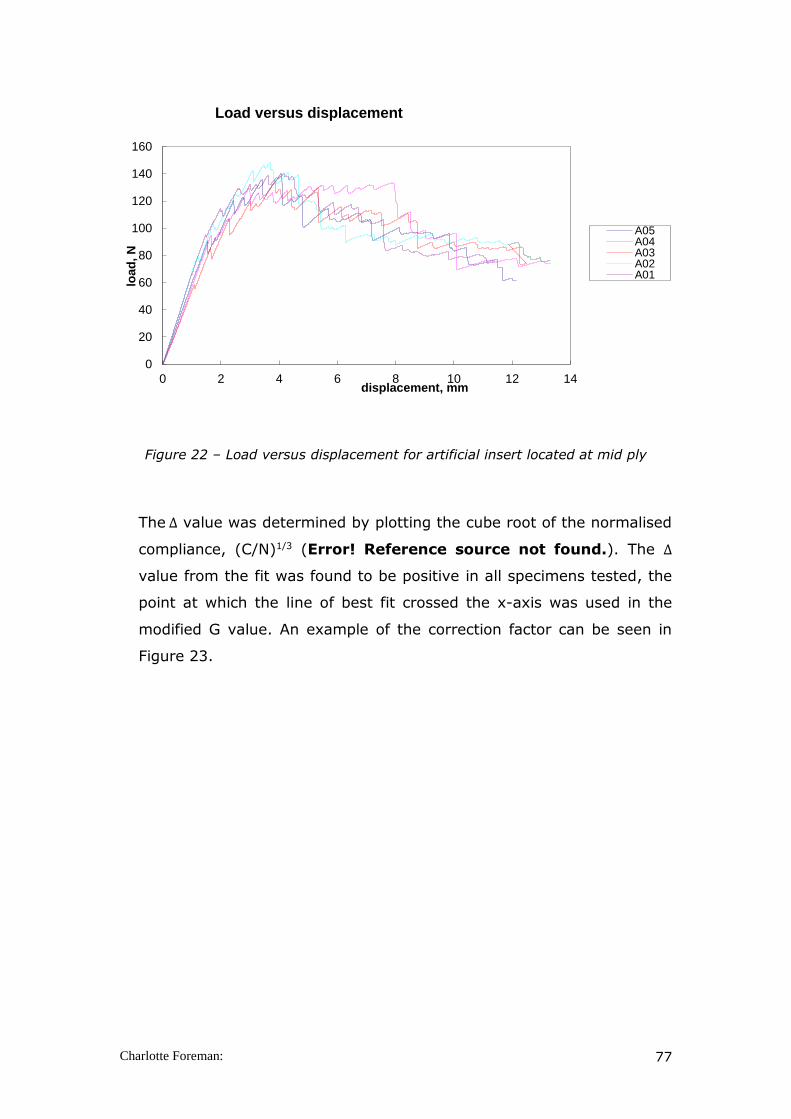
Charlotte Foreman: 77
Figure 22 – Load versus displacement for artificial insert located at mid ply
The ∆ value was determined by plotting the cube root of the normalised
compliance, (C/N)1/3 (Error! Reference source not found.). The ∆
value from the fit was found to be positive in all specimens tested, the
point at which the line of best fit crossed the x-axis was used in the
modified G value. An example of the correction factor can be seen in
Figure 23.
0
20
40
60
80
100
120
140
160
0 2 4 6 8 10 12 14
loa
d,
N
displacement, mm
Load versus displacement
A05A04A03A02A01

Charlotte Foreman: 78
Figure 23 – Compliance check for a typical sample with artificial insert at the mid
plane
The mode I interlaminar fracture toughness values calculated at each
increment in crack length can be seen in Figure 24.
Figure 24 – GIC versus crack length for mid-plane artificial insert coupons
0
0.1
0.2
0.3
0.4
0.5
0.6
0.7
-10 10 30 50 70 90
C/N
1/3
a
Correction factor, C/N1/3 vs a
0
0.2
0.4
0.6
0.8
1
1.2
1.4
35 45 55 65 75 85
GIc
(kJ/m
^2)
Crack length, a (mm)
GIc vs Crack length
A01A02A03A04

Charlotte Foreman: 79
The overall results for the specimens with PTFE inserts at the mid-plane can
be seen in Table 4. The initiation load, displacement and fracture toughness
have been identified along with the maximum load for each specimen and
corresponding fracture toughness at the maximum load. The maximum
mode I fracture toughness value has also been included.
Specimen
Number
Load
at A0
(N)
Displacement
at Ao
(mm)
GIc Initiation
(J/m2)
Max
Load
(N)
Crack
length
at max
load
(mm)
GIC at max
load (J/m2)
Max GIC (J/m2)
A01 95.26 1.48 392.6 139.89 47 1175.3 1175.3
A02 78.99 1.20 158.1 148.26 47 769.7 945.1
A03 58.80 1.10 230.5 134.46 47 1292.6 1312.2
A04 94.94 1.66 382.2 133.55 64 1401.3 1401.3
A05 90.78 1.55 319.6 140.58 47 1048.4 1048.4
Average 83.75 1.40 296.6 139.35 50.40 1137.5 940.26
S.D 15.43 0.24 100.78 5.89 7.60 244.0 483.24
C.V (%) 18.42 17.02 33.98 4.23 15.08 21.46 51.39
Table 4 – Mode I fracture toughness values of specimens with artificial insert at
mid plane.
The results for the DCB tests for the specimens with PTFE inserts located at
1/3 thickness can be seen below. Figure 25 displays load versus
displacement plot for each specimen and the fracture toughness value
calculated per crack advance can be seen in Figure 26.
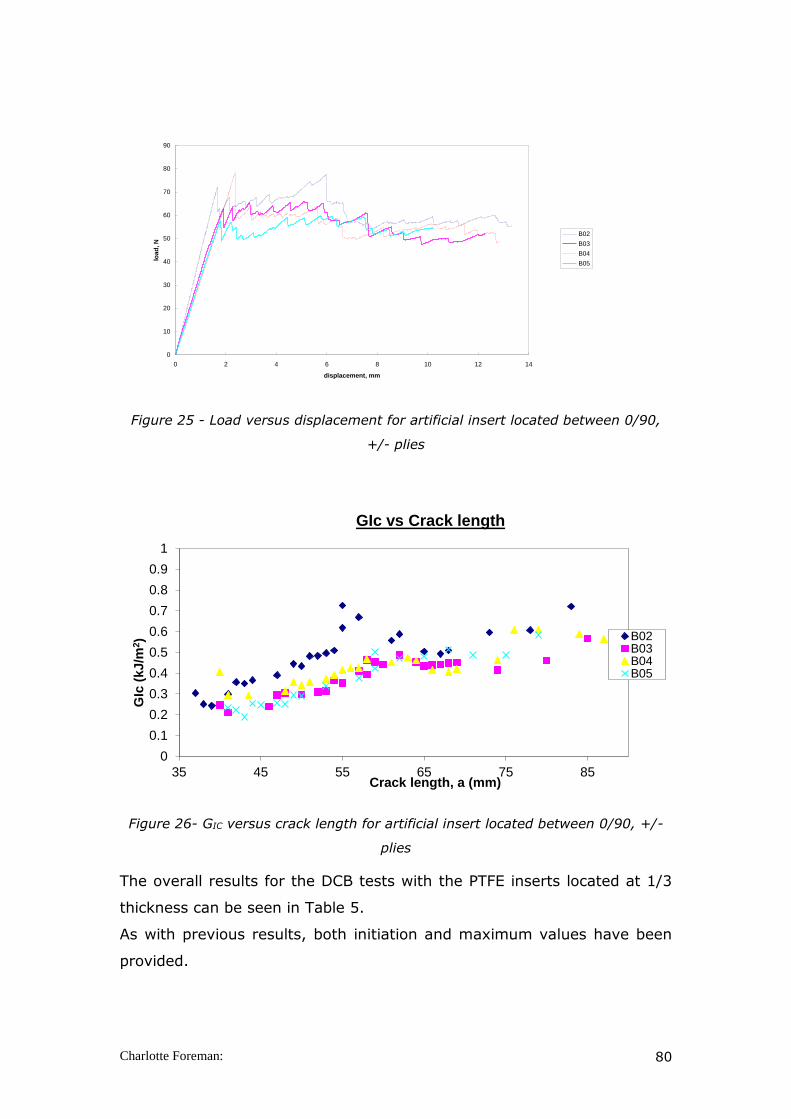
Charlotte Foreman: 80
Figure 25 - Load versus displacement for artificial insert located between 0/90,
+/- plies
Figure 26- GIC versus crack length for artificial insert located between 0/90, +/-
plies
The overall results for the DCB tests with the PTFE inserts located at 1/3
thickness can be seen in Table 5.
As with previous results, both initiation and maximum values have been
provided.
0
10
20
30
40
50
60
70
80
90
0 2 4 6 8 10 12 14
displacement, mm
loa
d, N
B02
B03
B04
B05
0
0.1
0.2
0.3
0.4
0.5
0.6
0.7
0.8
0.9
1
35 45 55 65 75 85
GIc
(kJ/m
2)
Crack length, a (mm)
GIc vs Crack length
B02B03B04B05
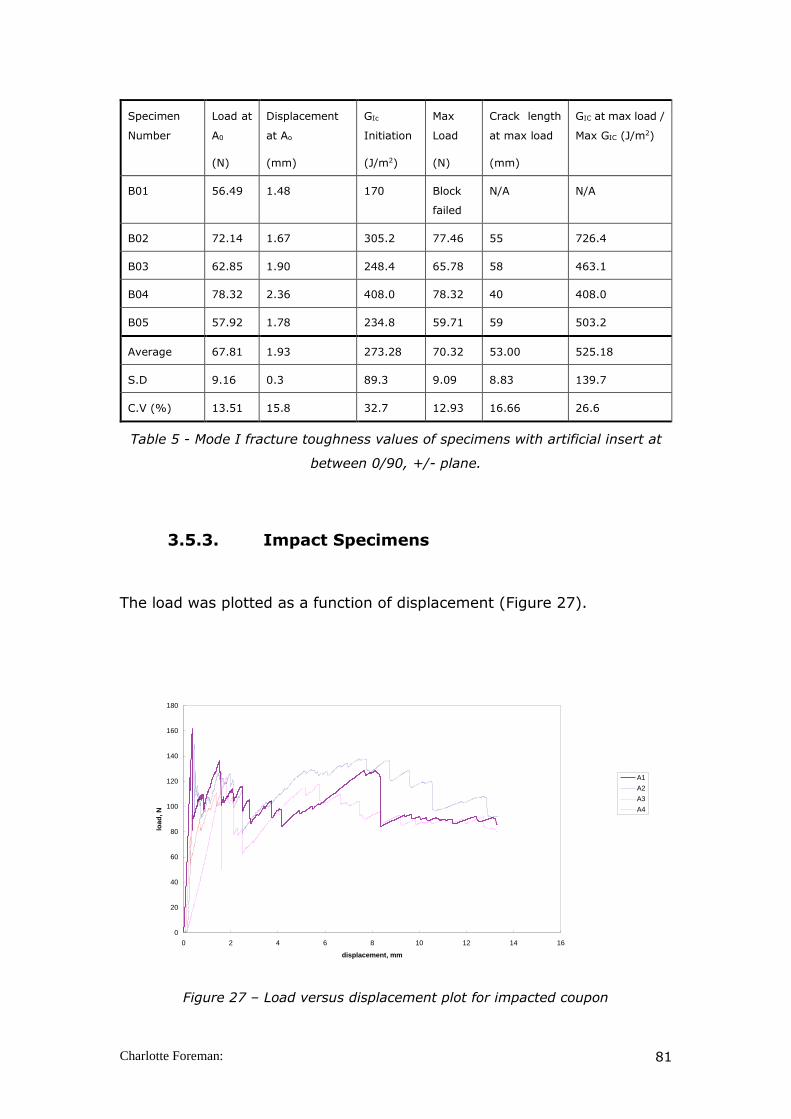
Charlotte Foreman: 81
Table 5 - Mode I fracture toughness values of specimens with artificial insert at
between 0/90, +/- plane.
3.5.3. Impact Specimens
The load was plotted as a function of displacement (Figure 27).
Figure 27 – Load versus displacement plot for impacted coupon
0
20
40
60
80
100
120
140
160
180
0 2 4 6 8 10 12 14 16
displacement, mm
loa
d, N
A1
A2
A3
A4
Specimen
Number
Load at
A0
(N)
Displacement
at Ao
(mm)
GIc
Initiation
(J/m2)
Max
Load
(N)
Crack length
at max load
(mm)
GIC at max load /
Max GIC (J/m2)
B01 56.49 1.48 170 Block
failed
N/A N/A
B02 72.14 1.67 305.2 77.46 55 726.4
B03 62.85 1.90 248.4 65.78 58 463.1
B04 78.32 2.36 408.0 78.32 40 408.0
B05 57.92 1.78 234.8 59.71 59 503.2
Average 67.81 1.93 273.28 70.32 53.00 525.18
S.D 9.16 0.3 89.3 9.09 8.83 139.7
C.V (%) 13.51 15.8 32.7 12.93 16.66 26.6
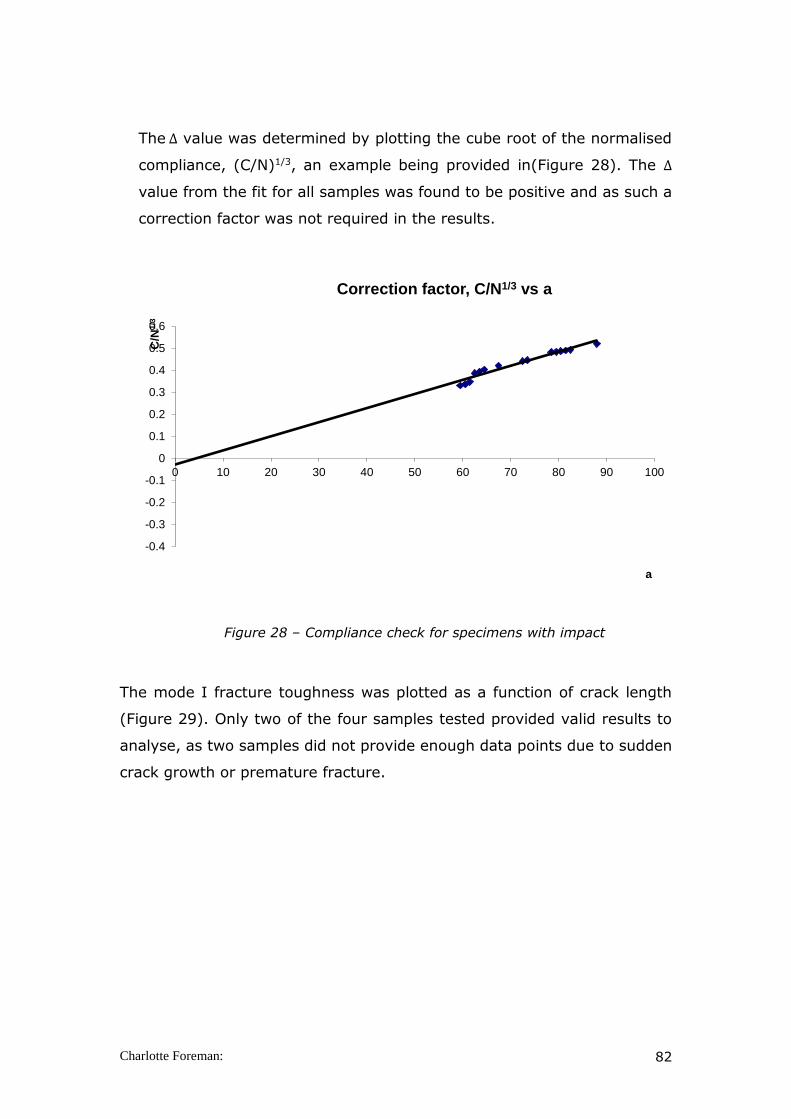
Charlotte Foreman: 82
The ∆ value was determined by plotting the cube root of the normalised
compliance, (C/N)1/3, an example being provided in(Figure 28). The ∆
value from the fit for all samples was found to be positive and as such a
correction factor was not required in the results.
Figure 28 – Compliance check for specimens with impact
The mode I fracture toughness was plotted as a function of crack length
(Figure 29). Only two of the four samples tested provided valid results to
analyse, as two samples did not provide enough data points due to sudden
crack growth or premature fracture.
-0.4
-0.3
-0.2
-0.1
0
0.1
0.2
0.3
0.4
0.5
0.6
0 10 20 30 40 50 60 70 80 90 100
C/N
1/3
a
Correction factor, C/N1/3 vs a
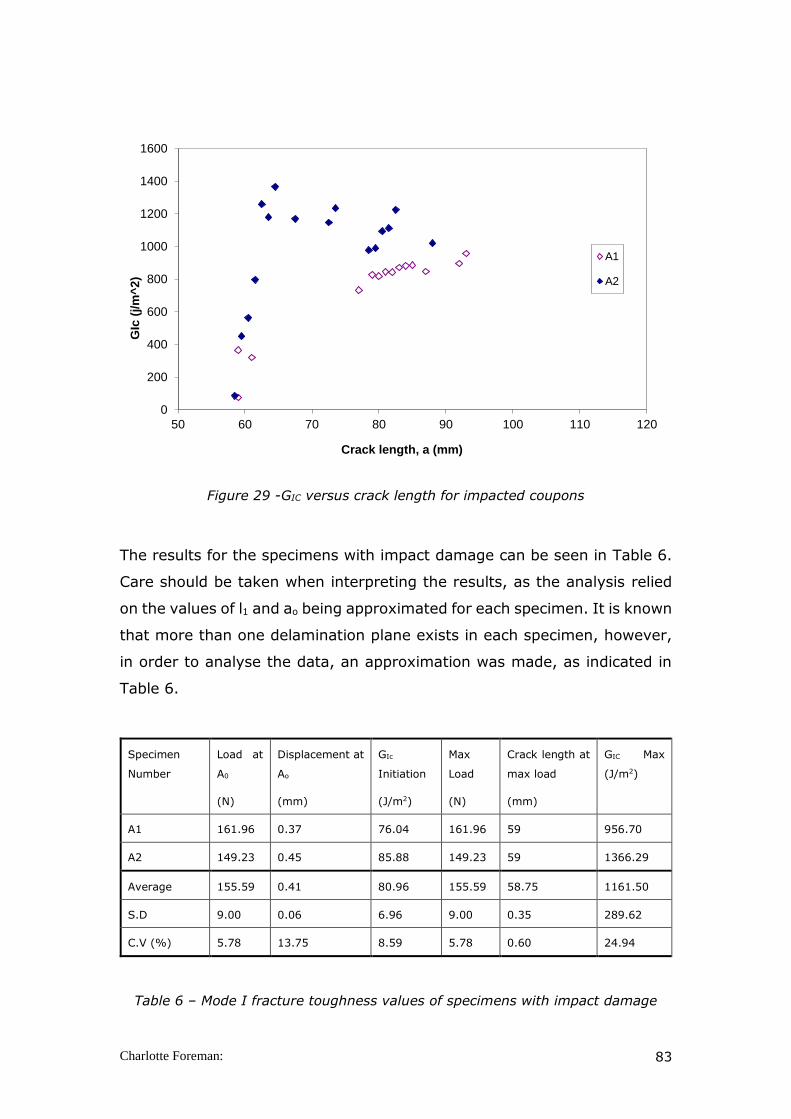
Charlotte Foreman: 83
Figure 29 -GIC versus crack length for impacted coupons
The results for the specimens with impact damage can be seen in Table 6.
Care should be taken when interpreting the results, as the analysis relied
on the values of l1 and ao being approximated for each specimen. It is known
that more than one delamination plane exists in each specimen, however,
in order to analyse the data, an approximation was made, as indicated in
Table 6.
Table 6 – Mode I fracture toughness values of specimens with impact damage
0
200
400
600
800
1000
1200
1400
1600
50 60 70 80 90 100 110 120
GIc
(j/m
^2
)
Crack length, a (mm)
A1
A2
Specimen
Number
Load at
A0
(N)
Displacement at
Ao
(mm)
GIc
Initiation
(J/m2)
Max
Load
(N)
Crack length at
max load
(mm)
GIC Max
(J/m2)
A1 161.96 0.37 76.04 161.96 59 956.70
A2 149.23 0.45 85.88 149.23 59 1366.29
Average 155.59 0.41 80.96 155.59 58.75 1161.50
S.D 9.00 0.06 6.96 9.00 0.35 289.62
C.V (%) 5.78 13.75 8.59 5.78 0.60 24.94

Charlotte Foreman: 84
Unfortunately it was not possible to inspect the specimens post failure using
fractographic techniques as the customer required the specimens to be
returned.
3.6. Mode II ENF Test Results
3.6.1. Introduction
Within this section the results for the end notch flexure test can be seen.
The maximum load and displacement has been provided along with the
mode II fracture toughness.
3.6.2. Standard Specimen with Artificial Insert
The load as a function of crosshead displacement can be seen in Figure 30.
Figure 30 – Load versus displacement of mode II coupons with artificial inserts
located at mid ply
The results for the specimens with PTFE insert located at mid thickness can
be seen in Table 7. Sample A16 has been highlighted red as this samples
response under load was found to be inconsistent with the remaining batch
of specimens.
0
200
400
600
800
1000
1200
1400
1600
0 0.5 1 1.5 2 2.5
Displacement (mm)
Lo
ad
(N
)
A16
A17
A18
A19
A20

Charlotte Foreman: 85
Table 7 – Mode II fracture toughness for artificial insert located at mid ply
The results for the mode II (ENF) test with the PTFE insert located at 1/3
thickness can be seen in Figure 31 and Table 8. As with the previous batch
of samples, one sample has been highlighted red as the results are
inconsistent with the remaining batch, this sample has not been included
within the averages of the strain energy release rates.
Figure 31 - Load versus displacement of mode II coupons with artificial inserts
located between 0/90 and +/- plies.
Width Max load
Displacement
at Max load L a
GIIc (direct
beam)
GIIc (Modif ied
beam)
GIIc (Corrected
Modif ied beam)
m N m m m J/m 2̂ J/m 2̂ J/m 2̂
A16 0.02 953.7068 0.00169 0.050 0.025 764.09 369.81 369.81
A17 0.02 1218.46 0.00167 0.050 0.025 964.63 603.62 603.62
A18 0.02 1189.987 0.00167 0.050 0.025 939.08 575.74 575.74
A19 0.02 1356.998 0.00177 0.050 0.025 1138.63 748.69 748.69
A20 0.02 1410.162 0.00185 0.050 0.025 1232.95 808.50 808.50
Average 1225.86 0.00173 1007.88 621.27 621.27
S.D 177.89 0.00008 182.89 170.96 170.96
C.V (%) 14.51 4.49 18.15 27.52 27.52
Specimen
Number
0
200
400
600
800
1000
1200
1400
1600
1800
2000
0 1 2 3 4 5
Displacement (mm)
Lo
ad
(N
)
B16
B17
B18
B19
B20
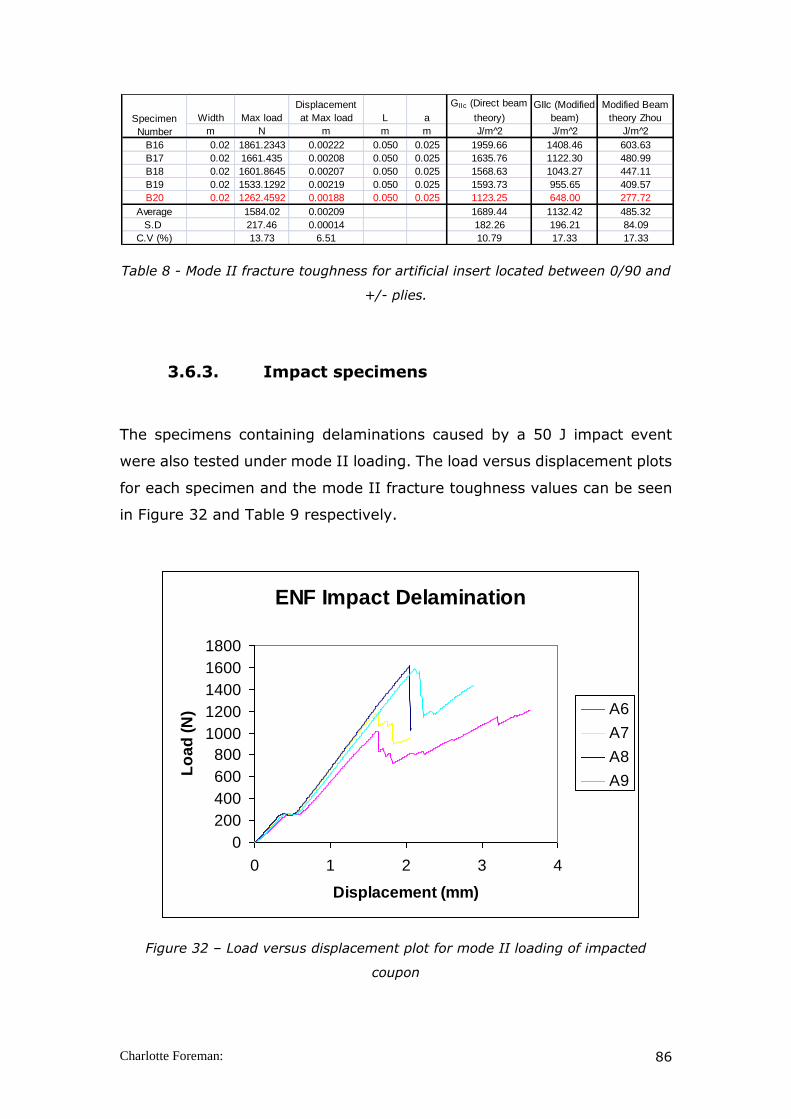
Charlotte Foreman: 86
Table 8 - Mode II fracture toughness for artificial insert located between 0/90 and
+/- plies.
3.6.3. Impact specimens
The specimens containing delaminations caused by a 50 J impact event
were also tested under mode II loading. The load versus displacement plots
for each specimen and the mode II fracture toughness values can be seen
in Figure 32 and Table 9 respectively.
Figure 32 – Load versus displacement plot for mode II loading of impacted
coupon
Width Max load
Displacement
at Max load L a
GIIc (Direct beam
theory)
GIIc (Modified
beam)
Modified Beam
theory Zhou
m N m m m J/m 2̂ J/m 2̂ J/m 2̂
B16 0.02 1861.2343 0.00222 0.050 0.025 1959.66 1408.46 603.63
B17 0.02 1661.435 0.00208 0.050 0.025 1635.76 1122.30 480.99
B18 0.02 1601.8645 0.00207 0.050 0.025 1568.63 1043.27 447.11
B19 0.02 1533.1292 0.00219 0.050 0.025 1593.73 955.65 409.57
B20 0.02 1262.4592 0.00188 0.050 0.025 1123.25 648.00 277.72
Average 1584.02 0.00209 1689.44 1132.42 485.32
S.D 217.46 0.00014 182.26 196.21 84.09
C.V (%) 13.73 6.51 10.79 17.33 17.33
Specimen
Number
ENF Impact Delamination
0
200
400
600
800
1000
1200
1400
1600
1800
0 1 2 3 4
Displacement (mm)
Lo
ad
(N
) A6
A7
A8
A9
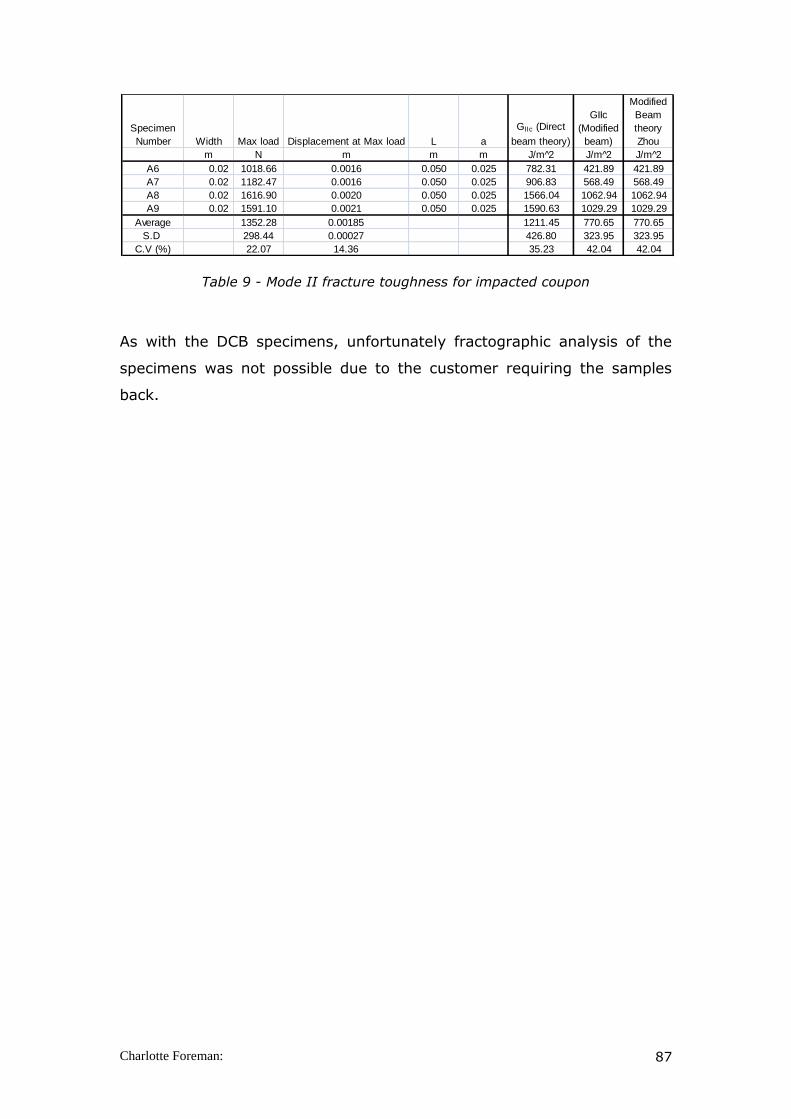
Charlotte Foreman: 87
Table 9 - Mode II fracture toughness for impacted coupon
As with the DCB specimens, unfortunately fractographic analysis of the
specimens was not possible due to the customer requiring the samples
back.
Specimen
Number Width Max load Displacement at Max load L a
GIIc (Direct
beam theory)
GIIc
(Modified
beam)
Modified
Beam
theory
Zhou
m N m m m J/m 2̂ J/m 2̂ J/m 2̂
A6 0.02 1018.66 0.0016 0.050 0.025 782.31 421.89 421.89
A7 0.02 1182.47 0.0016 0.050 0.025 906.83 568.49 568.49
A8 0.02 1616.90 0.0020 0.050 0.025 1566.04 1062.94 1062.94
A9 0.02 1591.10 0.0021 0.050 0.025 1590.63 1029.29 1029.29
Average 1352.28 0.00185 1211.45 770.65 770.65
S.D 298.44 0.00027 426.80 323.95 323.95
C.V (%) 22.07 14.36 35.23 42.04 42.04
Charlotte Foreman: 88
3.7. Discussion
3.7.1. Mode I
The load-displacement curves for the specimens with an insert were very
consistent and there was found to be very little scatter between the
samples; both when the insert was at mid-plane or at 1/3 plane. This gave
confidence in the results obtained. The load-displacement curves for all
types of specimens tested show relatively abrupt load drops, this can be
attributed to unstable crack growth. The goodness of fit for the compliance
calibration meant that a value (point of intersection of x axis from
compliance plot) of zero could be used for the impacted specimens, however
for the specimens with inserts a correction was was applied to the results..
Unfortunately, only two of the impacted samples provided enough data
points to be analysed. One sample failed prior to crack initiation (sample
A4) and another sample had a large secondary crack (sample A3) and as
such, monitoring crack growth became an issue. From the two remaining
samples (Samples A1 & A2), sample A2 provided the more typical load
displacement curve, with crack growth being more stable. Despite the
novelty of using impact damaged specimens for mode I DCB testing, and
the difficulties described above, the testing and analysis undertaken
demonstrates the validity and usefulness of the experimental approach for
future studies.
Table 10 below shows a comparison of the Mode I initiation values along
with the maximum interlaminar fracture toughness value.

Charlotte Foreman: 89
Sample Type Average load at
initiation (N)
Average GIC at
initiation (J/m2)
Max GIC
(J/m2)
Insert at mid
plane
83.75 296.6 1137.5
Insert at 1/3
plane
67.81 273.28 525.18
Impact 155.59 80.96 1161.50
Table 10 – Comparison of initiation values and max GIC
The results from test samples with film inserts clearly show a greater load
at initiation with the insert located at the mid plane (P(mid) ~ 1.24P(1/3)). This
shows very good agreement of experimental results with the result
established from the derivation shown in equation 3.3.3.3-13, where Pimid
=1.4Pi1/3. In terms of the initiation load for samples with an impact, the load
to initiate a crack was 66% greater than with a starter crack at the mid
plane. This implies that because there is more than one delamination arising
from an impact event, the load is distributed over multiple delamination
crack fronts and a greater load is therefore required to grow the critical
delamination. The maximum GIC for the samples with insert at the mid plane
and the samples with impact delamination were similar (within 10%), being
1137.5 J/m2 and 1161.50 J/m2 respectively however the maximum GIC for
the sample with the insert at 1/3 plane was found to be 30% less than the
insert at mid plane, this illustrates that although the load to initiate the
delamination is greater for impacted samples, once the critical delamination
grows, the energy required to propagate the crack is lower than the energy
required to propagate a crack from an insert.
A very recent study by Stegschuster et al (2016) on mode I delamination
of 3D woven composites reported Mode I initiation values as approximately
350 J / m2 and propagation values of approximately 900 J / m2, showing
good agreement with the values obtained within this study.

Charlotte Foreman: 90
The shapes of the R-curve for the standard specimen with the insert at mid
plane was typical (see Figure 17 and Figure 24), the initiation GIC values
were found to be is less than the propagation values, which complies with
the requirements (ESIS ISO 15024) and as such the specimens were not
required to be modified in terms of a wedge precrack. The propagation GIC
values for the insert at 1/3 plane (between the +45/-45 plies) were found
to be approximately half the propagation GIC values for the insert at the
centre. The impacted samples appeared to have the same value for
initiation and propagation, however these results have been rather difficult
to interpret due to the presence of multiple delaminations and the
associated challenge of accurately monitoring crack propagation and having
accurate values to input into the analysis.
There have been reports that when characterising 0/0 ply interfaces, the
plies tend to nest during processing which promotes the development of
fibre bridging during testing, which increases the apparent toughness. Such
nesting, and therefore fibre bridging does not develop in multidirectional
ply interfaces (Greenhalgh et al, 2009) and as such the toughness value is
not over estimated. Analysis of the fracture surface would be required to
determine if fibre bridging had occurred in the NCF samples. The fact that
the propagation value for the insert at the mid plane are greater than the
propagation at 1/3 plane could be due to the fact that some fibre bridging
occurred at the interface 0/90, whereas no bridging occurred between the
+45/-45 interface.
3.7.2. Mode II
The load displacement plots for the samples with inserts at the mid plane
and at 1/3 plane had very little scatter, giving confidence in the results.
One sample with the insert at mid plane appeared to have a different
compliance to the rest, also having a lower maximum load, however the
variance between the maximum loads for all the samples was found to be
relatively small, at 14%. All samples tested (with artificial insert and
impact) demonstrated a linear response, followed by increasing non-
linearities as the crack begins to propagate. All the samples exhibit a

Charlotte Foreman: 91
maximum load level, after which the load drops as the crack begins to
propagate. The crack propagated in a stable manner during the
displacement controlled fracture testing for all the specimens, with the
exception of those highlighted in red in the tables. Although the ENF test is
designed for prepreg materials, the test was deemed successful due to the
consistency of the results, and analysis was possible for all of the
configurations included. Table 11 shows the comparison of results between
different sample types as well as showing the results using different analysis
methods.
Specimen Type GIIC (J/m2)
Direct beam
GIIC (J/m2)
Modified beam
GIIC (J/m2)
Modified for
asymmetric
bending
Insert at mid plane 1007.88 621.27 621.27
Insert at 1/3 plane 1689.44 1132.42 485.32
Impacted 1211.45 770.65 770.65
Table 11 – Comparison of mode II interlaminar fracture toughness
Calculating results using the modified beam method is important as
otherwise the interlaminar fracture toughness values would be
overestimated. It should also be noted that if the standard modified beam
data analysis is used for samples where the delamination is not at the centre
then the interlaminar fracture toughness value would be overestimated
considerably (233%).
A number of authors (Lee, 1999, Greenhalgh et al, 2009) have discussed
the damage process of Mode II fracture, stating that cusp formation and
deformation is thought to be the dominant energy absorbing process during
mode II fracture. The authors have concluded that the cusp formation leads
to an overall increase in fracture energy absorption and toughness with the
mode II component, which is why mode II fracture exceeds Mode I fracture
toughness. This has been validated in this study, with all mode II
interlaminar fracture toughness values being greater than the mode I

Charlotte Foreman: 92
values. This could be studied further by looking at the fracture surfaces for
NCF’s in future studies to determine if the cusp formation phenomenon is
observed for NCF as well as prepregs.
Greenhalgh et al (2009) explained the mechanisms of crack migration in
multidirectional laminates, stating that there is a natural tendency for a
delamination to migrate upwards towards the compressive face of the
laminate under bending until it reaches an interface in which the ply is
orientated parallel to the driving force. Observing the lay-up of the NCF, the
mid plane interface would be between a 90 / +45 ply and so the crack would
likely to have migrated to the 0/90 ply interface, just one ply away (Figure
10). For the insert at 1/3 plane the ply interface was 90/90, however again
the crack would only have migrated one ply away to the 0/0 interface. On
observing the crack propagation, crack migration was not obvious during
testing, which would support this assumption. Crack migration may have
been limited due to the stitching technique used for NCF blanket production.

Charlotte Foreman: 93
4. Experimental Work on Structural Element
4.1. Introduction
This section outlines the experimental fatigue study carried out on a series
of impacted structural elements. The element characteristics are detailed,
along with the results from the experimental tests and non-destructive
testing. The results have been analysed and are outlined within the
discussion.
As highlighted from the literature review, there is limited research available
for the fatigue behaviour of structural components; the majority of work to
date has concentrated upon coupon specimens, which although providing
information on the material behaviour, structural effects are absent. Ideally,
all testing should be carried out on a structure similar to that seen in
service; however, large scale structural testing is extremely expensive and
it is for this reason that this study has considered a structural element. In
service, the structures that are likely to be subjected to an impact event
often have structural additions such as stiffeners and as such, a single blade
stiffened panel was identified as the structural element to test throughout
this part of the study.
As reported in the literature review, Dorey (1986) investigated the impact
response of stiffened panels, and reported that the energy to cause BVID
dropped significantly near the stiffeners, where the structure was less
compliant, and the stiffeners caused the damage to spread asymmetrically.
Davies et al (1994) showed that at the edge of the stiffeners, delaminations
were formed, whilst impacts directly over the stiffener caused debonding
between plate and stiffener. It was for this reason that the location of the
impact was chosen within this study to be in the centre of the length of the
panel, adjacent to the foot of the stringer (Figure 33), therefore reducing
the severity of edge effects, whilst maximising the chances of delaminations
being formed, as opposed to debonding of the stringer.
Charlotte Foreman: 94
Once a delamination is present, it has been reported (Rogers et al (2008)),
that mode II is the dominant failure mode for propagation and therefore
the loading for this study was chosen to induce high levels of mode II
loading, by loading both in-plane and out-of-plane.
4.2. Manufacture of the structure
Due to this study concentrating upon damage management in aerospace
structures, it is carbon fibre reinforced epoxy resin that was selected for the
material throughout the study. The material chosen was IMS - 977/2 which
is a prepreg system containing continuous high strength carbon fibres in a
toughened epoxy 977/2 resin system, supplied by Cytec, with a nominal
fibre volume fraction of 55-wt%.
Structural elements were manufactured from Cytec’s IMS-977/2 prepreg.
The skin lay-up for the elements was [+45, 0, -45, 0, 90, 0, -45, 0, +45]s,
with each ply having a nominal thickness of 0.25 mm, resulting in a cured
skin thickness of approximately 4.7 mm. The skin was approximately 290
mm long and 180 mm wide (Figure 33). The elements were cured in an
autoclave at a temperature of 180°C, with a ramp up rate of 2°C / min and
cured for 3 hours.

Charlotte Foreman: 95
Figure 33 – Schematic of geometry of structural element
The blade was constructed from two back to back ‘L’ sections with a lay-up
of [+45, -45, 0, 90 ]s [-45, +45, 0, 90]S, again, with a nominal ply thickness
of 0.25 mm, giving a blade thickness of approximately 4.2 mm. This lay-up
was chosen as it is representative of a typical aerospace lay-up. The blade
height was 40 mm from the foot of the blade, with the blade foot having a
width of 80 mm and thickness of 2.1 mm. The blade stringer was bonded
onto the skin using Cytec FM73 film adhesive, typically 10m thick. A
schematic showing the geometry and dimensions of the elements can be
seen in Figure 33 above.
After trimming to size, and C-scanning, the elements were end potted using
aluminium channelling, to a depth of 20 mm using Araldite AW-106 epoxy
resin with HV953U hardener and HV997 accelerator, in order to prevent
brooming of the panel ends and to ensure even loading across the panel
width. The free length of the element was approximately 250 mm, as
depicted in Figure 33.
125mm
180mm
250mm free length
4mm
25mm
Impact
4 .7 mm skin thickness
40mm blade height from foot
Externa l Face
Internal Face
80mm
Delamination caused by impact
40mm
t = 4.2mm
2.1 mm
t = 4.7mm
Internal face
External face
180mm
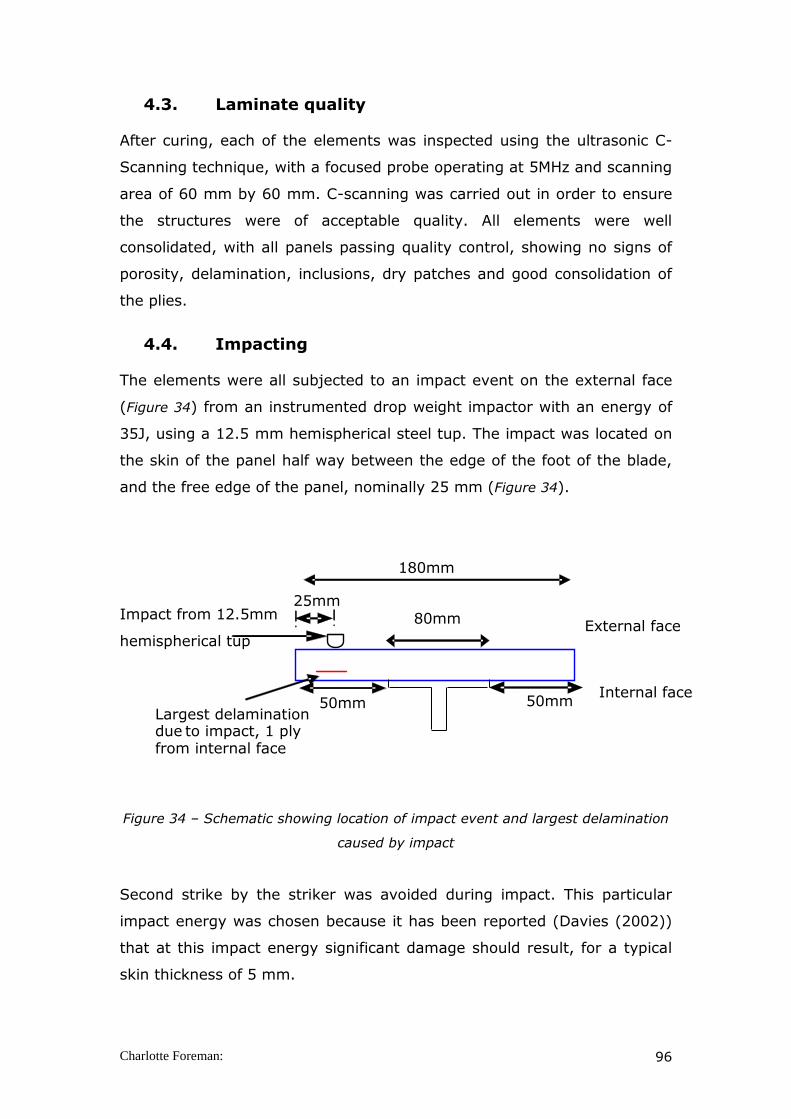
Charlotte Foreman: 96
4.3. Laminate quality
After curing, each of the elements was inspected using the ultrasonic C-
Scanning technique, with a focused probe operating at 5MHz and scanning
area of 60 mm by 60 mm. C-scanning was carried out in order to ensure
the structures were of acceptable quality. All elements were well
consolidated, with all panels passing quality control, showing no signs of
porosity, delamination, inclusions, dry patches and good consolidation of
the plies.
4.4. Impacting
The elements were all subjected to an impact event on the external face
(Figure 34) from an instrumented drop weight impactor with an energy of
35J, using a 12.5 mm hemispherical steel tup. The impact was located on
the skin of the panel half way between the edge of the foot of the blade,
and the free edge of the panel, nominally 25 mm (Figure 34).
Figure 34 – Schematic showing location of impact event and largest delamination
caused by impact
Second strike by the striker was avoided during impact. This particular
impact energy was chosen because it has been reported (Davies (2002))
that at this impact energy significant damage should result, for a typical
skin thickness of 5 mm.
Internal face
External face
180mm
80mm
50mm 50mm
Impact from 12.5mm
hemispherical tup
25mm
Largest delamination due to impact, 1 ply from internal face

Charlotte Foreman: 97
4.5. Non destructive testing
After impact, and after each loading event, all elements were C-scanned
with full waveform capture being carried out, in order to verify the ply in
which the critical delamination occurred; Figure 35. A focused probe
operating at 5 MHz was used. The resolution of the scan was set to 0.3 mm
and the area of the scan limited to 60 mm by 60 mm, centred directly over
the impact site, as this was sufficient to determine the delamination size.
The only form of damage that could be detected by scanning was
delamination; any matrix cracking or fibre fracture occurring could not be
detected. However, as delamination growth is the growth mechanism of
most concern, further analysis was not necessary. From the scan it was
evident that the largest delamination was approximately 1 ply from the
internal face of the panel, at the +45 / 0 ply interface (Figure 35).
Figure 35 – Through thickness C-Scan showing delamination pattern - Location of
largest delamination between the -45 / 0 ply, one ply from the internal face
Largest delamination is coloured purple and is ~0.3mm from the internal face. Each ply is 0.27mm thick, therefore the delamination lies between the first and second ply from the internal face

Charlotte Foreman: 98
4.6. Experimental arrangement
All structural elements were mounted on a 500 kN, four actuator, multi-
axial test machine, with two parallel platens acting in the x-direction, and
a third actuator, perpendicular to the x-direction. This third actuator was
used in order to apply an out-of-plane displacement to the structural
element, to induce bending of the panel. The bending was required in order
to produce a shear across the delamination. The fourth actuator was
disabled.
Prior to applying any significant loads to the panels, a layer of shimming
epoxy was applied between the channelling on the panel and the platen, to
remove any irregularities in the contact surfaces and to ensure an even load
distribution across the panel. The platens, in the x-direction, were used to
apply the in-plane load to the panel and the third actuator (z direction) was
used to apply an out-of-plane displacement to the panel. A photograph of
the set-up can be seen in
Figure 36.
Figure 36 – Photograph of test set-up showing both in-plane actuator (x) and out-
of-plane load application tup (z) with blade stiffened panel in position
x z
x

Charlotte Foreman: 99
A number of structural elements have been tested. The details of the strain
gauge arrangement, loading arrangement and strain gauge results follows.
4.7. Loading arrangement and results of element
testing
A description of the loading arrangement for each element tested is
provided within this section. The table below provides details for the loading
arrangement for each test.
Element Load
application
order
Position of
out of plane
application
Type of
applicator
head
In-plane strain –
out of plane
displacement
range
1 In plane load
then out of
plane
displacement
External
face centre
of panel
Single
hemispherical
head
1-4mm
displacement
2600e
2 In plane load
then out of
plane
displacement
External
face, centre
of panel
Single
hemispherical
head
0.5 – 2.5mm
displacement,
4200 – 4400 e
2 In plane load
then out of
plane
displacement
External
face, centre
of panel
Spreader
plate
1.5mm out of
plane, 4400e
2 Out of plane
displacement
then in plane
load
External
face, centre
of panel
Spreader
plate
3-5mm out of
plane, 4000 –
5400 e
2 Out of plane
displacement
then in plane
load
Internal
face
Centre of
blade
2mm out of plane,
4300 e
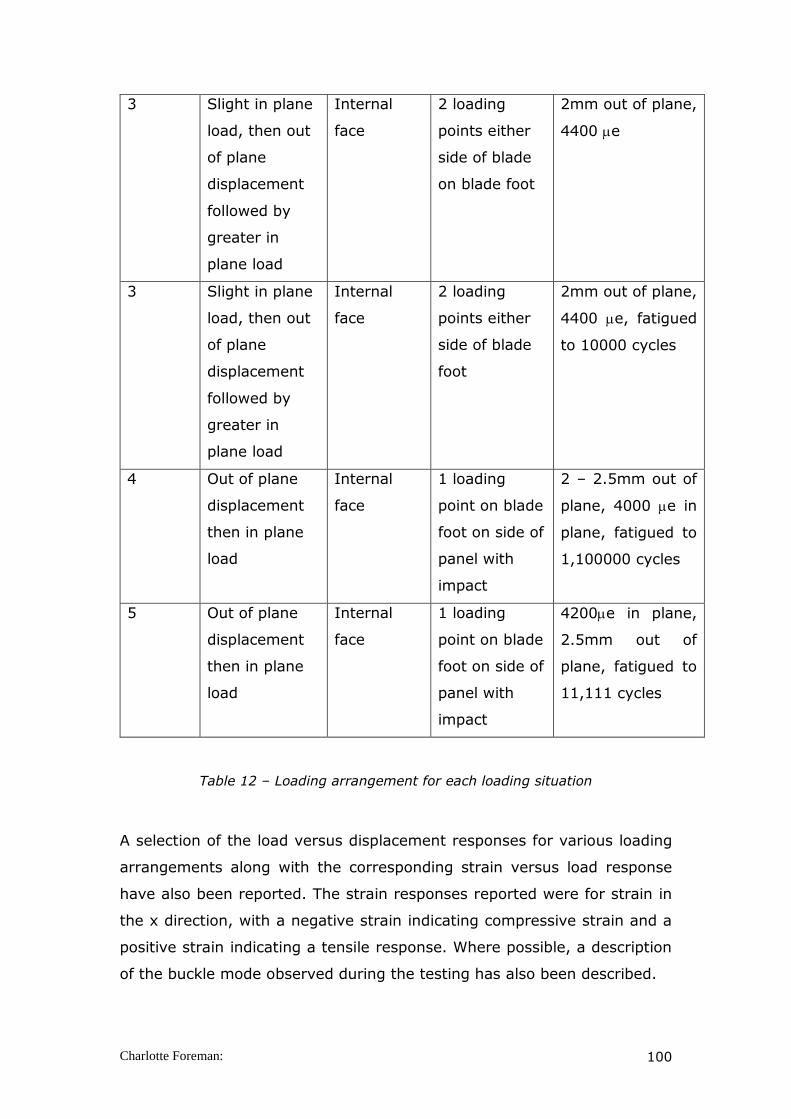
Charlotte Foreman: 100
3 Slight in plane
load, then out
of plane
displacement
followed by
greater in
plane load
Internal
face
2 loading
points either
side of blade
on blade foot
2mm out of plane,
4400 e
3 Slight in plane
load, then out
of plane
displacement
followed by
greater in
plane load
Internal
face
2 loading
points either
side of blade
foot
2mm out of plane,
4400 e, fatigued
to 10000 cycles
4 Out of plane
displacement
then in plane
load
Internal
face
1 loading
point on blade
foot on side of
panel with
impact
2 – 2.5mm out of
plane, 4000 e in
plane, fatigued to
1,100000 cycles
5 Out of plane
displacement
then in plane
load
Internal
face
1 loading
point on blade
foot on side of
panel with
impact
4200e in plane,
2.5mm out of
plane, fatigued to
11,111 cycles
Table 12 – Loading arrangement for each loading situation
A selection of the load versus displacement responses for various loading
arrangements along with the corresponding strain versus load response
have also been reported. The strain responses reported were for strain in
the x direction, with a negative strain indicating compressive strain and a
positive strain indicating a tensile response. Where possible, a description
of the buckle mode observed during the testing has also been described.

Charlotte Foreman: 101
Element 1
A number of single cycle tests were carried out on the first structural
element (element 1) with varying degrees of in-plane strain being applied
first, followed by an out-of-plane displacement being applied to the external
face, in the centre of the panel. The strain gauge arrangement for this
element, for all loading situations can be seen in Figure 37. The strain
gauges consisted of a single foil type gauge with a gauge length of 5 mm
aligned to the x - axis of the panel. The location of gauge 1 was chosen to
be 25 mm from the delamination centre. The approximate radius of the
delamination was found to be 16 mm and therefore the strain gauge was
positioned to capture the response of the material in close proximity to the
delaminated region.
Figure 37 – Schematic of strain gauge arrangement for Element 1
The results for this loading arrangement can be seen in (Table 13).
Internal Face
1i 2i
External Face
1e
Key
strain gauge
Impact location
Loading point
Uniaxial strain gauge
Delamination location
Out-of-plane loading
point
25mm

Charlotte Foreman: 102
Element
No
No.
Cycles
Test
sequence
Max
load
(x), kN
In-plane
strain
(max,
gauge
1e),
In-plane
strain
(gauge
1i)
Strain
gauge
diagram
Out-of–plane
displacement
mm
Loading
arrangement
1 1 1.1 178 -2642 -1819 Figure
35
1.87 In-plane
strain
applied prior
to out-of-
plane
displacement
in external
face
1.2 180 -2654 -1730 2.72
1.3 178 -2649 -1715 3.67
Table 13 – Loading results for Element 1
For this structural element test, an in-plane load was applied, until a strain
of 2500 was detected in gauge 1e, resulting in a load of approximately
180 kN. Following this, an out-of-plane displacement of 1.8 mm was
applied. The load versus displacement graph for this element can be seen
in Figure 38.
Figure 38 – Load x versus displacement in y axis (load case 1)
-2
-1.8
-1.6
-1.4
-1.2
-1
-0.8
-0.6
-0.4
-0.2
0
-200 -150 -100 -50 0
Load (kN)
Dis
pla
cem
en
t in
y a
xis
(m
m)
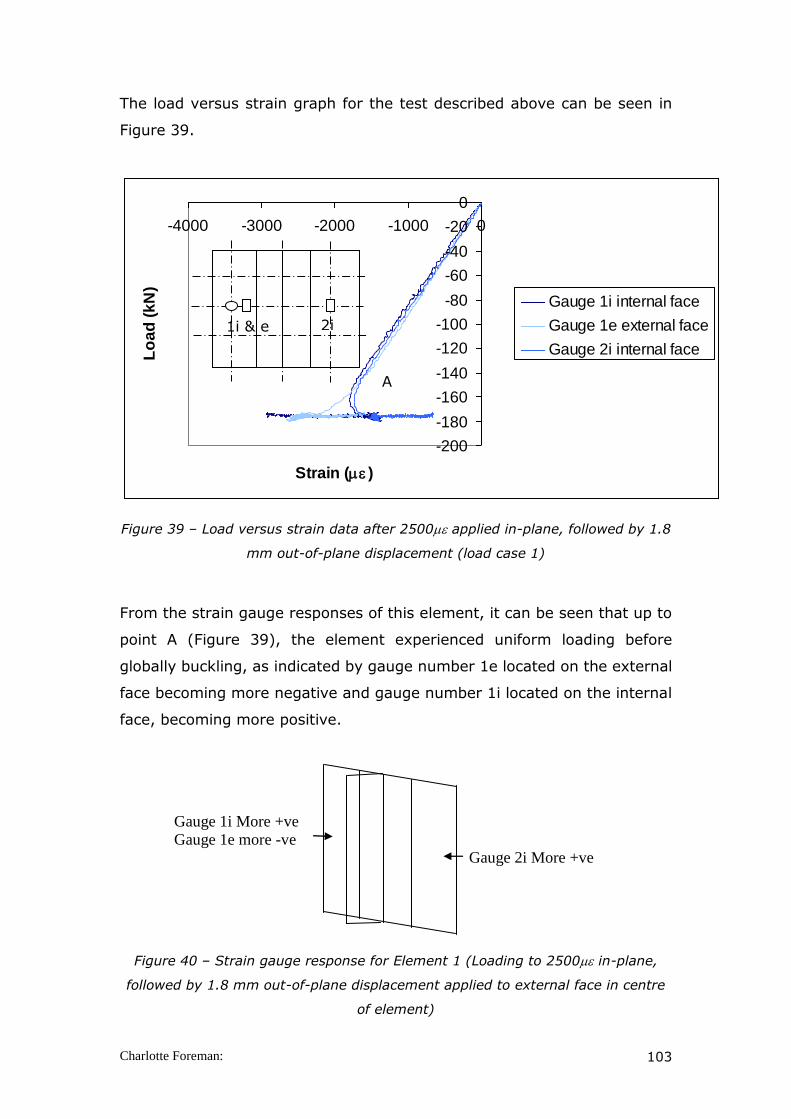
Charlotte Foreman: 103
The load versus strain graph for the test described above can be seen in
Figure 39.
Figure 39 – Load versus strain data after 2500 applied in-plane, followed by 1.8
mm out-of-plane displacement (load case 1)
From the strain gauge responses of this element, it can be seen that up to
point A (Figure 39), the element experienced uniform loading before
globally buckling, as indicated by gauge number 1e located on the external
face becoming more negative and gauge number 1i located on the internal
face, becoming more positive.
Figure 40 – Strain gauge response for Element 1 (Loading to 2500 in-plane,
followed by 1.8 mm out-of-plane displacement applied to external face in centre
of element)
-200
-180
-160
-140
-120
-100
-80
-60
-40
-20
0
-4000 -3000 -2000 -1000 0
Strain ( )
Lo
ad
(k
N)
Gauge 1i internal face
Gauge 1e external face
Gauge 2i internal face
Gauge 1i More +ve
Gauge 1e more -ve
Gauge 2i More +ve
1i & e
2i
A

Charlotte Foreman: 104
Following this initial test, further loading was applied to the same element,
with again 2500 being applied in-plane, however an increase in out-of-
plane displacement was required as no damage growth was detected after
the initial loading case. The out-of-plane displacement was increased to 2.7
mm, as can be seen in Figure 41.
Figure 41 – Load versus displacement in y axis (load case 2)
The load versus strain graph for the second load case can be seen in Figure
42.
Figure 42 – Load versus strain response after 2500 applied in-plane, followed
by 2.7 mm out-of-plane displacement (load case 2)
-3
-2.5
-2
-1.5
-1
-0.5
0
-200 -150 -100 -50 0
Load (kN)
Dis
pla
cem
en
t in
y a
xis
(m
m)
-200
-180
-160
-140
-120
-100
-80
-60
-40
-20
0
-4000 -3000 -2000 -1000 0
Strain ( )
Lo
ad
(kN
)
Gaugue 1i - internal
face
Gauge 1e - external
face
Gauge 2i - internal
face

Charlotte Foreman: 105
Again, it became apparent that no delamination growth had occurred and
therefore the out-of-plane displacement was increased further, as can be
seen in Figure 43.
Figure 43 – Load versus displacement in y - axis (load case 3)
Again, as with the previous loading cases, the load was plotted against
strain (Figure 44).
Figure 44 - Load versus strain response after 2500 applied in-plane, followed
by 3.6 mm out-of-plane displacement (load case 3)
-4
-3.5
-3
-2.5
-2
-1.5
-1
-0.5
0
-200 -150 -100 -50 0
Load (kN)
Dis
pla
cem
en
t in
y a
xes (
mm
)
-200
-180
-160
-140
-120
-100
-80
-60
-40
-20
0
-4000 -3000 -2000 -1000 0
Strain ()
Lo
ad
(kN
)
Gauge 1i - internal
face
Gauge 1e - external
face
Gauge 2i - external
face
2i
1i
1e
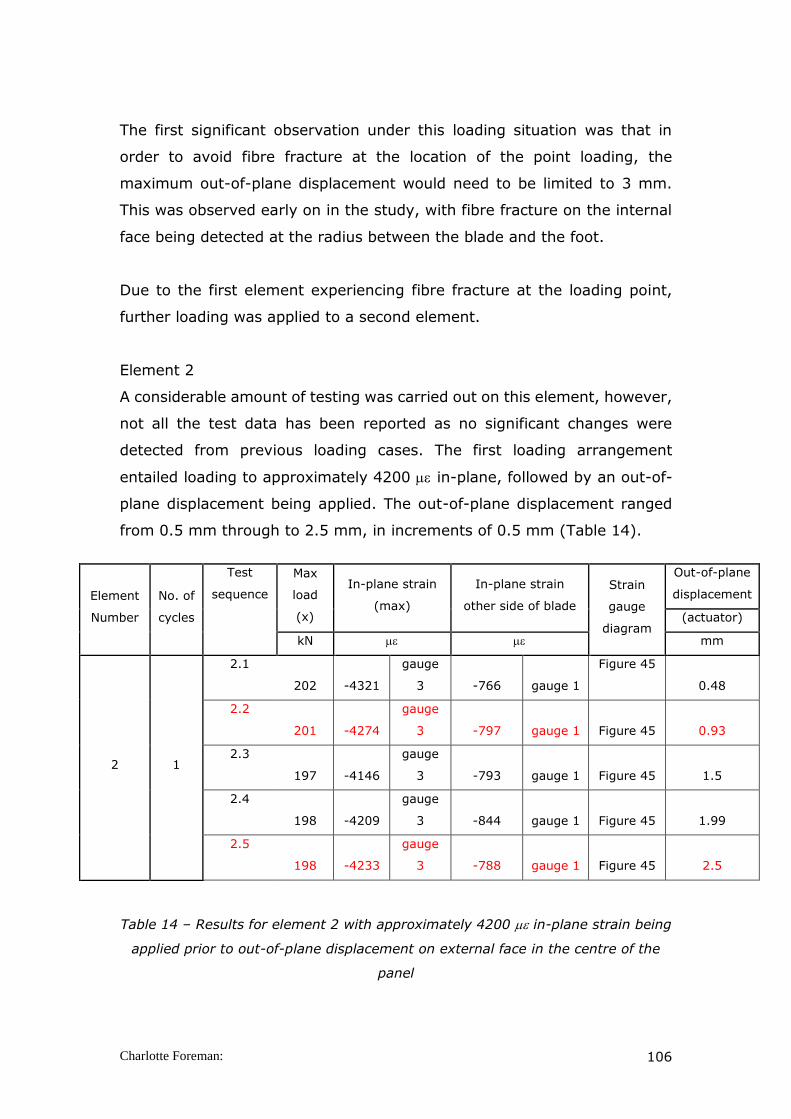
Charlotte Foreman: 106
The first significant observation under this loading situation was that in
order to avoid fibre fracture at the location of the point loading, the
maximum out-of-plane displacement would need to be limited to 3 mm.
This was observed early on in the study, with fibre fracture on the internal
face being detected at the radius between the blade and the foot.
Due to the first element experiencing fibre fracture at the loading point,
further loading was applied to a second element.
Element 2
A considerable amount of testing was carried out on this element, however,
not all the test data has been reported as no significant changes were
detected from previous loading cases. The first loading arrangement
entailed loading to approximately 4200 in-plane, followed by an out-of-
plane displacement being applied. The out-of-plane displacement ranged
from 0.5 mm through to 2.5 mm, in increments of 0.5 mm (Table 14).
Table 14 – Results for element 2 with approximately 4200 in-plane strain being
applied prior to out-of-plane displacement on external face in the centre of the
panel
Element
Number
No. of
cycles
Test
sequence
Max
load
(x)
In-plane strain
(max)
In-plane strain
other side of blade
Strain
gauge
diagram
Out-of-plane
displacement
(actuator)
kN mm
2 1
2.1
202 -4321
gauge
3 -766 gauge 1
Figure 45
0.48
2.2
201 -4274
gauge
3 -797 gauge 1 Figure 45 0.93
2.3
197 -4146
gauge
3 -793 gauge 1 Figure 45 1.5
2.4
198 -4209
gauge
3 -844 gauge 1 Figure 45 1.99
2.5
198 -4233
gauge
3 -788 gauge 1 Figure 45 2.5
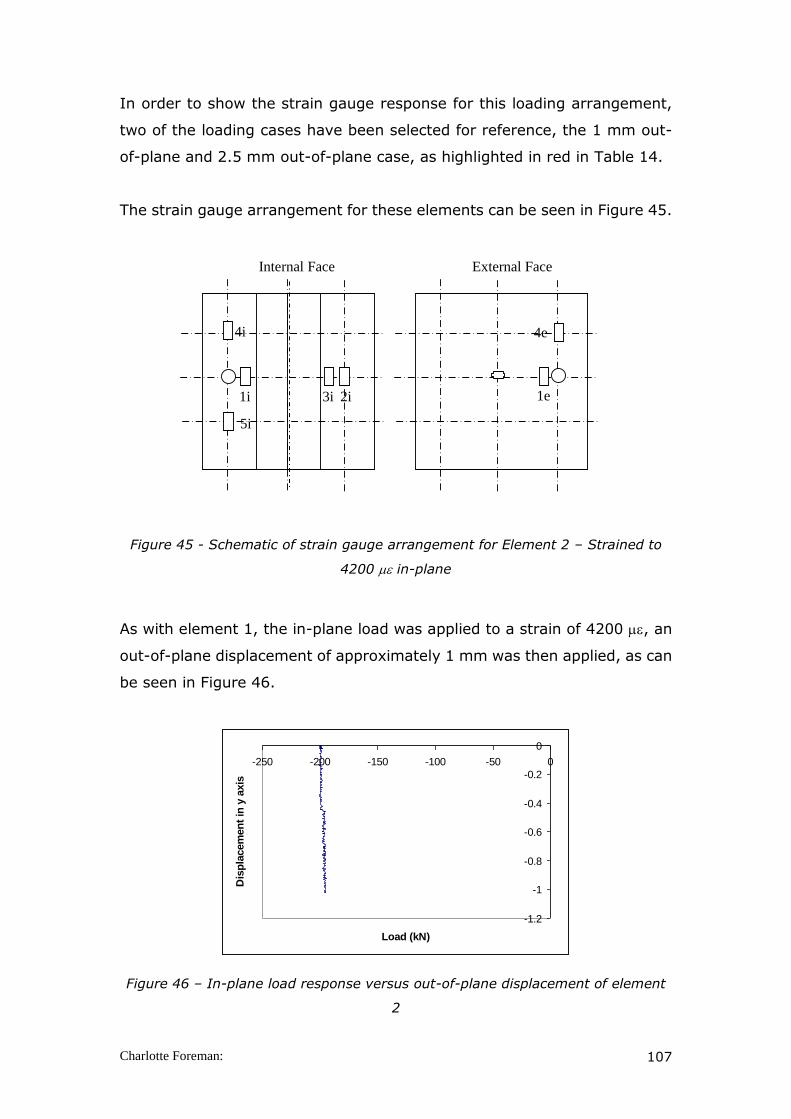
Charlotte Foreman: 107
In order to show the strain gauge response for this loading arrangement,
two of the loading cases have been selected for reference, the 1 mm out-
of-plane and 2.5 mm out-of-plane case, as highlighted in red in Table 14.
The strain gauge arrangement for these elements can be seen in Figure 45.
Figure 45 - Schematic of strain gauge arrangement for Element 2 – Strained to
4200 in-plane
As with element 1, the in-plane load was applied to a strain of 4200 , an
out-of-plane displacement of approximately 1 mm was then applied, as can
be seen in Figure 46.
Figure 46 – In-plane load response versus out-of-plane displacement of element
2
Internal Face
1i
2i
External Face
1e
Key
strain gauge
Impact location
Loading point
3i
4i
4e
5i
-1.2
-1
-0.8
-0.6
-0.4
-0.2
0
-250 -200 -150 -100 -50 0
Load (kN)
Dis
pla
cem
en
t in
y a
xis
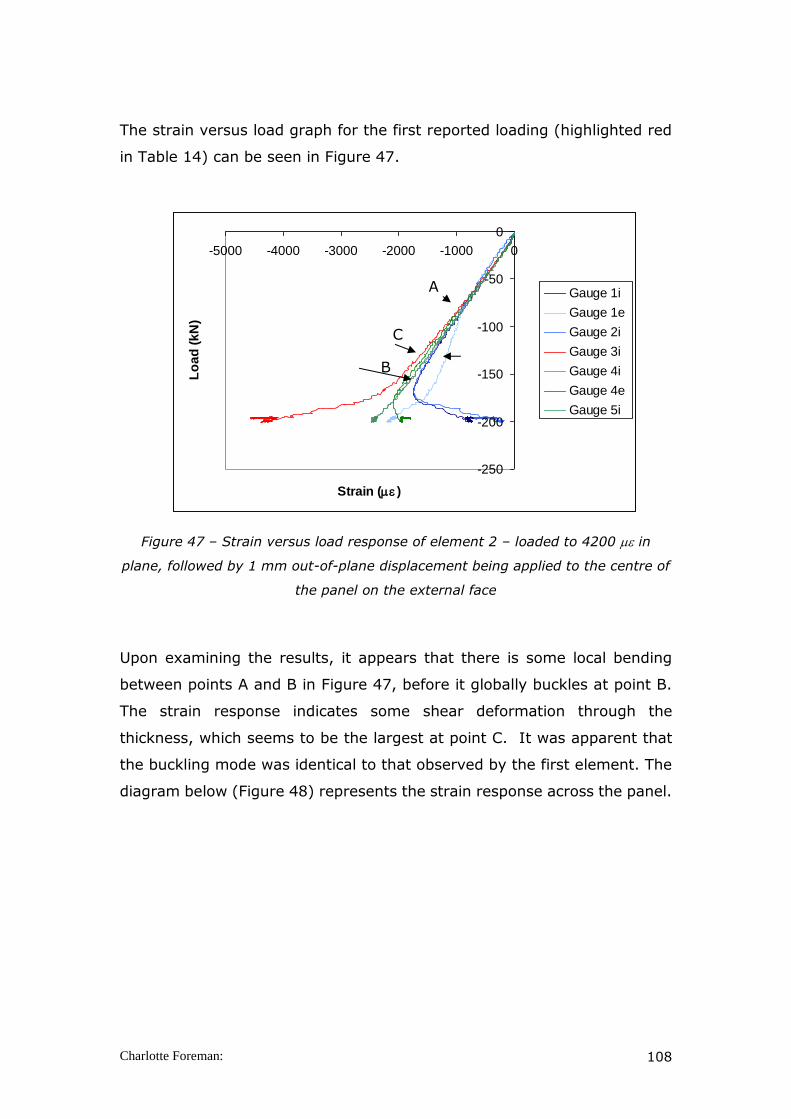
Charlotte Foreman: 108
The strain versus load graph for the first reported loading (highlighted red
in Table 14) can be seen in Figure 47.
Figure 47 – Strain versus load response of element 2 – loaded to 4200 in
plane, followed by 1 mm out-of-plane displacement being applied to the centre of
the panel on the external face
Upon examining the results, it appears that there is some local bending
between points A and B in Figure 47, before it globally buckles at point B.
The strain response indicates some shear deformation through the
thickness, which seems to be the largest at point C. It was apparent that
the buckling mode was identical to that observed by the first element. The
diagram below (Figure 48) represents the strain response across the panel.
-250
-200
-150
-100
-50
0
-5000 -4000 -3000 -2000 -1000 0
Strain ( )
Lo
ad
(k
N)
Gauge 1i
Gauge 1e
Gauge 2i
Gauge 3i
Gauge 4i
Gauge 4e
Gauge 5i
A
B
C

Charlotte Foreman: 109
Figure 48 – Strain response of element 2, with 4200 in–plane, followed by 1
mm out-of-plane displacement
However upon scanning the element, it was apparent that no delamination
growth had occurred and therefore the out-of-plane displacement that was
applied to the external face was increased in increments of 0.5 mm until a
maximum of 2.5 mm was applied, in an attempt to produce a greater shear
load across the delamination. Figure 49 and Figure 50 show the loading and
strain response of the element respectively for load case 2.5, where an out-
of-plane displacement of 2.5 mm was applied.
Figure 49 – Loading response of element 2 - loaded to 4200 in-plane, followed
by 2.5 mm out-of-plane displacement being applied to the centre of the panel on
the external face
Gauge 1i more +ve
Gauge 1e more -ve
Gauge 2i more +ve
4i more –ve
4e more +ve
5i more -ve
Gauge 3i more -ve
-3
-2.5
-2
-1.5
-1
-0.5
0
-250 -200 -150 -100 -50 0
Load (kN)
Dis
pla
ce
me
nt
in Y
(m
m)

Charlotte Foreman: 110
Figure 50 - Strain versus load response of element 2 – loaded to 4200 in-
plane, followed by 2.5 mm out-of-plane displacement being applied to the centre
of the panel on the external face.
The response of the strain gauges after a 2.5 mm out-of plane
displacement was applied was the same as after a 1 mm out-of plane
displacement, as shown in Figure 51. However, the shear component
closest to the delaminated region, as indicated by gauges 1i and 1e
appeared to have reduced, which, as highlighted within the literature
review would hinder the delamination growth.
Figure 51 - Strain response of element 2, with 4200 in –plane, followed by 2.5
mm out-of-plane displacement.
-250
-200
-150
-100
-50
0
-6000 -4000 -2000 0
Strain ( )
Lo
ad
(k
N)
Gauge 1i
Gauge 1e
Gauge 2i
Gauge 3i
Gauge 4i
Gauge 4e
Gauge 5i
Gauge 1i more +ve
Gauge 1e more -ve
Gauge 2i more +ve
4i more –ve
4e more +ve
5i more -ve
Gauge 3i more -ve
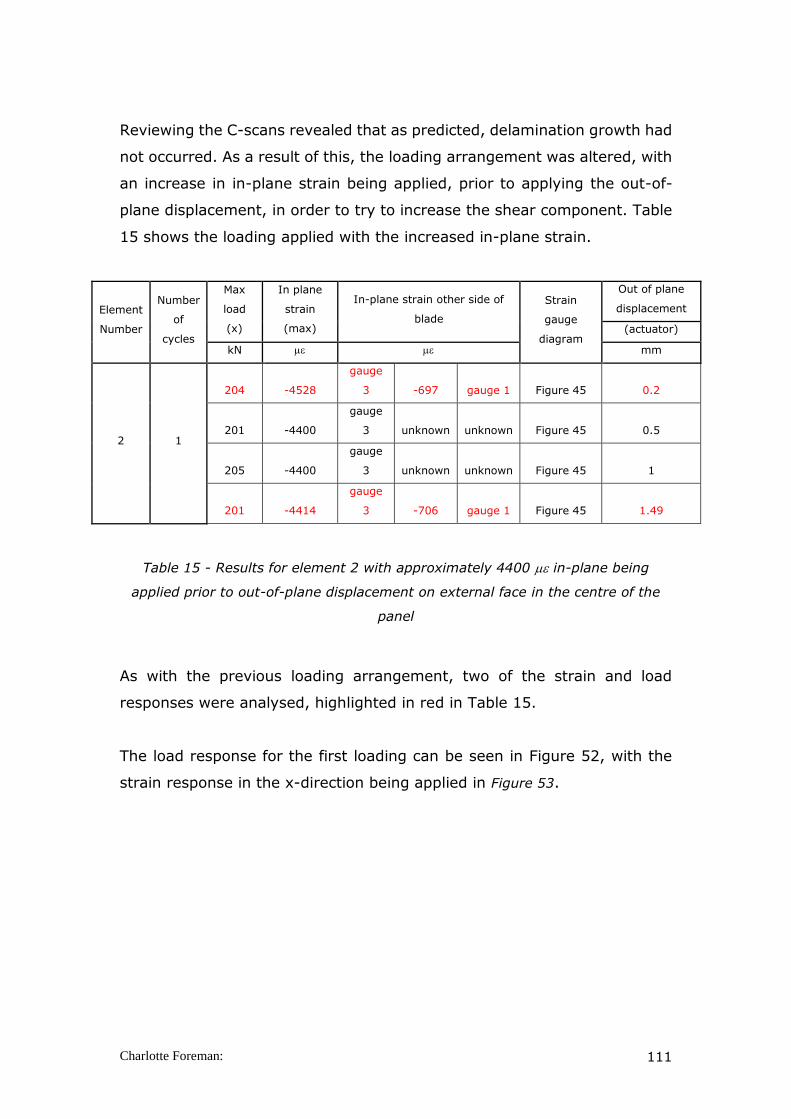
Charlotte Foreman: 111
Reviewing the C-scans revealed that as predicted, delamination growth had
not occurred. As a result of this, the loading arrangement was altered, with
an increase in in-plane strain being applied, prior to applying the out-of-
plane displacement, in order to try to increase the shear component. Table
15 shows the loading applied with the increased in-plane strain.
Element
Number
Number
of
cycles
Max
load
(x)
In plane
strain
(max)
In-plane strain other side of
blade
Strain
gauge
diagram
Out of plane
displacement
(actuator)
kN mm
2 1
204 -4528
gauge
3 -697 gauge 1 Figure 45 0.2
201 -4400
gauge
3 unknown unknown Figure 45 0.5
205 -4400
gauge
3 unknown unknown Figure 45 1
201 -4414
gauge
3 -706 gauge 1 Figure 45 1.49
Table 15 - Results for element 2 with approximately 4400 in-plane being
applied prior to out-of-plane displacement on external face in the centre of the
panel
As with the previous loading arrangement, two of the strain and load
responses were analysed, highlighted in red in Table 15.
The load response for the first loading can be seen in Figure 52, with the
strain response in the x-direction being applied in Figure 53.

Charlotte Foreman: 112
Figure 52 – Loading to 4400 in-plane, followed by a 0.2 mm out-of-plane
displacement being applied to the external face in the centre of the element
Figure 53 - Strain versus load response of element 2 – loaded to 4400 in-
plane, followed by 0.2 mm out-of-plane displacement being applied to the centre
of the panel on the external face.
-0.25
-0.2
-0.15
-0.1
-0.05
0
-250 -200 -150 -100 -50 0
Load (kN)
Dis
pla
cem
en
t in
Y a
xis
(m
m)
-250
-200
-150
-100
-50
0
-5000 -4000 -3000 -2000 -1000 0
Strain ( )
Lo
ad
(kN
)
Gauge 1i
Gauge 1e
Gauge 2i
Gauge 3i
Gauge 4i
Gauge 4e
Gauge 5i
A
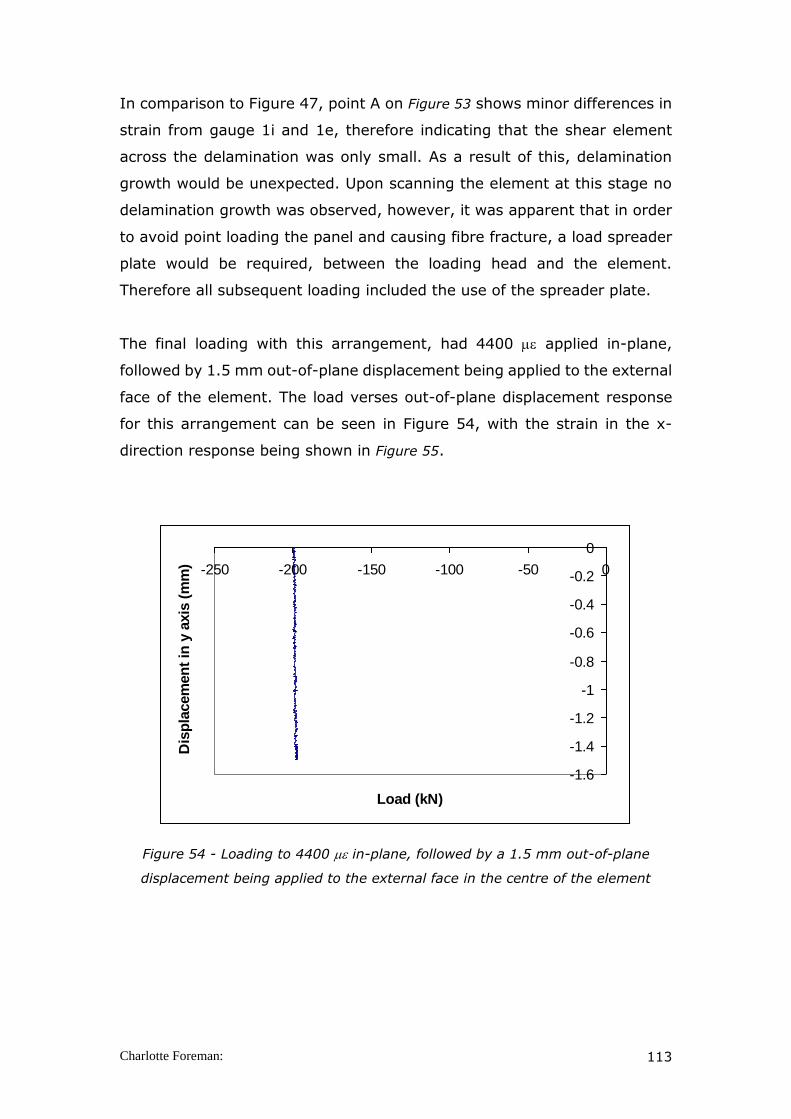
Charlotte Foreman: 113
In comparison to Figure 47, point A on Figure 53 shows minor differences in
strain from gauge 1i and 1e, therefore indicating that the shear element
across the delamination was only small. As a result of this, delamination
growth would be unexpected. Upon scanning the element at this stage no
delamination growth was observed, however, it was apparent that in order
to avoid point loading the panel and causing fibre fracture, a load spreader
plate would be required, between the loading head and the element.
Therefore all subsequent loading included the use of the spreader plate.
The final loading with this arrangement, had 4400 applied in-plane,
followed by 1.5 mm out-of-plane displacement being applied to the external
face of the element. The load verses out-of-plane displacement response
for this arrangement can be seen in Figure 54, with the strain in the x-
direction response being shown in Figure 55.
Figure 54 - Loading to 4400 in-plane, followed by a 1.5 mm out-of-plane
displacement being applied to the external face in the centre of the element
-1.6
-1.4
-1.2
-1
-0.8
-0.6
-0.4
-0.2
0
-250 -200 -150 -100 -50 0
Load (kN)
Dis
pla
cem
en
t in
y a
xis
(m
m)

Charlotte Foreman: 114
Figure 55 - Strain versus load response of element 2 – loaded to 4400 in-
plane, followed by 1.5 mm out-of-plane displacement being applied to the centre
of the panel on the external face.
As with previous loading cases for this element no delamination growth was
observed; however, it was apparent that although the delamination size
overall had not grown, full waveform capture NDE revealed that there were
in fact some competing mechanisms occurring (Figure 56).
Figure 56 – Full waveform capture C-Scan, of element 2, after loading to 4400
in-plane followed by 1.5 mm out-of-plane displacement.
-250
-200
-150
-100
-50
0
-5000 -4000 -3000 -2000 -1000 0
Strain ( )
Lo
ad
(kN
)
Gauge 1i
Gauge 1e
Gauge 2i
Gauge 3i
Gauge 4i
Delamination
reduced in size
Delamination
enlarged
Delamination
reduced in size
Delamination
enlarged
Delamination
reduced in size
Delamination
enlarged

Charlotte Foreman: 115
It became apparent that as one delamination plane opened, under the
influence of loading, the critical delamination plane closed, resulting in no
obvious delamination growth. It was therefore necessary to change the
loading arrangement to try to change the buckle shape in order to grow the
critical delamination (one ply down from the internal face).
Further loading was carried out on Element 2, with the out-of-plane
displacement being applied first and then the in-plane loading being applied
(see Table 16).

Charlotte Foreman: 116
No of
cycles
Max
load
(x)
In-plane strain
(max)
In-plane strain
other side of blade
Strain
gauge
diagram
Out-of-plane
displacement
Out-of-plane
displacement
(actuator) (LVDT 1)
kN mm mm
1
180
-
4054
gauge
3 -1855 gauge 1
Figure
45 2 3.4
198
-
4400
gauge
3 unknown unknown
Figure
45 2 3.76
200
-
4800
gauge
3 unknown unknown
Figure
45 2 4.64
208
-
5400
gauge
3 -2128 gauge 1
Figure
45 2 4.43
209
-
5381
gauge
3 -2494 gauge 1
Figure
45 2 5.53
Table 16 – Loading of element 2 with out-of-plane displacement applied to
external face in the centre of the panel prior to in-plane loading
However, the buckle shape did not change, from that observed under the
previous loading. The loading was therefore altered (Table 17), with the
out-of-plane displacement being applied to the internal face, (representing
aerodynamic loading of the wing). The loading was applied to the centre of
the blade (Figure 57).

Charlotte Foreman: 117
Element
Number
Number
of
cycles
Max
load
(x)
In plane strain
(max)
In-plane strain
other side of
blade
Strain
gauge
diagram
Out-of-plane
displacement
Out-of-plane
displacement
(actuator) (LVDT 1)
kN mm mm
2 1 210 -4105 gauge
6
-4312 gauge
8
Figure
57
1.99 4.6
Table 17 - Loading of element 2 with out-of-plane displacement applied to
internal face prior to in-plane loading
The strain gauge arrangement for this loading can be seen inFigure 57.
Figure 57 - Schematic of strain gauge arrangement for Element 2 – final loading
case
4e 4i
1i
5i
6i
2i
6e
2e 1e
5e
Internal Face External Face

Charlotte Foreman: 118
The loading response to element 2, for this final loading situation can be seen in
Figure 58.
Figure 58 – Applying a 2 mm out-of plane displacement to the centre of the
internal face, on the blade tip to element 2, before applying 4400 in-plane
strain.
The strain versus load history for this final loading arrangement can be seen in
Figure 59.
-2.5
-2
-1.5
-1
-0.5
0
-250 -200 -150 -100 -50 0
Load (kN)
Dis
pla
ce
me
nt
in y
(m
m)

Charlotte Foreman: 119
Figure 59 - Applying a 2 mm out-of-plane displacement to the centre of the
internal face, on the blade tip to element 2, before applying 4400 in-plane
strain.
Under this loading arrangement the buckle mode switched, as indicated by the
strain gauges (Figure 60).
Figure 60 – Schematic of strain response after buckling of element 2 – loading on
internal face on centre of blade.
-250
-200
-150
-100
-50
0
-5000 -4000 -3000 -2000 -1000 0
Strain ( )
Lo
ad
(k
N)
Gauge 1i
Gauge 1e
Gauge 2i
Gauge 2e
Gauge 4i
Gauge 4e
Gauge 5i
Gauge 5e
Gauge 6i
Gauge 6e
Gauge 1i more -ve
Gauge 1e more +ve
Gauge 2i more +ve
Gauge 2e more -ve
4i more +ve
4e more -ve
5i more +ve
5e more +ve
Gauge 6i more +ve
Gauge 6e more +ve

Charlotte Foreman: 120
In order to clarify the shear contribution through the thickness, Figure 61
highlights the gauge responses of interest.
Figure 61 – Strain response of element 2, indicating increased shear element
close to delamination site.
On reviewing the strain response in Figure 61, it is important to first report that
an offset in gauges 1i and 1e occurred, with localised buckling being indicated
upon applying the out-of-plane displacement. Applying the in-plane load after
this initial localised buckling had occurred, resulted in a large shear through the
thickness, close to the delamination location. The loading arrangement appeared
to be consistent with that required for delamination growth. Figure 61 indicates
that maximum growth should occur at a load of approximately 170 kN, where
the shear through the thickness was greatest.
Upon reviewing the ultrasonic C-scans taken after unloading, it became apparent
that growth was observed at 4400 with 2 mm out-of-plane displacement being
applied, as indicated in Figure 62. The delamination that appeared to have grown
can be seen in purple in Figure 62, having grown from 32 mm in length to 40
mm in length. This delamination was found to be approximately 0.3 mm from
the internal face of the element, at the interface of the +45 ply and the 0 ply.
-250
-200
-150
-100
-50
0
-5000 -4000 -3000 -2000 -1000 0
Strain ( )
Lo
ad
(k
N)
Gauge 1i
Gauge 1e
Gauge 2i
Gauge 2e
Gauge 4i
Gauge 4e1i
1e

Charlotte Foreman: 121
Figure 62 – Full waveform capture showing delamination growth of element 2
after applying 2 mm out-of-plane displacement to the internal face on the centre
of the blade and then applying 4400 in-plane strain
However, damage to the blade occurred under this loading situation due to point
loading the blade, therefore an alternative loading mechanism was
manufactured, which had a dual loading head.
Element 3
In order to obtain a similar buckling response to the panel which enabled
delamination growth to be observed (element 2), the third element was tested
with two loading points, on the blade foot, either side of the blade. The strain
gauge arrangement for this element can be seen in Figure 63.
Largest delamination
= 32mm
Largest delamination
= 40mm
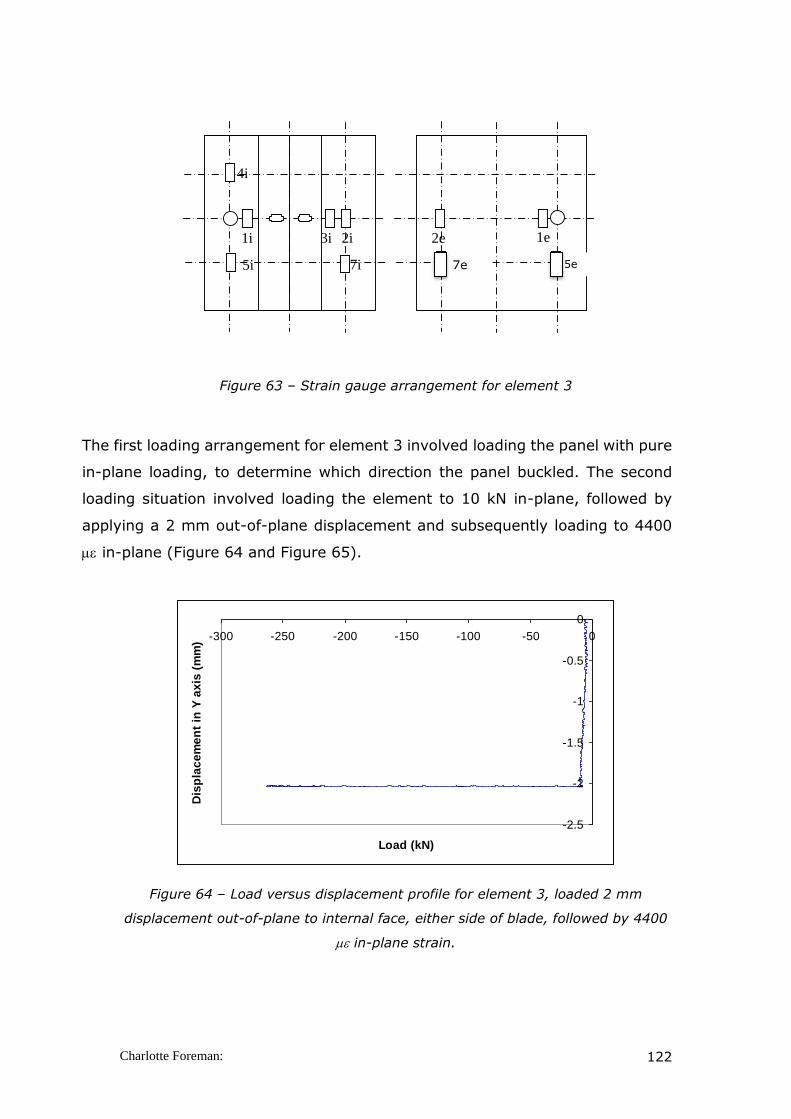
Charlotte Foreman: 122
Figure 63 – Strain gauge arrangement for element 3
The first loading arrangement for element 3 involved loading the panel with pure
in-plane loading, to determine which direction the panel buckled. The second
loading situation involved loading the element to 10 kN in-plane, followed by
applying a 2 mm out-of-plane displacement and subsequently loading to 4400
in-plane (Figure 64 and Figure 65).
Figure 64 – Load versus displacement profile for element 3, loaded 2 mm
displacement out-of-plane to internal face, either side of blade, followed by 4400
in-plane strain.
1i
2i
1e
Key
strain gauge
Impact location
Loading point
4i
5i
7i
2e
5e
7e
3i
-2.5
-2
-1.5
-1
-0.5
0
-300 -250 -200 -150 -100 -50 0
Load (kN)
Dis
pla
ce
me
nt
in Y
ax
is (
mm
)
7e 5e

Charlotte Foreman: 123
Figure 65 – Strain versus load response of element 3, with 2 mm out of plane
displacement applied either side of blade, followed by 4400 in –plane strain
As with the previous loading cases, the response of the strain gauges has been
indicated on the schematic of the element in order to quantify the buckle
response of the panel (Figure 66). In comparison to Figure 60, it became
apparent that the buckling response of element 3 may not be appropriate to
cause delamination growth.
Figure 66 – Strain gauge responses of element 3
-300
-250
-200
-150
-100
-50
0
-5000 -4000 -3000 -2000 -1000 0 1000
Strain ( )
Lo
ad
(k
N)
Gauge1i
Gauge 1e
Gauge 2i
Gauge 2e
Gauge 3i
Gauge 4i
Gauge 5i
Gauge 5e
Gauge 7i
Gauge 7e
Gauge 5i more +ve
Gauge 5e more +ve
Gauge 1i slightly +ve
Gauge 1e more -ve
Gauge 2i more -ve
Gauge 2e more +ve
Gauge 4i more -ve
Gauge 7i more -ve
Gauge 7e more -ve

Charlotte Foreman: 124
Further loading was carried out on element 3 (Table 18), with fatigue cycles
being applied in order to initiate delamination growth; however, no delamination
growth was observed.
Element
Number
No of
cycles
Max
load (x) In plane strain (max)
Strain
gauge
diagram
Out of plane
displacement
(actuator)
kN mm
3
1 212
-
4600 gauge 1e Figure 46 0
1 264.25
-
4400 gauge 3i Figure 46 2
1000 267.70
-
4400 gauge 5i + 5e Figure 46 2
10000 250.0
-
4400 gauge 3i Figure 46 2
1 143.75
-
4400 gauge 3i Figure 46 2.5
Table 18 – Loading of element 3
It was suspected that loading the element either side of the blade resulted in a
restriction of the localised buckling observed from the previous element and, as
a result, the shear component through the thickness was not observed under
this loading arrangement, resulting in a no-growth situation.
Element 4
A fourth element was tested with the loading arrangement modified to ensure
the correct buckle shape, without point-loading the blade. This was achieved by
applying the out-of-plane load to the blade foot, on the side with the impact. A
loading head was designed to provide the out-of-plane displacement. The strain
gauge arrangement for element 4 can be seen in Figure 67.
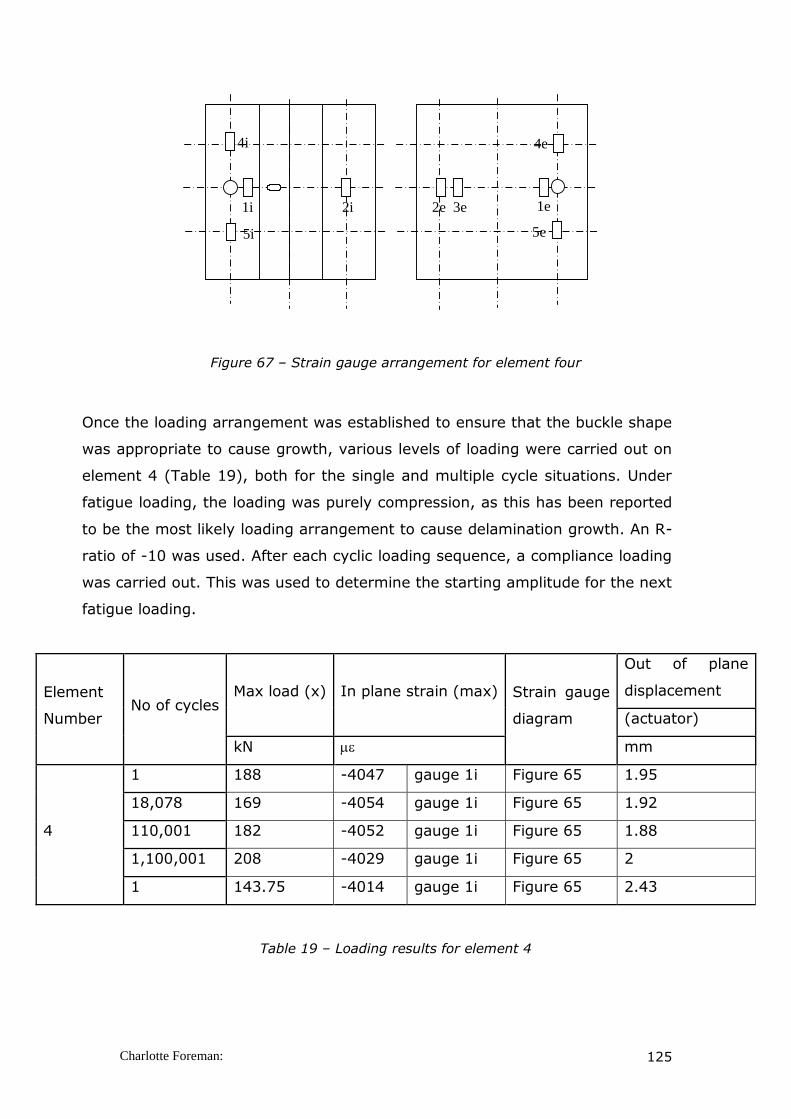
Charlotte Foreman: 125
Figure 67 – Strain gauge arrangement for element four
Once the loading arrangement was established to ensure that the buckle shape
was appropriate to cause growth, various levels of loading were carried out on
element 4 (Table 19), both for the single and multiple cycle situations. Under
fatigue loading, the loading was purely compression, as this has been reported
to be the most likely loading arrangement to cause delamination growth. An R-
ratio of -10 was used. After each cyclic loading sequence, a compliance loading
was carried out. This was used to determine the starting amplitude for the next
fatigue loading.
Element
Number No of cycles
Max load (x) In plane strain (max) Strain gauge
diagram
Out of plane
displacement
(actuator)
kN mm
4
1 188 -4047 gauge 1i Figure 65 1.95
18,078 169 -4054 gauge 1i Figure 65 1.92
110,001 182 -4052 gauge 1i Figure 65 1.88
1,100,001 208 -4029 gauge 1i Figure 65 2
1 143.75 -4014 gauge 1i Figure 65 2.43
Table 19 – Loading results for element 4
1i
2i
1e
Key
strain gauge
Impact location
Loading point
4i
4e
5i
2e
5e
3e

Charlotte Foreman: 126
Figure 68 – Load versus out-of-plane displacement response of element 4, loaded
2 mm displacement out-of plane on blade foot (side with impact), followed by
4000 in-plane strain application
Figure 69 – Strain versus load response of element 4 - out-of plane displacement
of 2 mm applied on blade foot (side with impact), followed by 4000 in-plane
load
-2.5
-2
-1.5
-1
-0.5
0
-200 -150 -100 -50 0
Load (kN)
Dis
pla
cem
en
t in
y a
xis
(m
m)
-200
-180
-160
-140
-120
-100
-80
-60
-40
-20
0
-6000 -4000 -2000 0 2000
Strain ()
Lo
ad
(kN
)
Gauge 1i
Gauge 1e
Gauge 2i
Gauge 2e
Gauge 3e
Gauge 4i
Gauge 4e
Gauge 5e
1i
1e
2e
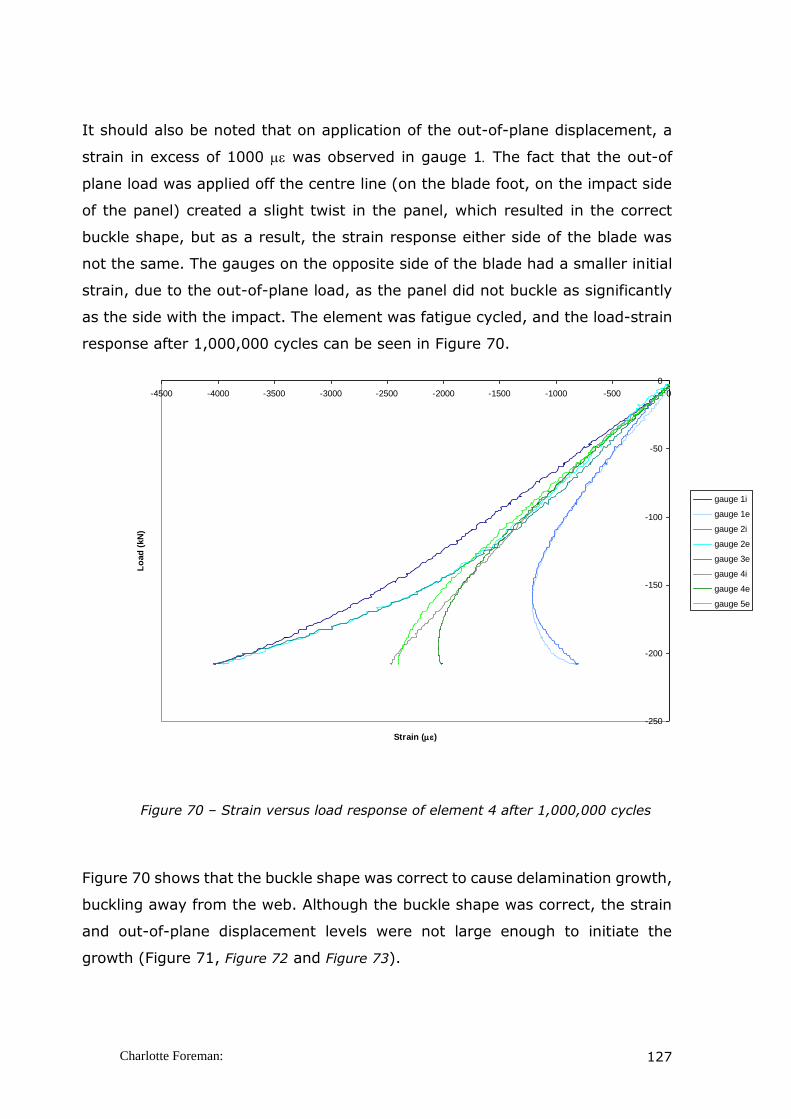
Charlotte Foreman: 127
It should also be noted that on application of the out-of-plane displacement, a
strain in excess of 1000 was observed in gauge 1 The fact that the out-of
plane load was applied off the centre line (on the blade foot, on the impact side
of the panel) created a slight twist in the panel, which resulted in the correct
buckle shape, but as a result, the strain response either side of the blade was
not the same. The gauges on the opposite side of the blade had a smaller initial
strain, due to the out-of-plane load, as the panel did not buckle as significantly
as the side with the impact. The element was fatigue cycled, and the load-strain
response after 1,000,000 cycles can be seen in Figure 70.
Figure 70 – Strain versus load response of element 4 after 1,000,000 cycles
Figure 70 shows that the buckle shape was correct to cause delamination growth,
buckling away from the web. Although the buckle shape was correct, the strain
and out-of-plane displacement levels were not large enough to initiate the
growth (Figure 71, Figure 72 and Figure 73).
-250
-200
-150
-100
-50
0
-4500 -4000 -3500 -3000 -2500 -2000 -1500 -1000 -500 0
Strain ()
Lo
ad
(kN
)
gauge 1i
gauge 1e
gauge 2i
gauge 2e
gauge 3e
gauge 4i
gauge 4e
gauge 5e

Charlotte Foreman: 128
After the cyclic loading had been carried out for 1,000,000 cycles, the
aluminium channelling fractured, and the element had to be re-end-potted.
The same element was then loaded to 2.5 mm out-of-plane, with 4000
in-plane load being applied. It was observed during the test that the buckle
shape appeared to be inconsistent with the previous loading case. Upon
scanning, there were obvious signs of further damage being present within
the existing damaged area. Figure 71, Figure 72 and Figure 73 show a region
coloured white which indicates additional damage. However, on closer
inspection, it became clear that the additional damage was in the form of
back face splitting.
Figure 71 – Element 4, full waveform capture after 35 J impact (scanned from the
internal face). The white region indicates the largest critical delamination, 1 ply
down from the internal face
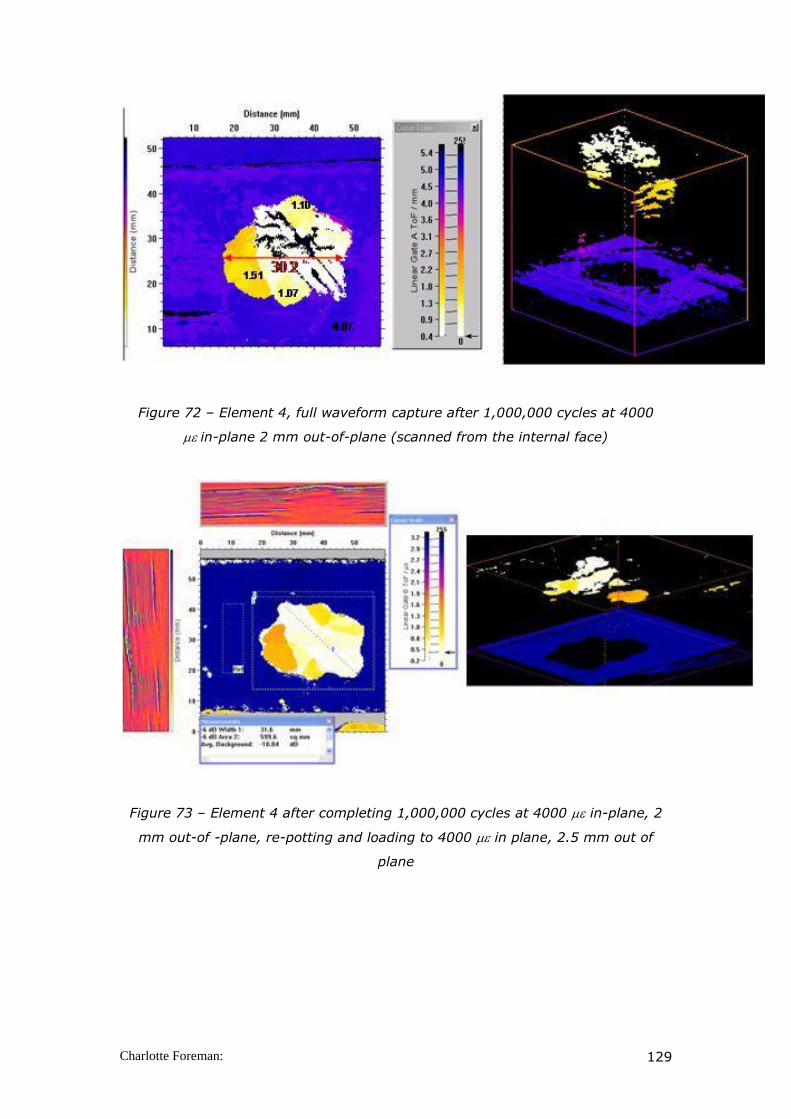
Charlotte Foreman: 129
Figure 72 – Element 4, full waveform capture after 1,000,000 cycles at 4000
in-plane 2 mm out-of-plane (scanned from the internal face)
Figure 73 – Element 4 after completing 1,000,000 cycles at 4000 in-plane, 2
mm out-of -plane, re-potting and loading to 4000 in plane, 2.5 mm out of
plane
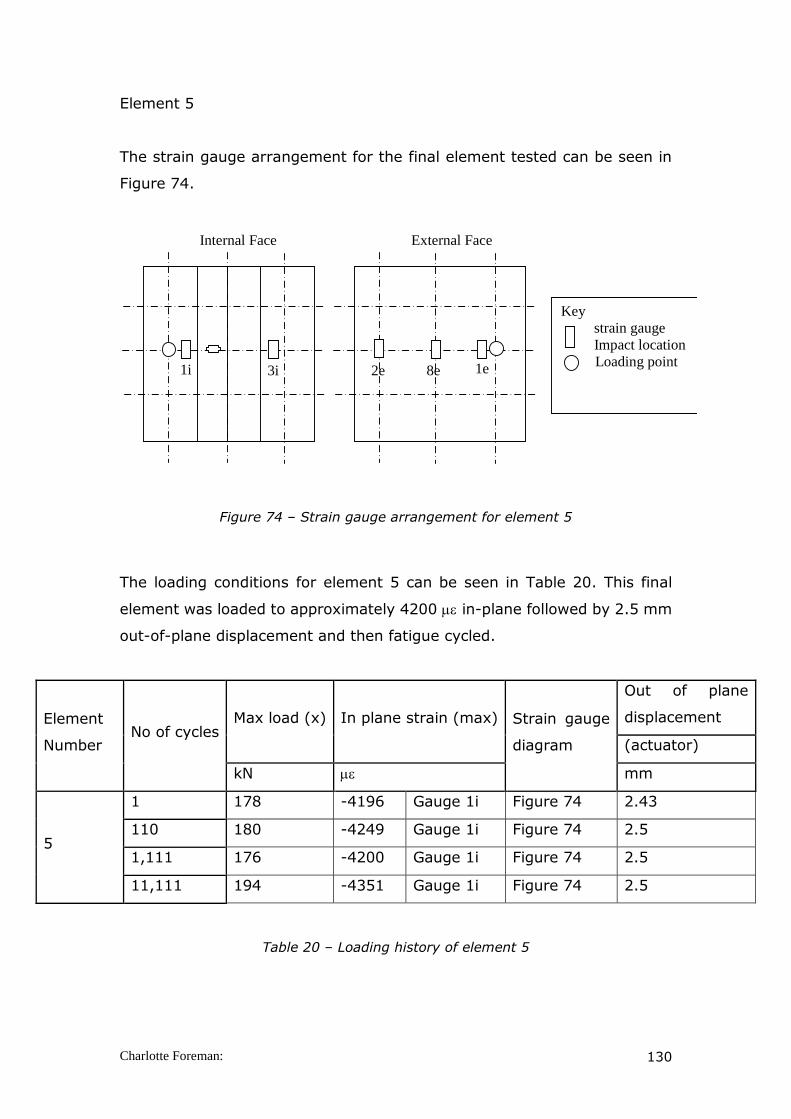
Charlotte Foreman: 130
Element 5
The strain gauge arrangement for the final element tested can be seen in
Figure 74.
Figure 74 – Strain gauge arrangement for element 5
The loading conditions for element 5 can be seen in Table 20. This final
element was loaded to approximately 4200 in-plane followed by 2.5 mm
out-of-plane displacement and then fatigue cycled.
Element
Number No of cycles
Max load (x) In plane strain (max) Strain gauge
diagram
Out of plane
displacement
(actuator)
kN mm
5
1 178 -4196 Gauge 1i Figure 74 2.43
110 180 -4249 Gauge 1i Figure 74 2.5
1,111 176 -4200 Gauge 1i Figure 74 2.5
11,111 194 -4351 Gauge 1i Figure 74 2.5
Table 20 – Loading history of element 5
Internal Face
1i
3i
External Face
1e
Key
strain gauge
Impact location
Loading point
2e
8e

Charlotte Foreman: 131
The single cycle loading response and strain response can be seen in Figure
75 and Figure 76 respectively.
Figure 75 – Load versus out-of plane displacement of element 5, with 2.5 mm
out-of-plane displacement applied to blade foot (side with impact) followed by
4200 in-plane strain
Figure 76 – Strain versus load profile for element 5, with 2.5 mm out-of plane
displacement applied followed by in-plane strain of 4200
-3
-2.5
-2
-1.5
-1
-0.5
0
-200 -150 -100 -50 0
Load (kN)
Dis
pla
ce
me
nt
(mm
)
-200
-180
-160
-140
-120
-100
-80
-60
-40
-20
0
-6000 -4000 -2000 0 2000 4000
Strain ( )
Lo
ad
(kN
)
Gauge 1i
Gauge 1e
Gauge 2e
Gauge 3i
Gauge 8e
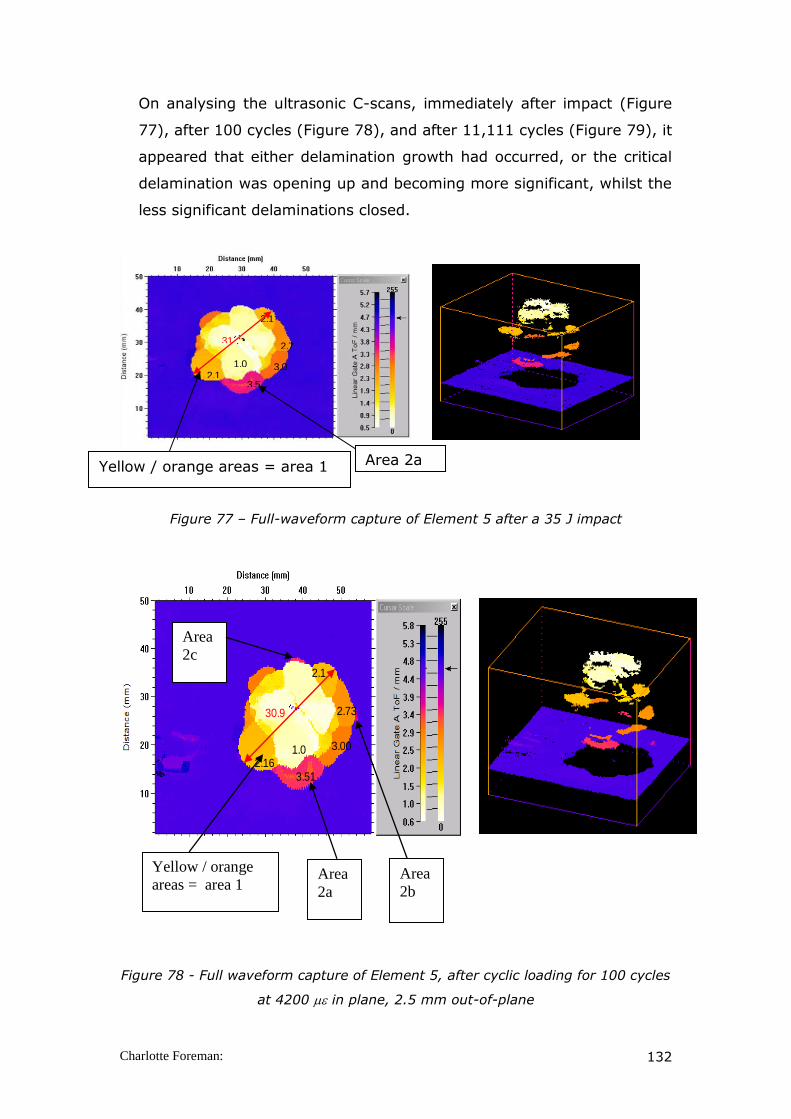
Charlotte Foreman: 132
On analysing the ultrasonic C-scans, immediately after impact (Figure
77), after 100 cycles (Figure 78), and after 11,111 cycles (Figure 79), it
appeared that either delamination growth had occurred, or the critical
delamination was opening up and becoming more significant, whilst the
less significant delaminations closed.
Figure 77 – Full-waveform capture of Element 5 after a 35 J impact
Figure 78 - Full waveform capture of Element 5, after cyclic loading for 100 cycles
at 4200 in plane, 2.5 mm out-of-plane
2.16
2.14
1.05
3.51
3.00
2.73
31.0
2.16 1.03 3.51
3.00
2.73
2.18
30.9
Yellow / orange
areas = area 1
Area
2a
Area
2b
Area
2c
Yellow / orange areas = area 1
Area 2a
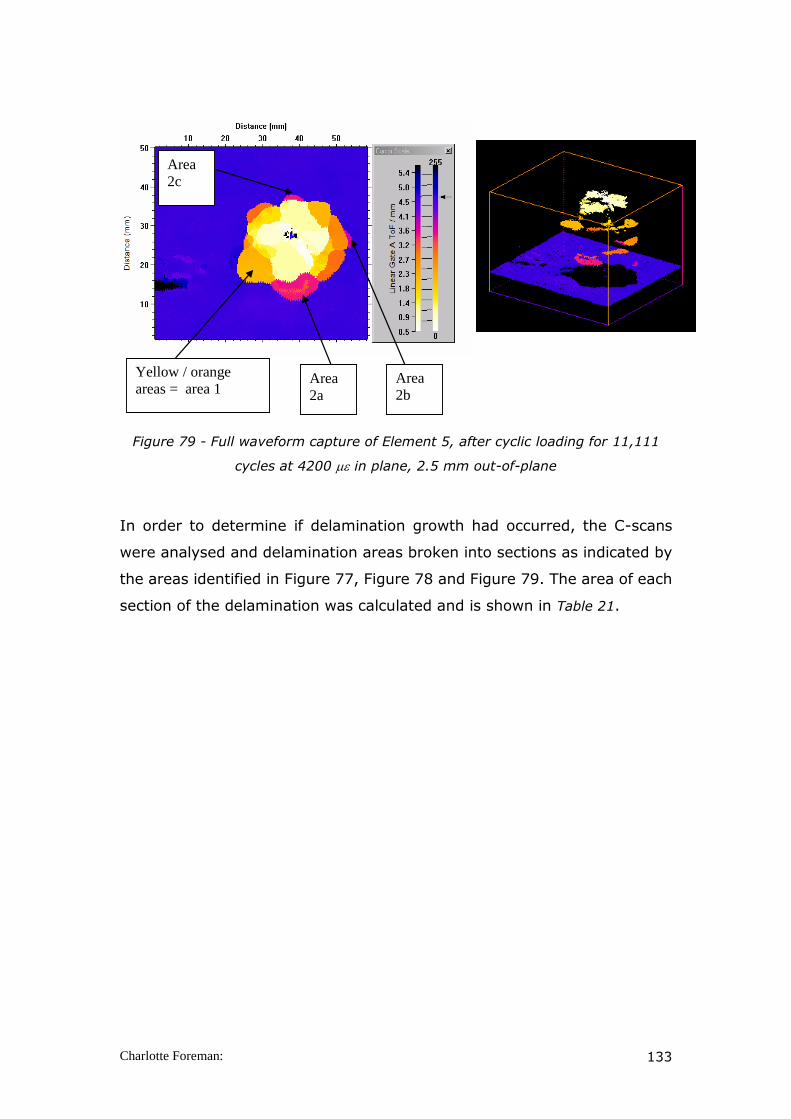
Charlotte Foreman: 133
Figure 79 - Full waveform capture of Element 5, after cyclic loading for 11,111
cycles at 4200 in plane, 2.5 mm out-of-plane
In order to determine if delamination growth had occurred, the C-scans
were analysed and delamination areas broken into sections as indicated by
the areas identified in Figure 77, Figure 78 and Figure 79. The area of each
section of the delamination was calculated and is shown in Table 21.
Yellow / orange
areas = area 1
Area
2a
Area
2b
Area
2c

Charlotte Foreman: 134
Figure Number Area number Average area
size (mm2)
Total area of
critical
delamination
visible (mm2)
Figure 77 1 555
2a 53.7 53.8
Total area 608.7
Figure 78
1 547.3
2a 56.2
60.52 2b 1.88
2c 2.44
Total area 607.82
Figure 79
1 513.3
2a 56.7
67.18 2b 5.05
2c 5.43
Total area 580.48
Table 21 - Analysis of C-scans for Element 5, loaded to 4200 with 2.5 mm out-
of-plane displacement after 1 cycle, 100 cycles and 11,111 cycles
This has shown that although on first inspection, the delamination appeared
to have grown, the overall delamination area had not grown, and instead,
as the less critical delaminations were closing and becoming less significant,
the critical delamination, 1 ply down from the external face, became more
critical.
4.8. Summary
A number of stiffened structural elements have been manufactured and
tested. This component of the study has highlighted the complexity of the
relationship between loading and deformation in CFRP structures and the
need to consider both in-plane and out-of-plane loading. The specimen
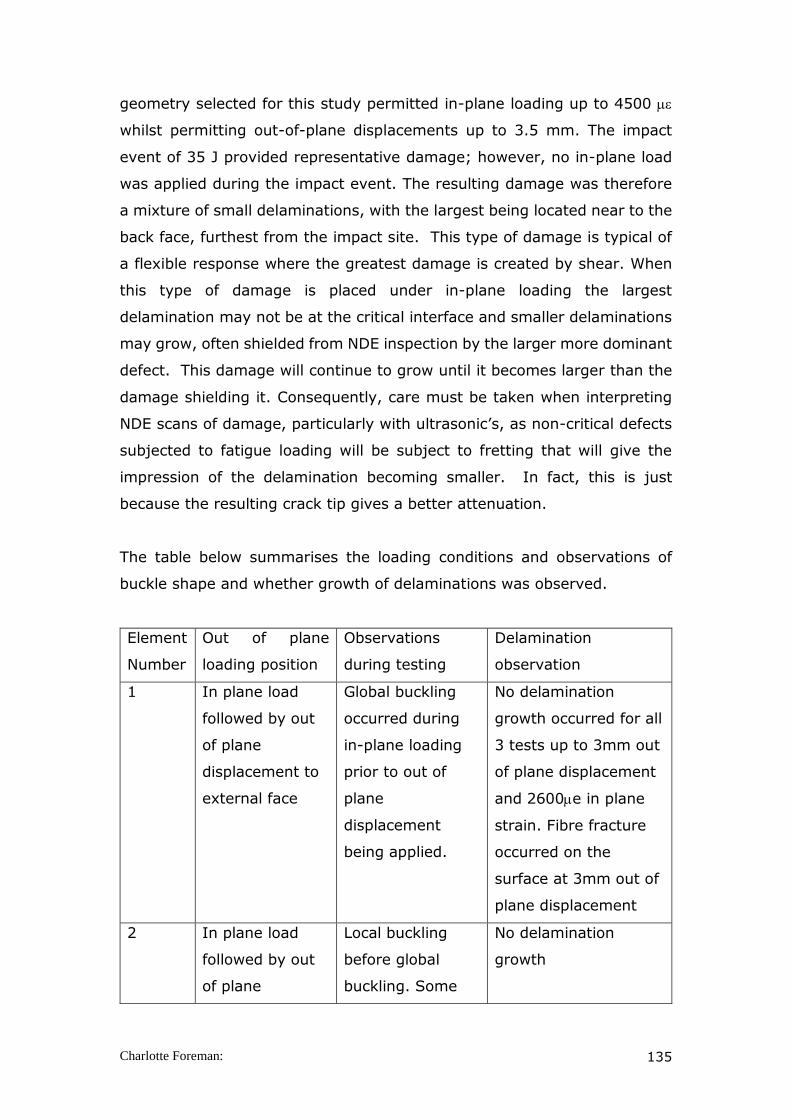
Charlotte Foreman: 135
geometry selected for this study permitted in-plane loading up to 4500
whilst permitting out-of-plane displacements up to 3.5 mm. The impact
event of 35 J provided representative damage; however, no in-plane load
was applied during the impact event. The resulting damage was therefore
a mixture of small delaminations, with the largest being located near to the
back face, furthest from the impact site. This type of damage is typical of
a flexible response where the greatest damage is created by shear. When
this type of damage is placed under in-plane loading the largest
delamination may not be at the critical interface and smaller delaminations
may grow, often shielded from NDE inspection by the larger more dominant
defect. This damage will continue to grow until it becomes larger than the
damage shielding it. Consequently, care must be taken when interpreting
NDE scans of damage, particularly with ultrasonic’s, as non-critical defects
subjected to fatigue loading will be subject to fretting that will give the
impression of the delamination becoming smaller. In fact, this is just
because the resulting crack tip gives a better attenuation.
The table below summarises the loading conditions and observations of
buckle shape and whether growth of delaminations was observed.
Element
Number
Out of plane
loading position
Observations
during testing
Delamination
observation
1 In plane load
followed by out
of plane
displacement to
external face
Global buckling
occurred during
in-plane loading
prior to out of
plane
displacement
being applied.
No delamination
growth occurred for all
3 tests up to 3mm out
of plane displacement
and 2600e in plane
strain. Fibre fracture
occurred on the
surface at 3mm out of
plane displacement
2 In plane load
followed by out
of plane
Local buckling
before global
buckling. Some
No delamination
growth
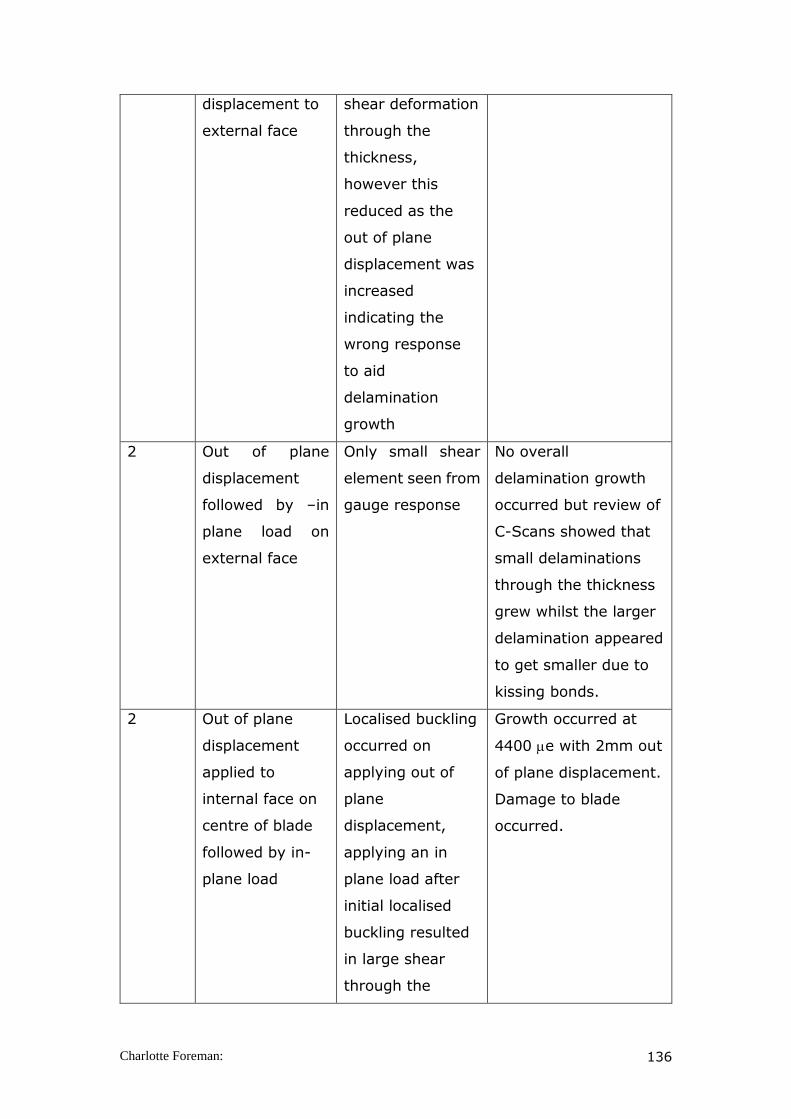
Charlotte Foreman: 136
displacement to
external face
shear deformation
through the
thickness,
however this
reduced as the
out of plane
displacement was
increased
indicating the
wrong response
to aid
delamination
growth
2 Out of plane
displacement
followed by –in
plane load on
external face
Only small shear
element seen from
gauge response
No overall
delamination growth
occurred but review of
C-Scans showed that
small delaminations
through the thickness
grew whilst the larger
delamination appeared
to get smaller due to
kissing bonds.
2 Out of plane
displacement
applied to
internal face on
centre of blade
followed by in-
plane load
Localised buckling
occurred on
applying out of
plane
displacement,
applying an in
plane load after
initial localised
buckling resulted
in large shear
through the
Growth occurred at
4400 e with 2mm out
of plane displacement.
Damage to blade
occurred.
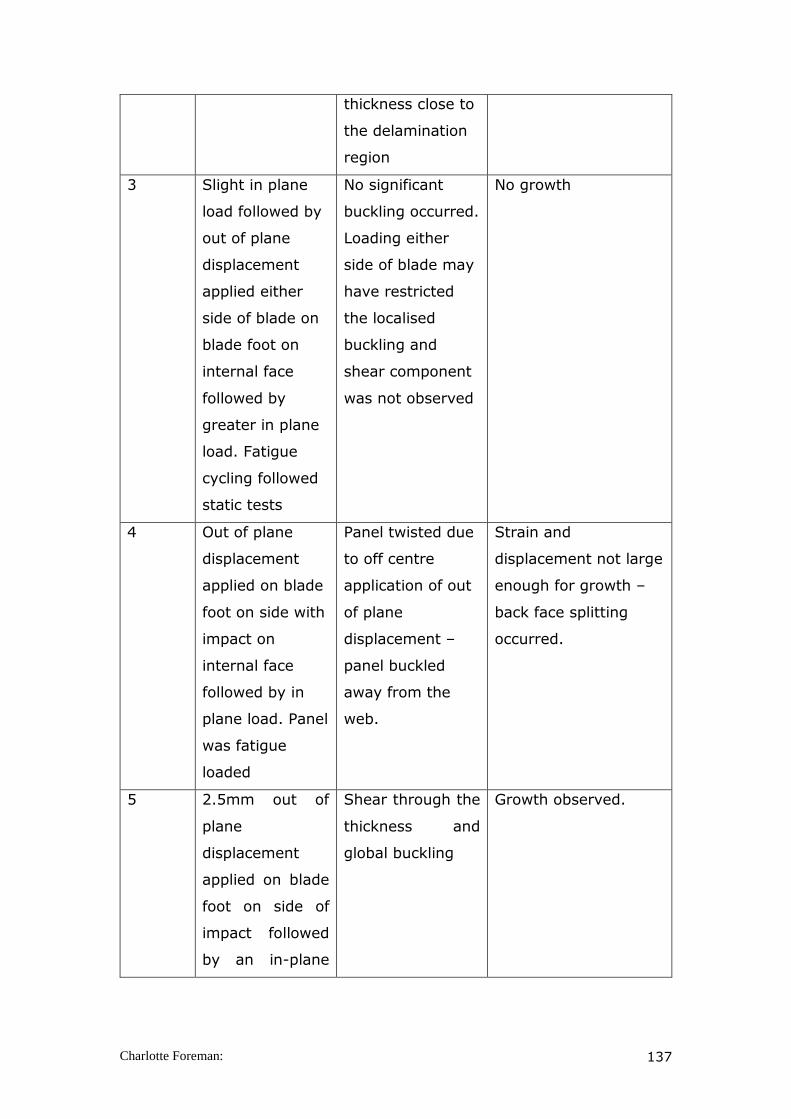
Charlotte Foreman: 137
thickness close to
the delamination
region
3 Slight in plane
load followed by
out of plane
displacement
applied either
side of blade on
blade foot on
internal face
followed by
greater in plane
load. Fatigue
cycling followed
static tests
No significant
buckling occurred.
Loading either
side of blade may
have restricted
the localised
buckling and
shear component
was not observed
No growth
4 Out of plane
displacement
applied on blade
foot on side with
impact on
internal face
followed by in
plane load. Panel
was fatigue
loaded
Panel twisted due
to off centre
application of out
of plane
displacement –
panel buckled
away from the
web.
Strain and
displacement not large
enough for growth –
back face splitting
occurred.
5 2.5mm out of
plane
displacement
applied on blade
foot on side of
impact followed
by an in-plane
Shear through the
thickness and
global buckling
Growth observed.

Charlotte Foreman: 138
load and then
fatigued
Table 22 – Observations from tests for each loading situation
Table 22 shows that in order for delamination to grow the elements need
to be subjected to the correct loading conditions in order for local buckling
to induce shear and for global buckling to drive delamination growth.
Growth of delaminations was observed and was captured using the C-
scanning technique, however, the study emphasised the importance of
reviewing the C-Scans carefully as some smaller delaminations resulting
from the impact even grew whereas the larger delaminations appeared to
reduce in size due to kissing bonds.
The experimental study demonstrated a method to provide vital
information, which can be used to validate an engineering approach to
delamination growth prediction. The specimens selected for this study have
assisted in validating both the importance of out-of-plane displacement and
the complexity of damage growth within composites structures.

Charlotte Foreman: 139
5. Concluding Remarks and Recommendations
One of the primary aims of the study was to determine if standard analysis
can be used and adapted to determine interlaminar fracture toughness
values in fibre reinforced composite samples with layup and damage which
are more representative of those seen in service than the traditional
unidirectional coupon. The coupon testing conducted within this study has
provided some interesting results and the following can be concluded:
The limited scatter in data between samples tested in both mode I
and mode II loading gives confidence that the results are valid.
For mode I loading, the derivation for the off centre analysis for the
initiation load for delamination growth was in good agreement with
experimental results and as such, with further investigation, this
method could be adapted to determine the initiation load for
delaminations within any plane.
For mode I loading, the initiation load to grow delaminations arising
from an impact event is greater than that from an artificial insert.
This finding is believed to be due to the applied load being distributed
over multiple delamination crack fronts and as such a greater load is
required to grow the critical delamination.
For mode II loading, crack migration within the NCF sample was
limited and the modified analysis, which takes into account the
position of the delamination growth, could be used. As such, as long
as the position of the crack was noted throughout the test, this
analysis method could be used for delamination at any point
throughout the sample thickness.
An additional aim of the study was to investigate and carry out novel
experimental testing techniques to understand damage behaviour at the
structural level. The significant findings from the structural study are as
follows:
There is a complex relationship between loading and deformation in
CFRP structures and the consideration of both in-plane and out-of-

Charlotte Foreman: 140
plane loading is required if deformation is to be fully understood at
a structural level.
Interpretation of the C scanning results is complex, as damage growth
can be hidden, below a more prominent delamination, masking the
damage mechanism occurring and in some instances, damage that
is known to be present may appear smaller on the c-scan than in
reality.
It is recommended that further testing of coupons in mode I and
mode II is carried out on NCF materials so that fractographic studies
can be carried out in order to analyse the fracture surface and
confirm that limited crack migration occurs.
An additional recommendation is for further tests to be carried out
on impacted coupons in order to obtain more results to validate the
approach and to provide additional samples for fractographic
investigation.

Charlotte Foreman: 141
References
Abrate S, “Impact of composite laminates”, Applied Mechanics review, Vol.
44, issue 4, pp.155-190, 1991
Abrate S, “Impact of laminated composites, recent advances”, Applied
Mechanics review, Vol. 47, issue 11, pp.517-544, 1994
Abrate S, “Impact on composite structures”, Cambridge: Cambridge
university press; 1998
Abrate S, “Modelling of impacts in composite structures”, Composite
Structures, Vol. 51, pp.129-138, 2001
Adam T, Dickson R F, Fernando G, Harris B and Reiter Ha, “The fatigue
behaviour of Kevlar/carbon hybrid composites”, IMechE conference
publications, Vol. 2, pp. 329-335, 1986
Alderliesten R C, “Designing for damage tolerance in aerospace: a hybrid
material technology” Materials and design, Vol. 66, pp. 421-428, 2015
Alif N, Carlsson L, Boogh L, “The effect of weave pattern and crack
propagation direction on mode I delamination resistance of woven glass and
carbon composites”, Composites Part B, Vol. 29B, 603-611, Elsevier Science
Ltd, 1998
Anandjiwala R, “The role of natural fibres in technical applications”, Indian
Journal of natural fibres, Vol. 2, pp.131-144, 2015
Anderson T L, “Fracture mechanics, Fundamentals and Applications”, Taylor
& Francis, 3rd Edition, Boca Raton, FL, 2005
Attia O, Kinloch A J, Matthews F L, “Modelling the fatigue life of polymer-
matrix fibre-composite components”, Composites Science and Technology,
Vol. 61, pp.2273-2283, 2001

Charlotte Foreman: 142
Aymerich F, Meili S, “Ultrasonic evaluation of matrix damage in impacted
composite laminates”, Composites Part B, Vol. 31, pp. 1 – 6, 2000
Bader M G, Boniface L, “The assessment of fatigue damage in CFRP
laminates”, Proceedings of the International Conference on Testing,
Evaluation and Quality control of composites”, TEQC 83, pp. 66 – 75, 13 –
14 September 1983
Bar-Cohen Y, “Non-destructive evaluation (NDE) of fiberglass marine
structures: state of the art review”, McDonnell Douglas Corporation, Report
number CG-D-02-91, 1991
Bailey J E, Curtis P T and Pavizi A, “On the transverse cracking and
longitudinal splitting behaviour of glass and fibre-reinforced epoxy cross-
ply laminates and the effect of poisson and thermal generated strain”,
Proceedings Royal Society, London Vol.336, pp.599-623, 1979
Bemment S D, Read I and Hubbard P D, “Detecting impacts on a
representative aerospace structure: an implementation with tests”,
Proceedings of the International Workshop on Structural Health Monitoring,
Standford University, 2015
Bennati S, Valvo P S, “Delamination growth in composite plates under
compressive fatigue loads”, Composite Science and Technology, Vol. 66,
pp.248-254, 2006
Blackman, B. R. K., A. J. Brunner, and P. Davies. "The evolution of an ISO
standard for the mode I delamination toughness of laminates." ECF12,
Sheffield 1998. 2013.
Blackman, B. R. K., and A. J. Brunner. "Mode I fracture toughness testing
of fibre-reinforced polymer composites: unidirectional versus cross-ply lay-
up." ECF12, Sheffield 1998. 2013.

Charlotte Foreman: 143
Blanco N, Gamstedt E K, Asp L E, Costa J, “Mixed mode delaminations
growth in carbon-fibre composite laminates under cyclic loading”,
International Journal of Solids and Structures, Vol. 41, pp.4219-4235, 2004
Brunner A J, Blackman B R K, and Davies P, “A status report on delamination
resistance testing of polymer matrix composites RID C-6524-2011”,
Engineering Fracture Mechanics, 75 (9), pp. 2779-2794, 2008
Brunner A J, Stelzer S, Pinter G, Terrasi G, “Cyclic fatigue delamination of
carbon fibre reinforced polymer matrix composites: data analysis and
design considerations”, International Journal of fatigue, Vol 83, pp.293-
299, 2016
BS ISO 15024 “Fibre-reinforced plastic composites —Determination of
mode I interlaminar fracture toughness, GIC, for unidirectionally reinforced
materials”, 2001
Burke S K, McK Cousland S, Scala C M, “Nondestructive characterization of
advanced composite materials”, Material forum, Vol. 18, pp. 85 – 109, 1994
Butler R, Almond D P, Hunt G W, Hu B, Gathercole N, “Compressive fatigue
limit of impact damaged composite laminates” Composites Part A: Applied
Science and Manufacturing, Vol. 38, Issue 4, pp 1211-1215, April 2007
Cantwell W J, Curtis P T and Morton J, “Impact and subsequent fatigue
damage growth in carbon fibre laminates”, International Journal of Fatigue,
Vol. 6, Issue 2, 1984
Cantwell WJ, Morton J, “Detection of impact damage in CFRP Laminates”,
Composite Structures, Vol. 3, pp.241-57, 1985
Cantwell W J and Morton J, “Geometrical effects in the low velocity impact
response of CFRP”, Composite Structures, Vol.12, pp.39-59, 1989
Charlotte Foreman: 144
Cantwell W J and Morton J, “Impact perforation of carbon fibre reinforced
plastic”, Composite Science and Technology, Vol. 38, pp. 119 – 141, 1990
Cantwell W J and Morton J, “The impact resistance of composite materials-
a review”, Composites, Vol. 22, issue 5, pp. 347-362, 1991
Cavatorta M P, Paolino D S, Peroni L, Rodino M, “A finite element simulation
and experimental validation of a composite bolted joint loading in bending
and torsion”, Composites Part A: Applied Science and manufacturing, 2006
Cavatorta M P, Paolino D S, Peroni L, Rodino M, “A finite element simulation
and experimental validation of a composite bolted joint loaded in bending
and torsion”, Composites Part A, 2006
Chang F K and Choi H Y, “A progressive damage model for laminated
composites containing stress concentrations”, Journal of Composite
Materials, Vol.21, pp.834-855, 1987
Chang F K, Choi H Y and Jeng S T, “Study on impact damage in laminated
composites” Mechanics of Materials, Vol.10, pp.83-95, 1990
Chai H, “Experimental evaluation of mixed-mode fracture in adhesive
bonds”, Experimental Mechanics, pp. 296 – 303, 1992
Choi H Y. and Chang F Y, “Impact damage threshold of laminated
composites”, In ‘Failure Criteria and Analysis in Dynamic Response, AMD
Vol. 107, ASME Applied Mechanics Division, Dallas, TX, pp.31-35,
November 1990
Choi H Y, Downs R J and Chang F Ka, “A new approach toward understanding
damage mechanisms and mechanics of laminated composites due to low
velocity impact: Part I- Experiments” Journal of Composite Materials, Vol.
25, pp.992-1011, 1991

Charlotte Foreman: 145
Choi H Y, Wu H-Y T and Chang F Kb, “A new approach toward understanding
damage mechanisms and mechanics of laminated composites due to low-
velocity impact: Part II –Analysis”, Journal of Composite Materials, Vol. 25,
pp.1012-1038, 1991
Choi HY, Chang F-K, “A model for predicting damage in graphite/epoxy
laminated composites resulting from low-velocity point impact”, Journal of
Composite Materials, Vol. 26, pp.2134-2169, 1992
Choi H Y, Wang H S and Chang F K, “Effect of laminate configuration and
impactor’s mass on the initial impact damage of graphite/epoxy composite
plates due to line loading impact. Journal of Composite Materials, Vol. 26,
issue 6, pp.804-827, 1992
Choi N S, Kinloch A J, Willams J G, “Delamination fracture of multidirectional
carbon fibre / epoxy composites under Mode I, Mode II and mixed mode
I/II loading” Journal of Composite Materials, Vol. 33 (1): 73-100, 1999
Clarke G, “Modelling of impact damage in composite laminates”,
Composites, Vol. 30, issue 3, 1989
Craven R, Iannucci L, Olsson R, “Delamination buckling, a finite element
study with realistic delamination shapes, multiple delaminations and fibre fracture cracks”, Composites: Part A 41 (2010) 684–692
Cui W and Wisnom M R “A combined stress-based and fracture mechanics
based model for predicting delamination in composites”, Vol. 24, issue 6,
pp. 467 – 474, 1993
Davies A J, “Fatigue and lifetime prediction of UAV and Airframe
Structures”, QinetiQ technical report, QinetiQ/FST/SMC/TR020736, July
2002
Davies G A O, Zhang X and Edlund A, “Predicting damage in composite
aircraft structures due to low velocity impact”, Aero-tech Conference,
Birmingham, Jan 1994

Charlotte Foreman: 146
Degrieck J, Van Paepegem W, “Fatigue damage modelling of fibre-
reinforced composite materials:Review”, Applied Mech Review, Vol. 54,
Issue 4, pp.279-299, 2001
Dorey G, “Impact damage tolerance and assessment in advanced composite
materials”, Seminar on Advanced Composites, Cranfield Institute of
Technology, Cranfield, UK, 1986
Dorey G, Sigety P, Stellbrink K and ‘T Hart W G J, “Impact damage tolerance
of carbon fibre and hybrid laminates”. RAE Technical Report 87 057, Royal
Aerospace establishment, Farnborough, UK, 1987
Dorey G, “Impact damage in composites-development, consequences and
prevention” In ‘Proc. 6th Int. Conf. on Composite Materials and 2nd
European Conf. on Composite Materials’, Imperial College, London, Vol. 3,
pp. 3.1-3.26, 1988
Dransfield K, Jain L, and Mai Y, “On the effects of stitching in CFRP’s – Mode
I delamination toughness”, Composites Science and Technology, 58 (6), pp
815-827, 1998
El Mahi A, Berthelot J M, Brillaud J, “Stiffness reduction and energy release
rate of cross-ply laminates during fatigue tests”, Composite Structures, Vol.
30, pp. 123-130, 1995.
Fishpool D T, “Advanced Damage Tolerant Composites for Aerospace and
Defence” 2013
Finn S R, He Y-F and Springer G S, “Delaminations in composite plates
under transverse impact loads-experimental results”, Composite
Structures, Vol.23, pp. 191-204, 1993

Charlotte Foreman: 147
Flesher N D, Herakovich C T, “Predicting delaminations in composite
structures”, Composites Science and Technology, Vol 66, Issue 6, pp 745-
754, May 2006
Forsyth D S, Kasap S O, Wacker I, Yannacopoulos S, “Thermal fatigue of
composites: Ultrasonic and SEM evaluations”, Journal of Engineering
Materials and Technology transfer, ASME, Vol. 116, pp. 113 – 120, 1994
Gaudenzi P, Perugini P and Spadaccia F, “Post-buckling analysis of a
delaminated composite plate under compression”, Composite Structures,
Vol. 40, issue 3, pp. 231 – 238, 1998
Glaessgen E H, Raju I S, Poe Jr C C, “Analytical and experimental studies
of the debonding of stitched and unstitched composite joints”, Journal of
Composite Materials, Vol 36, Issue 23, pp.2599-2622, 2002
Gorman M R, “Ultrasonic polar backscatter imaging of transverse matrix
cracks”, Journal of Composite Materials, Vol. 25, pp. 1499 – 1514, 1991
Greenhalgh E S, Rogers C, Robinson P, “Fractographic observations on
delamination growth and subsequent migration through the laminate”,
Composites Science and Technology Vol.69, pp.2345-2351, 2009
Griffith AA, “The phenomena of rupture and flow of solids” Philosophical
transactions, Series A, Vol. 221, pp. 163 – 198, 1920
Hayes M D, Lesko J J, “Failure analysis of a hybrid composite structural
beam”, Composites Part A: Applied Science and Manufacturing, Vol. 38,
Issue 3, pp. 691-698, March 2007
Henneke E G, “Ultrasonic non-destructive evaluation of advanced
composites”, In Summerscales J, editor. Non-destructive testing of fibre
reinforced plastics composites, pp. 55 – 159, 1990

Charlotte Foreman: 148
Hosur M V, Murphy C R L, Ramamurthy T S, Shet Anita, “Estimation of
impact induced damage in CFRP laminates through ultrasonic imaging”,
NDT&E International, Vol.31, Issue 3, pp. 359 – 374, 1998
Hou J P, Petrinic N, Ruiz C, “A delamination criterion for laminated
composites under low velocity impact”, Composites Science and
Technology, Vol. 61, pp. 2069 – 2074, 2001
Irwin GR, “Onset of fast crack propagation in high strength steels and
Aluminium alloys”, Sagamore research conference proceedings, Vol. 2,
pp.289 – 305, 1956
Jamison R D, “The role of microdamage in tensile failure of graphite/epoxy
laminates”, Composites Science and Technology, Vol. 24, pp.83-99, 1985
Jensen H M, Sheinman I, “Straight sided, buckling driven delamination of
thin films at high stress levels”, International Journal of Fracture, Vol. 110,
Issue 4, pp. 371-385, 2001
Jones R, Paul J, Tay T E and Williams J F, “Assessment of the effect of
impact damage in composites: some problems and answers”, Composite
Structures, Vol. 10, issue 1, pp. 51-73, 1988.
Joshi S P and Sun C T, “Impact induced fracture in a laminated composite”
Journal of Composite Materials, Vol.19, pp. 51-66, 1985
Kaczmerek H, “Ultrasonic detection of damage in CFRP’s”, Journal of
Composite Materials, Vol. 29, Issue 1, pp. 59 – 95, 1995
Kardomateas G A, “The initial postbuckling and growth behaviour of internal
delaminations in composite plates”, Journal of Applied Mechanics, ASME,
Vol. 60, pp. 903 – 910, 1993

Charlotte Foreman: 149
Kardomateas G A, Pelegri A A, Malik B, “Growth of internal delaminations
under cyclic compression in composite plates”, Journal of the Mechanics and
Physics of Solids, Vol. 43, issue 6, pp.847-868, 1995
Kasap K O, Yannacopoulos S, Mirchandani V, Hildebrandtm JR, “Ultrasonic
evaluation of thermal fatigue in composites”, Journal of Engineering
Materials and Technology Transfer ASME, Vol. 114, pp. 132 – 136, 1992
Kashtalyan M, Soutis C, “The effect of delaminations induced by transverse
cracks and splits on the stiffness properties of composite laminates”,
Composites Part A, Vol.31, 2000
Kellas S, Morton J Bishop S M, “Damage development in notched carbon
fibre composites subjected to fatigue loading”, Composite Structures, Vol.
3, pp. 56 – 68, 1985
Lee S M, “Mode II interlaminar crack growth process in polymer matrix
composites”, Journal of Reinforced Plastics and Composites”, Vol.18 (13)
pp. 1254-66, 1999
Lee S M, Zahuta P, “Instrumented impact and static indentation of
composites”, Journal of Composite Materials, Vol. 25, issue 2, pp. 204 –
222, 1991
Lee S W R and Sun C T, “A quasi-static penetration model for composite
laminates”, Journal of Composite Materials, Vol. 27, issue 3, pp.251-271,
1993
Li S, Reid SR, Zou Z, “Modelling damage of multiple delaminations and
transverse matrix cracking in laminated composites due to low velocity
lateral impact”, Coposites Science and Technology, 66, 827-836, 2006
Liu D and Malvem L E, “Matrix cracking in impacted glass/epoxy plates”,
Journal of Composite Materials, Vol. 21, pp.594-609, 1987

Charlotte Foreman: 150
Liu S, Katlu Z and Chang F K, “Matrix cracking and delamination in
laminated composite beams subjected to a transverse concentrated line
load”, Journal of Composite Materials, Vol. 27, issue 5, pp.436-470, 1993
Livingstone F, Kilpatrick I M, “An assessment of techniques for the non-
destructive examination of GRP hulls”, Admiralty Research establishment,
Report ARE TM 87203, 1987
Mallick P K, “Fibre Reinforced Composites; Materials, manufacturing and
design”, CRC Press, Boca Raton, 3rd Edition, 2008
Matthews F L and Rawlings R D, “Composite Materials: Engineering and
Science”, Chapman and Hall, London, 1995
Melin L G, Schon J, Nyman T, “Fatigue testing and buckling characteristics
of impacted composite specimens”, International Journal of Fatigue, Vol.
24, pp. 263-272, 2002
Mespoulet S, Hodgkinson J M, Matthews FL, Hitchings D and Robinson P “A
novel test method to determine the through thickness tensile properties of
long fibre reinforced composites.” Proceedings of 7th European Conference
on Composite Materials (ECCM-7), Institute of Materials London, UK, Vol.
2, Cambridge, Woodhead, 1996
Mitrevski T, Marshall I H, Thomson R, Jones R, Whittingham B, “The effect
of impactor shape on the impact response of composite laminates”,
Composite Structures, Vol. 67, pp. 139 – 148, 2005
Mitrovic M, Hahn H T, Carman G P, Shyprykevich P, “Effect of loading
parameters on the fatigue behaviour of impact damaged composite
laminates”, Composite Science Technology, Vol. 59, pp. 2059-2078, 1999
Morais A B “Double cantilever beam testing of multi-directional laminates”
Composites Part A: applied science and manufacturing, Vol. 34(12):
pp.1135-1142, 2003
Charlotte Foreman: 151
Morais AB, Pereira A B “Mode I interlaminar fracture of carbon / epoxy
multi-directional laminates”, Composites Science and Technology, Vol.64
(13-14): pp. 2261-2270, 2004
Moran T J, Crane R L, Andrews R J, “High resolution imaging of microcracks
in composites”, Materials Evaluation, Vol 43, pp. 536 – 540, 1985
Moran T J, Buynak C F, Blodgettt M P, “Ultrasonic imaging of delaminations
in composites”, In Proceedings SEM Fall conference, Society for
Experimental Mechanics, pp. 10 – 18, 1988
Net Composites, ESR Technology, QinetiQ, Interactive knowledge base on
NDE of Composites [on line] Available from http://www.mms15.com/
[Accessed 07/08/2007]
Nairn J A, Hu S, “The initiation and growth of delaminations induced by
matrix microcracking in laminated composites”, International Journal of
Fracture, Vol. 57, pp. 1-24, 1992
Nayeb-Hashemi H, Cohen M D, Zotos J, Poormand R, “Ultrasonic
characteristics of graphite/ epoxy composite material subjected to fatigue
and impacts”, Journal of Non-destructive evaluation, Vol. 5, pp. 119–131,
1986
Ogin S L, Smith P A, Beaumont P W R, “Matrix cracking and stiffness
reduction during the fatigue of a (0/90), GFRP laminate, Composite Science
Technology, Vol. 22, pp.23-31, 1985
Olsson R, Iwarsson J, Gunnar Melin L, Sjogren A, Solti J, “Experiments and
analysis of laminates with artificial damage” Composite Science and
Technology 63, (2003) 199-209

Charlotte Foreman: 152
Olsson R, “Mass criterion for wave controlled impact response of composite
plates” Composites Part A: Applied Science & Manufacturing, Vol 31, Issue
8, pp 879-887, 2000
Pagano N J and Byron Pipes R, “Influence of stacking sequence on laminate
strength”, Journal of Composite Materials, Vol. 5, 1991
Pantelakis Sp G, Kyriakakis Em.CH, “Fatigue damage of APC-2 composite
assessed from material degradation and non-destructive evaluation data”,
Theoretical and applied fracture mechanics, Vol.32, pp.37-46, 1999
Penumady D, Kim F, Bun J “Damage of composite materials subjected to
projectile penetration using high resolution x-ray micro computed
tomography” Experimental Mechanics, Vol. 56, pp. 607-616, 2016
Poursartip A, Ashby M F, Beaumont P W R, “The fatigue damage mechanics
of a carbon fibre composite laminate:I – Development of the Model”,
Composites Science and technology, Vol. 25, pp. 193-218, 1986
Preuss T E, Clark G, “Use of time of flight c-scanning for assessment of
impact damage in composites”, Composites, Vol. 19, Issue 2, pp. 145–148,
1988
Ramkumar R L, Whitcomb J D, “Characterisation of mode I and mixed mode
delamination growth in T300/5208 graphite/epoxy”, In Delamination and
debonding of materials ASTM STP 876, American society for Testing and
Materials, Philadelphia, pp.315-335, 1985
Ramkumar R L, “Effect of low-velocity impact damage on the fatigue
behaviour of graphite/epoxy laminates” In O’Brien TK. Philadelphia,
PA:ASTM STP 813 American Society for testing and Materials, pp. 116-135,
1983
Charlotte Foreman: 153
Razi H and Kobayashi A S, “Delamination in cross ply laminated composites
subjected to low velocity impact”, AIAA J, Vol. 31, issue 8, pp.1498-1502,
1993
Reifsnider K L, Jamison R, “Fracture of fatigue loaded composite laminates”,
International Journal of Fatigue, Vol.4, pp. 187-197, 1982
Reifsnider K L, “Damage and damage mechanics”, In Reifsnider K L editor,
Fatigue of Composite materials, New York, Elsevier, pp. 11-77, 1991
Ricco A, Gigliotti M, “A novel numerical delaminations growth initiation
approach for the preliminary design of damage tolerant composite
structures”, CIRA technical report, April 2006
Richardson M 0 W and Wisheart M J, “Review of low-velocity impact
properties of composite materials”, Composites Part A, Vol. 27A, pp.1123-
1131, 1996
Robinson P and Hodgkinson J M M”echanical testing of advanced fibre
composites”, Woodhead Publishing Ltd, 2000
Rogers, C.E., Greenhalgh, E.S. and Robinson, P. “Developing a mode II
fracture model for composite laminates”. ECCM13, 2008.
Rogers K F, Sidey G R, Kinston-Lee D M, “ Ballistic impact resistance of
carbon fibre laminates”, Composites, Vol. 2, pp. 237–241, 1971
Sarasini F, Tirillo J, D’Altilia S, Valente T, Santulli C, Touchanrd F, Chocinski-
Arnault L, Mellier D, Lampani L, Gaudenzi P, “Damage tolerance of
carbon/flax hybrid compositessubjected to low velocity impact” Composites
Part B:Engineering Volume 91, pp 144-153, 2016.
Saito H, Kimpara I, “Evaluation of impact damage mechanism of multi-axial
stiched CFRP laminate”, Composites Part A: Applied science and
manufacturing”, Vol. 37, issue 12, pp.2226-2235, Dec 2006
Charlotte Foreman: 154
Saunders D S, Van Blaricum T J, “Effects of load duration on the fatigue
behaviour of graphite/epoxy laminates containing delaminations”,
Composites, Vol. 19, pp. 217 – 228, 1988
Selver E, Potluri P, Hogg P, Soutis C, “Impact damage tolerance of
thermoset composites reinforced with hybrid commingled yarns”,
Composites Part B: engineering, Vol 91, pp. 522-538, 2016-05-16
Scarponi C, Briotti G, “Ultrasonic detection of delaminations on composite
materials”, Journal Reinforced Plastic Composites, Vol. 16, pp. 768 – 790,
1997
Schoeppner G A, Abrate S, “Delamination threshold loads for low velocity
impact on composite laminates”, Composites: Part A, Applied Science and
Manufacturing, Vol 31, pp. 903-915, 2000
Shivakumar K.N, Elber W and Illg W, “Prediction of low velocity impact
damage in thin circular laminates”, AZAA Journal, Vol 23, issue 3, pp.442-
449, 1985
Shoup T A, Miller J G, Heyman J S, Illg W, “Ultrasonic characterization of
fatigue and impact damage in graphite epoxy composite laminates”,
Proceedings of the 1982 Ultrasonics Symposium, pp. 960 – 964, 1982
Sjoblom P.O, Hartness J.T and Cordell T.M, “On low-velocity impact testing
of composite materials”,Journal of Composite Materials, Vol 22, pp.30-52,
1988
Sjogren A, “Fractographic characteristation of impact deamage in carbon /
fibre epoxy laminates”, FFA TN 1999-18 , Bromma: The Aeron Res Inst of
Sweden, 1999
Smith B T, Heyman J S, Bouncristiani A M, Blodgett E D, Miller J G and
Freeman S M, “Correlation of deply technique with ultrasonic imaging of
Charlotte Foreman: 155
impact damage in graphite-epoxy composites”, Materials evaluation, Vol.
47, pp. 1408–1416, 1989
Soutis C, “Carbon fibre reinforced plastics in aircraft construction” Materials
Science and Engineering A, Vol.412, pp. 171–176, Elsevier, 2005
Stegschuster G, Pingkarawat, Wendland B, Mouritz AP, “Experimental
determination of the mode I delamination fracture and fatigue properties of
thin 3D woven composites” Composites Part A: Applied science and
manufacturing, Vol.84, pp. 308-315, May 2016
Steiner K V, Eduljee R F, Huang X, Gillespie Jr J W, “Ultrasonic NDE
techniques for the evaluation of matrix cracking in composite laminates”,
Composites Science and Technology, Vol. 53, pp. 193–198, 1995
Stout M G, Koss D A, Liu C, Idasetima J, “Damage development in carbon /
epoxy laminates under quasi-static and dynamic loading”, Composite
Science and Technology, Vol. 59, pp. 2339–2350, 1999
Stratton A L and Pelegri A, “Investigation of interlayer and intralayer
delaminations”, The Rutgers Scholar, Electronic bulletin of Undergraduate
research, 1999
Symons D, “Characterisation of indentation damage in 0/90 lay-up
T300/914 CFRP” Composites Science and technology, Vol 60, pp.391-401,
2000
Symons D D and Davis G, “Fatigue testing of impact damaged T300914
carbon fibre reinforced plastic”, Composite Science Technology, Vol. 60, pp.
379-389, 2000
Takeda N, Sierakowski R L and Malvern L E, “Microscopic observations of
cross sections of impacted composite laminates”, Composites Technology
Review, Vol. 4, issue 2, pp. 40-44, 1982

Charlotte Foreman: 156
Tamusz V, Tarasovs S and Vilks U, “Delamination properties of
translaminar-reinforced composites RID B-2121-2008”, Composites
Science and Technology, Vol.63 (10), pp. 1423-1431, 2003
Tanzawa Y, Watanabe N and Ishikawa T, “Interlaminar fracture toughness
of 3D orthogonal interlocked fabric composites” Composites Science and
Technology, Vol.59 (8), pp. 1261-1270, 1999
Tong J, Smith P A, Ogin S L, Guild F J, “On matrix crack growth in quasi
isotropic laminates”, Composite Science Technology, Vol. 57, pp. 1527-
1535, 1997
Tracy JJ, Dimas DJ, Pardoen GC, “The effect of impact damage on the
dynamic properties of laminated composite plates”, In: Proceedings of the
fifth International Conference on Composite Materials, ICCM-V, San Diego,
CA; pp. 111-125, 29th July – 1st August, 1985
Tserpes K I, Papanikos P, Labeas G, Pantelakis Sp, “Fatigue damage
accumulation and residual strength assessment of CFRP laminates”,
Composite Structures, Vol.63, pp.219-230, 2004
Vieille B, Casado V, Bouvet C, “About the impact behaviour of woven-ply
carbon fibre reinforced thermoplastic and thermosetting composites – a
comparative study” Composite Structures, Vol 101, pp. 9-21, 2013
Waguh A, Maini P, Gonzalez E, Blanco N, Sainz de Aja J, de la Escalera F,
Olsson R, Alvarez E, “Damage sequence in thin-ply composite laminates
under out of plane loading”, Composites: Part A 87 (2016) 66-77
Wang S S, “Delamination crack growth in unidirectional fiber reinforced
composites under static and cyclic loading” In ‘Composite Materials: Testing
and Design (Fifth Conference)‘, ASTM STP 674 (Ed. S.W. Tsai), American
Society for Testing and Materials, Philadelphia, PA, pp. 642-663, 1979
Charlotte Foreman: 157
Williams J H, Doll B, “Ultasonic attenuation as an indicator of fatigue life of
graphite/ epoxy fibre composites” NASA contractor Report 3179, 1978
Williams J G, Rhodes M D, “Effect of resin on impact damage tolerance of
graphite/ epoxy laminates”, In composite materials: testing and design (6th
conference), ASTM STP 787, pp.450 – 480, 1982
Williams J H, Yuce H, Lee SS, “Ultrasonic and mechanical characterizations
of fatigue states of graphite epoxy composite laminates”, Materials
Evaluation, Vol. 40, pp. 560 – 565, 1982
Wood M, Sun X, Tong L, Luo Q, Katzos A and Rispler A, “A new ENF test
specimen for the Mode II delamination toughness testing of stitched woven
CFRP laminates”, Journal of Composite Materials, Vol. 41, pp.1743, 2007.
Wooh S C, Daniel I M, “Enhancement techniques for ultrasonic
nondestructive evaluation of composite materials”, Journal of Engineering
Materials and Technology, Vol. 112, pp. 175–182, 1990
Wu H Y T and Springer G S, “Measurements of matrix cracking and
delamination caused by impact on composite plates”, Journal of Composite
Materials, Vol.22, pp.518-532, 1988
Yang and He, “Polymer matrix composites carbon fibre characterisation and
damage inspection using selectively heating thermography (SeHT) through
electromagnetic induction”, Composite Structures, Vol.140, pp. 590-601,
2016
Zhang X, “Impact damage in composite aircraft structures – experimental
testing and numerical simulation”, Proceeding of the institute of mechanical
engineers, Vol.212, pp.245-259, 1998
Yin WL, “The energy release rate in the general delamination problem of
anisotropic laminates under thermomechanical loads”, J Appl Mech, Vol 65:
00. 85-92, 1998
Charlotte Foreman: 158
Zhou J, He T, “On the analysis of the end notched flexure specimen for
measuring Mode II fracture toughness of composite materials”, Composites
Science and Technology, Vol.50, pp. 209-213, 1994
Zou Z, Reid SR, Soden PD, Li S, “Mode separation of energy release rate
for delamination in composite laminates using sublaminates”, International
Journal Solid Structures, Vol. 38, pp2597-2613, 2001
Zou Z, Reid SR, Li S, Soden PD, “General expressions for energy release
rates for delamination in laminated composites”, Proc Roy Soc London, 458:
645-667, 2002
Zou Z, Reid SR, Li S, “ A continuum damage model for delamination in
laminated composites” J Mech Phys Solids, Vol 51, pp. 333-356, 2003

Charlotte Foreman: 159
Appendix 1
Derivation of Mode II Modified beam analysis
If the section of the Mode II sample from the point at which the deflection
is taken to be zero and the slope is zero is considered, then
Where P is the load, d is the distance from the centre to the maximum
deflection point., L is the half span and h is half the specimen thickness, a
is the delamination length.
Using the Macaulay method of beam analysis
𝑀𝑥 + 𝑃
2𝑥 =
𝑃
2(𝐿 − 𝑑)
𝑀𝑥 = 𝑃
2(𝐿 − 𝑑 − 𝑥) = 0
𝐸𝐼𝑑2𝑦
𝑑𝑥2= −𝑀
𝐸𝐼𝑑2𝑦
𝑑𝑥2= −
𝑃
2(𝐿 − 𝑑 − 𝑥)
Integrating twice, we find
a
P/2
P/2
P/2 (L-d)
B
E x
L-d

Charlotte Foreman: 160
𝐸𝐼𝑑𝑦
𝑑𝑥=
𝑃
4(𝐿 − 𝑑 − 𝑥)2 + 𝐴
and
𝐸𝐼𝑦 = −𝑃
12(𝐿 − 𝑑 − 𝑥)3 + 𝐴𝑥 + 𝐵
Applying boundary conditions of x=0, y=0
0 = −𝑃
12(𝐿 − 𝑑)3 + 𝐵
𝐵 =𝑃
12(𝐿 − 𝑑)3
Applying boundary conditions oft x=0, dy/dx=0
0 =𝑃
4(𝐿 − 𝑑)2 + 𝐴
𝐴 = −𝑃
4(𝐿 − 𝑑)2
𝐸𝐼𝑦 = −𝑃
12(𝐿 − 𝑑 − 𝑥)3 −
𝑃
4(𝐿 − 𝑑)2𝑥 +
𝑃
12(𝐿 − 𝑑)3
𝐼 =𝑏𝑑3
12 𝑑 = 2ℎ
𝐸𝑏(2ℎ)3
12𝑦 = −
𝑃
12(𝐿 − 𝑑 − 𝑥)3 −
𝑃
4(𝐿 − 𝑑)2𝑥 +
𝑃
12(𝐿 − 𝑑)3
𝐸𝑏(2ℎ)3𝑦 = −𝑃(𝐿 − 𝑑 − 𝑥)3 − 3𝑃(𝐿 − 𝑑)2𝑥 + 𝑃(𝐿 − 𝑑)3
𝑦 =𝑃
8𝐸𝑏ℎ[−(𝐿 − 𝑑 − 𝑥)3 − 3(𝐿 − 𝑑)2𝑥 + (𝐿 − 𝑑)3)]
At B, x=L-d-a

Charlotte Foreman: 161
𝑦 =𝑃
8𝐸𝑏ℎ[−[𝐿 − 𝑑 − (𝐿 − 𝑑 − 𝑎]3 − 3(𝐿 − 𝑑)2(𝐿 − 𝑑 − 𝑎) + (𝑙 − 𝑑)3]
𝑦 =𝑃
8𝐸𝑏ℎ[−𝑎3 − 3(𝐿 − 𝑑)2(𝐿 − 𝑑 − 𝑎) + (𝑙 − 𝑑)3]
𝑦 =𝑃
8𝐸𝑏ℎ[−2(𝐿 − 𝑑)3 + 3𝑎(𝐿 − 𝑑)2 − 𝑎3] (1)
Working out the slope at the start of the split
(𝑑𝑦
𝑑𝑥)
𝐵=
𝑃
𝐸𝐼[(𝐿 − 𝑑 − 𝑥)2
4−
(𝐿 − 𝑑)2
4]
X=L-d-a where d=2h
(𝑑𝑦
𝑑𝑥)
𝐵=
3𝑃
8𝐸𝑏ℎ3[𝑎2 − (𝐿 − 𝑑)2] (2)
For both (1) and (2), y has been set as positive downwards
Therefore ∆𝐸𝐵=𝑃
8𝐸𝑏ℎ3[2(𝐿 − 𝑑)3 − 3𝑎 (𝐿 − 𝑑)2 + 𝑎3]
𝜃𝐵 =3𝑃
8𝐸𝑏ℎ3[(𝑙 − 𝑑)2 − 𝑎2]
In terms of ∆𝐴𝐵 this is made up of ∆𝐴𝐵1 (𝑎𝜃𝐵) + ∆𝐴𝐵2 (𝑡𝑖𝑝 𝑑𝑒𝑓𝑙𝑒𝑐𝑡𝑖𝑜𝑛𝑠)
Consider the half of the split beam
Δ𝐴𝐵2= (𝑃
4)
𝑎3
3𝐸(𝑏ℎ3
12)
=𝑃𝑎3
𝐸𝑏ℎ3

Charlotte Foreman: 162
P1 + P2 = P / 2
δ1 = P1a3 / 3EI1, δ2 = P2a3 / 3EI2
δ1 = δ2 => P2 = P1 (t2/t1)3
Therefore P1 [1 + (t2 / t1)3] = p/2
ΔAB2 = 𝑷
𝟐[𝟏+(𝒕𝟐𝒕𝟏
)𝟑
]
𝒂𝟑
𝟑𝑬𝒃𝒕𝟏𝟑 therefore ΔAB2 =
𝟐𝑷𝒂𝟑
𝑬𝒃[𝒕𝟏𝟑+𝒕𝟐
𝟑]
Ignoring shear deformation
∆𝐸𝐷=𝑃
4𝐸𝑏ℎ3[𝐿3 + 3𝐿2𝑑 − 𝑑3] (1)
∆𝐸𝐶=𝑃
8𝐸𝑏ℎ3[3𝐿𝑑2 − 2𝑑3] (2)
displacement under load is δ where δ = Δ𝐸𝐵 − Δ𝐸𝐶
𝛿 = 𝑃
8𝐸𝑏ℎ3[2𝐿3 + 6𝐿2𝑑 − 3𝐿𝑑2] (3)
∆𝐸𝐴=𝑃
8𝐸𝑏ℎ3[2(𝐿 − 𝑑)3 − 3𝑎 (𝐿 − 𝑑)2 + 𝑎3]
+ 3𝑃
8𝐸𝑏ℎ3[𝑎(𝐿 − 𝑑)2 − 𝑎3] +
2𝑃𝑎3
𝐸𝑏[𝑡13 + 𝑡2
3]
A
B
D
P
C E

Charlotte Foreman: 163
∆𝐸𝐴=𝑃
8𝐸𝑏ℎ3[(𝐿 − 𝑑)3 − 𝑎3] +
2𝑃𝑎3
𝐸𝑏[𝑡13 + 𝑡2
3]
but ∆𝐸𝐷= ∆𝐸𝐴
𝑃
4𝐸𝑏ℎ3[𝐿3 + 3𝐿2𝑑 − 𝑑3] =
𝑃
8𝐸𝑏ℎ3[(𝐿 − 𝑑)3 − 𝑎3] +
2𝑃𝑎3
𝐸𝑏[𝑡13 + 𝑡2
3]
[𝐿3 + 3𝐿2𝑑 − 𝑑3] = (𝐿 − 𝑑)3 − 𝑎3 +8𝑎3
[𝑡13 + 𝑡2
3]ℎ3
3Ld2 – 6L2d – a3 + 8𝑎3ℎ3
[𝑡13+𝑡2
3]= 0 (*)
Check, if t1 = t2 = h, final term is +4a3
And we find 3Ld2 – 6L2d – a3= 0 or Ld2 – 2L2d – a3= 0 – (a)
In equation (3) we want to lose (6L2d – 3Ld2) which we can do from (*
above)
6L2d – 3Ld2 = 8𝑎3ℎ3
[𝑡13+𝑡2
3]− 𝑎3
Therefore
𝛿 =𝑃
8𝐸𝑏ℎ3(2𝐿3 +
8𝑎3ℎ3
[𝑡13 + 𝑡2
3]) − 𝑎3
therefore C = 𝛿
𝑝=
2𝐿3+[8ℎ3
𝑡13+𝑡2
3−1]𝑎3
8𝐸𝑏ℎ3

Charlotte Foreman: 164
𝐺 = 𝑃2
2𝑏
𝑑𝑐
𝑑𝑎
𝐺 =
3𝑃2𝑎2 [8ℎ3
𝑡13 + 𝑡2
3 − 1]
16𝐸𝑏2ℎ3
note when t1 = t2, term in brackets = 3)
Standard result 𝐺 = 9𝑃2𝑎2
16𝐸𝑏2ℎ3