deliverable 3.2: specifications of the control strategies ... · dtu siemens energinet, fgh,...
TRANSCRIPT

PROMOTioN – Progress on Meshed HVDC Offshore Transmission Networks
Mail [email protected]
Web www.promotion-offshore.net
This result is part of a project that has received funding form the European Union’s
Horizon 2020 research and innovation programme under grant agreement No 691714.
Publicity reflects the author’s view and the EU is not liable of any use made of the
information in this report.
Deliverable 3.2:
Specifications of the control strategies
and the simulation test cases
31/03/2017
PROJECT REPORT. Deliverable 3.2. Specifications of the control strategies and the simulation test cases
i
DOCUMENT INFO SHEET
Document Name: Deliverable 3.2: Specifications of the control strategies and the simulation test
cases
Responsible partner: UPV (Universitat Politècnica de València)
Work Package: WP 3
Work Package leader: Ömer Göksu (DTU)
Task: 3.2 General control algorithms (M09-M24)
Task lead: Ömer Göksu (DTU)
DISTRIBUTION LIST
PROMOTioN partners, European Commission
APPROVALS
Name Company
Validated by: Dirk Van Hertem KU LEUVEN
Lyndon Greedy DNV GL
Task leader: Ömer Göksu DTU
WP Leader: Ömer Göksu DTU
WP Number WP Title Person months Start month End month
WP3 Wind Turbine – Converter Interaction 269 3 42
Deliverable
Number Deliverable Title Type
Dissemination
level Due Date
D3.2 Specifications of the control strategies and the simulation test cases Report Public 15

PROJECT REPORT. Deliverable 3.2. Specifications of the control strategies and the simulation test cases
ii
LIST OF CONTRIBUTORS
Work Package 3 and deliverable 3.2 involve many partners and contributors. The names of the partners, who
contributed to the present deliverable, are presented in the following table.
PARTNER NAME
DTU Ömer Göksu, Nicolaos A. Cutululis, Müfit Altin, Oscar Saborío-Romano
UPV Ramon Blasco-Gimenez, Soledad Bernal-Perez, Salvador Añó-Villalba, Jaime Martinez-Turégano, Gustavo Chaques-Herraiz
ADWEN Carmelo Perez, Ryan Motz, Ilir Purellku
DONG Energy Lorenzo Zeni, Łukasz H. Kocewiak
USTRAT Lie Xu, Rui Li, Stephen Finney
Energinet.dk Walid Ziad El-Khatib
MVOW Tusitha Abeyasekera
RWTH Christina Brantl
Siemens Wind Nikolaus Goldenbaum
Siemens DE Slavomir Seman, Klaus Wuerflinger, Alexander Broy
Iberdrola Iñigo Azpiri
ABB Kanstantsin Fadzeyeu, Adil Abdalrahman
Statoil Wei He, Kamran Sharifabadi
PROJECT REPORT. Deliverable 3.2. Specifications of the control strategies and the simulation test cases
iii
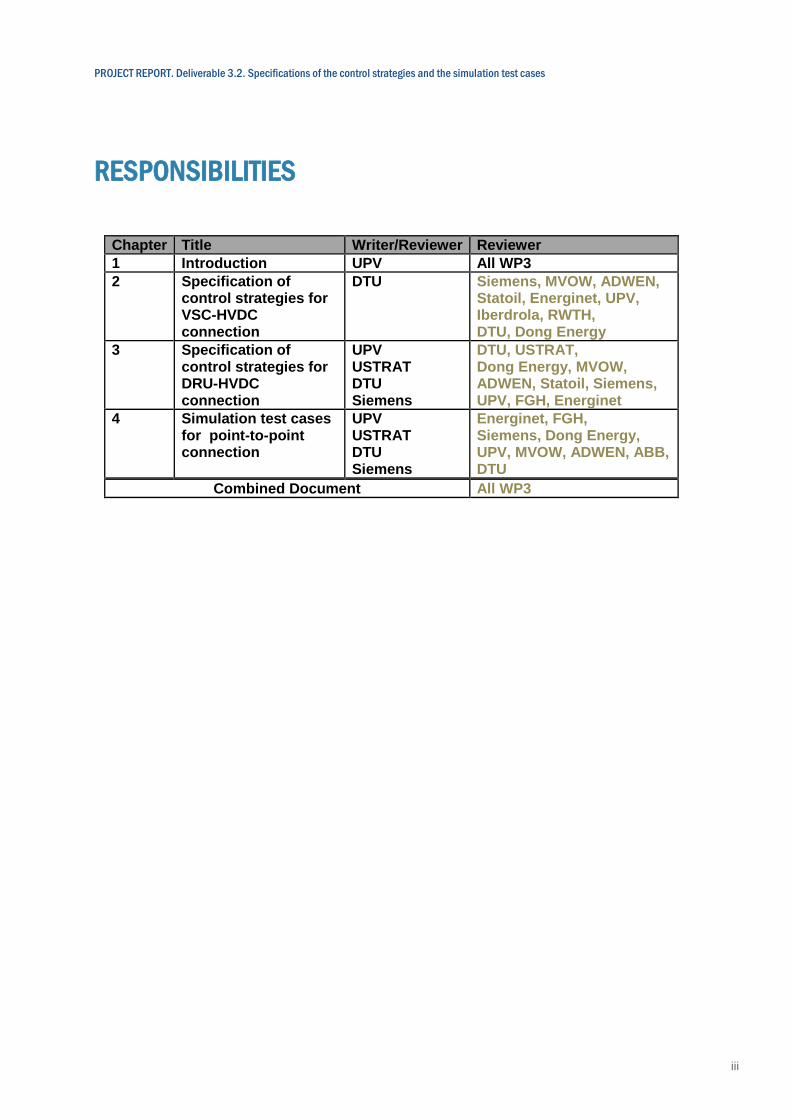
RESPONSIBILITIES
Chapter Title Writer/Reviewer Reviewer
1 Introduction UPV All WP3
2 Specification of control strategies for VSC-HVDC connection
DTU Siemens, MVOW, ADWEN, Statoil, Energinet, UPV, Iberdrola, RWTH, DTU, Dong Energy
3 Specification of control strategies for DRU-HVDC connection
UPV USTRAT DTU Siemens
DTU, USTRAT, Dong Energy, MVOW, ADWEN, Statoil, Siemens, UPV, FGH, Energinet
4 Simulation test cases for point-to-point connection
UPV USTRAT DTU Siemens
Energinet, FGH, Siemens, Dong Energy, UPV, MVOW, ADWEN, ABB, DTU
Combined Document All WP3
CONTENT
Document info sheet ................................................................................................................................................. i
Distribution list ............................................................................................................................................................. i
Approvals ..................................................................................................................................................................... i
List of Contributors ................................................................................................................................................... ii
Responsibilities ...................................................................................................................................................... iii
List of Definitions / abbreviations .............................................................................................................................. 1
1. Introduction / EXECUTIVE SUMMARY .................................................................................................................. 2
2. Specification of WT-OWF Control strategies for VSC-HVDC connection ................................................................... 3
2.1. WT, OWF and VSC Converter control hierarchy ................................................................................................... 3
2.2. WT control strategies (61400-27) ..................................................................................................................... 4
3. Specification of control strategies for DRU-HVDC point-to-point connection ........................................................... 6
3.1. Baseline scenario and summary of operational requirements............................................................................. 6
3.1.1 System configurations ............................................................................................................................... 8
3.1.2 Fault-ride-through and protection strategies .............................................................................................. 9
3.1.3 Ancillary services .................................................................................................................................... 11
3.2. Control architecture ........................................................................................................................................ 14
3.2.1 Specification of OWF-OTS Coordinator tasks ............................................................................................ 16
3.2.2 Specification of On-shore Converter control tasks and strategies .............................................................. 17
3.2.3 Specification of OWF Group Controller tasks ............................................................................................ 17
3.2.4 Specification of OWF Control tasks and strategies .................................................................................... 18
3.2.5 Specification of Wind Turbine Control tasks and strategies ....................................................................... 19
4. Specification of simulation test cases for point-to-point DRU-HVDC connection .................................................... 22
4.1. Specification of test-specific simulation detail ................................................................................................ 22
4.1.1 Level of aggregation of OWF models ........................................................................................................ 22
4.1.2 Level of detail for on-shore grid modelling ................................................................................................ 28
4.1.3 Level of detail of the on-shore MMC converter .......................................................................................... 28
4.1.4 Level of detail of the wind turbine model .................................................................................................. 28
4.2. Normal operation ........................................................................................................................................... 29
4.2.1 HVdc link and off-shore ac-grid start-up operation ................................................................................... 29
4.2.2 HVdc link and off-shore ac-grid disconnection operation .......................................................................... 31
4.2.3 Intentional islanding ............................................................................................................................... 33
4.2.4 Dynamic voltage control .......................................................................................................................... 34

PROJECT REPORT. Deliverable 3.2. Specifications of the control strategies and the simulation test cases
2
4.2.5 Wind farm power control and Power tracking ............................................................................................ 35
4.2.6 Harmonic analysis / compliance ............................................................................................................. 38
4.2.7 Response to changes in reactive power sharing command ........................................................................ 42
4.2.8 Response to active power reference commands when connected to external AC ........................................ 43
4.2.9 Disconnection / reconnection of a string / OWF ....................................................................................... 44
4.2.10 Operation with reduced number of DRUs .................................................................................................. 45
4.2.11 Disconnection / reconnection of filters .................................................................................................... 46
4.2.12 Abnormal frequency support – offshore ................................................................................................... 47
4.3. Fault ride through and protection .................................................................................................................... 49
4.3.1 Unintended transmission capability limitation ......................................................................................... 49
4.3.2 Umbilical / auxiliary AC faults ................................................................................................................. 55
4.3.3 OWF ac grid faults (symmetrical and asymmetrical) .................................................................................. 56
4.4. Ancillary services ............................................................................................................................................ 59
4.4.1 Onshore Frequency support ..................................................................................................................... 59
4.4.2 Onshore power oscillation damping ......................................................................................................... 60
5. Summary of test cases ..................................................................................................................................... 61
5.1. Test cases for normal operation ...................................................................................................................... 61
5.2. Test cases for Fault ride through and protection ............................................................................................... 61
5.3. Test cases for Ancillary services ....................................................................................................................... 61
5.4. Relation between Test cases and Requirements from Deliverable D3.1 ............................................................ 62
6. BIBLIOGRAPHY ............................................................................................................................................... 63
Appendix ............................................................................................................................................................... 65
Simulation model parameters .................................................................................................................................... 65
Offshore wind farm AC cables (From D3.1 – 5.2) ..................................................................................................... 65
Wind Turbine filter and transformer (From D3.1 – 5.1.7) .......................................................................................... 66
DRU and AC filters (From D2.1 – 3.2) ...................................................................................................................... 67
HVDC Link Cable (From D2.1 – 3.3) ........................................................................................................................ 71

PROJECT REPORT. Deliverable 3.2: Specifications of the control strategies and the simulation test cases
1
LIST OF DEFINITIONS / ABBREVIATIONS
Term Meaning
WT Wind Turbine
OWF Offshore Wind Farm
VSC Voltage Source Converter
DRU Diode Rectifier Unit
Radial grid Grid that does not contain a loop
Point-to-Point (Inter) connection between two points
OTS Off-shore Transmission System
WFG Wind Farm Group
TSO Transport (on-shore) System Operator
MOG Meshed Offshore Grid
Multi Terminal More than two stations
Cluster
Figure 2.3 D3.1
Sub-cluster
Cluster Controller (CLC)
Master Controller (MC)
Offsh. HVDC Conv (OFC)
Onsh. HVDC Conv. (ONC)

PROJECT REPORT. Deliverable 3.2: Specifications of the control strategies and the simulation test cases
2
1. INTRODUCTION / EXECUTIVE SUMMARY
This report is part of task 3.2 General Control Algorithms, which includes the specification of control strategies,
definition of test cases, implementation of control strategies and test cases and stability assessment and tuning
of controllers.
This document covers the specification of control strategies and definition of test cases. Therefore, it is
structured in two different parts. Sections 2 and 3 contain the detailed specifications and requirements for the
control of the wind turbines (WT) and off-shore wind farms (OWF). The control architecture has also been
defined, including Wind Turbine, OWF, OWF group, OWF-OTS coordinator and on-Shore converter.
Section 4 describes the simulation test cases used to verify that eventual controllers meet the functional
requirements covered in Deliverable 3.1. The simulation test cases are divided in normal operation, fault
operation and ancillary services. The baseline scenario has been stated with three DRU converters, considering
two different possibilities, one or three independent platforms. Based on system configuration stated in 3.2 on
D3.1 test cases have been divided in three main groups: Normal operation, fault ride through and protection,
and ancillary services.
In order to reduce simulation burden, the test cases consider different levels of modelling detail for wind
turbines, off-shore wind farm, on-shore Modular Multi-level converter and on-shore grid. Each test case
suggests a modelling detail as a guideline, which will be used as starting point for compliance simulation.
However, more detailed simulations may be necessary if the desired level of accuracy is not achieved.
Test cases in this document are mainly focused on Diode Rectifier-connected point-to-point topologies. Other
topologies, such as parallel Diode-Rectifier and VSC-VSC HVDC or multi-terminal, will be considered in WP2.
The presented test cases can also be used to check interoperability between controllers from different
manufacturers.
Finally, it is worth stressing that both the requirements in Deliverable 3.1 and the presented test cases in this
document will be updated during the project, once the different controllers are developed and the results from
the test cases are available.

PROJECT REPORT. Deliverable 3.2: Specifications of the control strategies and the simulation test cases
3
2. SPECIFICATION OF WT-OWF CONTROL STRATEGIES
FOR VSC-HVDC CONNECTION
In this section, OWF and WT control strategies for VSC-HVDC connection are provided for the sake of
completeness. It is well known that the VSC-connected WTs rely on the available offshore grid voltage provided
by the offshore HVDC VSC. Hence, standard onshore WT and OWF control strategies can apply. Therefore, the
standard IEC 61400-27-1 is utilized here. However, IEC61400-27-1 standard has limitations, which are
explained below, in terms of their use in PROMOTioN project. Hence these models are extended with
modifications and additional blocks [Hansen 2013] in order to comply with the requirements specified in
PROMOTioN deliverables 1.5 and 3.1.
2.1. WT, OWF AND VSC CONVERTER CONTROL HIERARCHY
The control hierarchy for VSC-connected OWF is shown in figure 2-1, which can be modified without loss of
capability, for instance the feedback point for OWF controller can be selected as the MV side of the OWF
transformer. The control, measurement and communication blocks of the OWF controller is shown in figure 2-2.
Details of these blocks have been presented in PROMOTioN deliverable 3.1.
VSC
DC-link
OWF
transformer
155 kVPoC
66 kV
WT
transformer
WT
converter
OWF
controllerV/I
measurements
V/I
measurements
User References
(P, Q/V/PF)wind
speed
References
(P, Q/V/dV)
Vabc
references
WT
controller
User Feedback
(Pavailable)
tripping signal
drivetrain
pitch
aerodyn.
Pavailable
Figure 2.1 VSC-connected OWF control hierarchy

PROJECT REPORT. Deliverable 3.2: Specifications of the control strategies and the simulation test cases
4
PoC V/I
measurements
User References
(P, Q/V/PF)
WT References
(P, Q/V/dV)
User Feedback
(Pavailable)
WT
Pavailable
Grid Measurement
Model
(for controller)
Communication
Model
(for references)
Communication
Model
(for measurements)
Communication
Model
(for references)
P-control
Model
Q-control
Model
Figure 2.2 OWF Control Blocks
2.2. WT CONTROL STRATEGIES (61400-27)
As IEC 61400-27-1 (EC61400-27-1:2015 Wind turbines - Part 27-1: Electrical simulation models - Wind
turbines) specifies dynamic simulation models for generic wind turbine topologies, it is a valuable starting point.
The models are described in a modular way and the standard also specifies a method to create models for
future wind power plant configurations. However, the models specified have some limitations:
– The models are not intended for long term stability analysis.
– The models are not intended for investigation of sub-synchronous interaction phenomena.
– The models are not intended for investigation of the fluctuations originating from wind speed variability in time
and space. This implies that the models do not include phenomena such as turbulence, tower shadow, wind
shear and wakes.
– The models do not cover phenomena such as harmonics, flicker or any other EMC emissions (See IEC 61000
series for further reference)
– The models have not been developed explicitly with eigenvalue calculation (for small signal stability) in mind.
– This standard does not address the specifics of short-circuit calculations.
– The models are not applicable to studies of extremely weak systems including situations where wind turbines
are islanded without other synchronous generation.
– The models specified here apply only to wind turbines, and therefore do not include wind power plant level
controls and additional equipment such as SVCs, STATCOMs and other devices which will be covered by
second edition of IEC 61400-27-1, that has not been published, as yet.
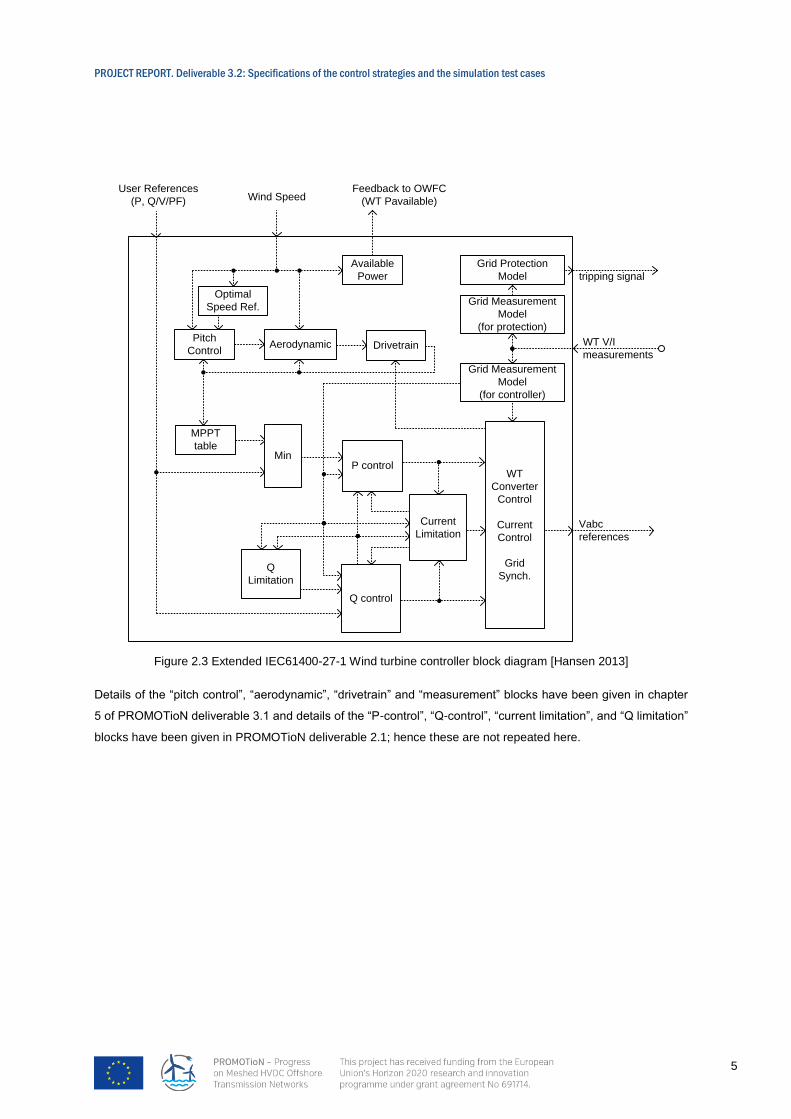
In order to overcome the aforementioned limitations, the IEC 61400-27-1 WT model is extended with additional
capabilities [Hansen 2013]. The block diagram showing the extended WT control is in figure 2-3.
PROJECT REPORT. Deliverable 3.2: Specifications of the control strategies and the simulation test cases
5
WT V/I
measurements
User References
(P, Q/V/PF)
Feedback to OWFC
(WT Pavailable)
Grid Protection
Model
Grid Measurement
Model
(for protection)
Grid Measurement
Model
(for controller)
Wind Speed
Available
Power tripping signal
Pitch
ControlAerodynamic Drivetrain
Optimal
Speed Ref.
MPPT
tableMin
P control
Current
Limitation
Q control
Q
Limitation
WT
Converter
Control
Current
Control
Grid
Synch.
Vabc
references
Figure 2.3 Extended IEC61400-27-1 Wind turbine controller block diagram [Hansen 2013]
Details of the “pitch control”, “aerodynamic”, “drivetrain” and “measurement” blocks have been given in chapter
5 of PROMOTioN deliverable 3.1 and details of the “P-control”, “Q-control”, “current limitation”, and “Q limitation”
blocks have been given in PROMOTioN deliverable 2.1; hence these are not repeated here.

PROJECT REPORT. Deliverable 3.2: Specifications of the control strategies and the simulation test cases
6
3. SPECIFICATION OF CONTROL STRATEGIES FOR DRU-
HVDC POINT-TO-POINT CONNECTION
This section includes the general description of the baseline scenario and the specification of control strategies
for DRU-HVDC point-to-point connections. The aim of this section is to define the general control architecture
and the control functionalities required, rather than a particular control algorithm. This approach has been
followed to allow for different solutions to be developed during the project.
The specification of the control strategies to connections other than point-to-point is outside of the scope of this
section, albeit it is envisaged that most of the control functionality required for a DRU-HVDC connection will be
of use in a multi-point or meshed connection involving DRUs. In any case, scenarios different from point-to-point
connections will be covered in WP2.
3.1. BASELINE SCENARIO AND SUMMARY OF OPERATIONAL REQUIREMENTS
Figure 3.1 Base line scenario with three DRU platforms

PROJECT REPORT. Deliverable 3.2: Specifications of the control strategies and the simulation test cases
7
Figure 3.1 shows the considered baseline scenario, as defined in PROMOTioN deliverable 3.1. The baseline
scenario considers:
Off-shore Wind Farms (OWFs):
The system considers three OWFs of 400 MW each connected to a 66kV off-shore AC grid. Each OWF is
composed of 50 x 8MW WT and the WTs are distributed in 6 strings (4 strings of 8 WTs and 2 of 9 WTs).
Considered distances between WTs are 2 km, and the distances from an OWF to a DC platform are 4 km, as
described in 5.2 of Deliverable 3.1. Other OWF layouts with WTs of different power might be specified, provided
that each OWF is of approx. 400MW and the total power is 1.2GW.
Off-shore Transmission System (OTS):
The off-shore transmission system comprises the DRU stations, the HVDC cable, the HVAC auxiliary cable and
on-shore converter station.
DRU platforms:
The DRU platforms contain two 200MW DRU, with the corresponding AC filters and harmonic compensators,
(as described in 3.2 of Deliverable 2.1) and the corresponding switchgear. The umbilical off-shore side breaker
and shunt compensator are also located on a DRU platform.
On-shore station:
It contains the on-shore MMC converter, on-shore transformer, -onshore OLTC transformer for the umbilical
cable, a shunt compensator, and breakers for connection/disconnection of umbilical cable.
For the baseline scenario, it is assumed that the cable distance is 150km. Specific studies might use a different
distance.
The parameters for the different elements are included in PROMOTioN Deliverables D2.1 and D3.1. For ease of
reference, typical system parameters, extracted from D2.1 and D3.1, are included in the Appendix.
PROJECT REPORT. Deliverable 3.2: Specifications of the control strategies and the simulation test cases
8
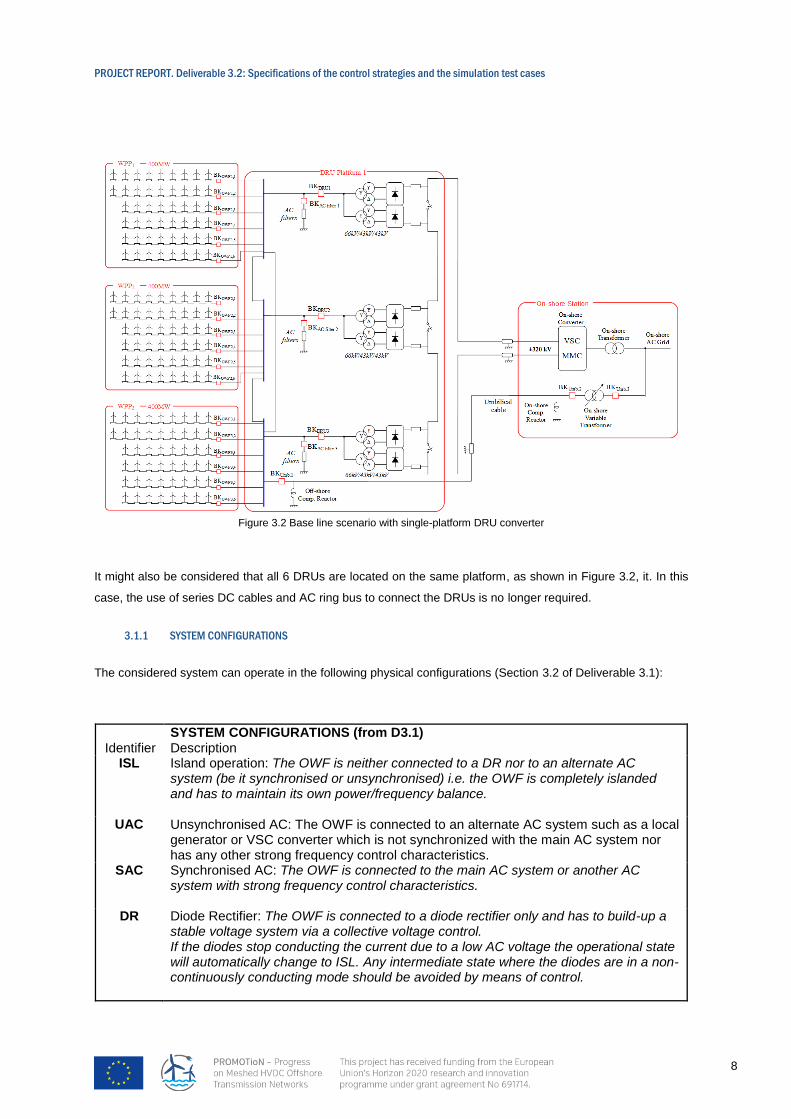
Figure 3.2 Base line scenario with single-platform DRU converter
It might also be considered that all 6 DRUs are located on the same platform, as shown in Figure 3.2, it. In this
case, the use of series DC cables and AC ring bus to connect the DRUs is no longer required.
3.1.1 SYSTEM CONFIGURATIONS
The considered system can operate in the following physical configurations (Section 3.2 of Deliverable 3.1):
SYSTEM CONFIGURATIONS (from D3.1) Identifier Description
ISL Island operation: The OWF is neither connected to a DR nor to an alternate AC system (be it synchronised or unsynchronised) i.e. the OWF is completely islanded and has to maintain its own power/frequency balance.
UAC Unsynchronised AC: The OWF is connected to an alternate AC system such as a local generator or VSC converter which is not synchronized with the main AC system nor has any other strong frequency control characteristics.
SAC Synchronised AC: The OWF is connected to the main AC system or another AC system with strong frequency control characteristics.
DR Diode Rectifier: The OWF is connected to a diode rectifier only and has to build-up a stable voltage system via a collective voltage control. If the diodes stop conducting the current due to a low AC voltage the operational state will automatically change to ISL. Any intermediate state where the diodes are in a non-continuously conducting mode should be avoided by means of control.

PROJECT REPORT. Deliverable 3.2: Specifications of the control strategies and the simulation test cases
9
SYSTEM CONFIGURATIONS (from D3.1) Identifier Description DRUAC Diode Rectifier and unsynchronised AC: The OWF is connected to a diode rectifier
and an alternate AC system, such as a local generator, or a VSC converter, which is not synchronized with the main AC system nor has any other strong frequency control characteristics.
DRSAC Diode Rectifier and synchronised AC: The OWF is connected to a diode rectifier and another AC system with strong frequency control characteristics.
The aforementioned configurations are defined as a starting point in order to perform the test case studies.
Therefore, they will be evaluated during task 3.2 and might be re-defined at a later stage. Each mode has to
deal with different issues and meet the operational requirements proposed in Deliverable 3.1.
Throughout this document, the main option for offshore AC network initialization is considered to be the SAC,
i.e. the umbilical cable solution. Alternative options are valid and could also be studied, provided that the
Deliverable 3.1 operational requirements are met.
3.1.2 FAULT-RIDE-THROUGH AND PROTECTION STRATEGIES
In DRU connected OWFs, the grid side converters (GSCs) in the wind turbines control the offshore AC voltage
and frequency. During a fault in the offshore AC collector or on the HVDC cable, the turbine GSCs are likely to
operate at current limiting mode with limited over-current capability. This is very different to the fault behaviour
of conventional AC grid supplied by synchronous generators which can provide significant over-current during a
fault. For onshore AC fault, the power transmission capability of the onshore MMC converter is likely to be
reduced and the power output from the WFs must be reduced accordingly to ensure safe operation and quick
system recovery after the fault clearance.
Protection of DRU connected offshore WF AC network poses new challenges due to limited current from WT
converters during a fault. Overcurrent protection provides a relatively simple protection method providing
significant overcurrent exists during a fault. Although wind turbines’ GSCs have limited fault current capability,
during a fault on one of the turbine strings, substantial overcurrent might still be present as all the other turbines
will feed fault current to the fault in one of the strings.
3.1.2.1 ON-SHORE GRID FAULTS
During an onshore AC fault, the onshore MMC can still be actively controlled. However, the transmission
capability of the MMC is likely to be reduced due the decrease of the AC grid voltage. If the imported energy
from the offshore AC grid to the HVDC link through the DRUs is greater than the power exportation capability of
the MMC, the MMC will be operated at current limit mode and the DC voltage of the HVDC link and the MMC
submodule capacitors will be charged by the surplus power and rise above the rated values.

PROJECT REPORT. Deliverable 3.2: Specifications of the control strategies and the simulation test cases
10
To avoid the DC overvoltage and successfully ride-through the onshore grid fault, the imported energy to the
HVDC link from the WFs needs to be reduced as soon as possible during a close fault. The operation states of
the offshore WF GSCs ideally should be independent on fault detection and operate autonomously during the
fault to minimise communication requirement between the onshore MMC and the offshore WTs. The onshore
MMC can continue to provide proper reactive power to support the onshore AC grid during the fault. After the
fault clearance, the offshore wind energy transmission can be quickly resumed.
In the event of an asymmetrical onshore AC fault, the AC terminal voltage of the MMC becomes unbalanced. In
addition to the positive sequence component, negative sequence current might need to be properly controlled to
suppress potential power oscillation.
3.1.2.2 DC-CABLE FAULTS
After the pole-to-pole or pole-to-ground DC faults, the DC voltage of HVDC link is significantly reduced and the
power transmission is terminated. The offshore wind turbine GSCs are operated with current limits and provide
fault currents to enable fault detection. The full-bridge (FB) based onshore MMC can continue to operate during
the fault due to the use of FB submodules and prevents any fault current flowing from the onshore AC network
to the DC fault. The submodule capacitor voltages of the MMC can be controlled at the rated value and reactive
power of the MMC can also be regulated to support the onshore AC network. For a radial connection, a cable
fault is permanent and will lead to loss of transmission capability.
3.1.2.3 DRU FAULTS
After an internal fault of a DRU is detected, the faulty DRU unit needs to be disconnected and the system
reconfigured so the system can continue transferring wind power using the other healthy DRUs. The HVDC link
will operate with reduced DC voltages, benefitting from the negative voltage generating capability of the full-
bridge submodule in the onshore MMCs.
3.1.2.4 OWF AC GRID FAULTS
After a fault on the offshore AC grid, the WT GSCs need to provide fault currents to enable fault detection for
the protection relays and isolate the faulty branch. Once the faulty branch is isolated, the healthy parts can
restart and transfer power to the onshore grid. Due to the unidirectional characteristics of the DRUs, the
offshore AC grid fault is expected to have limited influence on the operation of the onshore MMCs (apart from
short period of power interruption). WT controllers should comply with the considered power recovery functional
requirements in D3.2. Moreover, for accurate studies, transformer saturation might need to be considered,
particularly during unbalanced faults.

PROJECT REPORT. Deliverable 3.2: Specifications of the control strategies and the simulation test cases
11
3.1.3 ANCILLARY SERVICES
A simplified block diagram of the OWF (group) functionality is shown in Figure 3.3. The controls to be developed
for the OWF (group) to contribute in the provision of ancillary services to the onshore AC grid will be based on
those in the OWF active controller presented in Figure 3.4, developed in (L. Zeni et al. 2016) for OWFs
connected to HVDC via VSCs. In normal operation mode (DR configuration with continuous conduction), an
OWF (group) contributes in the provision of ancillary services to the onshore AC grid by means of outer control
loops, which modify, amongst others, the value of its active power reference input, Pref(t). (L. Zeni 2015)(WP3,
Promotion 2016).
OWF Group and OWF Controllers
OWF-OTS Coordinator and/or
System Operator
Active
Power
Controller
WTG 1Pref,WTG,1(t)
Pava,WTG,n(t)
Onshore AC
Measurements
DispatchPref,WTG(t)
WTG nPref,WTG,n(t)
Pava,WTG,1(t)
Figure 3.3 Simplified block diagram of the OWF (group) functionality for providing ancillary services to the onsore AC grid.
Figure 3.4 OWF active power controller developed in (L. Zeni 2015) for OWFs connected to HVDC via VSCs.
Active power reference signals are then dispatched to each WT, Pref,WT,i(t), taking into account their available
active power, Pava,WT,i(t), while ensuring that gain and phase shifts caused by the WT controllers are cancelled
out, that the requirements for normal operation are fulfilled (e.g., offshore frequency and voltage maintained
within their required operational ranges), and that the overall OWF (group) response is as required. The studied
schemes rely on the direct communication of the necessary onshore measurements by means of signals sent
by the OWF-OTS Coordinator or the System Operator. The study of the actual capability of the OWF (group) to
C h a p te r 3
-3 2 -
T h e m o d e l u s e d in th is s tu d y is b u ilt u p o n a k e rn e l b a s e d o n IE C s ta n d a rd 6 1 4 0 0 -2 7 -1 d ra f t [2 2 ].
T y p e s 4 A a n d 4 B a re u s e d a n d s c a le d u p to m im ic a n a g g re g a te d W P P . T h e m o d e ls a re e x p a n d e d ,
w h e n n e c e s s a ry (C h a p te r 6 a n d p a r ts o f C h a p te r 7) w ith p it c h c o n t ro l, a e ro d y n a m ic m o d e l a n d
w in d m o d e l, a s d e s c r ib e d in P u b lic a t io n 9 [1 1 1 ] .
F u r th e rm o re , s o m e s im u la t io n s in C h a p te r 6 a n d C h a p te r 7 n e e d m o d e llin g o f p la n t c o n t ro l
(W P P C ) d y n a m ic s . A W P P C w a s d e v e lo p e d b y e x p a n d in g th a t fo u n d in A n n e x D o f [2 2 ],
a c c o rd in g to th e s k e tc h in F ig u re 1 4. S a m p le p a ra m e te rs fo r a ll m o d e ls a re g iv e n in A p p e n d ix 2.
O n ly th e a c t iv e p o w e r c o n t ro l lo o p is c o n s id e re d , a s it is th e o n ly o n e b e in g re le v a n t th ro u g h o u t
th is re p o r t , o w in g to th e d e c o u p lin g g u a ra n te e d b y th e H V D C s y s te m a n d th e fa c t th a t p la n t - le v e l
re a c t iv e p o w e r c o n t ro l in th e o f fs h o re A C g r id is o u t o f s c o p e .
1
1 + s Tp p c f
D roop
f D B ,K p p c ff re f
f
-
1
1 + s Tp p c P
P W T G
P re f
K p p c P
K p p c I
1
s
dP M A X
dP m in
P M A X
P m in
1 + s Tp C
1 + s Tz C
P re f W T GdP M A X
P M A X
dP m in
P m in
F F F f
-
F re e z e
F f P O D
F F F f
P re f P O D1 + s Tp P O D
1 + s Tz P O D
K P O D
0z
- 1
f r
f r
f r
s K p p c in
1 + s Tp p c in
P D C
F ig u re 1 4 - W P P C : a c tive p o w e r co n tro lle r.
3 .3 M o d e l a d e q u a c y
W h e n it is n o t p o s s ib le to p ro m p t ly e v a lu a te m o d e l a d e q u a c y b y v a lid a t in g it a g a in s t re a l
m e a s u re m e n ts o r v a lid a te d m o d e ls , th e ta rg e t s tu d ie s a n d s u b s e q u e n t re q u ire m e n ts lis te d a b o v e ,
a lo n g w ith re a s o n a b le e n g in e e r in g ju d g e m e n t a n d p u b lis h e d e x p e r ie n c e , a re th e o n ly c r ite r ia to
a s s e s s th e s o lid it y o f th e m o d e ls in re la t io n to th e s c o p e o f w o rk .
B a s e d o n th e p re s e n t s c o p e o f w o rk a n d lit e ra tu re in th e f ie ld , a n a s s e s s m e n t o f th e m o d e ls
v a lid it y c o u ld g o a lo n g th e s e lin e s :
· P o w e r s y s te m m o d e llin g is w e ll d o c u m e n te d a n d s a m p le d a ta a re re a d ily a v a ila b le fo r
e s s e n t ia lly a ll t y p ic a l p o w e r s y s te m c o m p o n e n ts , s u c h a s S Gs a n d th e ir c o n t ro lle rs ,
t ra n s m is s io n lin e s , t ra n s fo rm e rs , e tc . – s e e e .g . [7 6 ] , [1 0 7 ] , [1 1 2 ] , [1 1 3 ] . T h e le v e l o f
d e ta il a d o p te d h e re is d e e m e d to b e s o lid e n o u g h fo r th e s c o p e .
· M o d e llin g o f V S C -H V D C s y s te m s , e s p e c ia lly b a s e d o n M M C te c h n o lo g y , is s t ill s u b je c t
o f re s e a rc h [9 7 ] , [1 0 0 ] - [1 0 2 ] , [1 1 4 ] a n d k n o w le d g e a b o u t d if fe re n t m o d e ls ’ v a lid it y is
b e in g g e n e ra te d . G e n e ra lly , e v e n ts re g a rd in g a b ru p t d is tu rb a n c e s o n th e D C s id e o f th e
c o n v e r te rs a n d /o r b lo c k in g -d e b lo c k in g o f th e IG B T s a re th e m o s t c r it ic a l to b e
re p ro d u c e d b y re d u c e d m o d e ls [1 0 0 ] , [1 1 5 ] . C h a p te r 6 re g a rd s s u d d e n p o w e r im b a la n c e s
o n th e c o n v e r te r ’s D C s id e . A lth o u g h s u c h e v e n ts a re n o t a s d ra m a t ic a s D C fa u lts , s o m e
m o re s t re s s is p u t in th is th e s is o n th e a d e q u a c y o f s im p lif ie d m o d e ls d u r in g s u c h
c o n t in g e n c ie s , b y th e a n a ly s is p re s e n te d b e lo w in S e c t io n 3 .3 .1. T h e d is c u s s io n a ls o
in c lu d e s P O D e v e n ts .
POD
Frequency Support PFFR
PPFR
e
u
PPOD

PROJECT REPORT. Deliverable 3.2: Specifications of the control strategies and the simulation test cases
12
provide such services will be prioritised over e.g., the study of their impact and benefit on the onshore
synchronous area stability (L. Zeni 2015; WP3, Promotion 2016).
To increase robustness, communication delays should be minimised. Furthermore, their values should be fixed
so that they are independent of the operation point and control parameters, and can thus be compensated for in
a robust manner. 100 ms can be considered a realistic value. WT rotor speed stability must be guaranteed for
the cases in which the provision of an ancillary service requires the WTs to produce more power than that
commanded by their MPPT scheme. The maximum gradients during the provision of such services must be
considered when designing the WTs and sizing the ramp-rate limiters (L. Zeni et al. 2016; L. Zeni 2015).
3.1.3.1 ONSHORE FREQUENCY SUPPORT
A simplified block diagram of the OWF (group) functionality for providing onshore frequency support is
presented in Figure 3.5. The onshore frequency, f(t), is communicated continuously to the OWF (group) by
means of a signal sent by the OWF-OTS Coordinator. The OWF (group) decreases its active power output upon
detecting a significant onshore frequency increase. Additional active power is necessary for the OWF (group) to
increase its active power output upon detecting a significant onshore frequency decrease. Such additional
power can be made available by preventively operating the OWF (group) constantly curtailed. Moreover, some
additional boosting active power can be extracted for a relatively short period of time, from the kinetic energy
stored in the rotating masses of the WT rotor and drive train systems, at the expense of the active power output
dropping below its pre-boost value afterwards (WP3, Promotion 2016; G. C. Tarnowski 2011).
OWF Group and OWF Controllers
OWF-OTS Coordinator and/or
System Operator
Active
Power
Controller
WTG 1f(t)
fref(t)
Pref(t)
Pref,WTG,1(t)
Pava,WTG,n(t)
Frequency Estimation
Onshore AC
Voltage
Measurement
Pava(t)
DispatchPref,WTG(t)
WTG nPref,WTG,n(t)
Pava,WTG,1(t)
Figure 3.5 Simplified block diagram of the OWF (group) functionality for providing onshore frequency support
Upon an onshore frequency event, the OWF (group) shall detect the event and start activating its frequency
response within 0.5 s after receiving the corresponding signal, f(t). Moreover, the time for such response to be
fully activated shall be shorter than 30 s after receiving the corresponding signal (WP3, Promotion 2016;
ENTSO-E 2015; ENTSO-E 2016).

PROJECT REPORT. Deliverable 3.2: Specifications of the control strategies and the simulation test cases
13
PRIMARY FREQUENCY RESPONSE (PFR)
The primary frequency response (PFR) of the OWF (group), PPFR(t), is based on the active-power-frequency
droop shown in Figure 3.6. The OWF (group) should be able to provide such response for at least 15 min, while
considering its primary energy source (WP3, Promotion 2016; ENTSO-E 2016; ENTSO-E 2015). Reserved
active power from preventive curtailment will be considered as the source of additional active power for the PFR
to onshore under-frequency events.
Figure 3.6 OWF PFR capability to onshore frequency changes (droop) (WP3, Promotion 2016)
FAST FREQUENCY RESPONSE (FFR)
During the first stage of large frequency deviations (active power imbalances) in the onshore AC grid, the OWF
(group) contributes to its stabilisation by means of its fast frequency response (FFR), PFFR(t), based, in the case
of the controller shown in Figure 3.4, on the derivative of the frequency signal. Through such functionality, the
OWF (group) should be capable of providing at least 5% of the actual active power for 10 s. Moreover, the OWF
(group) should have the capability of producing a FFR similar to the inertial response of a conventional
synchronous generator with an inertia time constant (mechanical starting time) of 3.5 s (G. C. Tarnowski 2011;
WP3, Promotion 2016; Hydro-Québec TransÉnergie 2009). The kinetic energy from the rotational masses will
be considered as the source of additional power for the FFR to onshore under-frequency events.
3.1.3.2 ONSHORE POWER OSCILLATION DAMPING
A simplified block diagram of the OWF (group) functionality for providing power oscillation damping is shown in
Figure 3.7. When the OWF (group) is required to provide power oscillation damping (POD), it receives a
command consisting of a signal, Pref,POD(t), and an activation of a flag, Ff,POD(t), which switches the OWF (group)
controller to the POD control mode. In such mode, the values of its control signal, u(t), and control error, e(t),

PROJECT REPORT. Deliverable 3.2: Specifications of the control strategies and the simulation test cases
14
are frozen, and its active power output is modulated so as to superimpose the damping signal PPOD(t) on the
frozen value of the control signal, u*(t) =u0 + PPOD(t) (L. Zeni 2015; WP3, Promotion 2016).
OWF Group and OWF Controllers
OWF-OTS Coordinator and/or
System Operator
Active
Power
Controller
WTG 1Ff,POD(t)
Pref,POD(t)
Pref(t)
Pref,WTG,1(t)
Pava,WTG,n(t)
Onshore AC
Voltage and Current
Measurements
Pava(t)
DispatchPref,WTG(t)
WTG nPref,WTG,n(t)
Pava,WTG,1(t)
Power Oscillation Detection
and
Signal Generation
Figure 3.7 Simplified block diagram of the OWF (group) functionality for providing power oscillation damping
Through such functionality, the OWF (group) should be able to modulate its active power output so as to contain
a sinusoidal variation with a magnitude of 0.1 p.u., in the frequency range of 0.3–2 Hz. Moreover, it should not
interact in an undesired manner with other generators in the onshore AC grid or introduce additional poorly
damped eigenmodes into it. Mechanical resonances in the WTs (e.g., shafts, towers, blades) caused by the
provision of POD should be avoided. The maximum gradients during POD can be as high as 1.2 p.u./s (WP3,
Promotion 2016; L. Zeni 2015; National Grid Electricity Transmission 2016)
3.2. CONTROL ARCHITECTURE
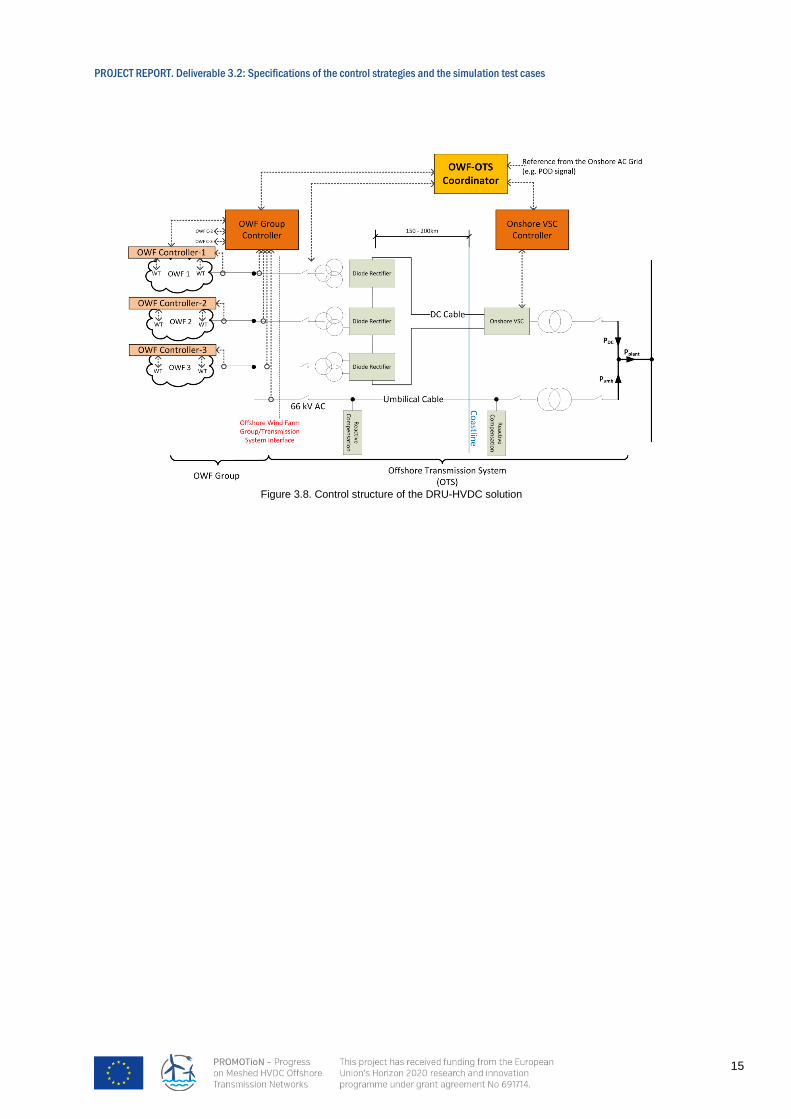
Figure 3.8 shows the considered system control structure:
Off-shore wind farm – off-shore transmission system coordinator (OWF-OTS coordinator).
Onshore VSC controller.
Off-shore wind farm group controller if there are wind farms from different OEMs (OWF group
controller).
Off-shore wind farm controller (OWF controller).
Wind turbine controller (WT controller).
The considered control hierarchy is shown as a guideline and it is understood that control functionality can be
implemented in different physical equipment. Moreover, the implementation and specific algorithms will differ for
each vendor, therefore, this section focuses on functionality rather than on specific control algorithm description
or implementation.
When validating WT controllers, typical reaction times of some controllers (OWF-OTS coordinator and OWF
group controller) might be too slow (in the order of several minutes) for EMT simulations. Therefore, OWF-OTS
coordinator and OWF group controllers with basic (or faster than real) functionality could be used for EMT
simulations aimed at validating WT controllers.
PROJECT REPORT. Deliverable 3.2: Specifications of the control strategies and the simulation test cases
15
Figure 3.8. Control structure of the DRU-HVDC solution

PROJECT REPORT. Deliverable 3.2: Specifications of the control strategies and the simulation test cases
16
3.2.1 SPECIFICATION OF OWF-OTS COORDINATOR TASKS
The OWF-OTS coordinator it the top-most controller, in charge of setting the configuration of the complete
system. The control specifications included in this section are considered as a basic guideline for minimum
functionality.
For EMT simulation test cases, a more simplifided OWF-OTS coordinator can be used, since complete start-up
and shut-down processes might take several minutes and hence a detailed OWF-OTS controller be not suitable
for this kind of studies.
The main OWF-OTS Coordinator functionalities are:
a. Control the transition between system configurations (asisted by OWF and WT controllers),
particularly during start-up and shut down procedure
b. System diagnosis and re-configuration in the event of faults
c. Receive references and commands from the operator and TSO
d. Coordinate the provision of ancillary services for the on-shore grid
The OWF-OTS Coordinator will interface to the following elements, mainly to send commands and set-points
and to receive status information and measurements.
TSO / Operator. Receive set points and mode of operation with respect to on-shore grid (voltage
support, ancillary services, etc) and send overall system status information.
On-shore VSC station.
o Commands / setpoints to send: start, stop, mode of operation, HVDC link voltage
reference, HVDC reactive power/voltage set-points.
o Status info and measurements to be received: PCC voltage, frequency, active and
reactive power, umbilical voltage, active and reactive power.
On-shore umbilical switchgear: send open and close commands and receive breaker status.
Umbilical transformer tap changer: send voltage and/or tap references and receive status. (if tap
changer controls off-shore ac voltage, then off-shore ac voltage is sent to tap changer controller)
66kV off-shore switchgear: off-shore umbilical breaker, DRU breakers, filter breakers and cable
protection breakers. Send open and close commands to all breakers and receive breaker status.
OWF group controller.
o Commands/setpoints to be sent: start, stop, desired mode of operation, set-points:
voltage, frequency, umbilical cable power set-point, power curtailing.
o Status info and measurements to be received: OWF status (mode of operation, OWF
breaker status, operational WTs, faults detected, etc), active power delivered, estimated
active power available, frequency measurement.
Required speed of communication is similar to SCADA systems (from 500ms to the order of seconds) for
normal operation although faster communication might be required during fault handling.

PROJECT REPORT. Deliverable 3.2: Specifications of the control strategies and the simulation test cases
17
Figure 3.9. Transition between system configurations
A basic state diagram showing the transition between the different system configurations is shown in Figure 3.9,
therefore covering start-up and shutdown operations, as well as normal DR-HVDC transmission (state 7).
The same state diagram would apply if instead of powering up the OWF from a synchronised AC (SAC), it is
powered up by means of an unsynchronised AC source (UAC).
Most transitions between system configurations are in response to commands by the OWF-OTS controller,
however, some transitions can occur as response to circuit breakers opening or closing without explicit
communication by the OWF-OTS coordinator. Therefore OWF controller and WT controllers should be able to
respond to changes in system configuration without an explicit command from the OWF-OTS coordinator.
3.2.2 SPECIFICATION OF ON-SHORE CONVERTER CONTROL TASKS AND STRATEGIES
The specification of the on-shore VSC converter control tasks and strategies is covered in detail in
PROMOTioN Deliverable D2.1.
3.2.3 SPECIFICATION OF OWF GROUP CONTROLLER TASKS
The off-shore wind farm (OWF) group controller can be used if off-shore wind farms from different
manufacturers are considered or when a single wind farm controller cannot deal with the total number of
installed wind turbines. Otherwise, the OWF group controller might not be required and its functionality be
assumed by the OWF controller.
PROJECT REPORT. Deliverable 3.2: Specifications of the control strategies and the simulation test cases
18
Therefore, the OWF group controller functionalities are:
a. Interface the OWF-OTS controller with the different OWF controllers.
b. Process and send commands and set-points to the OWF controllers (e.g. reactive power optimisation,
umbilical cable power control).
c. Synchronisation with umbilical cable for SAC, DRSAC or with external AC for UAC or DRUAC
operation.
The OWF group controller will interface to the following elements:
OWF-OTS coordinator:
o Status info and measurements to be sent to OWF-OTS coordinator: OWF status (mode
of operation, OWF breaker status, operational WTs, faults detected, etc), active power
delivered, estimated active power available, frequency measurement.
o Commands/setpoints to be received from OWF-OTS coordinator: start, stop, desired
mode of operation, set-points: voltage, frequency, umbilical cable power set-point, power
curtailing.
OWF controller:
o Commands/setpoints to be sent to OWF controller: start, stop, desired mode of operation,
set-points: voltage, frequency, umbilical cable power set-point, power curtailing.
o Status info and mesurements to be received from OWF controller: OWF status (mode of
operation, OWF breaker status, operational WTs, faults detected, etc), active power
delivered, estimated active power available.
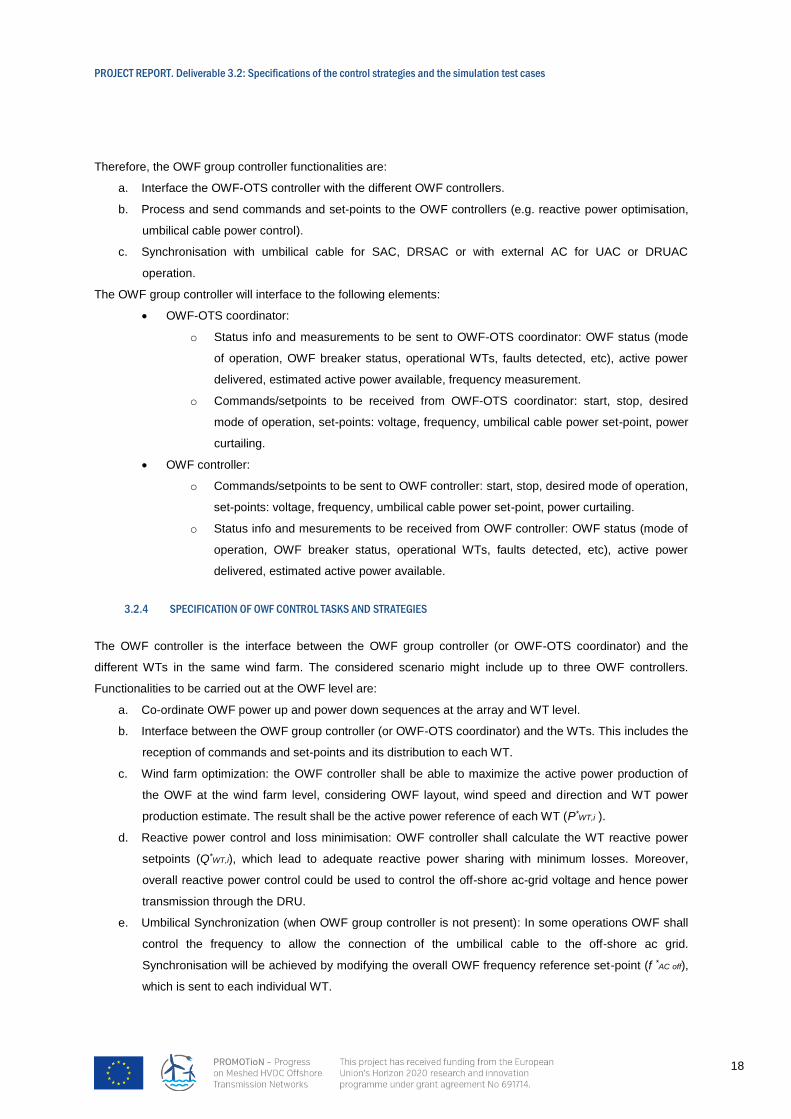
3.2.4 SPECIFICATION OF OWF CONTROL TASKS AND STRATEGIES
The OWF controller is the interface between the OWF group controller (or OWF-OTS coordinator) and the
different WTs in the same wind farm. The considered scenario might include up to three OWF controllers.
Functionalities to be carried out at the OWF level are:
a. Co-ordinate OWF power up and power down sequences at the array and WT level.
b. Interface between the OWF group controller (or OWF-OTS coordinator) and the WTs. This includes the
reception of commands and set-points and its distribution to each WT.
c. Wind farm optimization: the OWF controller shall be able to maximize the active power production of
the OWF at the wind farm level, considering OWF layout, wind speed and direction and WT power
production estimate. The result shall be the active power reference of each WT (P*WT,i ).
d. Reactive power control and loss minimisation: OWF controller shall calculate the WT reactive power
setpoints (Q*WT,i), which lead to adequate reactive power sharing with minimum losses. Moreover,
overall reactive power control could be used to control the off-shore ac-grid voltage and hence power
transmission through the DRU.
e. Umbilical Synchronization (when OWF group controller is not present): In some operations OWF shall
control the frequency to allow the connection of the umbilical cable to the off-shore ac grid.
Synchronisation will be achieved by modifying the overall OWF frequency reference set-point (f *AC·off),
which is sent to each individual WT.
PROJECT REPORT. Deliverable 3.2: Specifications of the control strategies and the simulation test cases
19
The OWF controller will interface to the following elements:
OWF group controller (or OWF-OTS coordinator if OWF-GC is not used):
o Status info and measurements to be sent to OWF group controller: OWF status (mode of
operation, OWF breaker status, operational WTs, faults detected, etc), active power
delivered, estimated active power available, frequency measurement.
o Commands/setpoints to be received from OWF group controller: coordinator: start, stop,
desired mode of operation, set-points: voltage, frequency, umbilical cable power set-
point, power curtailing.
Individual WTs:
o Commands/setpoints to be sent from OWF to WT controller: start, stop, desired mode of
operation, set-points: voltage, frequency, umbilical cable power set-point, power
curtailing.
o Status info and mesurements to send from WT controller to OWF controller: OWF status
(mode of operation, OWF breaker status, operational WTs, faults detected, etc), active
power delivered, estimated active power available.
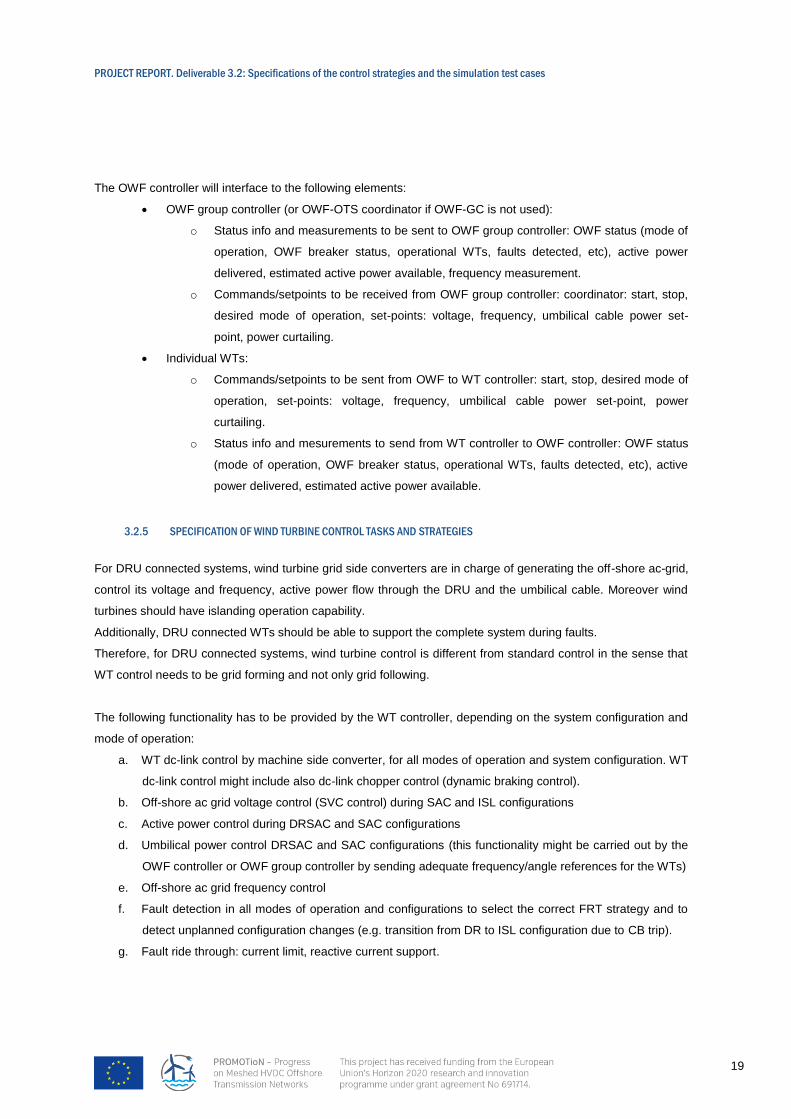
3.2.5 SPECIFICATION OF WIND TURBINE CONTROL TASKS AND STRATEGIES
For DRU connected systems, wind turbine grid side converters are in charge of generating the off-shore ac-grid,
control its voltage and frequency, active power flow through the DRU and the umbilical cable. Moreover wind
turbines should have islanding operation capability.
Additionally, DRU connected WTs should be able to support the complete system during faults.
Therefore, for DRU connected systems, wind turbine control is different from standard control in the sense that
WT control needs to be grid forming and not only grid following.
The following functionality has to be provided by the WT controller, depending on the system configuration and
mode of operation:
a. WT dc-link control by machine side converter, for all modes of operation and system configuration. WT
dc-link control might include also dc-link chopper control (dynamic braking control).
b. Off-shore ac grid voltage control (SVC control) during SAC and ISL configurations
c. Active power control during DRSAC and SAC configurations
d. Umbilical power control DRSAC and SAC configurations (this functionality might be carried out by the
OWF controller or OWF group controller by sending adequate frequency/angle references for the WTs)
e. Off-shore ac grid frequency control
f. Fault detection in all modes of operation and configurations to select the correct FRT strategy and to
detect unplanned configuration changes (e.g. transition from DR to ISL configuration due to CB trip).
g. Fault ride through: current limit, reactive current support.
PROJECT REPORT. Deliverable 3.2: Specifications of the control strategies and the simulation test cases
20
Functionalities from b. to g. are implemented in the GSC controller. Specific WT control strategies for DRU
connection that cover all or some of the above functionality can be found in (Seman, 2015, Andrade, 2015,
Blasco-Gimenez, 2010).
The WT receives the following set-points from the corresponding OWF controller:
Pwt,i: Active power reference received from OWF controller. Maximum Cp control is the normal mode
of operation of the individual WTs. However an active power reference might be sent by the OWF
controller if power curtailment is required or in case of wind farm wide active power optimisation.
Qwt,i: Reactive power reference received from OWF controller.
V_ac-OWF,j: j-th OWF PCC voltage reference received from OWF controller
f_ac-OWF,j: j-th OWF PCC frequency reference received from OWF controller.
Mode,i: Mode of operation: SVC operation, active power generation, start-up, shut-down sequences,
umbilical synchronisation.
The WT will send the following information to the corresponding OWF controller:
Pwt,iavailable: Available local wind power (Pwt,iavailable).
Status information: Mode of operation, voltage, frequency, active and reactive power delivered by
GSC, WT breaker status.
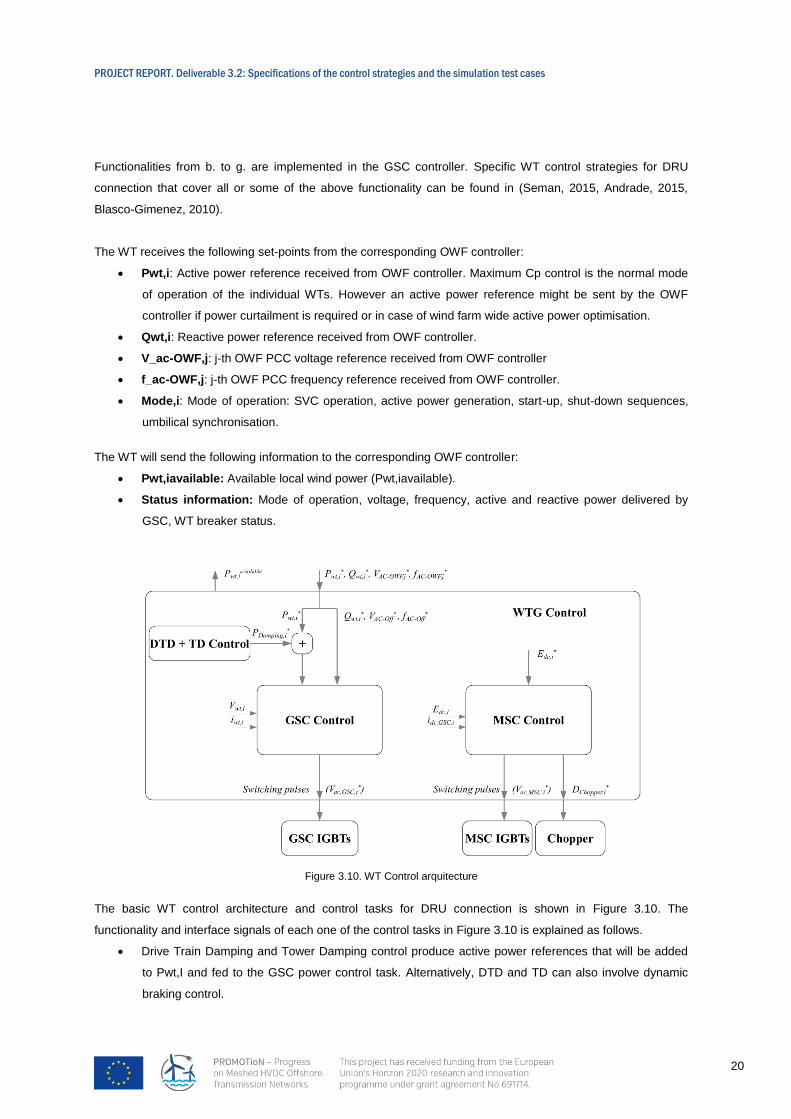
Figure 3.10. WT Control arquitecture
The basic WT control architecture and control tasks for DRU connection is shown in Figure 3.10. The
functionality and interface signals of each one of the control tasks in Figure 3.10 is explained as follows.
Drive Train Damping and Tower Damping control produce active power references that will be added
to Pwt,I and fed to the GSC power control task. Alternatively, DTD and TD can also involve dynamic
braking control.

PROJECT REPORT. Deliverable 3.2: Specifications of the control strategies and the simulation test cases
21
GSC control takes the following references:
o P_gsc,i*: Active power reference that has to be injected at i-th WT terminals . This reference
includes DTD and TD.
o Q_gsc,i*: Reactive power reference that has to be injected at i-th WT terminals .
o V_ac-OWF,j*: Voltage reference of the j-th OWF PCC where the reference power flow has to
be established
o f_ac-OWF,j*: Frequency reference of the j-th OWF PCC where the reference power flow has
to be established
GSC control measures the following quantities:
o Vwt,I: voltage at the low voltage side of the WT transformer
o Iwt,i: current at low voltage side of the WT transformer
o Fwt,i: Frequency at low voltage side of the WT transformer (could be a FLL).
GSC control has to provide the following functionalities during DR operation:
o Off-shore ac-grid frequency control
o Off-shore ac-grid voltage control if SVC mode requested
o WT power control
MSC control takes the following references:
o E_dc,i*: DC bus voltage reference set by WT control
MSC control measures the following quantities:
o E_dc,i: DC bus voltage
o I_dc,GSC,i: GSC current in its dc side
o θr,i: Field oriented phase of wind turbine rotor.
o I_ac,MSC,i: MSC current in its ac side
MSC control has to provide the following functionalities during DR operation:
o DC bus voltage control
o Generator control
Max Cp control measures the following quantities:
o ωr,i: Wind turbine speed
o v_wind,i: Average wind speed within rotor area
o β_i: pith angle
Max Cp control has to provide the following functionalities:
o Optimal wind turbine speed/power for optimum Cp
o Maximum available wind power calculation
The proposed WT control structure is to be used in the project and not necessarily the only one possible (e.g.
with regard to functional split between MSC and GSC).

PROJECT REPORT. Deliverable 3.2: Specifications of the control strategies and the simulation test cases
22
4. SPECIFICATION OF SIMULATION TEST CASES FOR
POINT-TO-POINT DRU-HVDC CONNECTION
The simulation test cases described in this section aim at specifying a basic procedure to evaluate the
requirements stated in Deliverable D3.1 for the benchmark control and system architecture described in the
previous section.
Each test case includes a list of the relevant functional requirements to be validated, the control systems
affected and the level of simulation detail to achieve the validation of the specific functional requirements.
4.1. SPECIFICATION OF TEST-SPECIFIC SIMULATION DETAIL
The number of simulations required for a reasonably thorough verification of the functional requirements in D3.1
can be particularly large, particularly if sensitivity to different parameters is considered.
Clearly, the level of simulation detail is a trade-off between simulation accuracy and simulation time. As the
number of test cases and sub-test cases can be relatively large, an important outcome of the project will be the
validation of the minimum simulation complexity that provides results comparable to those achieved with very
detailed simulations.
The simulation detail and aggregation level considered for each test case are given as an a-priori reasoned
approximation, and might be updated during the course of the project as new results become available.
4.1.1 LEVEL OF AGGREGATION OF OWF MODELS
It is assumed that the OWF consists of a number of radial operated loops or a number of strings. A relatively
large number of aggregation levels are defined here for the sake of completeness, so the adequate level for
each particular study can be chosen. Equivalent parameters for different aggregation levels should be chosen
so power flow, voltage and currents at the point of coupling for both aggregated and un-aggregated systems are
the same (Muljadi, 2006). The following aggregation levels are defined:
Level 1. No aggregation, consider a number of WTs forming 3 OWFs of 400MW each, leading to a total of
1.2GW. Level 1 detailed model will be used to define different levels of aggregation.

PROJECT REPORT. Deliverable 3.2: Specifications of the control strategies and the simulation test cases
23
Figure 4.1. Level 1 model – No aggregation
Level 2. One OWF without aggregation (400MW) plus a number of aggregated strings to form the remaining two
400MW OWFs.
Figure 4.2. Level 2. One full OWF and aggregated strings
Level 3. One OWF without aggregation (400MW) plus two 400MW aggregated OWFs.

PROJECT REPORT. Deliverable 3.2: Specifications of the control strategies and the simulation test cases
24
Figure 4.3. Level 3 model. One detailed wind farm and two aggregated wind farms.
Level 4. One detailed string and a number of aggregated strings up to the total considered power per OWF.
Figure 4.4: Level 4. One complete string per OWF and aggregated strings.
Level 5. One detailed string and a number of aggregated strings up to the total considered power.
PROJECT REPORT. Deliverable 3.2: Specifications of the control strategies and the simulation test cases
25
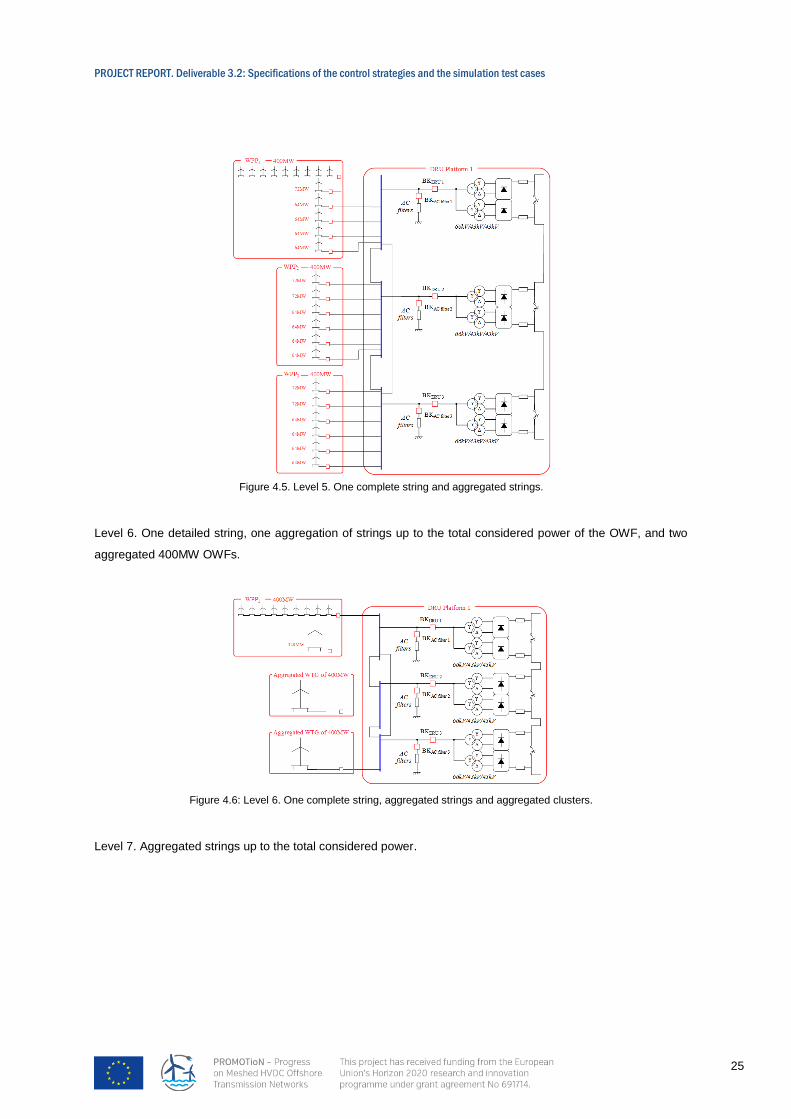
Figure 4.5. Level 5. One complete string and aggregated strings.
Level 6. One detailed string, one aggregation of strings up to the total considered power of the OWF, and two
aggregated 400MW OWFs.
Figure 4.6: Level 6. One complete string, aggregated strings and aggregated clusters.
Level 7. Aggregated strings up to the total considered power.

PROJECT REPORT. Deliverable 3.2: Specifications of the control strategies and the simulation test cases
26
Figure 4.7. Level 7. Aggregated strings.
Level 8. Aggregated strings in one OWF and two aggregated 400MW OWFs.
Figure 4.8: Level 8. One aggregated strings in a OWF and two aggregated OWF.
Level 9. Three aggregated 400MW OWFs
PROJECT REPORT. Deliverable 3.2: Specifications of the control strategies and the simulation test cases
27
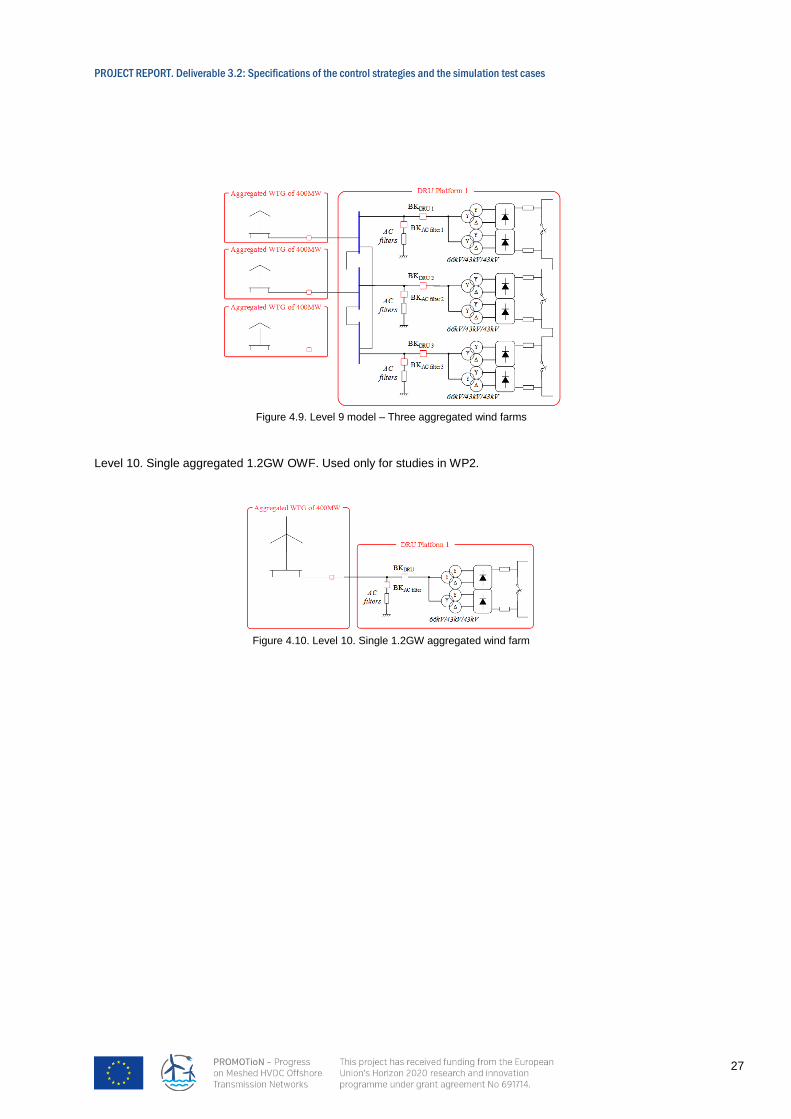
Figure 4.9. Level 9 model – Three aggregated wind farms
Level 10. Single aggregated 1.2GW OWF. Used only for studies in WP2.
Figure 4.10. Level 10. Single 1.2GW aggregated wind farm

PROJECT REPORT. Deliverable 3.2: Specifications of the control strategies and the simulation test cases
28
4.1.2 LEVEL OF DETAIL FOR ON-SHORE GRID MODELLING
In D2.1 Chapter 3, Component Models, 3.5 Onshore Grid two onshore grid models have been described, which
are considered to be used in WP3 studies as well. The first onshore grid model is Single Machine Infinite Bus
model with two main parameters: the power system inertia constant (H in seconds) and the short circuit power
(in per-unit). The second onshore grid model is the Nordic 32 test system, which is composed of 20 generators,
32 transmission and 22 distribution buses, for a total of 74 buses. Therefore, the following detailed models are
defined:
Level 1. Nordic 32 test system
Level 2. Equivalent single generator system, defined by the equivalent inertia constant and short circuit power.
Level 3. Thevenin equivalent defined by the considered short circuit power.
4.1.3 LEVEL OF DETAIL OF THE ON-SHORE MMC CONVERTER
In D2.1 Chapter 3, Component Models, 3.1.3 Simulation Models, an MMC model for EMT simulations is
described.
Level 1: MMC model including switching devices inner controls (capacitor voltage balance, circulating currents,
etc). This will correspond to a Type 4 model as defined by the Working Group B4.57.
Level 2: Averaged model, corresponding to a Type 5 model as defined by the Working Group B4.57.
Level 3: Assume dc-link voltage is perfectly controlled and substitute the MMC by a DC voltage source.
4.1.4 LEVEL OF DETAIL OF THE WIND TURBINE MODEL
Level 1: Detailed model comprising an aeroelastic model, generator, drive train, Machine Side Converter, Grid
Side Converter, filters, transformer and local loads, the corresponding controls (including Tower and Drive Train
Damping). It is the detailed generic type 4 WT model block diagram [Slootweg, 2004], [Akhmatov, 2006]
Level 2: Simplified quasi steady state aerodynamics, two mass mechanical generator, drive train, Machine Side
Converter, Grid Side Converter, filters, transformer and local loads, the corresponding controls (including Tower
and Drive Train Damping).
Level 3: Wind rotor, generator and turbine (including shaft + DTD + TD dynamics) are simplified as an
equivalent current source feeding to the dc link capacitor. It includes pitch-aerodynamics-drive train-generator
set as an equivalent transfer function, which in turn sets current input to the DC link.
Level 4: Perfect DC link control is assumed, so all mechanical, aerodynamic and DC link dynamics are
neglected. This model can be used for analysis of the grid side phenomenon. It is the simplified WT model with
grid side and power variation dynamics [Conroy, 2009].
WT power electronic converters can be modelled as either averaged models or detailed switched models. For
the considered test cases, averaged models are assumed unless stated otherwise.

PROJECT REPORT. Deliverable 3.2: Specifications of the control strategies and the simulation test cases
29
Local wind turbine loads will be modelled as equivalent resistors connected to the WT transformer low voltage
side.
4.2. NORMAL OPERATION
4.2.1 HVDC LINK AND OFF-SHORE AC-GRID START-UP OPERATION
The objective of the start procedure includes the energisation of all the off-shore system elements and all other
steps needed for the wind farm to start normal production, provided that enough transmission capability is
available.
Start-up procedure is controlled by the OWF-OTS Coordinator, which will send individual or multiple
energisation commands to the wind power plant controller, on-shore converter station controller, umbilical
transformer controller and the corresponding breakers.
A common energisation procedure will consist of (Seman, 2015):
1. On-shore converter station energisation.
2. HVDC cable energisation by the on-shore converter station. HVDC link voltage controlled by on-shore
converter station.
3. Energisation of umbilical transformer, cable and shunt compensation (BKUmb3 and BKUmb2 are closed).
4. Energisation of off-shore ac-grid cables (BKUmb1 is closed; SAC is active).
5. Energisation of selected WTs (transformer energisation and GSC de-blocking).
6. Wind turbines deliver reactive power and cooperate on off-shore ac-grid voltage control. Remaining
WTs are energised (breakers BKOWF x,y of remaining WTs are closed).
7. Diode rectifier station is energised (transformer + DRU; BKDRU1, BKDRU2 and BKDRU3 are closed).
8. WPP starts minimum power production (SAC DRSAC).
9. Energisation of DRU filter banks (BKACfilter1, BKACfilter2 and BKACfilter3 are closed).
10. WPP production ramped to full available power.
11. Umbilical cable is disconnected (BKUmb1 is opened; DRSAC DR).
12. Umbilical transformer and shunt reactors can be disconnected (BKUmb3 and BKUmb2 are opened).
The aforementioned procedure might take several minutes and some elements, such as the transformer tap
changer might take tens of minutes to operate. Therefore, the previous detailed connection procedure is
unsuitable for EMT simulations. However, some of the previous steps are not relevant for the validation of WT
and OWF controllers; therefore, a simplified connection procedure is defined:
1. On-shore converter station, HVDC cable, umbilical transformer, cable and shunt compensation are
assumed to be energised.
2. Off-shore ac-grid cables are energised (BKUmb1 is closed; SAC is active). Umbilical transformer tap
changer is fixed at its lowest voltage position.
PROJECT REPORT. Deliverable 3.2: Specifications of the control strategies and the simulation test cases
30
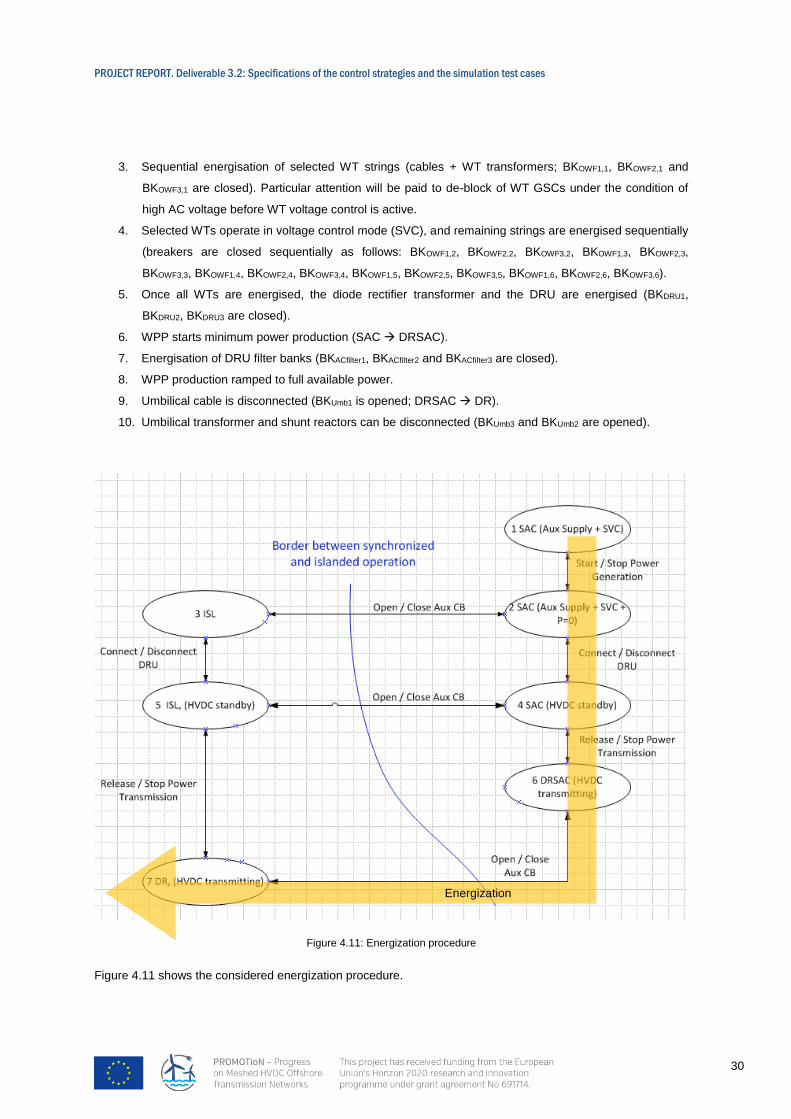
3. Sequential energisation of selected WT strings (cables + WT transformers; BKOWF1,1, BKOWF2,1 and
BKOWF3,1 are closed). Particular attention will be paid to de-block of WT GSCs under the condition of
high AC voltage before WT voltage control is active.
4. Selected WTs operate in voltage control mode (SVC), and remaining strings are energised sequentially
(breakers are closed sequentially as follows: BKOWF1,2, BKOWF2,2, BKOWF3,2, BKOWF1,3, BKOWF2,3,
BKOWF3,3, BKOWF1,4, BKOWF2,4, BKOWF3,4, BKOWF1,5, BKOWF2,5, BKOWF3,5, BKOWF1,6, BKOWF2,6, BKOWF3,6).
5. Once all WTs are energised, the diode rectifier transformer and the DRU are energised (BKDRU1,
BKDRU2, BKDRU3 are closed).
6. WPP starts minimum power production (SAC DRSAC).
7. Energisation of DRU filter banks (BKACfilter1, BKACfilter2 and BKACfilter3 are closed).
8. WPP production ramped to full available power.
9. Umbilical cable is disconnected (BKUmb1 is opened; DRSAC DR).
10. Umbilical transformer and shunt reactors can be disconnected (BKUmb3 and BKUmb2 are opened).
Figure 4.11: Energization procedure
Figure 4.11 shows the considered energization procedure.
Energization

PROJECT REPORT. Deliverable 3.2: Specifications of the control strategies and the simulation test cases
31
Please, note the described sequence might be modified by the OWF-OTS Coordinator if other sequencing is
deemed to be more adequate for a particular situation or installation. Hence other energization procedures
could be considered during the project. In any case, alternative energization procedures should meet the related
functional requirements of table 4.2.1.
4.2.1. HVDC LINK AND OFF-SHORE AC-GRID START-UP OPERATION
System Configuration Normal operation (SAC → DRSAC → DR)
Control hierarchy levels affected OWF-OTS coordinator, OWF controller, WT controller (OWF Group controller if used)
Related functional requirements (from D3.1)
3.3.2 Frequency Ranges 3.3.2.1 Standard Frequency Range 3.3.2.2 Optimized (narrow) Frequency range (DR only) 3.3.2.3 Rate of change of frequency 3.4.6 Minimum production limit 4.3.2 Reactive power capability
Methodology The considered functional requirements will be validated by means of EMT simulation.
Minimum simulation detail (maximum level of aggregation)
WT Level 4
OWF Level 1
On-shore MMC Level 2
On-shore grid Level 3
Case description
The start-up procedure included in the description is carried out. The complete system will be completely dis-energised and at the end of the procedure, the OWFs will be delivering their active power set-point through the DRU, with the auxiliary AC supply (umbilical) disconnected. MMC cell energisation will not be considered here.
Sensitivity analysis
Number of WT/strings connected (10 cases from 10% to 100% generated active power). Different active power set-points in each WT leading to 10 cases from minimum DRU production limit to 100% rated power.
Result assessment
For each one of the test, the functional requirements will be evaluated and a quantitative or qualitative result will be tabulated. In each case, quantitative and qualitative results will be compared with the considered functional requirements.
4.2.2 HVDC LINK AND OFF-SHORE AC-GRID DISCONNECTION OPERATION
This procedure takes place when there is no power production scheduled for a considerable time (either
because of no wind conditions or simply OTS decision). It is classified as an intended interruption and is the
opposite operation of start-up. The system starts energized and each OWF delivers its available wind power.
OTS gives the order to start disconnection operation and, at the end, the system should stay synchronized with
AC on shore grid, in order to keep auxiliary equipment of the OWF fed, waiting for available wind power. If
required, this operation can reach the full dis-energization of the AC-offshore grid and HVDC Link.

PROJECT REPORT. Deliverable 3.2: Specifications of the control strategies and the simulation test cases
32
A possible disconnection procedure consists of the following steps:
1. Umbilical transformer and shunt reactor are connected.
2. Umbilical cable is connected.
3. OWF production ramped down to a minimum power.
4. Disconnection of DRU filter banks.
5. OWF stops sending power.
6. Diode rectifier station is disconnected (transformer + DRU).
7. Wind turbines deliver reactive power and cooperate on off-shore ac-grid voltage control. Discharge of
WT transformers.
8. Progressive disconnection of WT arrays and off-shore AC cables.
9. Disconnection of umbilical transformer, cable and shunt compensation.
Please, note the described sequence might be modified by the OWF-OTS Coordinator if other sequencing is
deemed to be more adequate for a particular situation or installation. Hence other de-energization procedures
could be considered during the project. In any case, alternative de-energization procedures should meet the
related functional requirements of table 4.2.2.
4.2.2. HVDC LINK AND OFF-SHORE AC-GRID DISCONNECTION OPERATION
System Configuration Normal operation (DR → DRSAC → SAC)
Control hierarchy levels affected OWF-OTS Coordinator, OWF controller, WT controller (OWF Group controller if used).
Related functional requirements (from D3.1)
3.3.2 Frequency Ranges 3.3.2.1 Standard Frequency Range 3.3.2.2 Optimized (narrow) Frequency range (DR only) 3.3.2.3 Rate of change of frequency 3.4.6 Minimum production limit 4.3.2 Reactive power capabilities
Methodology The considered functional requirements will be validated by means of EMT simulation.
Minimum simulation detail (maximum level of aggregation)
WT Level 4
OWF Level 1
On-shore MMC Level 2
On-shore grid Level 3
Case description
The system will be completely energised, OWF working on their power tracking point and umbilical cable disconnected. At the end of the procedure, the off-shore system will remain energized through umbilical cable and all WTs disconnected waiting for available wind power.
Sensitivity analysis
Number of WT/strings connected (10 cases from 10% to 100% generated active power) Different active power set-points in each WT leading to 10 cases from minimum DRU production limit to 100% rated power.
Result assessment
For each one of the test, the functional requirements will be evaluated and a quantitative or qualitative result will be tabulated. In each case, quantitative and qualitative results will be compared with the considered functional requirements.
PROJECT REPORT. Deliverable 3.2: Specifications of the control strategies and the simulation test cases
33
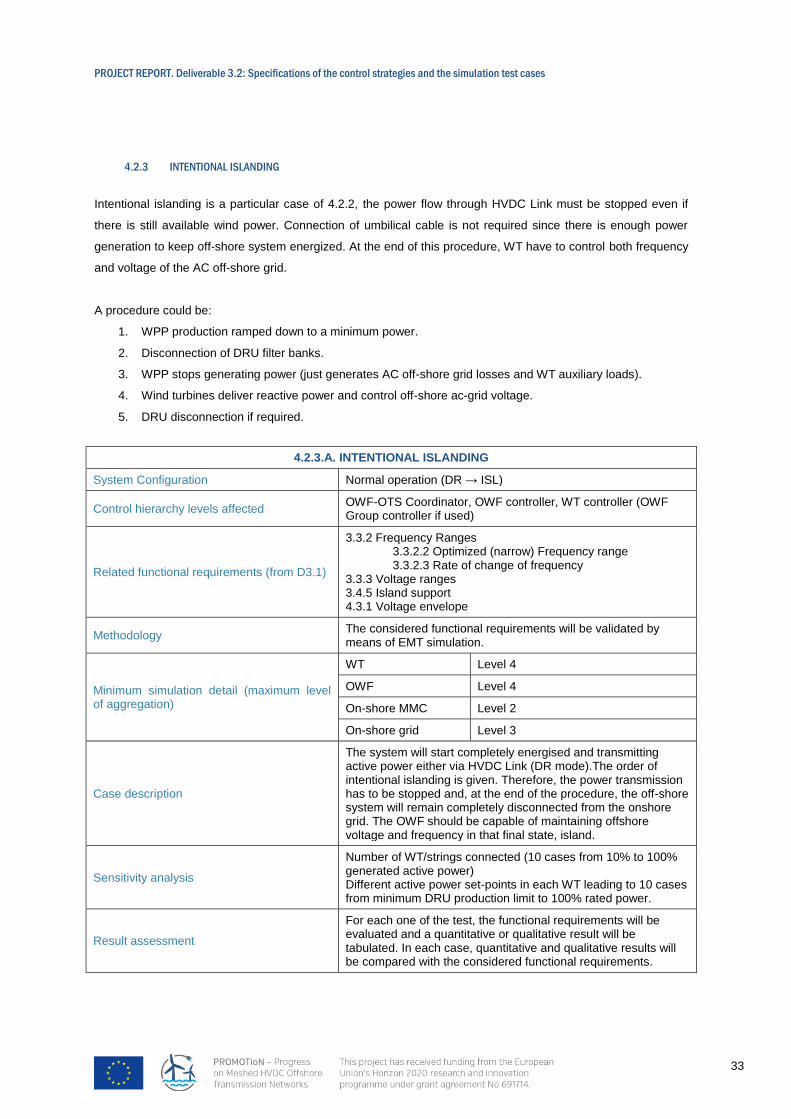
4.2.3 INTENTIONAL ISLANDING
Intentional islanding is a particular case of 4.2.2, the power flow through HVDC Link must be stopped even if
there is still available wind power. Connection of umbilical cable is not required since there is enough power
generation to keep off-shore system energized. At the end of this procedure, WT have to control both frequency
and voltage of the AC off-shore grid.
A procedure could be:
1. WPP production ramped down to a minimum power.
2. Disconnection of DRU filter banks.
3. WPP stops generating power (just generates AC off-shore grid losses and WT auxiliary loads).
4. Wind turbines deliver reactive power and control off-shore ac-grid voltage.
5. DRU disconnection if required.
4.2.3.A. INTENTIONAL ISLANDING
System Configuration Normal operation (DR → ISL)
Control hierarchy levels affected OWF-OTS Coordinator, OWF controller, WT controller (OWF Group controller if used)
Related functional requirements (from D3.1)
3.3.2 Frequency Ranges 3.3.2.2 Optimized (narrow) Frequency range 3.3.2.3 Rate of change of frequency 3.3.3 Voltage ranges 3.4.5 Island support 4.3.1 Voltage envelope
Methodology The considered functional requirements will be validated by means of EMT simulation.
Minimum simulation detail (maximum level of aggregation)
WT Level 4
OWF Level 4
On-shore MMC Level 2
On-shore grid Level 3
Case description
The system will start completely energised and transmitting active power either via HVDC Link (DR mode).The order of intentional islanding is given. Therefore, the power transmission has to be stopped and, at the end of the procedure, the off-shore system will remain completely disconnected from the onshore grid. The OWF should be capable of maintaining offshore voltage and frequency in that final state, island.
Sensitivity analysis
Number of WT/strings connected (10 cases from 10% to 100% generated active power) Different active power set-points in each WT leading to 10 cases from minimum DRU production limit to 100% rated power.
Result assessment
For each one of the test, the functional requirements will be evaluated and a quantitative or qualitative result will be tabulated. In each case, quantitative and qualitative results will be compared with the considered functional requirements.

PROJECT REPORT. Deliverable 3.2: Specifications of the control strategies and the simulation test cases
34
4.2.3.B. RE-SYNCHRONISATION TO EXTERNAL AC FROM ISL MODE
System Configuration Normal operation (ISL → SAC)
Control hierarchy levels affected OWF-OTS Coordinator, OWF controller, WT controller (OWF Group controller if used)
Related functional requirements (from D3.1)
3.3.2 Frequency Ranges
3.3.2.1 Standard Frequency Range
3.3.2.2 Optimized (narrow) Frequency range
3.3.2.3 Rate of change of frequency
3.3.3 Voltage ranges
3.4.5 Island support
4.3.1 Voltage envelope
Methodology The considered functional requirements will be validated by means of EMT simulation.
Minimum simulation detail (maximum level of aggregation)
WT Level 3
OWF Level 4
On-shore MMC Level 2
On-shore grid Level 3
Case description
The system will start in island mode controlling offshore grid
voltage and frequency. It should be possible to re-synchronise
with the onshore grid via umbilical, for example if there is no
longer available wind power. At the end of the procedure, the
system must remain synchronised with the external AC grid and
manage the active and reactive power flow through umbilical.
Sensitivity analysis Number of WT/strings connected (10 cases from 10% to 100%
generated active power)
Result assessment
For each one of the test, the functional requirements will be
evaluated and a quantitative or qualitative result will be
tabulated. In each case, quantitative and qualitative results will
be compared with the considered functional requirements.
4.2.4 DYNAMIC VOLTAGE CONTROL
This test case is proposed to validate the AC off-shore dynamic voltage control during SAC and ISL operation.
4.2.4. DYNAMIC VOLTAGE CONTROL
System Configuration Normal operation (SAC, ISL)
Control hierarchy levels affected OWF-OTS Coordinator, OWF controller, WT controller (OWF Group controller if used)

PROJECT REPORT. Deliverable 3.2: Specifications of the control strategies and the simulation test cases
35
Related functional requirements (from D3.1) 4.3.4 Dynamic voltage control
Methodology The considered functional requirements will be validated by means of EMT simulation.
Minimum simulation detail (maximum level of aggregation)
WT Level 4
OWF Level 7
On-shore MMC Level 3
On-shore grid Level 3
Case description
The system will start in island mode. Both voltage and frequency are controlled by the OWF. The voltage reference is changed within the normal voltage operation range and the response of the system shall meet the stated requirements. During SAC mode the OWF will operate in STATCOM mode to control the voltage of the off-shore ac-grid.
Sensitivity analysis
Number of WT/strings connected (10 cases from 10% to 100%) Different voltage set-point step-ups in OWF leading to 10 cases, from minimum normal operation voltage (90%) to DRU conduction voltage.
Result assessment
For each one of the test, the functional requirements will be evaluated and a quantitative or qualitative result will be tabulated. In each case, quantitative and qualitative results will be compared with the considered functional requirements.
4.2.5 WIND FARM POWER CONTROL AND POWER TRACKING
During normal operation, all OWFs are operational and the generated power is transmitted through the DRU
based HVDC connection. Individual WT should be able to control their independent active power reference,
which can either be generated locally or by the OWF controller. The OWF controller should be able to control
(limit) the power delivered by the individual wind farm to the DRU converter.
4.2.5.a. OPTIMAL POWER TRACKING WITH VARYING WIND
System Configuration Normal operation (DR)
Control hierarchy levels affected OWF-OTS Coordinator, OWF controller, WT controller (OWF Group controller if used)
Related functional requirements (from D3.1)
3.3.2 FREQUENCY RANGES 3.3.2.2 Optimized (narrow) Frequency range 3.3.2.3 Rate of change of frequency 3.3.3 VOLTAGE RANGES 3.4.1 ACTIVE POWER PRODUCTION 3.4.2.a STEADY STATE ACTIVE POWER CONTROL 3.4.3 DYNAMIC ACTIVE POWER CONTROL (Idem 4.1) 4.2.1 Frequency envelope (DR only) 4.2.2 Steady state frequency control (DR only) 4.2.3 Dynamic frequency control (DR only)
Methodology The considered functional requirements will be validated by means of EMT simulation.

PROJECT REPORT. Deliverable 3.2: Specifications of the control strategies and the simulation test cases
36
Minimum simulation detail (maximum level of aggregation)
WT Level 2
OWF Level 4
On-shore MMC Level 3
On-shore grid Not considered
Case description
Each WT model will be provided by a variable wind speed and corresponding active power reference. The equivalent wind speed sent to each WT model will follow a Kaimal distribution with a given average wind speed and turbulence intensity. The wind speeds for each WT model will not be correlated and wind farm layout effects will not be considered.
Sensitivity analysis
Number of WT/strings connected (10 cases from 10% to 100% generated active power) Wind speeds leading to 10 cases from 10% to 100% rated power.
Result assessment
For each one of the test cases, the functional requirements will be evaluated and a quantitative or qualitative result will be tabulated. In each case, quantitative and qualitative results will be compared with the considered functional requirements. Optimal power tracking error will also be evaluated and tabulated for each one of the considered cases. In each case, the quantitative and qualitative results will be compared with the related functional requirements.
4.2.5.b. CURTAILMENT SIGNAL TO LIMIT ACTIVE POWER PRODUCTION
System Configuration Normal operation (DR)
Control hierarchy levels affected OWF-OTS Coordinator, OWF controller, WT controller (OWF Group controller if used)
Related functional requirements (from D3.1)
3.3.2 FREQUENCY RANGES 3.3.2.2 Optimized (narrow) Frequency range 3.3.2.3 Rate of change of frequency 3.3.3 VOLTAGE RANGES 3.4.1 ACTIVE POWER PRODUCTION 3.4.2.a STEADY STATE ACTIVE POWER CONTROL 3.4.3 DYNAMIC ACTIVE POWER CONTROL (Idem 4.1) 4.2.1 Frequency envelope (DR only) 4.2.2 Steady state frequency control (DR only) 4.2.3 Dynamic frequency control (DR only)
Methodology The considered functional requirements will be validated by means of EMT simulation.
Minimum simulation detail (maximum level of aggregation)
WT Level 2
OWF Level 4
On-shore MMC Level 3
On-shore grid Not considered
Case description
The OWF controller is commanded to ramp down/up the active power delivered by the WTs. OWF controller sends the active power set-point command to individual WTs. It should not be assumed that the ramp up/down command sent from the OWF controller arrives to all the WTs at the same time.

PROJECT REPORT. Deliverable 3.2: Specifications of the control strategies and the simulation test cases
37
Sensitivity analysis
Number of WT/strings connected (10 cases from 10% to 100% generated active power) Active power variation: 10 cases from 10% to 100% rated power (10 up and down power steps). One additional case with the active power reference step changing from 100% to 2.5% and back.
Result assessment
For each one of the test cases, the functional requirements will be evaluated and a quantitative or qualitative result will be tabulated. In each case, quantitative and qualitative results will be compared with the considered functional requirements. Time to achieve reference power (10% to 90% criteria) will be evaluated and tabulated for each one of the considered cases. In each case, the quantitative and qualitative results will be compared with the related functional requirements.

PROJECT REPORT. Deliverable 3.2: Specifications of the control strategies and the simulation test cases
38
4.2.6 HARMONIC ANALYSIS / COMPLIANCE
Harmonic related test cases aim at ensuring that the control system does not contribute to voltage harmonic
contents beyond those specified in deliverable D3.1. Particular attention is paid to control-grid interaction with
long cables that might lead to large voltage and current resonance and to subsequent equipment disconnection.
Therefore, the considered test cases aim at both evaluating harmonic distortion compliance and preventing
resonance (small-signal stability).
Figure 4.12: Simplified equivalent diagram for harmonic and small signal stability studies

PROJECT REPORT. Deliverable 3.2: Specifications of the control strategies and the simulation test cases
39
Figure 4.12 shows the simplified equivalent diagram for harmonic and small signal stability studies. Each WT is
defined by its Norton equivalent, where Ihw is the harmonic current source (magnitude and phase), and Zw is
the WT Norton equivalent impedance. Frequency dependant cable impedance is represented by Zc. The DRU
is modelled also as a Norton equivalent, being ZDRU the total Norton impedance, considering transformers and
filters and IhDRU the equivalent harmonic current source.
Figure 4.12 shows a single OWF with a single DRU, however, the complete topology consisting of 3 OWFs and
3 DRU platforms should be considered for detailed harmonic studies. Moreover, for SAC or DRSAC system
configurations, the models of the AC umbilical cable, transformer and filters should also be considered.
METHODOLOGY
Both harmonic and small signal stability studies will use the frequency and operating point dependant Norton (or
Thevenin) models of all the system elements (WTs, cables, DRUs, umbilical cable, etc) (Kocewiak, 2013;
Kocewiak, 2015).
Whereas DRU, transformer and cable models are passive systems, WT harmonic models depend on the
particular control being used. As particular WT controls might not be accessible or accessible as black-box
models, closed loop harmonic models should be provided for different generation levels by the relevant
manufacturer/developer. EMT simulations might be used to validate the harmonic models by the manufacturer
or by other parties if black-box or detailed WT models are available. WT harmonic models should consider the
complete GSC WT control, GSC converter and GSC passive elements (filters, transformer, etc).
Harmonic models should be provided for relevant active and reactive power generation levels.
Currently IEC-61400-21 part II is being developed to provide recommendations and guidance to perform
harmonic emission assessments in WPPs. IEC-61400-21 will also include a procedure for WT harmonic model
development and validation. It is envisaged that the relevant IEC-61400-21 parts will be published during 2017.
Once they are published, this test case should be re-defined to take into account the aforementioned standards.
4.2.6.a EVALUATION OF HARMONIC DISTORTION COMPLIANCE (DR OPERATION)
System Configuration Normal operation (DR, SAC, DRSAC)
Control hierarchy levels affected WT controller
Related functional requirements (from D3.1) 3.5.2.2 HARMONIC COMPLIANCE
Methodology The considered functional requirements will be validated by using the harmonic models (Thevenin/Norton equivalents) of all the relevant system elements.
Minimum simulation detail (maximum level of aggregation)
WT Harmonic Thevenin/Norton equivalent
OWF Level 1
On-shore MMC Not considered
On-shore grid Not considered
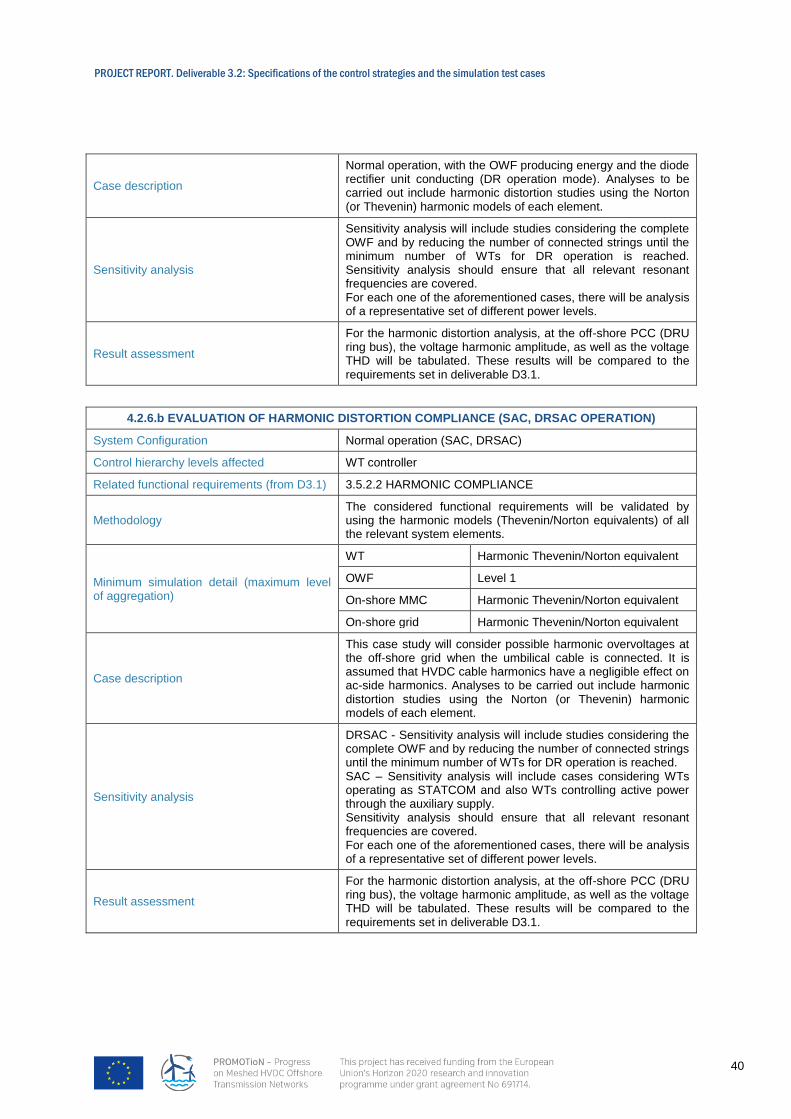
PROJECT REPORT. Deliverable 3.2: Specifications of the control strategies and the simulation test cases
40
Case description
Normal operation, with the OWF producing energy and the diode rectifier unit conducting (DR operation mode). Analyses to be carried out include harmonic distortion studies using the Norton (or Thevenin) harmonic models of each element.
Sensitivity analysis
Sensitivity analysis will include studies considering the complete OWF and by reducing the number of connected strings until the minimum number of WTs for DR operation is reached. Sensitivity analysis should ensure that all relevant resonant frequencies are covered. For each one of the aforementioned cases, there will be analysis of a representative set of different power levels.
Result assessment
For the harmonic distortion analysis, at the off-shore PCC (DRU ring bus), the voltage harmonic amplitude, as well as the voltage THD will be tabulated. These results will be compared to the requirements set in deliverable D3.1.
4.2.6.b EVALUATION OF HARMONIC DISTORTION COMPLIANCE (SAC, DRSAC OPERATION)
System Configuration Normal operation (SAC, DRSAC)
Control hierarchy levels affected WT controller
Related functional requirements (from D3.1) 3.5.2.2 HARMONIC COMPLIANCE
Methodology The considered functional requirements will be validated by using the harmonic models (Thevenin/Norton equivalents) of all the relevant system elements.
Minimum simulation detail (maximum level of aggregation)
WT Harmonic Thevenin/Norton equivalent
OWF Level 1
On-shore MMC Harmonic Thevenin/Norton equivalent
On-shore grid Harmonic Thevenin/Norton equivalent
Case description
This case study will consider possible harmonic overvoltages at the off-shore grid when the umbilical cable is connected. It is assumed that HVDC cable harmonics have a negligible effect on ac-side harmonics. Analyses to be carried out include harmonic distortion studies using the Norton (or Thevenin) harmonic models of each element.
Sensitivity analysis
DRSAC - Sensitivity analysis will include studies considering the complete OWF and by reducing the number of connected strings until the minimum number of WTs for DR operation is reached. SAC – Sensitivity analysis will include cases considering WTs operating as STATCOM and also WTs controlling active power through the auxiliary supply. Sensitivity analysis should ensure that all relevant resonant frequencies are covered. For each one of the aforementioned cases, there will be analysis of a representative set of different power levels.
Result assessment
For the harmonic distortion analysis, at the off-shore PCC (DRU ring bus), the voltage harmonic amplitude, as well as the voltage THD will be tabulated. These results will be compared to the requirements set in deliverable D3.1.

PROJECT REPORT. Deliverable 3.2: Specifications of the control strategies and the simulation test cases
41
4.2.4.c SMALL-SIGNAL STABILITY (DR OPERATION)
System Configuration Normal operation (DR)
Control hierarchy levels affected WT controller
Related functional requirements (from D3.1) 3.5.2.2 HARMONIC COMPLIANCE
Methodology
Small stability studies will be carried out by computing the loop impedances as seen from relevant elements for the significant wind farm configurations. Phase and gain margins will be calculated for each considered configuration. For cases with the smallest phase and gain margin, EMT studies might be carried out to verify the results obtained by impedance analysis.
Minimum simulation detail (maximum level of aggregation)
WT Harmonic Thevenin/Norton equivalent
OWF Level 1
On-shore MMC Not considered
On-shore grid Not considered
Case description Normal operation, with the OWF producing energy and the diode rectifier unit conducting (DR operation mode) off-shore AC grid shall remain stable regardless of number of connected WT.
Sensitivity analysis
Sensitivity analysis will include studies considering the complete OWF and by reducing the number of connected strings until the minimum number of WTs for DR operation is reached. For each one of the aforementioned cases, there will be analysis of a representative set of different power levels.
Result assessment
For the small signal stability studies, the gain and phase margin of each considered case will be obtained to ensure an adequate phase and gain margins (PM>30deg and GM>3dB), for each one of the aforementioned cases (Kocewiak 2013).
4.2.4.d SMALL-SIGNAL STABILITY (SAC, DRSAC OPERATION)
System Configuration Normal operation (SAC, DRSAC)
Control hierarchy levels affected WT controller
Related functional requirements (from D3.1) 3.5.2.2 HARMONIC COMPLIANCE
Methodology
Small stability studies will be carried out by computing the loop impedances as seen from relevant elements for the significant wind farm configurations. Phase and gain margins will be calculated for each considered configuration. For cases with the smallest phase and gain margin, EMT studies might be carried out to verify the results obtained by impedance analysis.
Minimum simulation detail (maximum level of aggregation)
WT Harmonic Thevenin/Norton equivalent
OWF Level 1
On-shore MMC Harmonic Thevenin/Norton equivalent
On-shore grid Harmonic Thevenin/Norton equivalent
Case description Two configurations are considered SAC and DRSAC. In both cases, the auxiliary supply cable is connected.
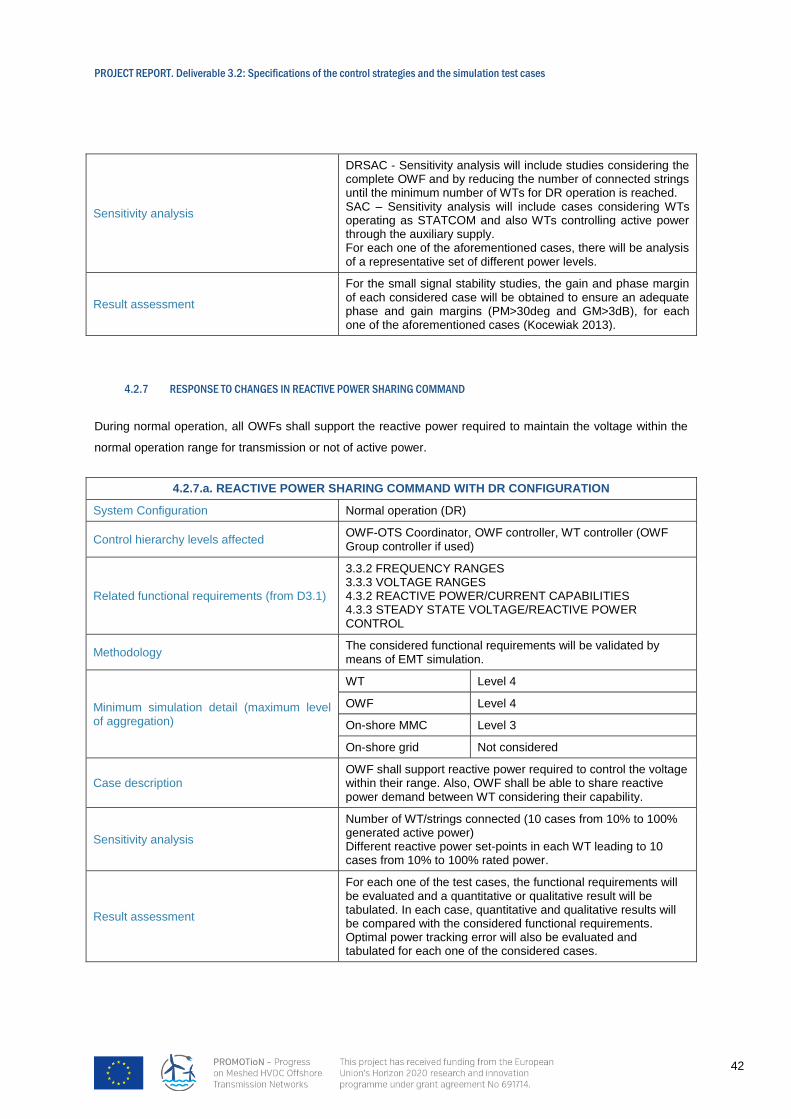
PROJECT REPORT. Deliverable 3.2: Specifications of the control strategies and the simulation test cases
42
Sensitivity analysis
DRSAC - Sensitivity analysis will include studies considering the complete OWF and by reducing the number of connected strings until the minimum number of WTs for DR operation is reached. SAC – Sensitivity analysis will include cases considering WTs operating as STATCOM and also WTs controlling active power through the auxiliary supply. For each one of the aforementioned cases, there will be analysis of a representative set of different power levels.
Result assessment
For the small signal stability studies, the gain and phase margin of each considered case will be obtained to ensure an adequate phase and gain margins (PM>30deg and GM>3dB), for each one of the aforementioned cases (Kocewiak 2013).
4.2.7 RESPONSE TO CHANGES IN REACTIVE POWER SHARING COMMAND
During normal operation, all OWFs shall support the reactive power required to maintain the voltage within the
normal operation range for transmission or not of active power.
4.2.7.a. REACTIVE POWER SHARING COMMAND WITH DR CONFIGURATION
System Configuration Normal operation (DR)
Control hierarchy levels affected OWF-OTS Coordinator, OWF controller, WT controller (OWF Group controller if used)
Related functional requirements (from D3.1)
3.3.2 FREQUENCY RANGES 3.3.3 VOLTAGE RANGES 4.3.2 REACTIVE POWER/CURRENT CAPABILITIES 4.3.3 STEADY STATE VOLTAGE/REACTIVE POWER CONTROL
Methodology The considered functional requirements will be validated by means of EMT simulation.
Minimum simulation detail (maximum level of aggregation)
WT Level 4
OWF Level 4
On-shore MMC Level 3
On-shore grid Not considered
Case description OWF shall support reactive power required to control the voltage within their range. Also, OWF shall be able to share reactive power demand between WT considering their capability.
Sensitivity analysis
Number of WT/strings connected (10 cases from 10% to 100% generated active power) Different reactive power set-points in each WT leading to 10 cases from 10% to 100% rated power.
Result assessment
For each one of the test cases, the functional requirements will be evaluated and a quantitative or qualitative result will be tabulated. In each case, quantitative and qualitative results will be compared with the considered functional requirements. Optimal power tracking error will also be evaluated and tabulated for each one of the considered cases.

PROJECT REPORT. Deliverable 3.2: Specifications of the control strategies and the simulation test cases
43
4.2.7.b. REACTIVE POWER SHARING COMMAND ISL CONFIGURATION
System Configuration Normal operation (ISL)
Control hierarchy levels affected OWF-OTS Coordinator, OWF controller, WT controller (OWF Group controller if used)
Related functional requirements (from D3.1)
3.3.2 FREQUENCY RANGES 3.3.3 VOLTAGE RANGES 4.3.2 REACTIVE POWER/CURRENT CAPABILITIES 4.3.3 STEADY STATE VOLTAGE/REACTIVE POWER CONTROL
Methodology The considered functional requirements will be validated by means of EMT simulation.
Minimum simulation detail (maximum level of aggregation)
WT Level 4
OWF Level 4
On-shore MMC Level 3
On-shore grid Not considered
Case description
OWF shall support reactive power required to maintain the voltage within their range when active power is not being transmitted. Besides, OWF shall be able to share reactive power between WTs according to WT in operation and its limitations.
Sensitivity analysis
Number of WT/strings connected (10 cases from 10% to 100% generated active power) Different reactive power set-points in each WT leading to 10 cases from 10% to 100% rated power.
Result assessment
For each one of the test cases, the functional requirements will be evaluated and a quantitative or qualitative result will be tabulated. In each case, quantitative and qualitative results will be compared with the considered functional requirements. Optimal power tracking error will also be evaluated and tabulated for each one of the considered cases. In each case, the quantitative and qualitative results will be compared with the related functional requirements.
4.2.8 RESPONSE TO ACTIVE POWER REFERENCE COMMANDS WHEN CONNECTED TO EXTERNAL AC
When the system is synchronized with an external AC, it should be possible to control the active and reactive
power flow through the external AC link. The system will start synchronized with an external AC grid and the
active/reactive power references will vary within the nominal range. The system should react to that variation
keeping all magnitudes in normal operating range.
4.2.8. RESPONSE TO POWER REFERENCE COMMAND WHEN CONNECTED TO EXTERNAL AC
System Configuration Normal operation (DRSAC, SAC)
Control hierarchy levels affected OWF-OTS Coordinator, OWF controller, WT controller (OWF Group controller if used)
Related functional requirements (from D3.1)
3.3.2 FREQUENCY RANGES 3.3.2.1 Standard Frequency Range 3.3.2.3 Rate of change of frequency 3.3.3 VOLTAGE RANGES 3.4.2.(b or c) STEADY STATE ACTIVE POWER CONTROL 3.4.3 DYNAMIC ACTIVE POWER CONTROL (Idem 4.1)

PROJECT REPORT. Deliverable 3.2: Specifications of the control strategies and the simulation test cases
44
Methodology The considered functional requirements will be validated by means of EMT simulation.
Minimum simulation detail (maximum level of aggregation)
WT Level 3
OWF Level 4
On-shore MMC Level 2
On-shore grid Level 3
Case description The system will start synchronized and transmitting active power to the on-shore AC grid via umbilical cable and via HVDC link. New active power references will be set.
Sensitivity analysis Wind speeds leading to 10 cases from 10% to 100% rated power.
Result assessment
For each one of the test, the functional requirements will be evaluated and a quantitative or qualitative result will be tabulated. In each case, quantitative and qualitative results will be compared with the considered functional requirements.
4.2.9 DISCONNECTION / RECONNECTION OF A STRING / OWF
OWF shall be able to disconnect or reconnect WTs, strings of WTs or an OWF when their power production
decrease or increase (it can be caused for wind speed conditions or for maintenance conditions). System shall
remain stable complying frequency and voltage requirements.
4.2.9.a. CONNECTION OF A WT / STRING / OWF
System Configuration Normal operation (ISL, SAC, DR, DRSAC)
Control hierarchy levels affected OWF-OTS Coordinator, OWF controller, WT controller (OWF Group controller if used)
Related functional requirements (from D3.1) 3.3.2 FREQUENCY RANGES 3.3.3 VOLTAGE RANGES
Methodology The considered functional requirements will be validated by means of EMT simulation.
Minimum simulation detail (maximum level of aggregation)
WT Level 4
OWF Level 3
On-shore MMC Level 2
On-shore grid Level 3
Case description
WTs (a WT, string or cluster) shall be able to synchronize with off-shore AC grid before it will be connected. After connection, WTs shall increase its active power transmission to its optimal production.
Sensitivity analysis Number of WT/strings connected (10 cases from 10% to 100% generated active power)
Result assessment
For each one of the test cases, the functional requirements will be evaluated and a quantitative or qualitative result will be tabulated. In each case, quantitative and qualitative results will be compared with the considered functional requirements. Optimal power tracking error will also be evaluated and tabulated for each one of the considered cases.

PROJECT REPORT. Deliverable 3.2: Specifications of the control strategies and the simulation test cases
45
4.2.9.b. DISCONNECTION OF A WT / STRING / OWF
System Configuration Normal operation (ISL, SAC, DR, DRSAC)
Control hierarchy levels affected OWF-OTS Coordinator, OWF controller, WT controller (OWF Group controller if used)
Related functional requirements (from D3.1) 3.3.2 FREQUENCY RANGES 3.3.3 VOLTAGE RANGES
Methodology The considered functional requirements will be validated by means of EMT simulation.
Minimum simulation detail (maximum level of aggregation)
WT Level 4
OWF Level 3
On-shore MMC Level 2
On-shore grid Level 3
Case description
WTs (a WT, string or cluster) shall decrease power production to 0 before disconnection. Then WTs shall carry out the disconnection. System shall remain stable complying with voltage and frequency requirements. be able to synchronize with off-shore AC grid before it will be connected. After connection, WTs shall increase its active power transmission to its optimal production.
Sensitivity analysis Number of WT/strings connected (10 cases from 10% to 100% generated active power)
Result assessment
For each one of the test cases, the functional requirements will be evaluated and a quantitative or qualitative result will be tabulated. In each case, quantitative and qualitative results will be compared with the considered functional requirements. Optimal power tracking error will also be evaluated and tabulated for each one of the considered cases.
4.2.10 OPERATION WITH REDUCED NUMBER OF DRUS
Some events result in the permanent disconnection of a single DRU, such as off-shore faults clearance or DRU
platform maintenance tasks. Although this situation makes clearly impossible to transmit power via the DRU
under consideration, the whole OWF power flow via others DRU cannot be compromised.
Therefore, the disconnection of a single DRU, owing to any intended or unintended event, should lead to
another normal operation point with its pertinent power transmission limitation.
The disconnection of DRU is not taken into account as it is not part of the normal operation. The DRU
reconfiguration test is provided in Fault ride through operation (see 4.3.1.5).
4.2.10. OPERATION WITH A REDUCED NUMBER OF DRUS
System Configuration Normal operation (ISL, DR or SAC, DRSAC)
Control hierarchy levels affected OWF-OTS Coordinator, OWF controller, WT controller (OWF Group controller if used)
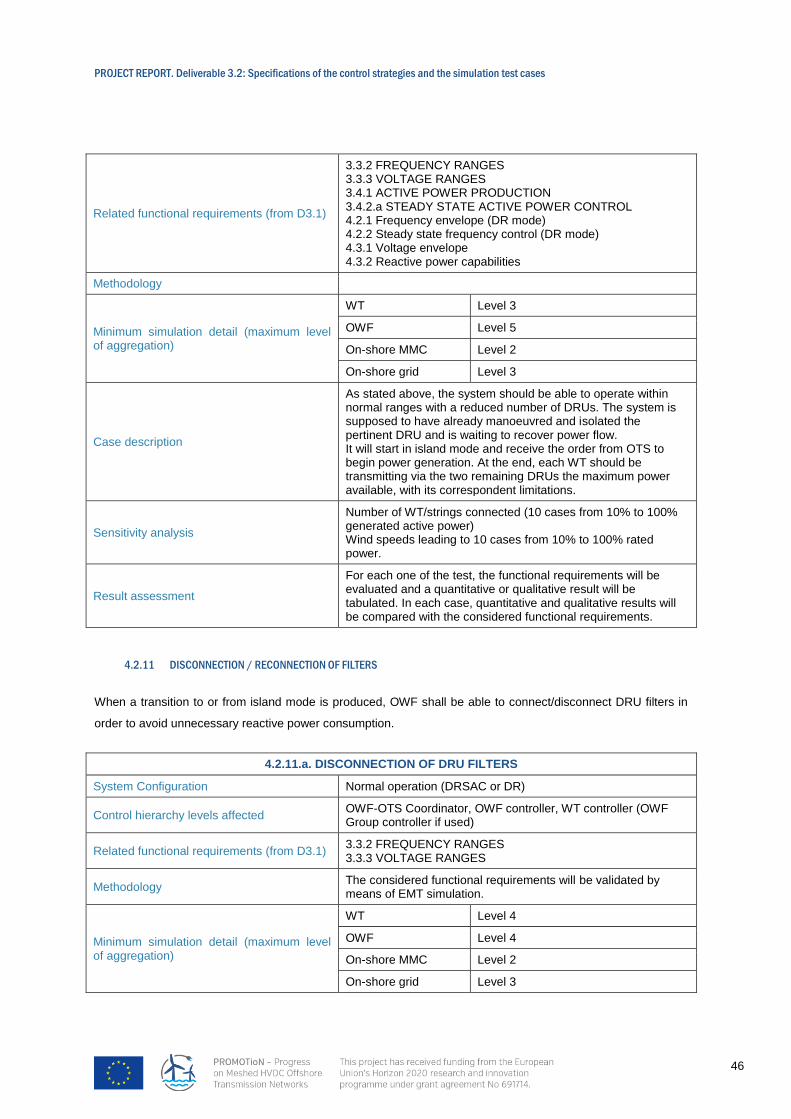
PROJECT REPORT. Deliverable 3.2: Specifications of the control strategies and the simulation test cases
46
Related functional requirements (from D3.1)
3.3.2 FREQUENCY RANGES 3.3.3 VOLTAGE RANGES 3.4.1 ACTIVE POWER PRODUCTION 3.4.2.a STEADY STATE ACTIVE POWER CONTROL 4.2.1 Frequency envelope (DR mode) 4.2.2 Steady state frequency control (DR mode) 4.3.1 Voltage envelope 4.3.2 Reactive power capabilities
Methodology
Minimum simulation detail (maximum level of aggregation)
WT Level 3
OWF Level 5
On-shore MMC Level 2
On-shore grid Level 3
Case description
As stated above, the system should be able to operate within normal ranges with a reduced number of DRUs. The system is supposed to have already manoeuvred and isolated the pertinent DRU and is waiting to recover power flow. It will start in island mode and receive the order from OTS to begin power generation. At the end, each WT should be transmitting via the two remaining DRUs the maximum power available, with its correspondent limitations.
Sensitivity analysis
Number of WT/strings connected (10 cases from 10% to 100% generated active power) Wind speeds leading to 10 cases from 10% to 100% rated power.
Result assessment
For each one of the test, the functional requirements will be evaluated and a quantitative or qualitative result will be tabulated. In each case, quantitative and qualitative results will be compared with the considered functional requirements.
4.2.11 DISCONNECTION / RECONNECTION OF FILTERS
When a transition to or from island mode is produced, OWF shall be able to connect/disconnect DRU filters in
order to avoid unnecessary reactive power consumption.
4.2.11.a. DISCONNECTION OF DRU FILTERS
System Configuration Normal operation (DRSAC or DR)
Control hierarchy levels affected OWF-OTS Coordinator, OWF controller, WT controller (OWF Group controller if used)
Related functional requirements (from D3.1) 3.3.2 FREQUENCY RANGES 3.3.3 VOLTAGE RANGES
Methodology The considered functional requirements will be validated by means of EMT simulation.
Minimum simulation detail (maximum level of aggregation)
WT Level 4
OWF Level 4
On-shore MMC Level 2
On-shore grid Level 3
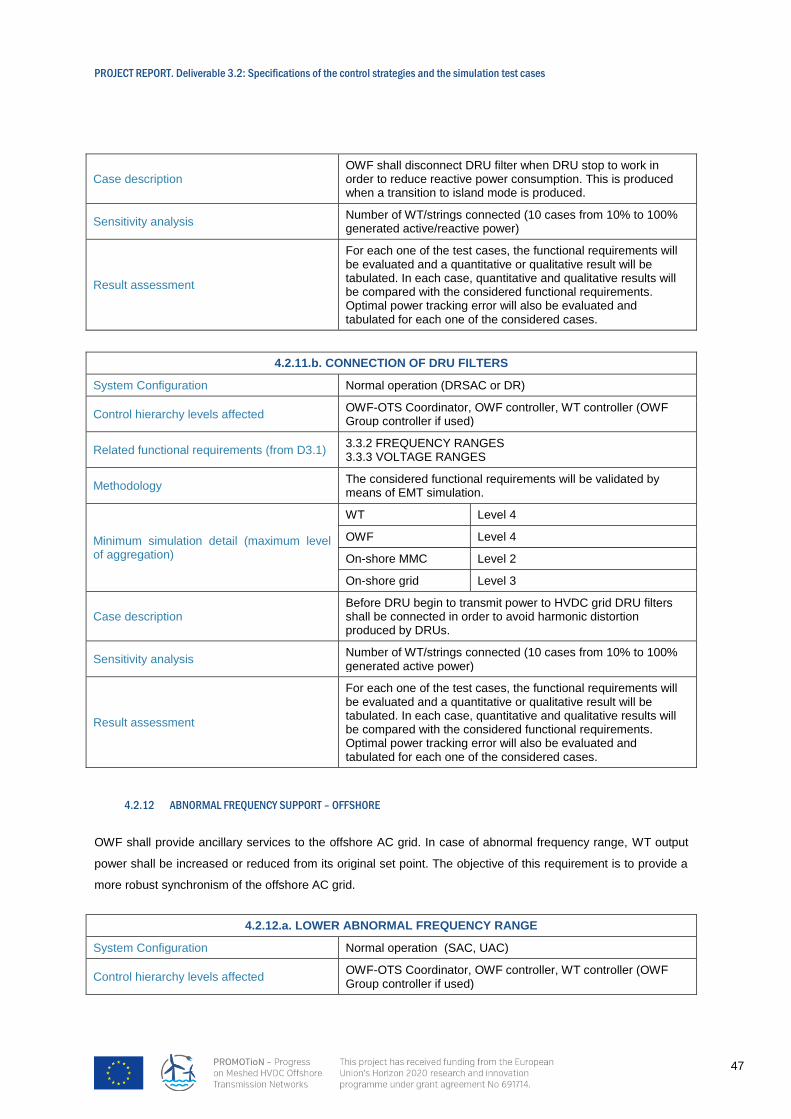
PROJECT REPORT. Deliverable 3.2: Specifications of the control strategies and the simulation test cases
47
Case description OWF shall disconnect DRU filter when DRU stop to work in order to reduce reactive power consumption. This is produced when a transition to island mode is produced.
Sensitivity analysis Number of WT/strings connected (10 cases from 10% to 100% generated active/reactive power)
Result assessment
For each one of the test cases, the functional requirements will be evaluated and a quantitative or qualitative result will be tabulated. In each case, quantitative and qualitative results will be compared with the considered functional requirements. Optimal power tracking error will also be evaluated and tabulated for each one of the considered cases.
4.2.11.b. CONNECTION OF DRU FILTERS
System Configuration Normal operation (DRSAC or DR)
Control hierarchy levels affected OWF-OTS Coordinator, OWF controller, WT controller (OWF Group controller if used)
Related functional requirements (from D3.1) 3.3.2 FREQUENCY RANGES 3.3.3 VOLTAGE RANGES
Methodology The considered functional requirements will be validated by means of EMT simulation.
Minimum simulation detail (maximum level of aggregation)
WT Level 4
OWF Level 4
On-shore MMC Level 2
On-shore grid Level 3
Case description Before DRU begin to transmit power to HVDC grid DRU filters shall be connected in order to avoid harmonic distortion produced by DRUs.
Sensitivity analysis Number of WT/strings connected (10 cases from 10% to 100% generated active power)
Result assessment
For each one of the test cases, the functional requirements will be evaluated and a quantitative or qualitative result will be tabulated. In each case, quantitative and qualitative results will be compared with the considered functional requirements. Optimal power tracking error will also be evaluated and tabulated for each one of the considered cases.
4.2.12 ABNORMAL FREQUENCY SUPPORT – OFFSHORE
OWF shall provide ancillary services to the offshore AC grid. In case of abnormal frequency range, WT output
power shall be increased or reduced from its original set point. The objective of this requirement is to provide a
more robust synchronism of the offshore AC grid.
4.2.12.a. LOWER ABNORMAL FREQUENCY RANGE
System Configuration Normal operation (SAC, UAC)
Control hierarchy levels affected OWF-OTS Coordinator, OWF controller, WT controller (OWF Group controller if used)

PROJECT REPORT. Deliverable 3.2: Specifications of the control strategies and the simulation test cases
48
Related functional requirements (from D3.1) 4.2.4 LOWER ABNORMAL FREQUENCY SUPPORT 4.2.6 PROTECTION LIMITS
Methodology The considered functional requirements will be validated by means of EMT simulation.
Minimum simulation detail (maximum level of aggregation)
WT Level 4
OWF Level 4
On-shore MMC Level 4
On-shore grid Level 3
Case description
OWF starts synchronized either to the onshore AC grid (SAC) or external offshore AC grid (UAC). At a certain moment, the frequency of the grid under consideration will decrease below the nominal value. OWF shall react increasing its output power set point instantaneously. Further researches will set the relationship between frequency trip and output power set point deviation.
Sensitivity analysis
Number of WT/strings connected (10 cases from 10% to 100% generated active power). 3 different frequency trips to validate lower protection limits (see Table 4.2 on D3.1): 49.75 Hz, 49.60 Hz and 49.00 Hz
Result assessment
For each one of the test cases, the functional requirements will be evaluated and a quantitative or qualitative result will be tabulated. In each case, quantitative and qualitative results will be compared with the considered functional requirements.
4.2.12.b. UPPER ABNORMAL FREQUENCY RANGE
System Configuration Normal operation (SAC, UAC)
Control hierarchy levels affected OWF-OTS Coordinator, OWF controller, WT controller (OWF Group controller if used)
Related functional requirements (from D3.1) 4.2.5 UPPER ABNORMAL FREQUENCY SUPPORT 4.2.6 PROTECTION LIMITS
Methodology The considered functional requirements will be validated by means of EMT simulation.
Minimum simulation detail (maximum level of aggregation)
WT Level 4
OWF Level 4
On-shore MMC Level 4
On-shore grid Level 3
Case description
OWF starts synchronized either to the onshore AC grid (SAC) or external offshore AC grid (UAC). At a certain moment, the frequency of the grid under consideration will increase above the nominal value. OWF shall react decreasing its output power set point instantaneously. Further researches will stablish the relation between frequency trip and output power set point deviation.
Sensitivity analysis
Number of WT/strings connected (10 cases from 10% to 100% generated active power). 3 different frequency trips to validate upper protection limits (see Table 4.2 on D3.2): 50.25 Hz, 50.40 Hz and 51.00 Hz

PROJECT REPORT. Deliverable 3.2: Specifications of the control strategies and the simulation test cases
49
Result assessment
For each one of the test cases, the functional requirements will be evaluated and a quantitative or qualitative result will be tabulated. In each case, quantitative and qualitative results will be compared with the considered functional requirements.
4.3. FAULT RIDE THROUGH AND PROTECTION
4.3.1 UNINTENDED TRANSMISSION CAPABILITY LIMITATION
During an event which causes unintended transmission capability limitation, the system should be protected to
avoid any damage to equipment. Appropriate system control also needs to be in place to ensure maximum
power transmission and fast system recovery. In some cases, the offshore wind power could be continuously
transferred through the DRU-HVDC but with limited capacity, depending on the specific fault types (symmetrical
AC faults, asymmetrical AC faults, pole-to-pole DC faults, pole-to-ground faults, etc.).
4.3.1.1 ON-SHORE GRID FAULTS (SYMMETRICAL AND ASYMMETRICAL)/ COMPLIANCE OF ON-SHORE PCC GRID CODES
During an onshore AC fault, as shown in Figure 4-13, the onshore MMC can still fully control the AC current and
does not suffer significant fault current. However, the transmission capability of the MMC would be limited due
to the decrease of the AC grid voltage. If the imported energy from the offshore AC grid to the HVDC link
through the DRUs is greater than the maximum power that can be exported by the MMC, the DC voltage of the
HVDC link and the MMC submodule capacitors will be charged by the power surplus and could be over the
rated value. To avoid the system overvoltage and ride-through the onshore grid faults, the imported energy from
the WF to the HVDC link needs to be reduced as soon as possible during a close AC fault. The MMC needs to
provide proper reactive power to support the onshore AC grid during the fault and meet the requirements of
PCC grid code. After the onshore grid fault is cleared, full power transmission from offshore WF can be quickly
resumed.
During an asymmetrical onshore AC fault, the AC terminal voltage of the MMC is unbalanced. In addition to
controlling the positive sequence component, some control of negative sequence components might be
required.
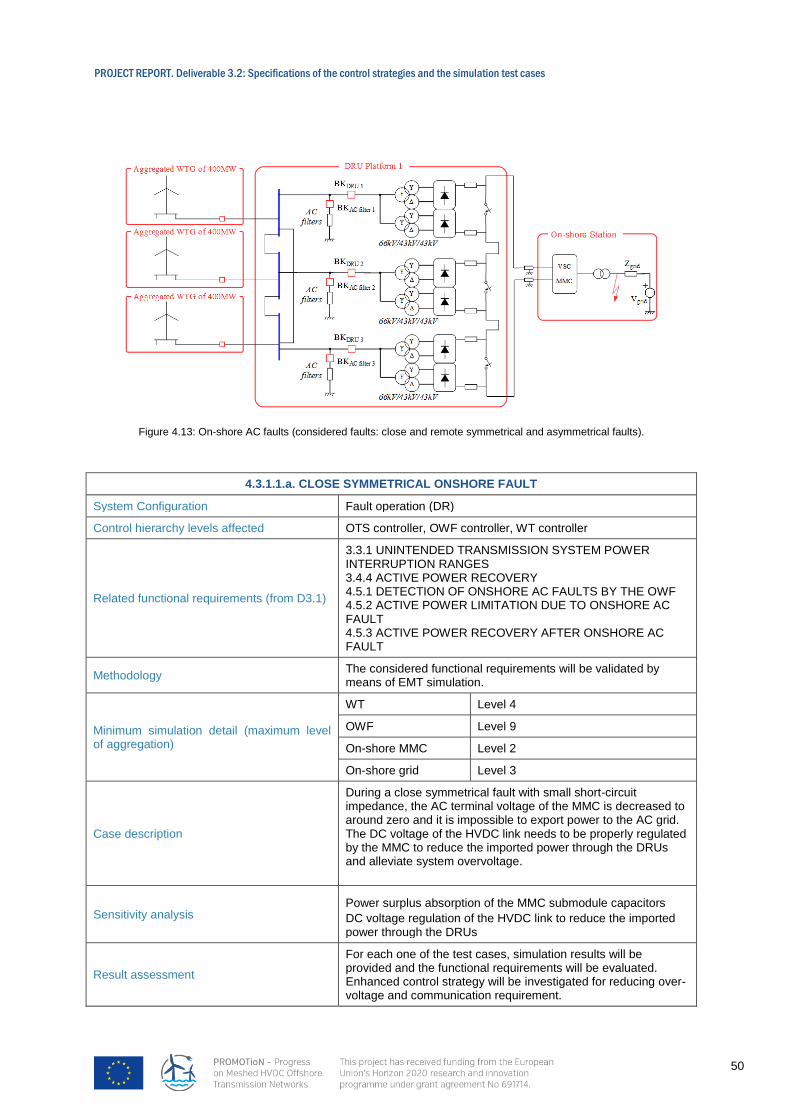
PROJECT REPORT. Deliverable 3.2: Specifications of the control strategies and the simulation test cases
50
Figure 4.13: On-shore AC faults (considered faults: close and remote symmetrical and asymmetrical faults).
4.3.1.1.a. CLOSE SYMMETRICAL ONSHORE FAULT
System Configuration Fault operation (DR)
Control hierarchy levels affected OTS controller, OWF controller, WT controller
Related functional requirements (from D3.1)
3.3.1 UNINTENDED TRANSMISSION SYSTEM POWER INTERRUPTION RANGES 3.4.4 ACTIVE POWER RECOVERY 4.5.1 DETECTION OF ONSHORE AC FAULTS BY THE OWF 4.5.2 ACTIVE POWER LIMITATION DUE TO ONSHORE AC FAULT 4.5.3 ACTIVE POWER RECOVERY AFTER ONSHORE AC FAULT
Methodology The considered functional requirements will be validated by means of EMT simulation.
Minimum simulation detail (maximum level of aggregation)
WT Level 4
OWF Level 9
On-shore MMC Level 2
On-shore grid Level 3
Case description
During a close symmetrical fault with small short-circuit impedance, the AC terminal voltage of the MMC is decreased to around zero and it is impossible to export power to the AC grid. The DC voltage of the HVDC link needs to be properly regulated by the MMC to reduce the imported power through the DRUs and alleviate system overvoltage.
Sensitivity analysis Power surplus absorption of the MMC submodule capacitors
DC voltage regulation of the HVDC link to reduce the imported power through the DRUs
Result assessment
For each one of the test cases, simulation results will be provided and the functional requirements will be evaluated. Enhanced control strategy will be investigated for reducing over-voltage and communication requirement.

PROJECT REPORT. Deliverable 3.2: Specifications of the control strategies and the simulation test cases
51
4.3.1.1.b. REMOTE SYMMETRICAL ONSHORE FAULT
System Configuration Fault operation (DR)
Control hierarchy levels affected OTS controller, OWF controller, WT controller
Related functional requirements (from D3.1)
3.3.1 UNINTENDED TRANSMISSION SYSTEM POWER INTERRUPTION RANGES 3.4.4 ACTIVE POWER RECOVERY 4.5.1 DETECTION OF ONSHORE AC FAULTS BY THE OWF 4.5.2 ACTIVE POWER LIMITATION DUE TO ONSHORE AC FAULT 4.5.3 ACTIVE POWER RECOVERY AFTER ONSHORE AC FAULT
Methodology The considered functional requirements will be validated by means of EMT simulation.
Minimum simulation detail (maximum level of aggregation)
WT Level 4
OWF Level 9
On-shore MMC Level 2
On-shore grid Level 3
Case description
During a remote symmetrical fault with significant short-circuit impedance, considerable AC terminal voltage is still available at the MMC terminal. Thus, the power transfer should be continued and controlled in the range of the remaining capacity of the MMC, which is in proportional to the remaining AC grid voltage.
Sensitivity analysis
If the pre-fault imported power from the DRUs is less than the remaining capacity of the MMC, the power transmission needs to remain unchanged after the remote fault, which is achieved by increasing the MMC AC currents. If the pre-fault imported power from the DRUs is more than the remaining capacity of the MMC, the power surplus will lead to the rise of the HVDC link DC voltage. The imported power from the offshore WF needs to be limited in a similar way as in 4.3.1.1.a. The enhanced control needs to ensure seamless transfer between the aforementioned fault conditions.
Result assessment For each one of the test cases, simulation results will be provided and the functional requirements will be evaluated. Enhanced control strategy will be investigated.
4.3.1.1.c. ASYMMETRICAL ONSHORE AC FAULT
System Configuration Fault operation (DR)
Control hierarchy levels affected OTS controller, OWF controller, WT controller
Related functional requirements (from D3.1)
3.3.1 UNINTENDED TRANSMISSION SYSTEM POWER INTERRUPTION RANGES 3.4.4 ACTIVE POWER RECOVERY 4.5.1 DETECTION OF ONSHORE AC FAULTS BY THE OWF 4.5.2 ACTIVE POWER LIMITATION DUE TO ONSHORE AC FAULT 4.5.3 ACTIVE POWER RECOVERY AFTER ONSHORE AC FAULT

PROJECT REPORT. Deliverable 3.2: Specifications of the control strategies and the simulation test cases
52
Methodology The considered functional requirements will be validated by means of EMT simulation.
Minimum simulation detail (maximum level of aggregation)
WT Level 4
OWF Level 9
On-shore MMC Level 2
On-shore grid Level 3
Case description
During an asymmetrical onshore AC fault, the AC terminal voltage of the MMC is unbalanced. In addition to the positive sequence component, the negative sequence components also need to be properly controlled (e.g. for suppressing power oscillation). The energy balancing (i.e. submodules per arm, upper and lower arms, and phase-to-phase) is also required to ensure satisfactory operation of the MMC under asymmetrical AC fault conditions.
Sensitivity analysis Close fault with negligible short-circuit impedance Remote fault with significant short-circuit impedance
Result assessment For each one of the test cases, simulation results will be provided and the functional requirements will be evaluated.
4.3.1.2 DC-CABLE FAULTS
After the pole-to-pole DC fault, the DC voltage of HVDC link is significantly reduced and the power transmission
is terminated. The offshore front-end VSCs of wind turbines are operated with maximum output currents and
provide fault currents to enable fault detection. In addition, fast restart capability is remained after the fault is
eliminated. As the full-bridge (FB) submodules can generate negative voltage, the FB based onshore MMC can
be operated during the fault to control the submodule capacitor voltages at the rated value and thus remain the
fast restart capability after fault isolation. Alternatively, the offshore VSCs and the onshore MMC can be blocked
after the fault detection.
The reaction of the DRU based wind power transmission system depends on the ground arrangements.
Note pole-to-pole faults are unlikely in separated submarine cables, as pole-to-ground faults will happen first.
However, pole-to-pole faults might appear at the converter terminals and are more serious than the pole-to-
ground fault in the point of view of wind energy transfer due to the significant reduction of the HVDC link voltage.

PROJECT REPORT. Deliverable 3.2: Specifications of the control strategies and the simulation test cases
53
Figure 4.14: HVDC faults (considered faults: pole-to-pole, pole-to-ground).
4.3.1.2.a. POLE-TO-POLE DC FAULT
System Configuration Fault operation (DR)
Control hierarchy levels affected OTS controller, OWF controller, WT controller
Related functional requirements (from D3.1)
4.2.6 PROTECTION LIMITS 4.4.1 OFFSHORE FAULT-RIDE-THROUGH 4.4.2 OFFSHORE AC FAULT CURRENT INJECTION 4.4.3 OFFSHORE AC FAULT RECOVERY 4.6. DC FAULT REQUIREMENTS
Methodology The considered functional requirements will be validated by means of EMT simulation.
Minimum simulation detail (maximum level of aggregation)
WT Level 4
OWF Level 9
On-shore MMC Level 2
On-shore grid Level 3
Case description
After a pole-to-pole fault applied at the DC cable, the FB based onshore MMC remain operational with d-axis current regulated at around zero to avoid oscillation after fault isolation. Due to the reduction of the DC voltage, the FB submodules are required to output negative voltage. The offshore VSCs are operated with maximum current output.
Sensitivity analysis Different fault locations will be tested, i.e. pole-to-pole DC fault at the terminal of MMC, pole-to-pole DC fault at the terminal of DRUs.
Result assessment For each one of the test cases, simulation results will be provided and the functional requirements will be evaluated.
4.3.1.2.b. POLE-TO-GROUND DC CABLE FAULT
Operation states (operation modes) Fault operation (DR)
Control functions (Control hierarchy levels) OTS controller, OWF controller, WT controller

PROJECT REPORT. Deliverable 3.2: Specifications of the control strategies and the simulation test cases
54
Related functional requirements (from D3.1)
4.2.6 PROTECTION LIMITS 4.4.1 OFFSHORE FAULT-RIDE-THROUGH 4.4.2 OFFSHORE AC FAULT CURRENT INJECTION 4.4.3 OFFSHORE AC FAULT RECOVERY 4.6. DC FAULT REQUIREMENTS
Methodology The considered functional requirements will be validated by means of EMT simulation.
Minimum simulation detail (maximum level of aggregation)
WT Level 4
OWF Level 9
On-shore MMC Level 2
On-shore grid Level 3
Case description
A pole-to-ground fault is applied at the DC cable of the symmetric monopole HVDC structure, where only the grid-side of the transformer is grounded. The DC voltage of the faulty pole reduces to around zero while the health pole will suffer overvoltage.
Sensitivity analysis Different fault locations will be tested, i.e. pole-to-ground DC fault at the terminal of MMC, pole-to- ground DC fault at the terminal of DRUs.
Result assessment For each one of the test cases, simulation results will be provided and the functional requirements will be evaluated.
4.3.1.3 DRU + DRU TRANSFORMER FAULTS
After an internal fault of a DRU is detected, as shown in Figure 4-15, the uncontrolled HVDC rectifier needs to
be reconfigured to continuously transfer wind power using the other healthy DRUs. The faulty DRU is bypassed
and the HVDC link will operate with reduced DC voltage, that is reduced by the onshore MMCs.
Figure 4.15: DRU faults.

PROJECT REPORT. Deliverable 3.2: Specifications of the control strategies and the simulation test cases
55
4.3.1.4. INTERNAL DRU FAULT
System Configuration Fault operation (DR)
Control hierarchy levels affected OTS controller, OWF controller, WT controller
Related functional requirements (from D3.1) 3.4.7 UNINTENDED TRANSMISSION SYSTEM LIMIT 4.2.6 PROTECTION LIMITS
Methodology The considered functional requirements will be validated by means of EMT simulation.
Minimum simulation detail (maximum level of aggregation)
WT Level 4
OWF Level 9
On-shore MMC Level 1
On-shore grid Level 3
Case description
After an internal fault is applied at a DRU, the faulty DRU is bypassed by bypass switches and thus the energy can still be transferred through the else healthy DRUs. The AC side of the faulty DRU is disconnected from the offshore AC grid by circuit breakers to avoid fault propagation. The onshore MMC regulates the DC voltage at a reduced value due to the out of service of the faulty DRU, where the full-bridge submodules need to generate negative voltage to meet the requirements of the AC current control.
Sensitivity analysis Different pre-fault active power set-points of wind farm will be tested, i.e. rated power operation, 50% power operation, and 10% power operation.
Result assessment For each one of the test cases, simulation results will be provided and the functional requirements will be evaluated.
4.3.2 UMBILICAL / AUXILIARY AC FAULTS
During start up, the umbilical AC cables can be used to energize the offshore AC grid, which is connected to the
onshore AC grid via the auxiliary AC cable for a short period of time. After the offshore wind park is energized,
the wind turbines start to support the offshore AC grid. Following the stabilization of the offshore AC voltage, the
umbilical AC cables can be disconnected and the system is ready for power transfer though the DRU based
HVDC link.
If the umbilical AC cables are connected to the WF and a fault occurs on the cable, as shown in Figure 4-16,
the offshore AC voltage is reduced and DRU will temporarily lose power transmission capability. Once the faulty
cable is isolated, the WT GSCs need to control the offshore AC system to resume power generation and
transmission through the DRU.

PROJECT REPORT. Deliverable 3.2: Specifications of the control strategies and the simulation test cases
56
Figure 4.16: Umbilical AC cale fault (considdered faults: symmetrical and asymmetrical AC faults in differents points of cable)
4.3.2. UMBILICAL AC CABLE FAULT
System Configuration Fault operation (SAC)
Control hierarchy levels affected OTS controller, OWF controller, WT controller
Related functional requirements (from D3.1) 4.4.1 OFFSHORE FAULT-RIDE-THROUGH 4.4.2 OFFSHORE AC FAULT CURRENT INJECTION 4.4.3 OFFSHORE AC FAULT RECOVERY
Methodology The considered functional requirements will be validated by means of EMT simulation.
Minimum simulation detail (maximum level of aggregation)
WT Level 4
OWF Level 9
On-shore MMC Level 2
On-shore grid Level 3
Case description
An AC fault is applied at the umbilical AC cable, which cause the offshore AC grid voltage to drop. The GSCs go into current limit operation and after the faulty umbilical AC cable being isolated, the WT GSCs need re-establish the offshore AC system and restart power generation and transmission.
Sensitivity analysis Symmetrical AC fault at 5 different cable points. Asymmetrical AC fault at 5 different cable points.
Result assessment For each one of the test cases, simulation results will be provided and the functional requirements will be evaluated.
4.3.3 OWF AC GRID FAULTS (SYMMETRICAL AND ASYMMETRICAL)
After a fault on the offshore AC grid, the WT GSCs need to provide adequate fault currents to enable fault
detection for the protection relays and isolate the faulty branch. After isolating the faulty branches, the healthy
parts can continue to operate. Due to the unidirectional characteristics of the DRUs, the offshore AC grid fault is
expected to have limited influence on the operation of the onshore MMCs.

PROJECT REPORT. Deliverable 3.2: Specifications of the control strategies and the simulation test cases
57
Figure 4.17: Off-shore AC faults (considered faults: symmetrical and asymmetrical in diferent locations of off-shore AC grid
(before AC filters, between two WT)).
4.3.3.a. SYMMETRICAL OFFSHORE AC FAULT
System Configuration Fault operation (DR)
Control hierarchy levels affected OTS controller, OWF controller, WT controller
Related functional requirements (from D3.1) 4.4.1 OFFSHORE FAULT-RIDE-THROUGH 4.4.2 OFFSHORE AC FAULT CURRENT INJECTION 4.4.3 OFFSHORE AC FAULT RECOVERY
Methodology The considered functional requirements will be validated by means of EMT simulation.
Minimum simulation detail (maximum level of aggregation)
WT Level 4
OWF Level 3
On-shore MMC Level 2
On-shore grid Level 3
Case description
In the event of a symmetrical fault at the offshore AC grid, the wind turbines provide adequate fault currents to ensure the circuit breakers on the faulty branch can be opened to isolate the fault and thus the healthy parts can be continuously operated to transfer wind energy. The wind turbine converters on the faulty branch may be blocked after the fault isolation.
Sensitivity analysis Different fault locations within a string Faults at the DRU transformer terminals Faults at the DRU ring cables
Result assessment For each one of the test cases, simulation results will be provided and the functional requirements will be evaluated.

PROJECT REPORT. Deliverable 3.2: Specifications of the control strategies and the simulation test cases
58
4.3.3.b. ASYMMETRICAL OFFSHORE AC FAULT
System Configuration Fault operation (DR)
Control hierarchy levels affected OTS controller, OWF controller, WT controller
Related functional requirements (from D3.1) 4.4.1 OFFSHORE FAULT-RIDE-THROUGH 4.4.2 OFFSHORE AC FAULT CURRENT INJECTION 4.4.3 OFFSHORE AC FAULT RECOVERY
Methodology The considered functional requirements will be validated by means of EMT simulation.
Minimum simulation detail (maximum level of aggregation)
WT Level 4
OWF Level 3
On-shore MMC Level 2
On-shore grid Level 3
Case description
In the evet of an asymmetrical fault at the offshore AC grid, the wind turbines provide adequate fault currents (both positive and negative sequence) to ensure the circuit breakers on the faulty branch are opened to isolate the fault and thus the healthy parts can be continuously operated to transfer wind energy. The wind turbine converters on the faulty branch may be blocked after the fault isolation.
Sensitivity analysis Different fault locations within a string Faults at the DRU transformer terminals Faults at the DRU ring cables
Result assessment For each one of the test cases, simulation results will be provided and the functional requirements will be evaluated.

PROJECT REPORT. Deliverable 3.2: Specifications of the control strategies and the simulation test cases
59
4.4. ANCILLARY SERVICES
While providing ancillary services to the onshore grid, the OWF (group) should also be able to disconnect or
reconnect WTs, strings of WTs or an OWF, as explained in Section 4.2.9.
4.4.1 ONSHORE FREQUENCY SUPPORT
4.4.1.a. PRIMARY FREQUENCY RESPONSE (PFR) BASED ON RESERVED POWER
System Configuration Normal operation mode (DR configuration with continuous conduction)
Control hierarchy levels affected OWF-OTS Coordinator, OWF Group, OWF, WT
Related functional requirements (from D3.1) 4.7.1 FREQUENCY RESPONSE PROCESSING 4.7.2 FREQUENCY RESPONSE ACTIVATION 4.7.3 FREQUENCY RESPONSE PARAMETERISATION
Methodology The considered functional requirements will be validated by means of EMT simulations. (RMS simulations might be used if deemed sufficient).
Minimum simulation detail (maximum level of aggregation)
WT Level 4
OWF Level 9
On-shore MMC Level 2
On-shore grid Level 3
Case description
The OWF (group) production is curtailed preventively, to provide an active power reserve of 10%. Over- and under- frequency events of different magnitudes are generated in the onshore grid. The OWF (group) detects a frequency event and produces the corresponding PFR.
Sensitivity analysis Low, medium and high wind speeds: 10%, 50% and 90% of nominal active power output before the frequency event.
Result assessment
For each test, the functional requirements will be tested and a quantitative or qualitative result (e.g., PFR times and magnitude) will be tabulated. In each case, the quantitative and qualitative results will be compared with the related functional requirements.
4.4.1.b. FAST FREQUENCY RESPONSE (FFR) BASED ON KINETIC ENERGY
System Configuration Normal operation mode (DR configuration with continuous conduction)
Control hierarchy levels affected OWF-OTS Coordinator, OWF Group, OWF, WT
Related functional requirements (from D3.1) 4.7.4 SYNTHETIC INERTIA
Methodology The considered functional requirements will be validated by means of EMT simulations.
Minimum simulation detail (maximum level of aggregation)
WT Level 4
OWF Level 9
On-shore MMC Level 2
On-shore grid Level 3
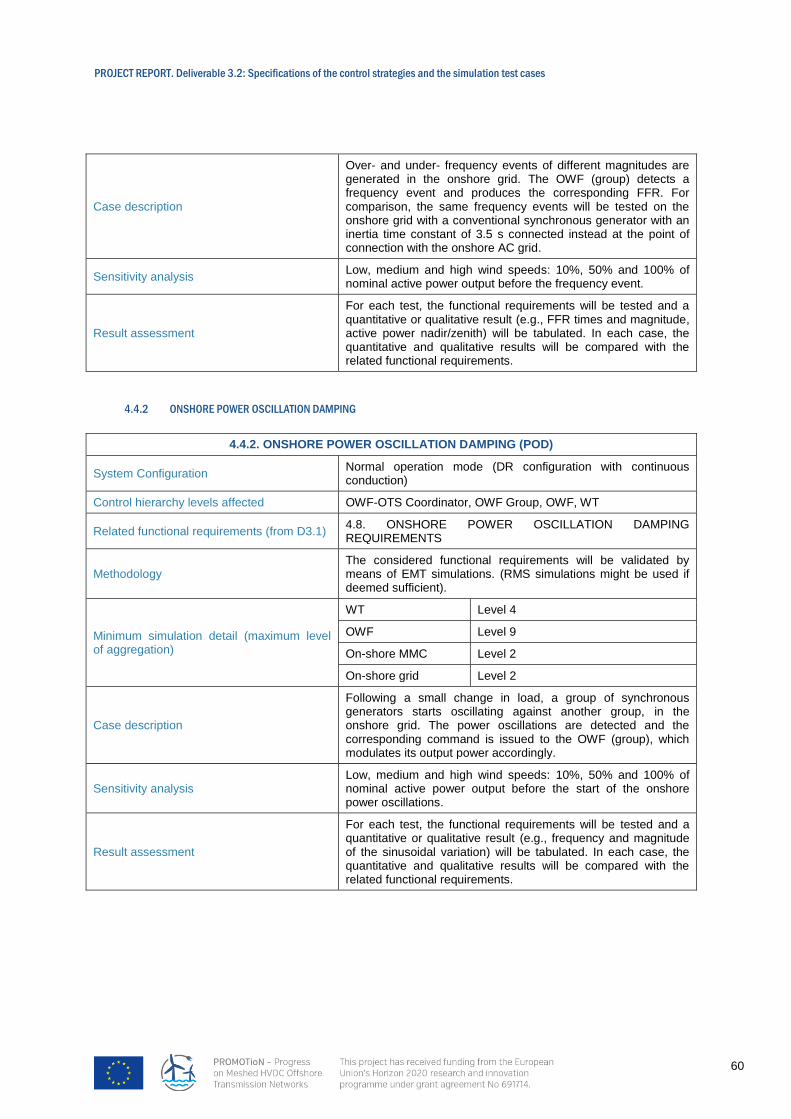
PROJECT REPORT. Deliverable 3.2: Specifications of the control strategies and the simulation test cases
60
Case description
Over- and under- frequency events of different magnitudes are generated in the onshore grid. The OWF (group) detects a frequency event and produces the corresponding FFR. For comparison, the same frequency events will be tested on the onshore grid with a conventional synchronous generator with an inertia time constant of 3.5 s connected instead at the point of connection with the onshore AC grid.
Sensitivity analysis Low, medium and high wind speeds: 10%, 50% and 100% of nominal active power output before the frequency event.
Result assessment
For each test, the functional requirements will be tested and a quantitative or qualitative result (e.g., FFR times and magnitude, active power nadir/zenith) will be tabulated. In each case, the quantitative and qualitative results will be compared with the related functional requirements.
4.4.2 ONSHORE POWER OSCILLATION DAMPING
4.4.2. ONSHORE POWER OSCILLATION DAMPING (POD)
System Configuration Normal operation mode (DR configuration with continuous conduction)
Control hierarchy levels affected OWF-OTS Coordinator, OWF Group, OWF, WT
Related functional requirements (from D3.1) 4.8. ONSHORE POWER OSCILLATION DAMPING REQUIREMENTS
Methodology The considered functional requirements will be validated by means of EMT simulations. (RMS simulations might be used if deemed sufficient).
Minimum simulation detail (maximum level of aggregation)
WT Level 4
OWF Level 9
On-shore MMC Level 2
On-shore grid Level 2
Case description
Following a small change in load, a group of synchronous generators starts oscillating against another group, in the onshore grid. The power oscillations are detected and the corresponding command is issued to the OWF (group), which modulates its output power accordingly.
Sensitivity analysis Low, medium and high wind speeds: 10%, 50% and 100% of nominal active power output before the start of the onshore power oscillations.
Result assessment
For each test, the functional requirements will be tested and a quantitative or qualitative result (e.g., frequency and magnitude of the sinusoidal variation) will be tabulated. In each case, the quantitative and qualitative results will be compared with the related functional requirements.

PROJECT REPORT. Deliverable 3.2: Specifications of the control strategies and the simulation test cases
61
5. SUMMARY OF TEST CASES
5.1. TEST CASES FOR NORMAL OPERATION
4.2.1. HVDC LINK AND OFF-SHORE AC-GRID START-UP OPERATION
4.2.2. HVDC LINK AND OFF-SHORE AC-GRID DISCONNECTION OPERATION
4.2.3.A. INTENTIONAL ISLANDING
4.2.3.B. RE-SYNCHRONISATION TO EXTERNAL AC FROM ISL MODE
4.2.4. DYNAMIC VOLTAGE CONTROL
4.2.5.A. OPTIMAL POWER TRACKING WITH VARYING WIND
4.2.5.B. CURTAILMENT SIGNAL TO LIMIT ACTIVE POWER PRODUCTION
4.2.6.A EVALUATION OF HARMONIC DISTORTION COMPLIANCE (DR OPERATION)
4.2.6.b EVALUATION OF HARMONIC DISTORTION COMPLIANCE (SAC, DRSAC OPERATION)
4.2.4.c SMALL-SIGNAL STABILITY (DR OPERATION)
4.2.4.d SMALL-SIGNAL STABILITY (SAC, DRSAC OPERATION)
4.2.7.A. REACTIVE POWER SHARING COMMAND WITH DR
4.2.7.B. REACTIVE POWER SHARING COMMAND ISL CONFIGURATION
4.2.8. RESPONSE TO POWER REFERENCE COMMAND WHEN
4.2.9.A. CONNECTION OF A WT / STRING / OWF
4.2.9.B. DISCONNECTION OF A WT / STRING / OWF
4.2.10. OPERATION WITH A REDUCED NUMBER OF DRUS
4.2.11.A. DISCONNECTION OF DRU FILTERS
4.2.11.B. CONNECTION OF DRU FILTERS
4.2.12.a. LOWER ABNORMAL FREQUENCY RANGE
4.2.12.b. UPPER ABNORMAL FREQUENCY RANGE
5.2. TEST CASES FOR FAULT RIDE THROUGH AND PROTECTION
4.3.1.1.A. CLOSE SYMMETRICAL ONSHORE FAULT
4.3.1.1.B. REMOTE SYMMETRICAL ONSHORE FAULT
4.3.1.1.C. ASYMMETRICAL ONSHORE AC FAULT
4.3.1.2.A. POLE-TO-POLE DC FAULT
4.3.1.2.B. POLE-TO-GROUND DC CABLE FAULT
4.3.1.4. INTERNAL DRU FAULT
4.3.2. UMBILICAL AC CABLE FAULT
4.3.3.A. SYMMETRICAL OFFSHORE AC FAULT
4.3.3.B. ASYMMETRICAL OFFSHORE AC FAULT
5.3. TEST CASES FOR ANCILLARY SERVICES
4.4.1.A. PRIMARY FREQUENCY RESPONSE (PFR) BASED ON RESERVED POWER
4.4.1.B. FAST FREQUENCY RESPONSE (FFR) BASED ON KINETIC ENERGY
4.4.2. ONSHORE POWER OSCILLATION DAMPING (POD)

PROJECT REPORT. Deliverable 3.2: Specifications of the control strategies and the simulation test cases
5.4. RELATION BETWEEN TEST CASES AND REQUIREMENTS FROM DELIVERABLE D3.1
3.3 3.4 3.5 4.1
4.2 4.3. 4.4 4.5 4.6
4.7 4.8
1 2 3 1 2 3 4 5 6 7 1 2 1 2 3 4 5 6 7 1 2 3 4 1 2 3 1 2 3 1 2 3 4
4.2.1. X X X X
4.2.2. X
X
X
X
4.2.3.a. X X
X
X X
X X
4.2.3.b. X X
X
X X
X X
4.2.4.
X
4.2.5.a. X X X X X
X X X X
X
4.2.5.b. X X X X X
X X X X
X
4.2.6.a.
X X
4.2.6.b.
X X
4.2.6.c. X
4.2.6.d. X
4.2.7.a. X X
X X
4.2.7.b. X X
X X
X X
4.2.8. X X
X X
X
4.2.9.a. X X
4.2.9.b. X X
4.2.10. X X X X
X X
X X
4.2.11.a. X X
4.2.11.b. X X
4.2.12.a. X X
4.2.12.b. X X
4.3.1.1.a. X X X X X
4.3.1.1.b. X
X
X X X
4.3.1.1.c. X
X
X X X
4.3.1.2. X
X
4.3.1.3.a.
X
X X X
X
4.3.1.3.b.
X
X X X
X
4.3.1.4.
X
X
4.3.2.
X X X
4.3.3.a.
X X X
4.3.3.b.
X X X
4.4.1.a. X X X
4.4.1.b.
X
4.4.2. X

PROJECT REPORT. Deliverable 3.2: Specifications of the control strategies and the simulation test cases
63
6. BIBLIOGRAPHY
ENTSO-E. 2015. ‘ENTSO-E NC HVDC’. https://www.entsoe.eu/Documents/Network%20codes%20documents/NC%20HVDC/EC%20Re gulation%20%28EU%29%202016%201447%20HVDC%20network%20code.pdf.
ENTSO-E. 2016. ‘ENTSO-E, NC RfG’. http://eur-lex.europa.eu/legal-
content/EN/TXT/PDF/?uri=CELEX:32016R0631&from=EN. G. C. Tarnowski. 2011. ‘Coordinated Frequency Control of Wind Turbines in Power Systems with High
Wind Power Penetration’. Technical University of Denmark, Roskilde, Denmark. Hydro-Québec TransÉnergie. 2009. ‘Transmission Provider Technical Requirements for the Connection of
Power Plants to the Hydro-Québec Transmission System’. L. Zeni. 2015. ‘Power System Integration of VSC-HVDC Connected Wind Power Plants, Control
Principles, Power System Services, Clustering of Wind Power Plants’. Roskilde, Denmark: Technical University of Denmark.
L. Zeni, R. Eriksson, S. Goumalatsos, M. Altin, P. Sørensen, A. Hansen, P. Kjær, and B. Hesselbæk.
2016. ‘Power Oscillation Damping From VSC–HVDC Connected Offshore Wind Power Plants’. IEEE Transactions on Power Delivery 31 (2): 829–38. doi:10.1109/TPWRD.2015.2427878.
National Grid Electricity Transmission. 2016. ‘Grid Code – Issue 5, Revision 17’. WP3, Promotion. 2016. ‘Deliverable 3.1: Detailed Functional Requirements to WPPs’. Muljadi, E., C. P. Butterfield, A. Ellis, J. Mechenbier, J. Hochheimer, R. Young, N. Miller, R. Delmerico, R.
Zavadil, and J. C. Smith. 2006. “Equivalencing the Collector System of a Large Wind Power Plant.” In 2006 IEEE Power Engineering Society General Meeting, 9 pp.-. doi:10.1109/PES.2006.1708945.
Ł. H. Kocewiak, J. Hjerrild, and C. Leth Bak, “Wind Turbine Converter Control Interaction with Complex
Wind Farm Systems,” IET Renewable Power Generation, Vol. 7, No. 4, 2013. Ł. H. Kocewiak, C. Álvarez, P. Muszynski, J. Cassoli, L. Shuai, “Wind Turbine Harmonic Model and Its
Application – Overview, Status and Outline of the New IEC Technical Report,” in Proc. The 14th International Workshop on Large-Scale Integration of Wind Power into Power Systems as well as Transmission Networks for Offshore Wind Farms, Energynautics GmbH, 20-22 October 2015, Brussels, Belgium.
S. Seman, R. Zurowski, C. Taratoris “Interconnection of Advanced Type 4 WTGs with Diode Rectifier
Based HVDC Solution and Weak AC Grids”, in Proc. The 14th International Workshop on Large-Scale Integration of Wind Power into Power Systems as well as Transmission Networks for Offshore Wind Farms, Energynautics GmbH, 20-22 October 2015, Brussels, Belgium.
S. Seman, «Modeling of the Diode-Rectifier Based HVDC Transmission Solution for Large Offshore Wind
Power Plants Grid Access», en International Workshop on Large-Scale Integration of Wind Power into Power Systems as well as on Transmission Networks for Offshore Wind Power Plants, Vienna, Austria, 2016.
V. Akhmatov, "Modelling and fault ride ‐through of wind turbines with permanent magnet generators."
Wind Energy 9.4 (2006): 313-326. Slootweg, J. G., et al. "General model for representing variable speed wind turbines in power system
dynamics simulations." IEEE Transactions on power systems 18.1 (2003): 144-151.

PROJECT REPORT. Deliverable 3.2: Specifications of the control strategies and the simulation test cases
64
Conroy, J., and R. Watson. "Aggregate modelling of wind farms containing full-converter wind turbine generators with permanent magnet synchronous machines: transient stability studies." IET
I. Andrade, Ramon Blasco-Gimenez & R. Pena, 2015. Distributed Control Strategy for a Wind Generation
Systems based on PMSG with Uncontrolled Rectifier HVDC Connection. In Proc. of ICIT 2015. 2015 IEEE International Conference on Industrial Technology. Seville, pp. 982–986.
Blasco-Gimenez, R. et al., 2010. Distributed Voltage and Frequency Control of Offshore Wind Farms
Connected With a Diode-Based HVdc Link. Power Electronics, IEEE Transactions on, 25(12), pp.3095–3105.
A. D. Hansen, I.D. Margaris, “Type IV wind turbine model”, DTU Wind Energy report, 2013 http://orbit.dtu.dk/en/publications/type-iv-wind-turbine-model(99b55843-deb3-49b9-b564-e664bc25fa99).html

PROJECT REPORT. Deliverable 3.2: Specifications of the control strategies and the simulation test cases
65
APPENDIX
SIMULATION MODEL PARAMETERS
For ease of reference, this section includes a list of model parameters, obtained from Deliverables 2.1 and 3.1
of the PROMOTioN project.
OFFSHORE WIND FARM AC CABLES (FROM D3.1 – 5.2)
Figure 0.1.OWF model with detailed model
Table 1. OWF layout distances and cable sections
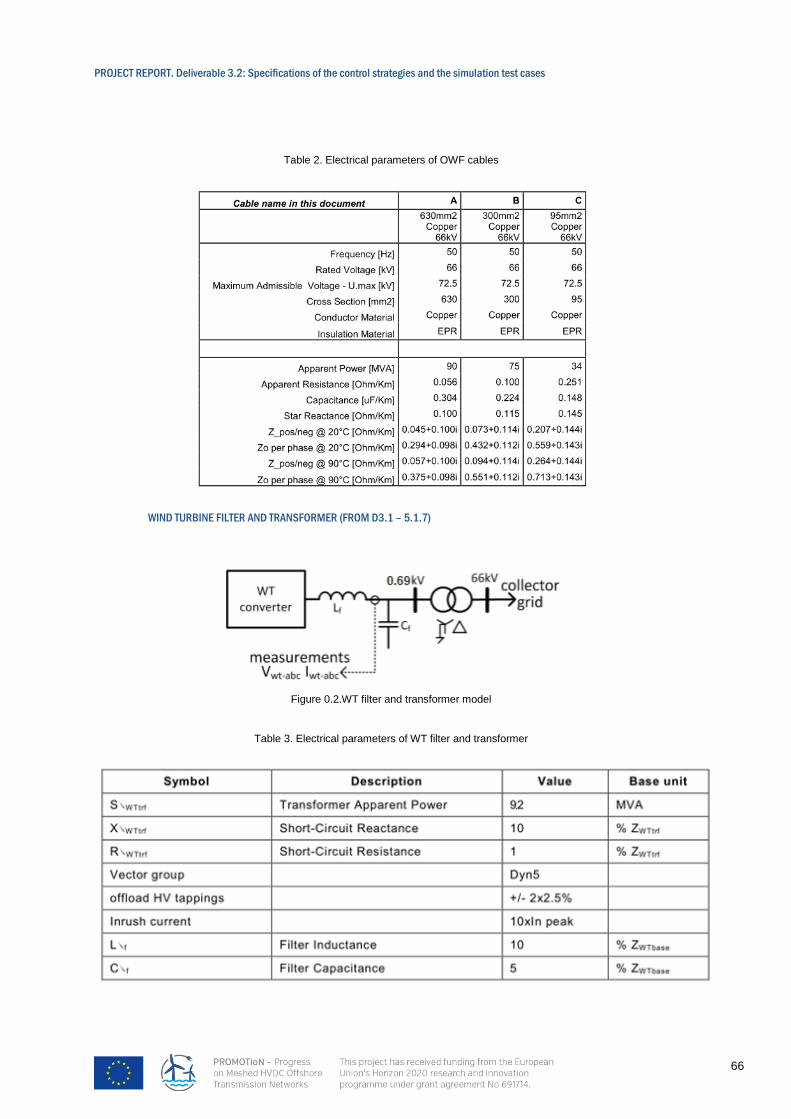
PROJECT REPORT. Deliverable 3.2: Specifications of the control strategies and the simulation test cases
66
Table 2. Electrical parameters of OWF cables
WIND TURBINE FILTER AND TRANSFORMER (FROM D3.1 – 5.1.7)
Figure 0.2.WT filter and transformer model
Table 3. Electrical parameters of WT filter and transformer

PROJECT REPORT. Deliverable 3.2: Specifications of the control strategies and the simulation test cases
67
DRU AND AC FILTERS (FROM D2.1 – 3.2)
The full detail DRU model is represented in Figure 0.3. There are six DRU modules which are gathered in 3
platforms 2 by 2. Each DRU module (Figure 0.4) consists of two sets of diode valves that form the 12 pulse
diode rectifier, a rectifier transformer with two sets of secondary windings and a smoothing reactor which is
individual in each module. Each DRU platform (Figure 0.5) consists of two DRU modules and AC filter for
reactive and harmonic compensation.
Figure 0.3. DRU model

PROJECT REPORT. Deliverable 3.2: Specifications of the control strategies and the simulation test cases
68
Figure 0.4. Single DRU module
Figure 0.5. Two DRU module platfon
DRU MODULE PARAMETERS
SMOOTHING REACTOR (FROM D2.1 – 3.2.2.1)
The considered smoothing reactor is of a total of 100 mH per pole (for 320 kV and 1200MW). If each DRU
module includes its own smoothing reactor, the individual DRU smoothing reactor should be of 33.33 mH.
Smoothing reactor is split within the module in its 2 poles for symmetrical smoothing.
DIODE VALVES (FROM D2.1 – 3.2.2.2)
Each valve must block 53.35 kV (106.7kV/2). Therefore, assuming typical 8.5 kV reverse voltage diodes, each
valve will consist on 8 diodes with their related grading resistor and capacitor (if used) and snubber protection.
Both detailed and aggregated valve models are represented in Figure 0.6 and their electrical parameters are
given in Table 4.

PROJECT REPORT. Deliverable 3.2: Specifications of the control strategies and the simulation test cases
69
Figure 0.6. Diode valve model: Detailed (left) and Aggregated (right)
Table 4. Diode valve electrical parameters
RECTIFIER TRANSFORMER (FROM D2.1 – 3.2.2.3)
As stated above, the rectifier transformer is a 12 pulse rectifier transformer, its parameters are shown in Table
5.

PROJECT REPORT. Deliverable 3.2: Specifications of the control strategies and the simulation test cases
70
Table 5. Rectifier transformer electrical parameters
AC FILTERS (FROM D2.1 – 3.2.2.4)
There is a single AC filter per platform (see Figure 0.5). Detailed AC filter circuit, based on the Crigre model
benchmark is represented in Figure 0.7 and electrical parameters are given in Table 6.
Figure 0.7. AC Offshore filter model

PROJECT REPORT. Deliverable 3.2: Specifications of the control strategies and the simulation test cases
71
Table 6. AC Filter electrical parameters
HVDC LINK CABLE (FROM D2.1 – 3.3)
Electrical parameters of the HVDC Link cable are in Deliverable 2.1 – 3.3. Cables.