deliverable 3.5: big data platform requirements, architecture and
TRANSCRIPT

Project funded by the European Union’s Horizon 2020 Research and Innovation Programme (2014 – 2020)
Coordination and Support Action
Big Data Europe – Empowering Communities with
Data Technologies
Deliverable 3.5: Big Data Platform
Requirements, Architecture and Usage
Dissemination Level Public
Due Date of Deliverable M18
Actual Submission Date 29/07/2016
Work Package WP3, Big Data Generic Enabling Technologies and Architecture
Task T3.2, T3.3
Type Report
Approval Status Final
Version 1.0
Number of Pages 34
Filename D3.5-Big_Data_platform_requirements_ architecture_and_usage.pdf
Abstract: This document describes a flexible and reusable Big Data platform, and how it can be used. This includes the technical requirements, the platform architecture and the graphical user interfaces. An update of the ongoing work on the semantification is also presented.
The information in this document reflects only the author’s views and the European Community is not liable for any use that may be made of the information contained therein. The information in this document is provided “as is” without guarantee or warranty of any kind, express or implied, including but not limited to the fitness of the information for a
particular purpose. The user thereof uses the information at his/ her sole risk and liability.
Project Number: 644564 Start Date of Project: 01/01/2015 Duration: 36 months

D3.5 – v. 1.0
Page 2
History
Version Date Reason Revised by
0.0 03/06/2016 Initial version Erika Pauwels (TenForce)
0.1 14/06/2016 Platform architecture Erika Pauwels (TenForce)
0.2 16/06/2016 User interfaces Erika Pauwels (TenForce)
0.3 04/07/2016 Semantic Analytics Stack Hajira Jabeen (UoB)
0.4 11/07/2016 Semantic Data Lake Mohamed Nadjib Mami (FhG)
0.5 14/07/2016 Technical requirements specification
S. Konstantopoulos (NCSR-D) A. Charalambidis (NCSR-D) A. Ikonomopoulos (NCSR-D)
0.6 15/07/2016 Finalizing for review Erika Pauwels (TenForce) Aad Versteden (TenForce)
0.7 18/07/2016 Peer review Ronald Siebes (NUA) George Papadakis (UoA)
0.8 25/07/2016 Address peer review comments Erika Pauwels (TenForce)
1.0 29/07/2016 Final version Erika Pauwels (TenForce)
Author List
Organisation Name Contact Information
TenForce Erika Pauwels [email protected]
TenForce Aad Versteden [email protected]
UBO Hajira Jabeen [email protected]
FhG Mohamed Nadjib Mami [email protected]
NCSR-D Stasinos Konstantopoulos [email protected]
NCSR-D Angelos Charalambidis [email protected]
NCSR-D Andreas Ikonomopoulos [email protected]

D3.5 – v. 1.0
Page 3
Executive Summary
This deliverable concludes WP3 by presenting the BDE platform requirements, architecture and usage. The community requirements gathered in WP2 and the input received from the pilots carried out in WP5 revealed that there is not one V (Volume, Velocity, Variety, Veracity) that overrules the others. Not even for one specific societal challenge. Each domain struggles with a combination of multiple Vs. Therefore, the idea of the platform profiles as presented in D3.2 is softened. Instead of building a platform per V, we will provide suggestions for components per V. In practice, each pilot implementation will consist of a mix of components tackling multiple Vs.
Based on the technical requirements specification, we have designed a platform architecture that focuses mainly on ease-of-use and flexibility. A user should be able to develop and deploy a Big Data pipeline with little effort. At the same time, the platform needs to be flexible to embrace future changes in the fast moving space of Big Data. The search for a flexible solution with good community support resulted in an architecture with 4 layers. The solution makes extensive use of the Docker ecosystem.
The layers from raw hardware to running applications:
1. Raw machines: These raw machines are called nodes. These nodes can be hardware nodes or virtual machines. They can be ran on premise, or in the cloud.
2. Docker Swarm: A clustering tool turning a pool of Docker hosts into a single virtual host. Each of the nodes have Docker Swarm installed, and have joined the same Swarm.
3. Support layer: Contains several platform UIs and support tooling to develop, deploy and monitor applications running on top of the base platform. It implements features for which there is no commonly accepted solution in the community (e.g. initialization orchestration, semantification).
4. Pipelines: The solution to a particular problem is called a pipeline. The topology of the solution is described in Docker Compose. The components of the pipeline are packaged as Docker containers. Installation and running of the components is derived from this topology.
We try to lower the barrier to use the BDE platform as much as possible by provisioning Docker templates and several platform UIs. The Docker templates are base Docker images wrapping a specific (Big Data) technology. These base images can be extended with a custom algorithm or data with minimal effort. The platform UIs are custom developed GUIs. They all serve different purposes, but in general they make it easier for the user to build, deploy and monitor applications on the BDE platform.
Continuous monitoring of the ecosystem around Big Data has ensured that we reuse components as much as possible, minimising platform maintenance. On some topics, the community is still in search for a good solution. For those cases we have implemented a solution, most often to be replaced by the community standard in the future. Notable in this regard is the ongoing work on semantification of Big Data, a recurring requirement by SCs.

D3.5 – v. 1.0
Page 4
Abbreviations and Acronyms 4V’s Volume, Velocity, Variety, Veracity
API Application Programming Interface
AWS Amazon Web Services
BDE Big Data Europe
BDI Big Data Integrator
CLI Command Line Interface
CRUD Create, Read, Update and Delete
CSS Cascading Style Sheets
CSVW CSV on the Web
ETL Extract, Transform, Load
GIS Geographic Information System
GUI Graphical User Interface
HDFS Hadoop Distributed File System
HTTP HyperText Transfer Protocol
I/O Input/Output
JSON Javascript Object Notation
KB Knowledge Base
OS Operating System
OWL Web Ontology Language
R2RML Relation to RDF Mapping Language
RDD Resilient Distributed Dataset
RDF Resource Description Framework
RDFS Resource Description Framework Schema
SANSA Semantic Analytics Stack
SC Societal Challenge
SPARQL SPARQL Protocol and RDF Query Language
UI User Interface
VM Virtual Machine
WP Work Package

D3.5 – v. 1.0
Page 5
Table of Contents
1. INTRODUCTION ....................................................................................................... 8
2. TECHNICAL REQUIREMENTS SPECIFICATION .................................................... 9
2.1 BASE SYSTEM REQUIREMENTS .................................................................... 9
2.1.1 Installation and provisioning ................................................................... 9
2.1.2 Data ingestion and persistence............................................................... 9
2.1.3 Data access .......................................................................................... 10
2.2 COMPONENT REQUIREMENTS .....................................................................10
2.2.1 Component preparation procedure ....................................................... 10
2.2.2 Initial pool of components ..................................................................... 10
3. BDE PLATFORM .....................................................................................................12
3.1 ARCHITECTURE ..............................................................................................12
3.1.1 Dockerization of (Big Data) technologies .............................................. 12
3.1.2 Integration between Mesos and Swarm ................................................ 12
3.1.3 Deployment through Docker Compose ................................................. 13
3.1.4 Revised platform architecture ............................................................... 13
3.2 INSTALLATION .................................................................................................14
3.3 COMPONENT TEMPLATES .............................................................................14
3.3.1 Theory .................................................................................................. 15
3.3.2 Example template: Spark ...................................................................... 17
3.3.3 Example template: Virtuoso .................................................................. 18
3.4 PLATFORM PIPELINES AND WORKFLOWS ..................................................18
3.4.1 Pipeline description .............................................................................. 18
3.4.2 Pipeline initialization ............................................................................. 18
3.5 SUPPORT LAYER ............................................................................................20
4. USER INTERFACES ................................................................................................21
4.1 PIPELINE BUILDER APPLICATION .................................................................21
4.2 PIPELINE MONITOR APPLICATION ................................................................22
4.3 SWARM UI ........................................................................................................24
4.4 INTEGRATOR UI ..............................................................................................25
5. SEMANTIFICATION.................................................................................................26
5.1 SEMANTIC DATA LAKE ...................................................................................26
5.1.1 Curse of heterogeneity ......................................................................... 26
5.1.2 Physical vs. virtual integration .............................................................. 26
5.1.3 Semantic Data Lake ............................................................................. 27

D3.5 – v. 1.0
Page 6
5.1.4 Data Source ......................................................................................... 28
5.1.5 Data Processing in a Semantic Data Lake ............................................ 28
5.2 SEMANTIC ANALYTICS STACK ......................................................................29
5.2.1 Read Write layer ................................................................................... 31
5.2.2 Querying Layer ..................................................................................... 31
5.2.3 Inference Layer .................................................................................... 32
5.2.4 Machine Learning Layer ....................................................................... 32
6. CONCLUSION .........................................................................................................33
7. REFERENCES .........................................................................................................34

D3.5 – v. 1.0
Page 7
List of Figures
Figure 1: BDE Platform architecture ..............................................................................13
Figure 2: BDE Platform installation ................................................................................14
Figure 3: Extending a base Docker image .....................................................................15
Figure 4: Hierarchy of the Spark Docker images ............................................................17
Figure 5: Communication between init daemon service and a pipeline component (e.g. Spark application) ..................................................................................................19
Figure 6: BDE platform architecture including a (user-facing) support layer ...................20
Figure 7: Pipeline builder application architecture ..........................................................21
Figure 8: Screenshot of the Pipeline Builder Application displaying a workflow with its steps ..................................................................................................................22
Figure 9: Screenshot of the Pipeline Monitor Application displaying a workflow with its steps ..................................................................................................................23
Figure 10: Pipeline monitor application architecture .......................................................23
Figure 11: Screenshot of Swarm UI displaying a running pipeline .................................24
Figure 12: Screenshot of the Integrator UI displaying the Spark Master dashboard .......25
Figure 13: Semantic Big Data included as a component in a pipeline on the BDE platform .........................................................................................................................26
Figure 14: Semantic Layer on top of Data Lake .............................................................27
Figure 15: Data Source in a Data Lake ..........................................................................28
Figure 16: Workflow in a Semantic Data Lake ...............................................................28
Figure 17: Example of a query answering in a Semantic Data Lake ..............................29
Figure 18: Architecture of SANSA .................................................................................31
List of Tables
Table 1: Relevant components based on the community requirements .........................11
Table 2: Published base Docker images ........................................................................15

D3.5 – v. 1.0
Page 8
1. Introduction This deliverable "Big Data Platform Requirements, Architecture and Usage" wraps up
WP3. It is a merge of the original deliverables D3.5 "Technical Requirements Specifications & Big Data Integrator Architectural Design II" and D3.6 "Big Data Integrator Deployment and Component Interface Specification II" in order to present a coherent story on the platform requirements, architecture and usage to conclude WP3.
First, the final technical requirements specification is presented. These requirements specification is based on the community requirements gathered in WP2 and the input received from the pilots carried out in WP5. The requirements are defined for the base system as well as for the individual platform components.
Next, the BDE platform architecture is presented. The main focus of the architecture is the ease-of-use and flexibility. A user should be able to develop and deploy a Big Data pipeline with little effort. At the same time, the platform needs to be flexible to embrace future changes in the fast moving space of Big Data. We also tend to follow the movement of the Big Data and Docker community in order to reuse as much work of the community as possible. As a consequence, changes have been made to the architecture compared to the one described in D3.3 [1]. These changes are described and rationalized in section 3. This section also describes how to develop platform components and pipelines and gives an overview of the components that are already available.
Some components of the BDE platform only offer a CLI. GUIs oftentimes make the user feel more comfortable than a CLI. As we want to lower the barrier to Big Data technologies, we have invested time to specify and implement custom GUIs. Section 4 presents these user interfaces: a pipeline builder application, a pipeline monitor application, an integrator UI and a Swarm UI. The GUIs serve different purposes, but in general they make it easier for the user to build, deploy and monitor applications on the BDE platform.
Finally, the work on the semantification of the platform is presented in section 5. The semantification is not part of the core platform architecture, but it is a feature required by some of the pilot cases. The effort on the semantification is twofold. Work has been done on (1) a Semantic Data Lake and (2) a Semantic Analytics Stack. Both subjects are work in progress. This deliverable only presents a current state of the semantification. The effort will be continued in WP4 and WP5.
D3.5 – v. 1.0
Page 9
2. Technical Requirements Specification
2.1 Base System Requirements
2.1.1 Installation and Provisioning In the previous iteration of the BDI design, we proposed a system of BDI profiles [2], each
of which is a different base system upon which the different pilots would develop their application-specific components. Each of the different profiles was geared towards addressing a different focus with respect to the 4 V’s so that, for example, there was one profile focusing on sensor data processing where velocity was deemed the main challenge.
As work in WP2 collected more feedback from the different communities involved in the seven H2020 societal challenges [3], it became more evident that applications face different mixtures of the 4 V’s and that the structure defined in D3.2 [2] needs to be weakened in favour of flexibility in selecting and mixing different components.
This, naturally, weakens the requirement for a base system that offers out-of-the-box storage and processing capabilities. Instead of a series of base systems that offer different mixtures of data storage and processing components, the new requirements ask for a more foundational base system that offers only the container within which functionalities can be easily deployed. This base system can be complemented with a pool of storage and processing components that have been tested with the base system. These components can be freely mixed to deploy a Big Data infrastructure as needed by each application.
Given the above, the requirements for the base installation and provisioning are:
The base system installs a software container system such as Docker
The Big Data storage and processing components are deployed in containers
The base system installs a provisioning system such as Mesos or Docker Swarm allowing complex pipelines of such containers to be executed in a cluster
2.1.2 Data Ingestion and Persistence Given the container-based (as opposed to natively installing) model for provisioning
components (including data storage components), another architectural issue is the persistence and access of data. The BDI architecture can follow either of two data value chain models:
Data storage components are deployed as large container images that include the data that they serve.
Data storage components are deployed as minimal software-only container images that mount external storage.
Docker images need to be stateless and easily replaced without losing data. In our user requirements we have applications where data ingestion is not fully automated (SC6 and SC7,) and applications where data is acquired incrementally such as by Web crawling (SC7) [3]. In such applications, there is no automatic way to define Docker-based pipelines that download, load, and process the data, but the data needs to be persisted between executions of the pipeline.
This makes the second approach preferable and it is a requirement for the architecture that it supports software-only container images that mount external data store images.

D3.5 – v. 1.0
Page 10
2.1.3 Data Access The data analysis output is consumed in different ways [3]:
Visualized by domain-specific and custom-made tools (SC3) and on GIS (SC4, SC5, SC7)
Presented as statistics, spreadsheets and charts (SC1, SC2, SC4, SC5, SC6)
Published on the Web (SC1, SC2, SC5)
Retained in the infrastructure for further processing (SC5, SC6)
The great variability in ways to consume data analysis output mandates that the system is open to custom solutions and no specific set of tools can be prescribed. The architecture should provide for APIs through which the data analysis output can be accessed programmatically in order to be consumed by external visualization and presentation tools.
Furthermore, the architecture should allow writing output back to the infrastructure to be used as input for future processing. This is consistent with the persistence requirements in section 2.1.2.
2.2 Component Requirements Given the flexibility in selecting what storage and processing components to involve in
each application (see section 2.1.1), the requirements for specific components are weakened to:
Establishing the procedure for preparing and maintaining a container for a new component.
Bootstrapping the BDI ecosystem with an attractive pool of initial components.
2.2.1 Component Preparation Procedure The architecture should provide best practices and guidelines about what constitutes an
appropriate BDI component container. These should cover:
Naming conventions, filesystem layout, configuration variables, and other aspects of preparing a Docker image.
Guidelines on how to prepare CSS stylesheets for Web user interfaces, so that they can be integrated in the overall BDI configuration and monitoring user interface.
Templates and guidelines on how to document the component so that it can be integrated in the overall BDI technical documentation.
The platform should also specify how components can be listed and discovered in a directory of BDI components.
2.2.2 Initial Pool of Components The components that will be developed during the project should form a coherent and
useful initial pool that will bootstrap the BDI ecosystem. Based on the requirements elicited from the community, as recorded in sections 2.2.2 and 2.3 of [3], at least the following should be prepared within the project:

D3.5 – v. 1.0
Page 11
Table 1: Relevant components based on the community requirements
Functionality Required by Relevant components
GIS storage and visualization on map SC5, SC7 GeoTriples, Strabon, PostGIS, Sextant
Intermediate data storage and associated data provenance and lineage metadata
SC1, SC5 HDFS, document/metadata stores (Cassandra or RDF)
RDF data and metadata storage and integration
SC1, SC5, SC7
Virtuoso, 4store, Semagrow
Text storage and annotation SC2 ElasticSearch, Solr
Pattern recognition, image processing, forecasting, event detection
SC2, SC4, SC5, SC7
Spark, Flink
Real-time data acquisition, streaming data (text feeds, sensor data)
SC2, SC3, SC4, SC6
Flume, Kafka
Numerical data storage and retrieval SC5 Hadoop, Hive
Statistical analysis in Matlab, SPSS SC6 Integration with external proprietary and custom software
Predictive maintenance, power production forecasting, power production and operation assessment
SC3
Environmental modelling, downscaling SC2, SC5 Integration with external computation infrastructures
This initial list of components is further refined and extended in [4] with the list of components needed for the specific pilots that showcase characteristic use cases from each domain.

D3.5 – v. 1.0
Page 12
3. BDE Platform D3.3 [1] and D3.4 [5] presented an initial BDE platform architecture. Based on research
and practical experience, this architecture has been subject to changes during the last months. Hereby always focusing on ease-of-use and flexibility. Some components have been removed from the architecture while others have been replaced. The platform is also enriched with a number of new components and interfaces.
This section first describes the changes made to the architecture compared to the one presented in D3.3. Next, the installation of the platform and the development of components and pipelines is described. Finally, the support layer - a new layer in the architecture - is presented. An overview of the interfaces can be found in section 4.
3.1 Architecture The previous WP3 deliverables presented the BDE platform architecture consisting of
Apache Mesos, Marathon, Chronos and Docker Swarm. Mesos served as a kernel layer that makes abstraction of the underlying hardware, being it machines in the cloud or on premise. Marathon, Chronos and Docker Swarm are frameworks running on top of this kernel layer that allows deploying of applications, natively or dockerized, on the cluster. The architecture and the motivation behind it has been described in detail in D3.3 [1] and D3.4 [5].
However, from our research and practical experience during the last months we gathered insights on the architecture which were not in line with our first thoughts and presumptions. In the meantime the Mesos and Docker communities progressed. The next sections describe these new insights and conclude with a revised architecture of the BDE platform
3.1.1 Dockerization1 of (Big Data) Technologies Given the complex space, we initially wanted to support (Big Data) technologies which
were not suited for container deployment. There might be technologies that put constraints which prohibit them from running inside a container like Docker. We wanted to keep our options open for native application deployment on Mesos using Marathon. We always preferred dockerized components, but if dockerizing a component would not be possible, we would be able to deploy that application natively through Marathon using the same base platform.
During the last months we have dockerized several (Big Data) technologies. None of them posed major problems to be run in a Docker container. Based on our experience and the movement around Docker, including major parties like Microsoft, we are getting more confident that all components can be dockerized in reasonable time. This evolvement erases the platform constraint to have a native application deployment mechanism.
3.1.2 Integration between Mesos and Swarm Swarm is an orchestration tool that allows to deploy Docker containers on a cluster in a
transparent way. Each node in the cluster runs a Swarm agent. Together the nodes constitute a swarm which is managed by a Swarm manager. The Swarm manager serves the same API as the Docker Engine. As such, using the same commands, one can deploy dockerized applications on a single machine or on a cluster. Docker Swarm has evolved a lot since our initial research on the BDE project. A stable production-ready v1.0.0 has been released in November 2015. Ever since, Swarm kept - and still keeps - improving based on the input and feedback from the community.
1 I.e. running in a Docker container

D3.5 – v. 1.0
Page 13
By default, Swarm comes with a built-in scheduler that spreads the containers across the nodes in the cluster. When running Swarm as a framework on top of Mesos, the built-in scheduler gets replaced by the Mesos scheduler. The Mesos scheduler has knowledge about all the nodes in the cluster and the resources each of them offers. As such, the Mesos scheduler is best suited to schedule the containers on the nodes in the cluster.
Against all odds, the integration between Mesos and Swarm is not production-ready yet. Moreover, while the Swarm maintainers actively contributed to the integration during the second half of 2015, the integration now seems to have lost traction. The code base did not majorly change since March 2016. As a consequence, several unresolved issues make deploying Docker containers through Docker Swarm on a Mesos cluster in production near impossible today.
3.1.3 Deployment through Docker Compose Marathon and Chronos are both frameworks that allow deployment of applications on top
of Mesos. Marathon can be thought of as the startup or init daemon for a distributed OS, while Chronos offers a cron daemon for a distributed OS. Both frameworks support both native and containerized deployment of applications. Docker is one of the supported containerization technologies. However, Docker support is limited to Docker Engine only. The frameworks support the deployment of single, isolated Docker containers. They do not support the deployment of a collection of communicating containers through Docker Compose, which is the preferred way of describing and deploying applications in the BDE platform as described in D3.4 [5].
We could mimic the functionality of Docker Compose by deploying each of the containers specified in the docker-compose.yml file as individual containers. However, this would be
cumbersome in comparison to Docker Compose where the containers can be started all at once using a single command. This option does not even hold when deploying through Marathon and/or Chronos as these frameworks do not support all features provided by Docker Engine. For example, when deploying through Marathon and/or Chronos containers cannot be linked at the Docker level using the --link option. This linking feature is extensively used by Docker Compose to describe the high-level topology of the Big Data pipeline.
3.1.4 Revised platform architecture Based on the lessons we have learned, we revised the BDE architecture proposed in D3.3.
The new architecture is illustrated in Figure 1. Given the confidence that all technologies can be dockerized Docker Swarm, with its built-in scheduler, offers all features required by the platform. Mesos is no longer part of the architecture as it does not add any value to the platform at the moment. Removal slims down the platform with positive side-effects for installation and maintenance.
Figure 1: BDE Platform architecture

D3.5 – v. 1.0
Page 14
In the revised architecture, Docker Swarm operates as a resource manager directly on top of the hardware layer. This hardware layer may still consist of machines on premise or in the cloud. On top of Swarm, applications can be deployed through Docker as a single container or through Docker Compose as a collection of communicating containers.
3.2 Installation We provide several ways to install the base platform on your cluster. Through a manual
installation guide or using Docker Machine. With Docker Machine, the installation involves just a few commands, be it in VMs on your local machine, on machines in the cloud (e.g. DigitalOcean, AWS, Azure) or on bare metal machines. The installation results in the following setup:
Figure 2: BDE Platform installation
Each node in the cluster runs a Docker daemon. One node will serve as Swarm manager. This is the main entry point for the Docker Client to run applications on the cluster. All the other nodes are part of the swarm. They each run a Swarm agent and can communicate via overlay networks. The manager node will also run a Consul2 key-value store for the bookkeeping of the nodes and overlay networks in the swarm. The manual installation guide as well as the installation using Docker Machine are available on the BDE Wiki [6] and blog [7]. Screencasts will be provided in the future.
3.3 Component templates An application running on the BDE platform can be seen as a pipeline consisting of
multiple components, which are wired together in order to solve a specific Big Data problem. It should be easy for a programmer to develop, build and deploy such a pipeline component. It should be easy to reuse existing components. But we should also not limit the choice of technology and implementation. D3.4 [5] arguments how using Docker keeps our options open for the future, instead of focusing on a limited set of technologies in the fast moving space of Big Data. The deliverable also introduced the concept of base Docker images. This concept is described more in depth in this section.
2 See https://www.consul.io/

D3.5 – v. 1.0
Page 15
3.3.1 Theory Templates are base Docker images that offer an implementation for a specific - in our case
Big Data - technology. Such a template can be easily extended by a programmer with his own custom implementation to solve a particular problem, as illustrated in Figure 3. The provisioning of templates makes it a lot easier to implement a new pipeline component. A programmer can start easily with any of the supported Big Data technologies without the need to know the technology in depth. Moreover, extending a template requires little effort as illustrated by the example cases in sections 3.3.2 and 3.3.3.
Figure 3: Extending a base Docker image
The BDE project currently supports a wide variety of technologies. The selection of specific technologies is mainly based on the requirements of the SCs' pilot cases. These will be implemented on the BDE platform in WP5. At the time of writing, the following base images are available:
Table 2: Published base Docker images
Component GitHub repository3 Docker image(s)4
4store big-data-europe/docker-4store bde2020/4store bde2020/4store-master
Cassandra big-data-europe/cassandra bde2020/cassandra
ELK stack big-data-europe/docker-elk-stack elasticsearch bde2020/logstash kibana
Flink big-data-europe/docker-flink bde2020/flink-master bde2020/flink-worker
3 As published on https://github.com
4 As published on https://hub.docker.com

D3.5 – v. 1.0
Page 16
bde2020/flink-submit bde2020/flink-maven-template
Flume big-data-europe/docker-flume bde2020/flume
GeoTriples big-data-europe/docker-geotriples bde2020/geotriples
Hadoop big-data-europe/docker-hadoop bde2020/hadoop-namenode bde2020/hadoop-datanode bde2020/hadoop-resourcemanager bde2020/hadoop-historyserver bde2020/hadoop-nodemanager
Hive big-data-europe/docker-hive bde2020/hive
Kafka big-data-europe/docker-kafka bde2020/kafka
PostGIS big-data-europe/docker-postgis bde2020/postgis
Semagrow big-data-europe/docker-semagrow big-data-europe/ docker-sevod-scraper big-data-europe/ docker-semagrow-cassandra
semagrow/semagrow semagrow/devod-scraper semagrow/semagrow-cassandra
Sextant big-data-europe/docker-sextant bde2020/sextant
Silk big-data-europe/docker-silk-workbench
bde2020/silk-workbench
Solr big-data-europe/docker-solr bde2020/solr
Spark big-data-europe/docker-spark bde2020/spark-master bde2020/spark-worker bde2020/spark-submit bde2020/spark-java-template
Strabon big-data-europe/docker-strabon bde2020/strabon
Virtuoso tenforce/docker-virtuoso tenforce/virtuoso
Not all templates have achieved the same level of maturity. They may evolve over time. We continuously aim to improve the templates in terms of user-friendliness and configuration, based on usage and experience. We have defined a set of guidelines and best practices that should be followed by the base image providers in order to align the structure and usage of the base images. By doing so, using a template becomes even more straightforward to the user. The less effort a user should spent to get something running on the platform, the better.
Although the list above does not include all technologies available in the Big Data space, this should not limit the options of the user. Each component that runs in a Docker container can be deployed on the BDE platform. If a new Big Data technology appears, the BDE platform

D3.5 – v. 1.0
Page 17
is able to embrace this technology without modifications to the base platform. We intend to provide more base images in the future.
3.3.2 Example Template: Spark A typical Spark cluster consists of a Spark master and one or more Spark workers. A user
can execute an algorithm on the cluster, by submitting an application through the spark-submit command. This algorithm may be implemented in Java, Scala or Python. But once the algorithm has been implemented, how should the source code be packaged and submitted to the Spark cluster?
The BDE platform provides a Spark master and a Spark worker image to setup the Spark cluster. They are both an extension of a Spark base image, a simple image that just includes Spark. Next, there is a Spark submit image available that allows to submit an application, be it implemented in Java, Scala or Python, to the Spark cluster. To ease the job of the developer, we went one step further and extended the Spark submit image with a Spark Java template. A Python and Scala template will be provided in the future. Figure 4 illustrates the hierarchy of the Spark images provided by the BDE platform.
Figure 4: Hierarchy of the Spark Docker images
The Spark Java template allows the user to package and submit his application with as little effort as possible. The user just needs to implement his Spark algorithm in Java and to include a Dockerfile containing the following lines:
FROM bde2020/spark-java-template:1.5.1-hadoop2.6
MAINTAINER Erika Pauwels <[email protected]>
ENV SPARK_APPLICATION_MAIN_CLASS com.tenforce.bde.Application
ENV SPARK_APPLICATION_JAR_NAME spark-demo-1.1-with-dependencies
This is less lines of code than a hello world example in Java. The only lines the user needs to configure are the fully qualified name of the main application class and the name of the resulting JAR. Finally, by building and running this image, the Docker container will automatically package the Java source code in a JAR and submit this JAR to the Spark cluster.
The Java template greatly simplifies the task of the user and allows to run a Spark algorithm without the need to know all the technical details of the Spark submit command. On the other hand, a template may be opinionated and pose limitations on the freedom of the user. The Java template for example assumes that the Java application uses Maven as build tool such that the application can be packaged by running the mvn package command. If the user prefers another build tool, like for example Gradle, the Java template will be of less use. We try to select the most common tools and best practices for each technology such that the limitations posed by the template are sensible to the user.

D3.5 – v. 1.0
Page 18
3.3.3 Example Template: Virtuoso Virtuoso is a data storage component that allows to store triples. The Docker image
supported by the BDE platform provides a Virtuoso instance in which data can be persisted across container startups by mounting the /data folder as a volume. Moreover, a user can automatically populate the triple store with his own custom triples during startup. To this end, the user just needs to build a Dockerfile containing the following lines:
FROM tenforce/virtuoso:1.0.0-virtuoso7.2.4
MAINTAINER Erika Pauwels <[email protected]>
COPY my-data.ttl /data/toLoad/
The only line the user needs to configure is the one where his custom data file (my-data.ttl) is copied in the container's /data/toLoad/ folder. By running the container,
Virtuoso will automatically pick up all the files available in the /data/toLoad folder and load
their contents in the triple store. No manual intervention is required by the user.
The Spark Java template and Virtuoso images described above just illustrate the general idea behind the base images. The templates for the remaining technologies will be built in a similar way. The usage of each template will, however, differ slightly per technology.
3.4 Platform Pipelines and Workflows
3.4.1 Pipeline Description A Big Data pipeline consists of multiple components that are wired together into one
smooth-running system. Given that the pipeline components are provided as Docker containers, Docker Compose offers a good solution to describe such a pipeline. A Docker Compose file contains the identifiers of all Docker containers which should be ran, and how they need to be wired together. For example, a Docker Compose file could contain the Cassandra database and a Spark Docker for the Spark application to perform computations.
Docker Compose seamlessly integrates with Docker Swarm. This allows to deploy a pipeline consisting of multiple components on a cluster using a single command. The components will (by default) be spread in a round-robin fashion across the nodes in the swarm. Using labels on the nodes and the components, one can constrain on which node a container is scheduled. For example database containers could be constrained to run only on nodes with the label storage==ssd.
Docker containers scheduled on different nodes in the cluster can communicate with each other through overlay networks. D3.4 [5] pointed out that the Docker networking was not production-ready yet at that point in time. Since the release of Docker v1.10 in February 2016, the overlay networks are considered production-ready. They work in a similar way as the bridge networks that Docker Engine creates by default [8]. As a consequence, one can connect containers or create aliases per container using the standard Docker link commands on overlay networks.
3.4.2 Pipeline Initialization When starting a Docker Compose application, the services defined in the docker-
compose.yml will start running all at once. This is not always the intended behaviour. Services may depend on each other or on a human intervention. For example, a Spark worker requires the Spark master to be available before he can register at the master. Another example is a Spark Map Reduce algorithm that requires a file to be available on HDFS before starting the computation. At the moment, these dependencies cannot be expressed in Docker Compose.

D3.5 – v. 1.0
Page 19
The Docker community is aware of the initialization problem described above [9], but they did not come up with a solution yet. Besides, a general solution to tackle this problem is not straightforward as 'being up and running' may have a different meaning per service and/or per context. For example, one service may consider HDFS to be up and running once the API accepts HTTP request, while another service may consider HDFS to be up and running only if the required input file has been made available in the correct folder.
Awaiting the general solution of the Docker community, we have developed a semantic alternative. We provide an init daemon service that, given an application-specific workflow, orchestrates the initialization process of the several components. On one hand, the init daemon service, a microservice built on the mu.semte.ch5 platform, provides requests through which the components can report their initialization progress. On the other hand, because the init daemon knows the startup workflow, it can validate whether a specific component can start based on the initialization statuses reported by the other components.
The workflow needs to be described per application. It specifies the dependencies between services and indicates where human interaction is required. An example workflow could be:
1. Setup HDFS 2. Setup a Spark cluster 3. Put an input file on HDFS 4. Run the Spark algorithm 5. Get the output from HDFS
By feeding the workflow in the init daemon service, the Spark algorithm will only be allowed to start when the first three steps have finished successfully. I.e. when the services involved in step 1-3 automatically report that they started successfully (e.g. setup HDFS, setup Spark) or when a user manually indicates a step finished successfully (e.g. putting an input file on HDFS). Figure 5 illustrates the communication between a pipeline component and the init daemon service. The BDE platform provides GUIs to define an application-specific workflow and to manage and follow-up the initialization process when an application is starting. Both interfaces are described in detail in section 4.
Figure 5: Communication between init daemon service and a pipeline component (e.g. Spark application)
5 See https://mu.semte.ch

D3.5 – v. 1.0
Page 20
The automatic reporting requires an integration of each of the components with the init daemon service. This puts an additional constraint on the components. They need to report their progress to the init daemon service to be compliant with the BDE platform and to be usable in practical scenarios. We would rather have avoided such a constraint, but we expect the Docker community to come up with a general solution that allows to express the dependencies in a more general way (for example in the Docker Compose file) instead of requiring a modification in each of the Docker images involved in the pipeline.
An example application including the init daemon, an HDFS cluster, Spark cluster and Spark Map-Reduce algorithm can be found in the big-data-europe/demo-spark-sensor-data GitHub repository6. The application also includes the GUIs that are described in the next section. The README in the repository's root folder describes how to run the demo application.
3.5 Support Layer The GUIs described in the next section together with the base Docker images (see section
3.3) and the init daemon service (see section 3.4) provide additional support to the user. They facilitate the tasks of building, deploying and monitoring Big Data pipelines on the BDE platform. This support is illustrated in Figure 6 as an additional layer in the platform architecture. On top of Swarm, there is a support layer available that includes the base Docker images and the init daemon service. The support layer is also user-facing by the several GUIs it provides to build, deploy and monitor pipelines.
Figure 6: BDE platform architecture including a (user-facing) support layer
6 See https://github.com/big-data-europe/demo-spark-sensor-data

D3.5 – v. 1.0
Page 21
4. User Interfaces GUIs oftentimes make the user feel more comfortable than a CLI. As we want to lower the
barrier to Big Data technologies, we have invested time to specify and implement GUIs. This resulted in a pipeline builder application, a pipeline monitor application, an integrator UI and a Swarm UI. The GUIs serve different purposes, but in general make it easier for the user to build, deploy and monitor applications on the BDE platform. Most of the GUI applications are built on mu.semte.ch, a microservices framework backed by Linked Data. Each of the applications is described in more detail in the next sections.
4.1 Pipeline Builder Application As explained in section 3.4, the init daemon service needs to know the workflow of an
application to be able to orchestrate the initialization process. The pipeline builder application provides a GUI to the user to build such a workflow. The application runs on any (local) machine. It should not be deployed on the BDE platform.
The pipeline builder application is built on top of the mu.semte.ch framework. Figure 7 illustrates its architecture. The front-end is an EmberJS application. The back-end consists of a triple store to store the data and a set of microservices. Next to the core mu.semte.ch microservices (identifier and dispatcher), the pipeline builder application includes only two microservices:
pipeline microservice: provides CRUD operations on resources (workflows and steps) to describe a Big Data pipeline
pipeline export microservice: export a workflow with its steps in Turtle format
Figure 7: Pipeline builder application architecture
To start the application, just clone the GitHub repository and run the application using Docker Compose:
$ git clone https://github.com/big-data-europe/app-pipeline-builder.git
$ cd app-pipeline-builder
$ docker-compose up -d
By browsing to http://localhost and clicking the 'Pipelines' menu item in the navigation
bar on top, the user lands on a page for creating a new workflow. Each workflow has a title and a description. After creating a workflow, steps can be added to the workflow (see Figure 8). The steps reflect the dependencies between the images and/or manual actions in the application. Which container depends on another container? Which (manual) actions must be executed before a container can start? Example dependencies could be:

D3.5 – v. 1.0
Page 22
The Spark master needs to be started before the Spark worker such that the Spark worker can register itself at the Spark master.
The input data needs to be loaded in HDFS before the Map Reduce algorithm starts computing.
The order of the steps can be rearranged by dragging-and-dropping the step panels. Once finished the workflow can be exported in Turtle format to be fed into the init daemon service.
Figure 8: Screenshot of the Pipeline Builder Application displaying a workflow with its steps
4.2 Pipeline Monitor Application Once an application is running on the BDE platform, the pipeline monitor application allows
a user to follow-up the initialization process. It displays the workflow as defined in the pipeline builder application (see Figure 9). For each step in the workflow, the status (not started, running or finished) is shown as retrieved from the init daemon service. The interface automatically updates when a status changes, due to an update through the init daemon service by one of the pipeline components. As such, the user can follow-up the initialization process. The interface also offers the option to the user to manually finish a step in the pipeline if necessary.

D3.5 – v. 1.0
Page 23
Figure 9: Screenshot of the Pipeline Monitor Application displaying a workflow with its steps
Similar to the pipeline builder application, the pipeline monitor application is also built on top of the mu.semte.ch framework. As a consequence, the architecture, shown in Figure 10, is comparable. The front-end is an EmberJS application. The back-end consists of a triple store that must be populated with the pipeline export from the pipeline builder application. Next to the core mu.semte.ch microservices (identifier and dispatcher), the pipeline monitor application includes two microservices:
pipeline microservice: provides CRUD operations on resources (workflows and steps) to describe a Big Data pipeline
init daemon microservice: provides calls to report and retrieve the progress of a workflow's initialization process
Figure 10: Pipeline monitor application architecture
In contrast to the pipeline builder application, the pipeline monitor application should not be started as a standalone application. It needs to be integrated as a component in the
D3.5 – v. 1.0
Page 24
docker-compose.yml of a Big Data pipeline. The big-data-europe/app-bde-pipeline GitHub
repository7 offers a good starting point.
4.3 Swarm UI As explained in section 3.4, the Big Data pipelines will be described using Docker
Compose. Currently, Docker Compose only offers a CLI to deploy applications on Docker Engine or Docker Swarm. The Swarm UI provides the user with a GUI to deploy and monitor Docker Compose applications.
The Swarm UI is built on top of the mu.semte.ch framework. The front-end is an EmberJS application. The back-end consists of a triple store to store the data and a set of microservices. Next to the core mu.semte.ch microservices (identifier and dispatcher), the Swarm UI includes only two microservices:
resource microservice: provides CRUD operations on resources (repositories, pipelines, etc.) to deploy a Big Data pipeline
Docker Compose admin microservice: provides a REST API on top of the Docker Compose commands
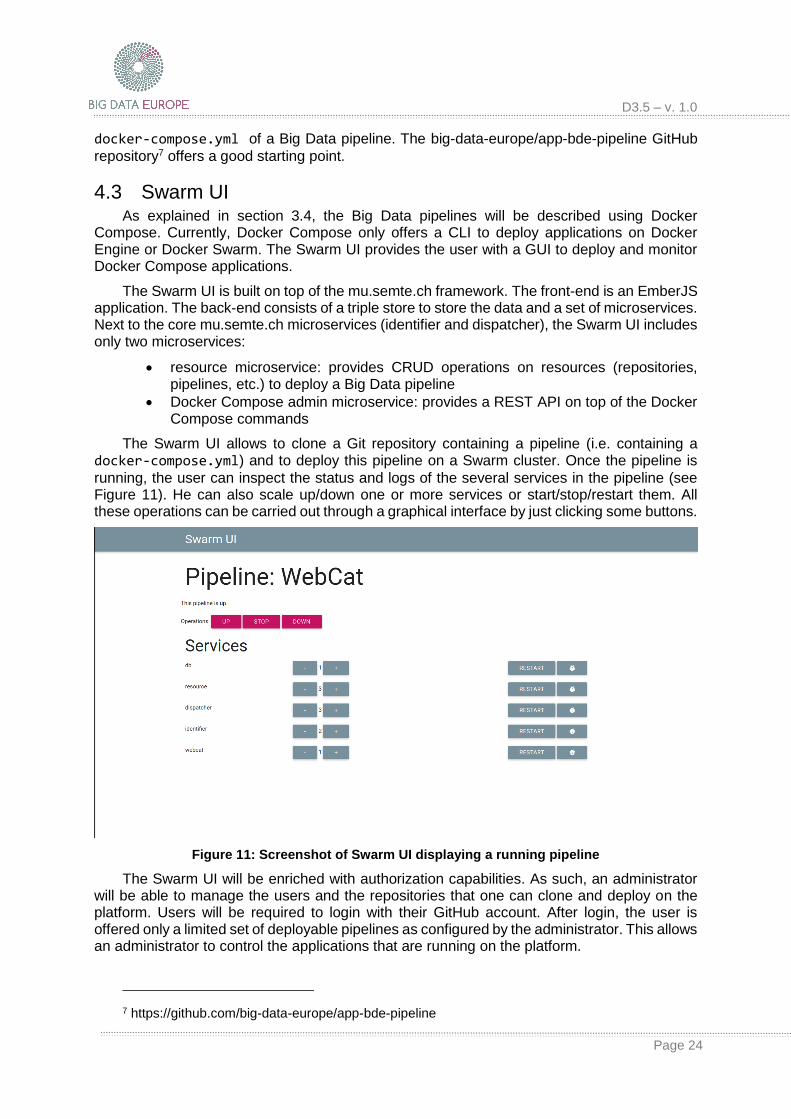
The Swarm UI allows to clone a Git repository containing a pipeline (i.e. containing a docker-compose.yml) and to deploy this pipeline on a Swarm cluster. Once the pipeline is
running, the user can inspect the status and logs of the several services in the pipeline (see Figure 11). He can also scale up/down one or more services or start/stop/restart them. All these operations can be carried out through a graphical interface by just clicking some buttons.
Figure 11: Screenshot of Swarm UI displaying a running pipeline
The Swarm UI will be enriched with authorization capabilities. As such, an administrator will be able to manage the users and the repositories that one can clone and deploy on the platform. Users will be required to login with their GitHub account. After login, the user is offered only a limited set of deployable pipelines as configured by the administrator. This allows an administrator to control the applications that are running on the platform.
7 https://github.com/big-data-europe/app-bde-pipeline

D3.5 – v. 1.0
Page 25
4.4 Integrator UI Most components, like Spark, Flink and HDFS provide dashboards to monitor their status.
As each of the components runs in a separate Docker container, they all have a different IP address. Moreover, the ports and the paths on which the dashboards are available differ per technology. That is the reason why the BDE platform provides an integrator UI. This GUI displays each of the component's dashboards in a unified interface topped with a BDE style based on Google's Material Design8 (see Figure 12).
Figure 12: Screenshot of the Integrator UI displaying the Spark Master dashboard
The integrator UI is a component that, similar to the pipeline monitor application, should not be started as a standalone application, but needs to be integrated as a component in the docker-compose.yml of a Big Data pipeline. It serves as an entry point to all the available
interfaces as each interface can be reached by simple clicking a button in the top menu of the integrator UI. The interfaces that need to be shown in the integrator UI can be configured per pipeline through a JSON file.
8 See https://material.google.com/

D3.5 – v. 1.0
Page 26
5. Semantification In the BDE project, we not only aim towards developing an engineering effort that makes
new technologies easy to use, but we are also keen in contributing novel research efforts to the European Big Data infrastructure. In this perspective, we have introduced the term “semantification of the Big Data technologies”, a recurring requirement by SCs. We are exploiting the concept in two different perspectives in BDE: a Semantic Data Lake (see section 5.1) and a Semantic Analytics Stack (see section 5.2). The semantification is not considered part of the core platform architecture. It is a feature that can optionally be included as a component in an application as illustrated in Figure 13.
Figure 13: Semantic Big Data included as a component in a pipeline on the BDE platform
5.1 Semantic Data Lake As a reminder, Big Data is the situation confronted by an application where the Volume
(size of the data it handles), Velocity (pace at which data is flowing into it), Variety (the wide diversity of the data types it deals with) become a problem if conventional technology and techniques are used. Volume and Velocity gained much attention, as seen in the number of solutions proposed. In contrast, Variety has not been adequately targeted due to its inherent complexity.
On the other hand, Semantic Web techniques proved their power at solving data integration problems of heterogeneous data. We, therefore, aim to involve the Semantic Web approaches for data representation and querying in solving the Variety challenge of Big Data.
5.1.1 Curse of Heterogeneity Data can be crawled from the web, collected from networks of sensors, generated as event
logs, incrementally aggregated from clickstreams, extracted from social networks, to name a few. Thanks to the fault tolerant and highly scalable data repository HDFS, we are able to accommodate all that data in its raw format across a cluster of commodity machine. Several processing engines have been built to interact with that data. Further, in case of structured data, several distributed databases have been put in our disposal to run declaratively ad hoc queries and extract insights. Being able to host all that data in one setup of hardware and analyse it using different technology constitutes one of the most significant advance in data processing history. This pool of data has got a name: Data Lake.
5.1.2 Physical vs. Virtual Integration One more common concept is the Data Warehouse, where all the data is physically
integrated into another system, structured into tables according to a predefined schema. Analytical queries are run over the integrated data using Business Intelligence standards. In a

D3.5 – v. 1.0
Page 27
Data Warehouse, all the data is integrated in batches using the so-called ETL process. In a Data Warehouse, we ensure to have the single version of truth until new data is produced, in which case the Data Warehouse goes out of sync and thus a refresh is needed, otherwise results are incomplete. In such a process, the cost of data transfer and storage could be significant.
On the other hand, the Data Lake concept requires that the data remains in its raw format and its original location in the lake. This enables all sort of processing to take place over that data, e.g., text mining, image processing, machine learning. In contrast to the known schema on write in the case of Data Warehouse, the Data Lake only knows the schema on read, which means that a schema is formed describing the portion of data needed for a particular computation. While the Data Warehouse is known by its ETL process, in the Data Lake we can call for an ELT procedure, shifting the Transform to the end of the overall process. This means that the data is being extracted from the source and loaded to the Data Lake, to finally get transformed in the course of a certain computation.
5.1.3 Semantic Data Lake The Variety is guaranteed by (1) preventing any sort of preprocessing that physically
transforms the original data into a unified format, and (2) enabling the processing of the data in its diversity. The latter can be solved by adopting the unique data model in processing time by mapping the formats of all the needed data in the Data Lake into that unique data model. The Semantic Web approach based on RDF proves its capability to perform such a task, where several mapping languages have already been proposed. By mapping the data into this unique model on the fly, we create a Semantic Layer on top of the traditional Data Lake, creating what we term a Semantic Data Lake.
Figure 14: Semantic Layer on top of Data Lake
Figure 14 illustrates the envisioned Semantic Data Lake. At the bottom we find the data sources. They are classified by their level of semantification into three categories. Sem Data denotes data encoded in an RDF model. Sem-Annotated Data denotes data that is not in RDF form, but has been annotated using ontology terms, e.g., JSON-LD, CSVW, R2RML. Non-Sem Data is data that has no Semantic information attached, e.g. CSV, JSON, XML. Data of the last category has to be lifted by mapping its attributes into ontology terms. This way all the data can form RDF on the fly in processing time.

D3.5 – v. 1.0
Page 28
5.1.4 Data Source A source of data can be a mere file in the file system, e.g., a CSV, JSON or XML file, or a
database with a management system, e.g. MongoDB, Cassandra, HBase. Thus, we generate a data source for any pair of data and functionality interacting with the data. This latter includes any type of processing, e.g., ad hoc querying, machine learning, text processing. Thus, we define a data source as a combination of storage, processing, metadata and input and output interfaces, as shown in Figure 15.
Figure 15: Data Source in a Data Lake
5.1.5 Data Processing in a Semantic Data Lake The data processing is illustrated in Figure 16. The user starts by issuing a query in
SPARQL. During “Source Selection and Query Decomposition” phase, the query is analysed and matched against the existing data using the mapping rules. Several Mapping languages can be used depending on the data type, e.g., R2RML in case of relational-like databases, JSON-LD contexts in case of JSON file. Relevant data sources are as a result identified (Source Selection). Subqueries are formed in a query syntax that the individual data sources understand (Query Decomposition). In “Query Execution” phase, each data source executes the received query and returns a partial result. The final result is formed by consolidating the partial results (Result Reconciliation), e.g., union or join operation.
Figure 16: Workflow in a Semantic Data Lake

D3.5 – v. 1.0
Page 29
Example
Imagine a Data Lake that has among others two data sources: (1) the Storage is a CSV file about car drivers stored in HDFS, and the Processing is a SparkSQL job that runs SQL queries over the CSV file, and (2) the Storage is a MongoDB collection about driven cars in Sharding setup, and the Processing is a Java program that runs MongoDB queries.
Sources = {S1 : Drivers(X, F, L, B, C), S2 : Cars(Y, M, S)} Drivers(D, F, L, B, C) :-
class(X,driver), first_name(X,F), last_name(X,L), birth_day(X,B), driven_car(X,C) Cars(Y, M, S) :- class(Y, car), model(Y,M), Speed(Y,S)
Mappings = {(first_name -> foaf:firstName, S1), (last_name -> foaf:lastName, S1), (driven_car -> ns:drives, S1), (model -> ns:carModel, S2)}
Query = “SELECT ?fn, ?ln, ?cm WHERE {?d foaf:firstName ?fn . ?c foaf:lastName ?ln . ?d ns:drives ?c . ?c ns:carModel ?cm .}”
Figure 17: Example of a query answering in a Semantic Data Lake
During the “Source Selection & Query Decomposition” phase, by visiting the Mappings, sources S1 and S2 are selected among the existing ones; then the query Q is decomposed into two subqueries Q1 and Q2. Q1 is a SQL query generated using the Mappings under the R2RML mapping language. Q2 is a tailored query generated using a set of mappings for MongoDB query language. During Query Execution (Query Execution box is omitted in the figure above to save space), the Processing of each data source is executed. During Results Reconciliation, a JOIN operation on S1.driven_car = S2.ID is executed to get the final results. This procedure is illustrated in Figure 17.
5.2 Semantic Analytics Stack In addition to adapting the correct technologies to create a flexible and generic Big Data
platform, we are also exploring the opportunities to contribute towards the use of Big Data technologies and finding new and interesting applications of these exciting technologies that could help decision makers in improving their analyses.

D3.5 – v. 1.0
Page 30
In addition to the four Vs discussed above, one of the key features of Big Data is its complexity. We can define complexity in different ways. It could be that data is coming from different sources, it could be the same data source representing different aspects of a resource, it could be different data sources representing the same property; this difference in representation, structure, or association makes it difficult to introduce common methodologies or algorithms to learn and predict from different types of data. The state of the art to handle this ambiguity and complexity of data is its representation in the form of Linked Data.
Linked Data is associated to a set of standards for the integration of data and information in addition to searching and querying it. To create linked data, the information represented in unstructured form or referring to other structured or semi-structured representation is mapped to the RDF data model, this process is called extraction. RDF has a very flexible data model consisting of so-called triples (subject, predicate, object) that can be interpreted as a labeled directed edge, s p o with s and o being arbitrary resources and p being the property among these two resources. Thus, a set of RDF triples forms an interlinkable graph whose flexibility allows to represent a large variety of highly to loosely structured datasets. RDF, which was standardized by W3C, is increasingly being adapted to model data in a variety of scenarios, partly due to the popularity of projects like linked open data and schema.org. This linked or semantically annotated data is growing steadily towards a massive scale.
Whilst RDF data is very expressive in representing complex relationships among different objects and mapping their similarities, we generally require a distributed approach to address issues such as fault tolerance, high availability and scalability. Although this analysis applies to all popular data models, e.g., relational, the case of RDF is more involved, due to its graphical nature and its navigational query characterization as well as its inherent support for reasoning services.
In order to deal with the massive data being produced at scale, the existing big data frameworks like Spark and Flink offer fault tolerant, high available and scalable approaches to process massive-sized data sets efficiently. These frameworks have matured over the years and offer a proven and reliable method for the processing of large scale unstructured data.
We have decided to explore the use of these two prominent frameworks for RDF data processing. We are developing a library named Semantic ANalytics StAck (SANSA), that can process massive RDF data at scale and perform learning and prediction for the data. This would be in addition to answering queries from the data. The following section describes the working of SANSA and its key features grouped by each layer of the stack. Although we aim to support both Spark and Flink, our main focus is Spark at the moment; therefore, the following discussion would mainly be in the context of the different features offered by Spark.
Figure 18 depicts the working of the SANSA stack, where RDF layer offers a basic API to read and write native RDF data. On top there are a Querying and Inference layer. Then, we would also offer a machine learning library that could perform several machine learning tasks out of the box on linked RDF data. We examine every layer in more detail in the remainder of this section.

D3.5 – v. 1.0
Page 31
Figure 18: Architecture of SANSA
5.2.1 Read Write Layer The lowest layer on top of the existing frameworks (Spark or Flink) is the read/write layer.
This layer essentially provides the facility to read and write native RDF data from HDFS or local drive and represent it in the native distributed data structures of Spark. In addition, we also require a dedicated serialization mechanism for faster I/O.
We also decided to support the Jena interface API to perform the relevant tasks. This is particularly aimed for usability, as most of the users are already familiar with the interface and it would require lesser time in getting used to the new distributed SANSA stack.
5.2.2 Querying Layer Querying an RDF graph is a major source of information extraction and searching from
the underlying linked data. This is essential to browse, search and explore the structured information available in a fast and user friendly manner.
SPARQL, also known as RDF query language, is the W3C standard for querying RDF graphs. SPARQL is very expressive and allows to extract complex relationships using intelligent and comprehensive SPARQL queries. SPARQL takes the description in the form of a query and returns that information in the form of a set of bindings or an RDF graph.
In order to efficiently answer runtime queries for large RDF data, we are exploring the three representation formats of Spark: RDDs, Spark Data Frames, and Spark GraphX (graph parallel computation). Our aim is to have cross representational transformations for efficient query answering. Our conclusion so far is that the Spark GraphX is not very efficient, due to complex querying related to graph structure. On the other hand, an RDD based representation is efficient for queries like filters or applying a User Defined Function (UDF) on specific

D3.5 – v. 1.0
Page 32
resources. At the same time, we are exploring the use of SparkSQL Data Frames and compare the performance to analyse which representation suits particular type of query answering.
5.2.3 Inference Layer Both RDFS and OWL contain schema information in addition to links between different
resources. This additional information and rules allows to perform reasoning on the knowledge bases in order to infer new knowledge, expanding the existing one.
This layer is relevant to more complex representations like ontologies. An ontology provides shared vocabulary and inference rules to represent domain-specific knowledge. Ontologies are used for the purpose of enabling machines to automatically understand information and infer new knowledge. Therefore, useful ontologies are adapted to represent context for ubiquitous computing and manage knowledge service systems. To efficiently build ontology-based knowledge service systems, management and reasoning for large scale ontologies is desired. One can perform sound and complete reasoning on small ontologies, however it could become very ineffective for very large scale knowledge bases.
Therefore, we want to exploit Spark and Flink for inferencing from large ontologies. The core of the inference process is to continuously apply the schema related rule on the input data to infer new facts. This process is helpful for deriving new facts from the knowledge base, for detecting inconsistencies from the KB, and for extracting new rules to help in reasoning. Rule describing general regularity can help us to understand the data better. We have developed a prototype inference engine and are working towards its refinement and performance enhancement.
5.2.4 Machine Learning Layer In addition to above mentioned tasks, one of the very important tasks for any data is to
perform machine learning or analytics to gain insights of the data for relevant trends, predictions or detection of anomalies.
There exist a wide range of machine learning algorithms for the structured data. However, the challenging task would be to distribute the data and to devise distributed versions of these algorithms to fully exploit the underlying frameworks. We are exploring different algorithms namely, tensor factorization, association rule mining, decision trees and clustering on structured data. The aim would be to provide out-of-the-box algorithms to work with the structured data in a distributed, fault tolerant and resilient fashion.
SANSA is a research-work in progress, where we are exploring existing efforts towards Big RDF processing frameworks, and aim to build a generic stack, which can work with large sized Linked Data, offering fast performance in addition to working as an out-of-the-box framework for scalable and distributed semantic data analysis.

D3.5 – v. 1.0
Page 33
6. Conclusion This deliverable concludes WP3. The platform profiles per V (Volume, Velocity, Variety,
Veracity) as presented in D3.2, are weakened. Instead of providing a platform out-of-the-box per V, we will provide suggestions for components per V. In practice, each pilot implementation will consist of a mix of components tackling multiple Vs.
The platform architecture mainly focuses on two aspects: ease-of-use and flexibility. A user should be able to develop and deploy a Big Data pipeline with little effort. At the same time, the platform needs to be flexible to embrace future changes in the fast moving space of Big Data. Compared to the platform architecture presented in D3.3, the platform has been subject to changes. The removal of Mesos is the most important one. Docker Swarm is now used as the only tool to deploy applications on the platform.
On top of Docker Swarm we provide a support layer. This layer aims to lower the barrier to use Big Data technologies and to facilitate the usage of the BDE platform. It implements features for which there is no commonly accepted solution in the community (yet). The platform also provides Docker templates and GUIs. The templates are base Docker images which can be extended with a custom algorithm or data with minimal effort. The GUIs (pipeline monitor, integrator UI, Swarm UI) serve different purposes but each of them facilitates the development, deployment and monitoring of applications on the BDE platform
The architecture, user interfaces and semantification presented in this deliverable, are being implemented in WP4. The supported components, be it existing technologies or custom developed components, will be used in the pipelines to implement the pilot cases defined in WP5. Even though WP3 ends at M18, we will continuously follow up the evolution of the technologies used in the BDE platform. This covers technologies used in the pilot cases as well as in the base platform. The outcome may be new components entering the platform or diminishing support for existing components.
This deliverable also describes the current state of the platform semantification, a recurring requirement by some SCs. The semantification is not part of the core platform architecture. It is a feature that can optionally be included in an application. The semantification is exploited in two perspectives in BDE: a semantic data lake and a semantic analytics stack. Both are work in progress. The effort on this subject will be continued in WP4 and WP5.

D3.5 – v. 1.0
Page 34
7. References
[1] Big Data Europe, “WP3 Deliverable 3.3: Big Data Integrator Deployment and Component Interface Specification,” Big Data Europe, 2015.
[2] Big Data Europe, “WP3 Deliverable 3.2: Technical Requirements Specification and Big Data Integrator Architectural Design I,” Big Data Europe, 2015.
[3] Big Data Europe, “WP2 Deliverable 2.12: Community-Driven Big Data Requirements II,” Big Data Europe, 2015.
[4] Big Data Europe, “WP5 Deliverable 5.2: Domain-Specific Big Data Integrator Instances I,” Big Data Europe, 2016.
[5] Big Data Europe, “WP4 Deliverable 3.4: Assessment on Application of Generic Data Management Technologies II,” Big Data Europe, 2016.
[6] Big Data Europe, “BDE GitHub Wiki: Installation,” [Online]. Available: https://github.com/big-data-europe/README/wiki/Installation. [Accessed 27 07 2016].
[7] Big Data Europe, “HOWTO install the BDE platform?,” 04 05 2016. [Online]. Available: https://www.big-data-europe.eu/howto-install-the-bde-platform/. [Accessed 27 07 2016].
[8] Docker Core Engineering, “Docker 1.10: New Compose File, Improved Security, Networking And Much More!,” 04 02 2016. [Online]. Available: https://blog.docker.com/2016/02/docker-1-10/. [Accessed 27 07 2016].
[9] “Docker Compose issue #374: Is there a way to delay container startup to support dependant services with a longer startup time,” 05 08 2014. [Online]. Available: https://github.com/docker/compose/issues/374. [Accessed 27 07 2016].
[10] Big Data Europe, “WP3 Deliverable 3.1: Assessment on Application of Generic Data Management Technologies I,” 2015.