deliverable d1.2.2 error analysis in near miss translations - qt21.eu
TRANSCRIPT
This document is part of the Coordination and Support Action “Preparation and Launch of a Large-scale Action for Quality Translation Technology (QTLaunchPad)”, funded by the 7th Framework Programme of the European Commission through the contract 296347.
Deliverable D 1.2.2
Error Analysis in Near Miss Translations
Author(s): Aljoscha Burchardt, Arle Lommel, Maja Popovic
Dissemination Level: Public
Date: 07.08.2013
Preparation and Launch of a Large-scale Action for Quality Translation Technology D1.2.2 Error Analysis in Near Miss Translations
2
Grant agreement no. 296347 Project acronym QTLaunchPad Project full title Preparation and Launch of a Large-scale Action for Quality Transla-
tion Technology Funding scheme Coordination and Support Action Coordinator Prof. Hans Uszkoreit (DFKI) Start date, duration 1 July 2012, 24 months Distribution Public Contractual date of delivery Actual date of delivery August 2013 Deliverable number 1.2.2 Deliverable title Error analysis in near miss translations Type Report Status and version Number of pages Contributing partners USFD WP leader DFKI Task leader DFKI Authors Aljoscha Burchardt, Arle Lommel, Maja Popovic EC project officer Aleksandra Wesolowska The partners in QTLaunchPad are:
Deutsches Forschungszentrum für Künstliche Intelligenz (DFKI), Germany
Dublin City University (DCU), Ireland Institute for Language and Speech Processing, R.C. “Athena”
(ILSP/ATHENA RC), Greece The University of Sheffield (USFD), United Kingdom
For copies of reports, updates on project activities and other QTLaunchPad-related information, con-tact:
DFKI GmbH QTLaunchPad Dr. Aljoscha Burchardt [email protected] Alt-Moabit 91c Phone: +49 (30) 23895-1838 10559 Berlin, Germany Fax: +49 (30) 23895-1810
Copies of reports and other material can also be accessed via http://www.qt21.eu/launchpad
© 2013, The Individual Authors No part of this document may be reproduced or transmitted in any form, or by any means, electronic or mechanical, including photocopy, recording, or any information storage and retrieval system, with-out permission from the copyright owner.
Preparation and Launch of a Large-scale Action for Quality Translation Technology D1.2.2 Error Analysis in Near Miss Translations
3
1 Table of Contents 1 Table of Contents ........................................................................................................ 3
2 Executive Summary ..................................................................................................... 4
3 Introduction ................................................................................................................ 4
4 Analysis of Edit Operations using Automatic Tools ....................................................... 5
4.1 Part of speech distribution of error classes .................................................................................. 6
5 Analysis of Pilot Error Corpus ....................................................................................... 8
5.1 Automatic analysis of post-‐edit operations .................................................................................. 8
5.2 Analysis of Manual Annotation ..................................................................................................... 9
5.3 Comparison to edit distance ....................................................................................................... 12
5.4 Error clustering ........................................................................................................................... 14
6 Ongoing Work ........................................................................................................... 16
7 References ................................................................................................................ 18
Preparation and Launch of a Large-scale Action for Quality Translation Technology D1.2.2 Error Analysis in Near Miss Translations
4
2 Executive Summary This Deliverable is one of the outcomes of Task 1.2 “Error analysis in near miss translations”. It contains results of analysis of translation errors in the corpus collected in D1.2.1, i.e. near-ly acceptable translated sentences. Central goals of this task are to:
1. estimate the distribution of different post-editing operations performed on the sen-tences of different quality levels using automatic tools
2. identify error classes which are dominant in almost acceptable translations 3. determine if particular error classes typify certain translation approaches (statisti-
cal, rule-based, etc.)
The analysis finds that there are observable differences between rule-based machine trans-lation (RbMT) and statistical machine translation (SMT) in terms of the types of errors pro-duced by each. In additional, preliminary results indicate that certain error types tend to cooccur in MT output, allowing a degree of prediction of overall quality based on a limited subset. Unfortunately, the relatively small pilot corpus produced in D1.2.1 does not permit a statistically significant analysis of clustering of human-annotated errors so confirmation of the findings in this deliverable will require analysis of a larger corpus. Instead, this delivera-ble highlights the methods that will be used to measure larger corpora developed in the se-cond year of QTLaunchPad.
3 Introduction Post-editing operations were analyzed using Hjerson [Popović 2011], an automatic tool for error analysis, which provides a rough categorization into five classes:
● word form (agreement errors, some capitalization, and part of speech) ● word order ● omission ● addition ● lexical error (mistranslations, terminology errors, style, punctuation, and any
changes to wording) The results are available in the form of raw counts for each edit operation as well as in the form of edit rates, i.e. the raw count normalized over the total number of words in the given translation output. Automatic analysis of edit operations has been performed on various parts of error corpus (Deliverable 1.2.1) containing post-edited versions of original translation outputs. Manual analysis of MQM error classes has been performed on the pilot error corpus de-scribed in Deliverable 1.2.1.
Preparation and Launch of a Large-scale Action for Quality Translation Technology D1.2.2 Error Analysis in Near Miss Translations
5
4 Analysis of Edit Operations using Automatic Tools The first step of error analysis was carried out on the French-to-English and English-to-Spanish translation outputs described in [Specia 2011] as well as English-to-Spanish data used for training in the Quality Estimation shared task 2013 [Callison-Burch et al 2012]. For each sentence in the 2011 corpora, a human annotator assigned one of four quality levels: “acceptable”, “almost acceptable”, “still editable,” and “bad,” defined as follows:
● bad – requires complete retranslation ● still editable – requires significant post-editing, but post-editing is still quicker
than retranslation ● almost acceptable – very little post editing needed. (This category is what is
termed “near miss” in QTLaunchPad) ● acceptable – fit for purpose
For analysis of the 2013 corpus, category definitions were revised and a fifth quality class added:
● bad – the MT output is incomprehensible, with little or no information transferred accurately. It cannot be edited, needs to be translated from scratch.
● still editable – about 50–70% of the MT output needs to be edited. It requires a significant editing effort in order to reach publishable level.
● editable – about 25–50% of the MT output needs to be edited. ● almost acceptable – about 10–25% of the MT output needs to be edited. It is
generally clear and intelligible. ● acceptable – the MT output is perfectly clear and intelligible.
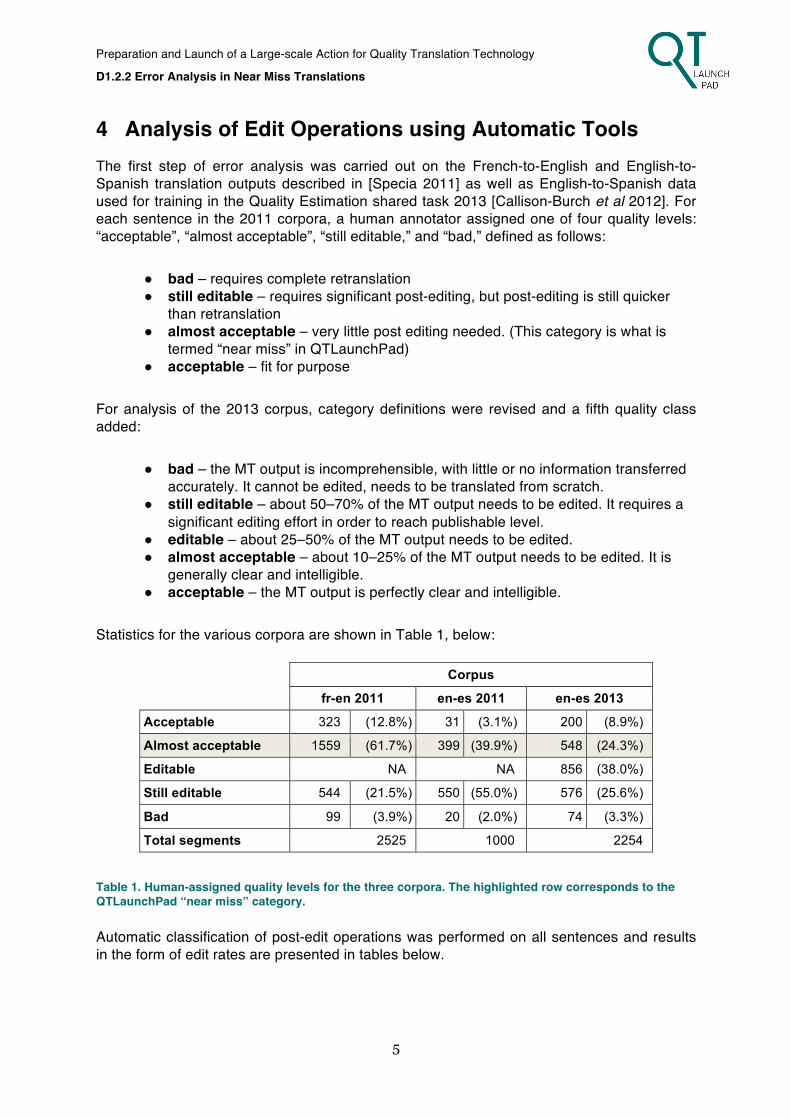
Statistics for the various corpora are shown in Table 1, below:
Corpus
fr-en 2011 en-es 2011 en-es 2013
Acceptable 323 (12.8%) 31 (3.1%) 200 (8.9%)
Almost acceptable 1559 (61.7%) 399 (39.9%) 548 (24.3%)
Editable NA NA 856 (38.0%)
Still editable 544 (21.5%) 550 (55.0%) 576 (25.6%)
Bad 99 (3.9%) 20 (2.0%) 74 (3.3%)
Total segments 2525 1000 2254
Table 1. Human-assigned quality levels for the three corpora. The highlighted row corresponds to the QTLaunchPad “near miss” category. Automatic classification of post-edit operations was performed on all sentences and results in the form of edit rates are presented in tables below.
Preparation and Launch of a Large-scale Action for Quality Translation Technology D1.2.2 Error Analysis in Near Miss Translations
6
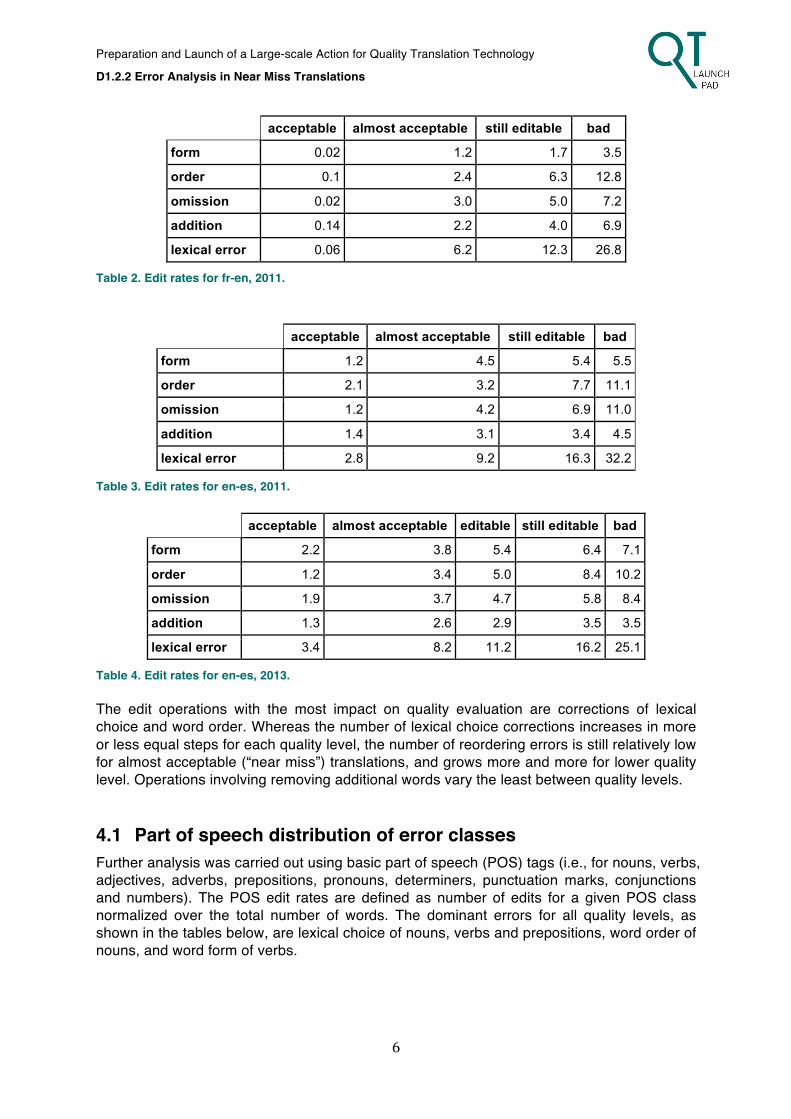
acceptable almost acceptable still editable bad
form 0.02 1.2 1.7 3.5
order 0.1 2.4 6.3 12.8
omission 0.02 3.0 5.0 7.2
addition 0.14 2.2 4.0 6.9
lexical error 0.06 6.2 12.3 26.8
Table 2. Edit rates for fr-en, 2011.
acceptable almost acceptable still editable bad
form 1.2 4.5 5.4 5.5
order 2.1 3.2 7.7 11.1
omission 1.2 4.2 6.9 11.0
addition 1.4 3.1 3.4 4.5
lexical error 2.8 9.2 16.3 32.2
Table 3. Edit rates for en-es, 2011.
acceptable almost acceptable editable still editable bad
form 2.2 3.8 5.4 6.4 7.1
order 1.2 3.4 5.0 8.4 10.2
omission 1.9 3.7 4.7 5.8 8.4
addition 1.3 2.6 2.9 3.5 3.5
lexical error 3.4 8.2 11.2 16.2 25.1
Table 4. Edit rates for en-es, 2013. The edit operations with the most impact on quality evaluation are corrections of lexical choice and word order. Whereas the number of lexical choice corrections increases in more or less equal steps for each quality level, the number of reordering errors is still relatively low for almost acceptable (“near miss”) translations, and grows more and more for lower quality level. Operations involving removing additional words vary the least between quality levels.
4.1 Part of speech distribution of error classes Further analysis was carried out using basic part of speech (POS) tags (i.e., for nouns, verbs, adjectives, adverbs, prepositions, pronouns, determiners, punctuation marks, conjunctions and numbers). The POS edit rates are defined as number of edits for a given POS class normalized over the total number of words. The dominant errors for all quality levels, as shown in the tables below, are lexical choice of nouns, verbs and prepositions, word order of nouns, and word form of verbs.

Preparation and Launch of a Large-scale Action for Quality Translation Technology D1.2.2 Error Analysis in Near Miss Translations
7
acceptable almost acceptable
still editable
bad
lexical error nouns 0.04 1.8 3.7 7.1
verbs 0 1.2 2.5 4.8
prepositions 0.02 0.8 1.6 3.4
word order nouns 0.06 1.1 2.5 4.7
word form verbs 0.02 0.7 1.0 1.8
Table 5. POS edit rates for fr-en, 2011
acceptable almost acceptable
still editable
bad
lexical error nouns 0.9 2.4 5.0 10.4
verbs 0.7 2.9 4.5 8.0
prepositions 0.5 1.4 2.3 5.9
word order nouns 1.2 1.2 3.0 4.5
word form verbs 0.7 2.1 2.1 2.1
Table 6. POS edit rates for en-es, 2011
acceptable almost acceptable
editable still editable
bad
lexical error nouns 1.2 2.4 3.6 5.7 9.8
verbs 0.7 2.2 2.8 3.9 5.8
prepositions 0.6 1.1 1.4 1.9 3.0
word order nouns 0.4 1.3 1.9 3.0 3.8
word form verbs 0.9 1.7 2.4 2.6 2.3
Table 7. POS edit rates for en-es, 2013.
These errors correspond roughly to the following MQM issue types, as used in the pilot cor-pus (described below)
• lexical errors: o nouns: Mistranslation, Terminology o verbs: Mistranslation o prepositions: Function words
• word order: o nouns: Word order
• word form o verbs: Grammar, Agreement
Preparation and Launch of a Large-scale Action for Quality Translation Technology D1.2.2 Error Analysis in Near Miss Translations
8
Although precise assignment from one automatic category to a single MQM issue type is not possible given differences in granularity and between automatic detection and human judg-ment, these automatic measures provide one way to check the results of MQM (and vice versa) since the distributions should at least agree with each other.
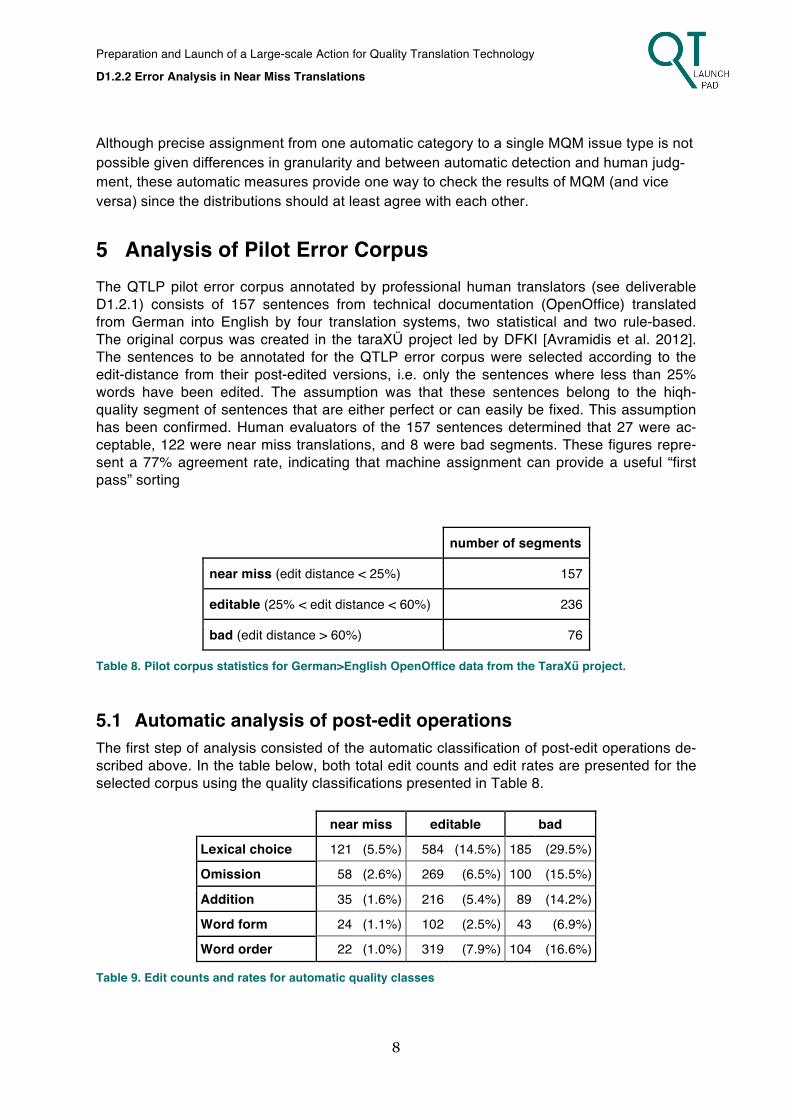
5 Analysis of Pilot Error Corpus The QTLP pilot error corpus annotated by professional human translators (see deliverable D1.2.1) consists of 157 sentences from technical documentation (OpenOffice) translated from German into English by four translation systems, two statistical and two rule-based. The original corpus was created in the taraXÜ project led by DFKI [Avramidis et al. 2012]. The sentences to be annotated for the QTLP error corpus were selected according to the edit-distance from their post-edited versions, i.e. only the sentences where less than 25% words have been edited. The assumption was that these sentences belong to the hiqh-quality segment of sentences that are either perfect or can easily be fixed. This assumption has been confirmed. Human evaluators of the 157 sentences determined that 27 were ac-ceptable, 122 were near miss translations, and 8 were bad segments. These figures repre-sent a 77% agreement rate, indicating that machine assignment can provide a useful “first pass” sorting
number of segments
near miss (edit distance < 25%) 157
editable (25% < edit distance < 60%) 236
bad (edit distance > 60%) 76
Table 8. Pilot corpus statistics for German>English OpenOffice data from the TaraXű project.
5.1 Automatic analysis of post-edit operations The first step of analysis consisted of the automatic classification of post-edit operations de-scribed above. In the table below, both total edit counts and edit rates are presented for the selected corpus using the quality classifications presented in Table 8.
near miss editable bad
Lexical choice 121 (5.5%) 584 (14.5%) 185 (29.5%)
Omission 58 (2.6%) 269 (6.5%) 100 (15.5%)
Addition 35 (1.6%) 216 (5.4%) 89 (14.2%)
Word form 24 (1.1%) 102 (2.5%) 43 (6.9%)
Word order 22 (1.0%) 319 (7.9%) 104 (16.6%)
Table 9. Edit counts and rates for automatic quality classes
Preparation and Launch of a Large-scale Action for Quality Translation Technology D1.2.2 Error Analysis in Near Miss Translations
9
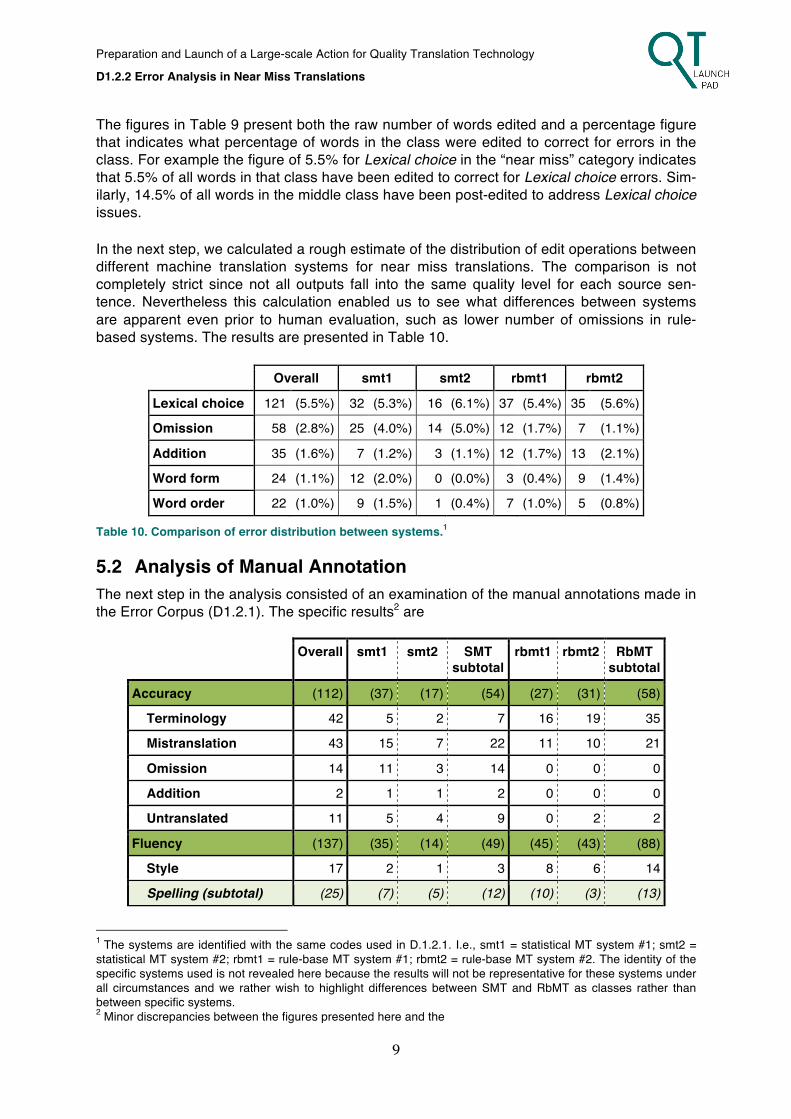
The figures in Table 9 present both the raw number of words edited and a percentage figure that indicates what percentage of words in the class were edited to correct for errors in the class. For example the figure of 5.5% for Lexical choice in the “near miss” category indicates that 5.5% of all words in that class have been edited to correct for Lexical choice errors. Sim-ilarly, 14.5% of all words in the middle class have been post-edited to address Lexical choice issues. In the next step, we calculated a rough estimate of the distribution of edit operations between different machine translation systems for near miss translations. The comparison is not completely strict since not all outputs fall into the same quality level for each source sen-tence. Nevertheless this calculation enabled us to see what differences between systems are apparent even prior to human evaluation, such as lower number of omissions in rule-based systems. The results are presented in Table 10.
Overall smt1 smt2 rbmt1 rbmt2
Lexical choice 121 (5.5%) 32 (5.3%) 16 (6.1%) 37 (5.4%) 35 (5.6%)
Omission 58 (2.8%) 25 (4.0%) 14 (5.0%) 12 (1.7%) 7 (1.1%)
Addition 35 (1.6%) 7 (1.2%) 3 (1.1%) 12 (1.7%) 13 (2.1%)
Word form 24 (1.1%) 12 (2.0%) 0 (0.0%) 3 (0.4%) 9 (1.4%)
Word order 22 (1.0%) 9 (1.5%) 1 (0.4%) 7 (1.0%) 5 (0.8%)
Table 10. Comparison of error distribution between systems.1
5.2 Analysis of Manual Annotation The next step in the analysis consisted of an examination of the manual annotations made in the Error Corpus (D1.2.1). The specific results2 are
Overall smt1 smt2 SMT subtotal
rbmt1 rbmt2 RbMT subtotal
Accuracy (112) (37) (17) (54) (27) (31) (58)
Terminology 42 5 2 7 16 19 35
Mistranslation 43 15 7 22 11 10 21
Omission 14 11 3 14 0 0 0
Addition 2 1 1 2 0 0 0
Untranslated 11 5 4 9 0 2 2
Fluency (137) (35) (14) (49) (45) (43) (88)
Style 17 2 1 3 8 6 14
Spelling (subtotal) (25) (7) (5) (12) (10) (3) (13)
1 The systems are identified with the same codes used in D.1.2.1. I.e., smt1 = statistical MT system #1; smt2 = statistical MT system #2; rbmt1 = rule-base MT system #1; rbmt2 = rule-base MT system #2. The identity of the specific systems used is not revealed here because the results will not be representative for these systems under all circumstances and we rather wish to highlight differences between SMT and RbMT as classes rather than between specific systems. 2 Minor discrepancies between the figures presented here and the
Preparation and Launch of a Large-scale Action for Quality Translation Technology D1.2.2 Error Analysis in Near Miss Translations
10
Overall smt1 smt2 SMT subtotal
rbmt1 rbmt2 RbMT subtotal
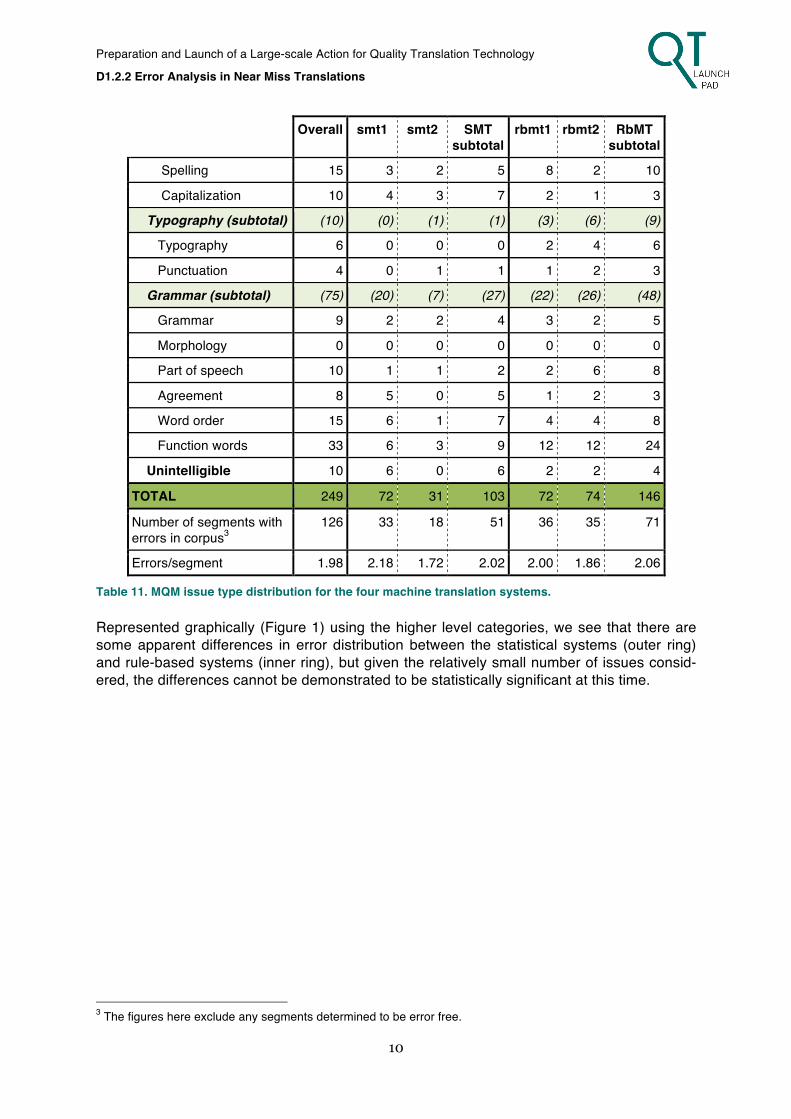
Spelling 15 3 2 5 8 2 10
Capitalization 10 4 3 7 2 1 3
Typography (subtotal) (10) (0) (1) (1) (3) (6) (9)
Typography 6 0 0 0 2 4 6
Punctuation 4 0 1 1 1 2 3
Grammar (subtotal) (75) (20) (7) (27) (22) (26) (48)
Grammar 9 2 2 4 3 2 5
Morphology 0 0 0 0 0 0 0
Part of speech 10 1 1 2 2 6 8
Agreement 8 5 0 5 1 2 3
Word order 15 6 1 7 4 4 8
Function words 33 6 3 9 12 12 24
Unintelligible 10 6 0 6 2 2 4
TOTAL 249 72 31 103 72 74 146
Number of segments with errors in corpus3
126 33 18 51 36 35 71
Errors/segment 1.98 2.18 1.72 2.02 2.00 1.86 2.06
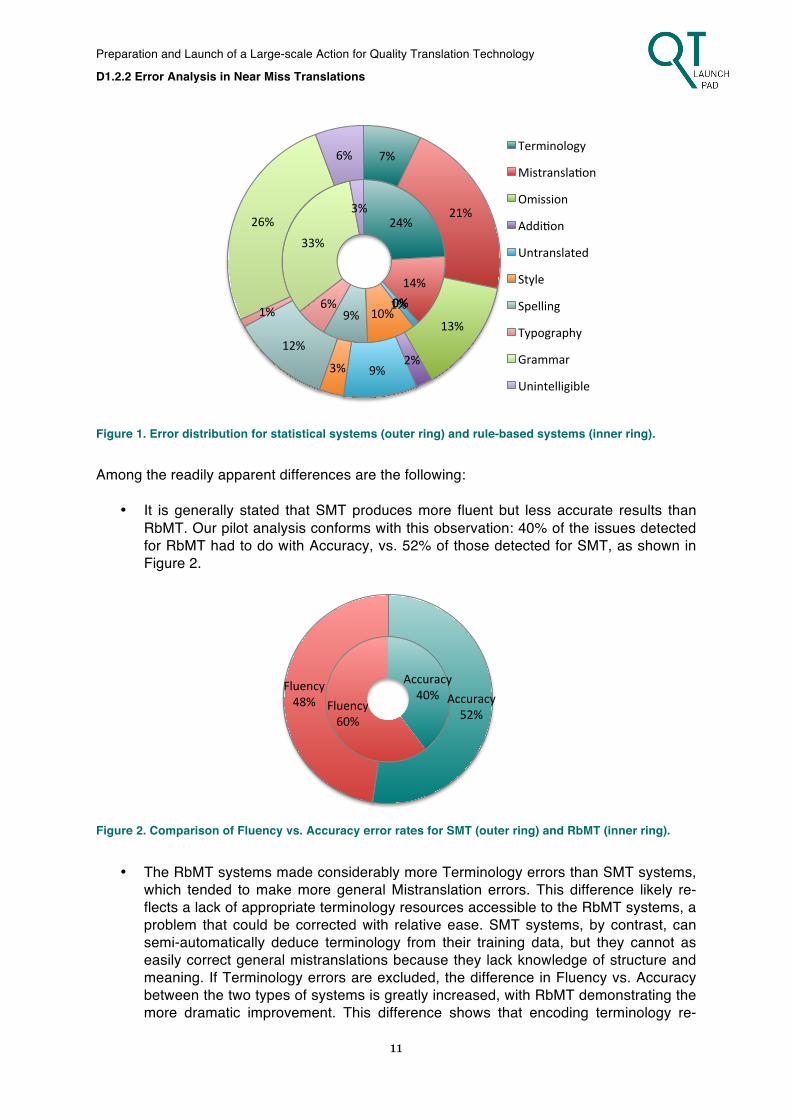
Table 11. MQM issue type distribution for the four machine translation systems. Represented graphically (Figure 1) using the higher level categories, we see that there are some apparent differences in error distribution between the statistical systems (outer ring) and rule-based systems (inner ring), but given the relatively small number of issues consid-ered, the differences cannot be demonstrated to be statistically significant at this time.
3 The figures here exclude any segments determined to be error free.
Preparation and Launch of a Large-scale Action for Quality Translation Technology D1.2.2 Error Analysis in Near Miss Translations
11
Figure 1. Error distribution for statistical systems (outer ring) and rule-based systems (inner ring).
Among the readily apparent differences are the following:
• It is generally stated that SMT produces more fluent but less accurate results than RbMT. Our pilot analysis conforms with this observation: 40% of the issues detected for RbMT had to do with Accuracy, vs. 52% of those detected for SMT, as shown in Figure 2.
Figure 2. Comparison of Fluency vs. Accuracy error rates for SMT (outer ring) and RbMT (inner ring).
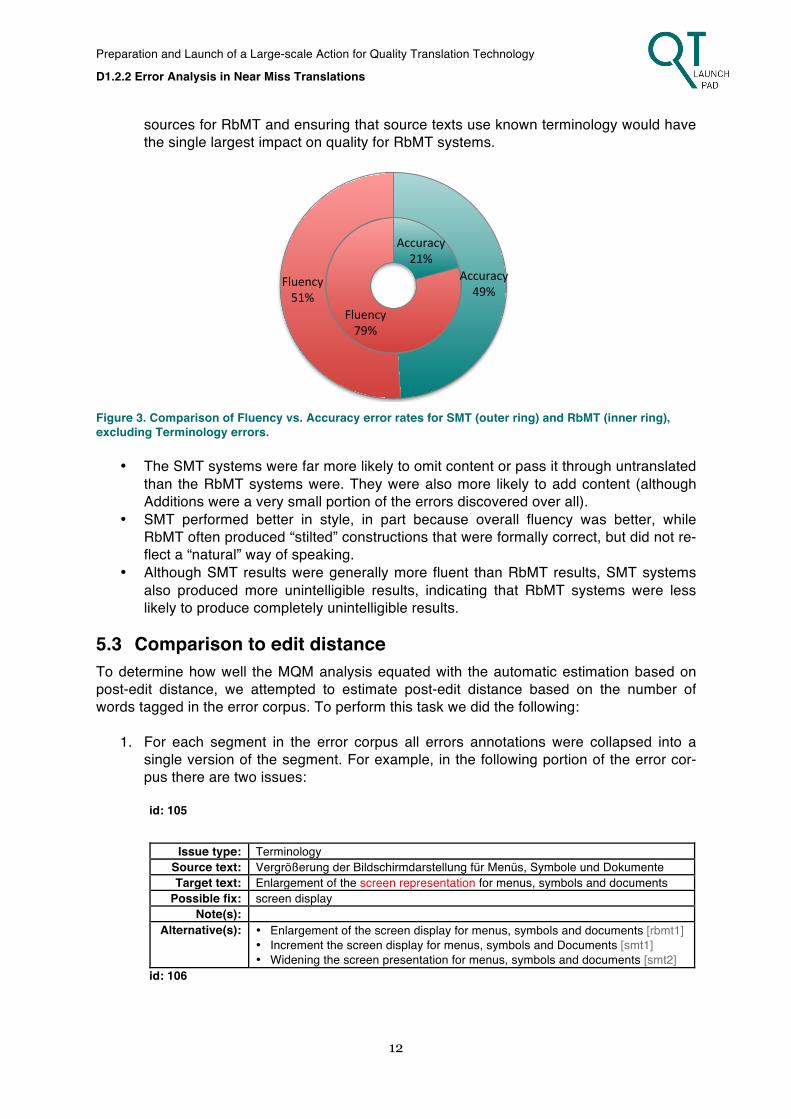
• The RbMT systems made considerably more Terminology errors than SMT systems, which tended to make more general Mistranslation errors. This difference likely re-flects a lack of appropriate terminology resources accessible to the RbMT systems, a problem that could be corrected with relative ease. SMT systems, by contrast, can semi-automatically deduce terminology from their training data, but they cannot as easily correct general mistranslations because they lack knowledge of structure and meaning. If Terminology errors are excluded, the difference in Fluency vs. Accuracy between the two types of systems is greatly increased, with RbMT demonstrating the more dramatic improvement. This difference shows that encoding terminology re-
24%
14% 0% 0% 1%
10% 9% 6%
33%
3%
7%
21%
13%
2% 9% 3%
12%
1%
26%
6% Terminology
MistranslaHon
Omission
AddiHon
Untranslated
Style
Spelling
Typography
Grammar
Unintelligible
Accuracy 40%
Fluency 60%
Accuracy 52%
Fluency 48%
Preparation and Launch of a Large-scale Action for Quality Translation Technology D1.2.2 Error Analysis in Near Miss Translations
12
sources for RbMT and ensuring that source texts use known terminology would have the single largest impact on quality for RbMT systems.
Figure 3. Comparison of Fluency vs. Accuracy error rates for SMT (outer ring) and RbMT (inner ring), excluding Terminology errors.
• The SMT systems were far more likely to omit content or pass it through untranslated
than the RbMT systems were. They were also more likely to add content (although Additions were a very small portion of the errors discovered over all).
• SMT performed better in style, in part because overall fluency was better, while RbMT often produced “stilted” constructions that were formally correct, but did not re-flect a “natural” way of speaking.
• Although SMT results were generally more fluent than RbMT results, SMT systems also produced more unintelligible results, indicating that RbMT systems were less likely to produce completely unintelligible results.
5.3 Comparison to edit distance To determine how well the MQM analysis equated with the automatic estimation based on post-edit distance, we attempted to estimate post-edit distance based on the number of words tagged in the error corpus. To perform this task we did the following:
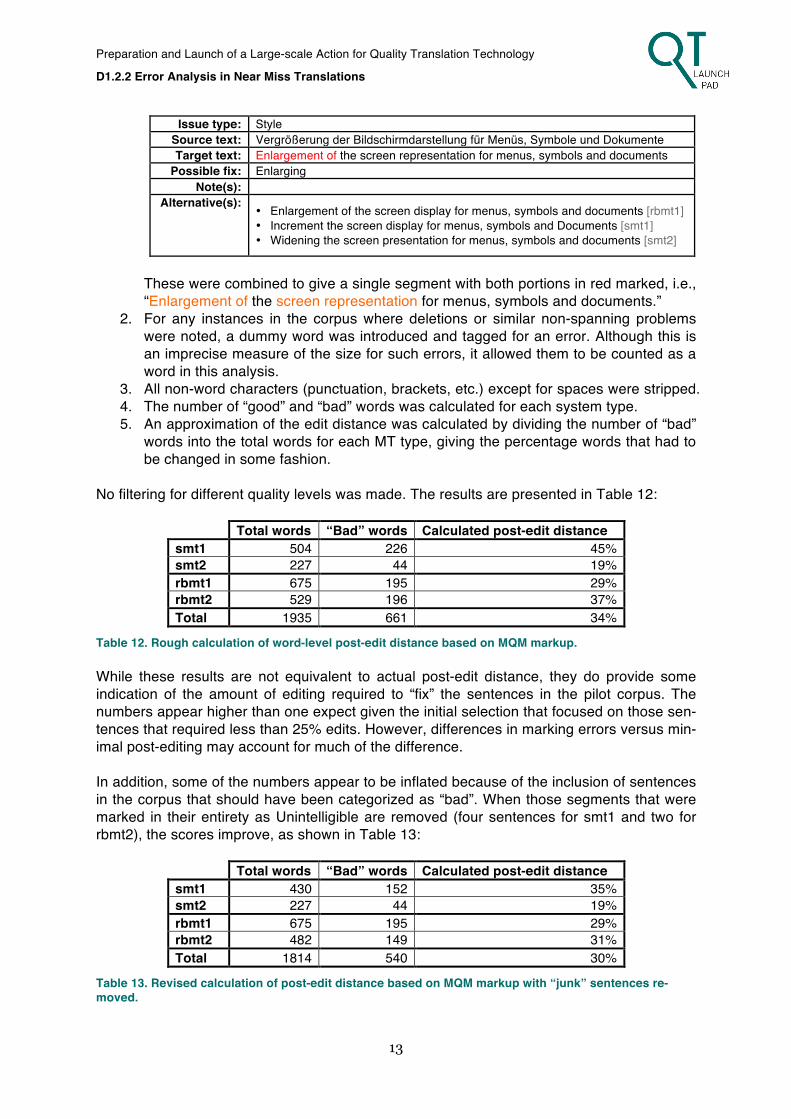
1. For each segment in the error corpus all errors annotations were collapsed into a single version of the segment. For example, in the following portion of the error cor-pus there are two issues:
id: 105
Issue type: Terminology Source text: Vergrößerung der Bildschirmdarstellung für Menüs, Symbole und Dokumente Target text: Enlargement of the screen representation for menus, symbols and documents
Possible fix: screen display Note(s):
Alternative(s): • Enlargement of the screen display for menus, symbols and documents [rbmt1] • Increment the screen display for menus, symbols and Documents [smt1] • Widening the screen presentation for menus, symbols and documents [smt2]
id: 106
Accuracy 21%
Fluency 79%
Accuracy 49%
Fluency 51%
Preparation and Launch of a Large-scale Action for Quality Translation Technology D1.2.2 Error Analysis in Near Miss Translations
13
Issue type: Style Source text: Vergrößerung der Bildschirmdarstellung für Menüs, Symbole und Dokumente Target text: Enlargement of the screen representation for menus, symbols and documents
Possible fix: Enlarging Note(s):
Alternative(s): • Enlargement of the screen display for menus, symbols and documents [rbmt1] • Increment the screen display for menus, symbols and Documents [smt1] • Widening the screen presentation for menus, symbols and documents [smt2]
These were combined to give a single segment with both portions in red marked, i.e., “Enlargement of the screen representation for menus, symbols and documents.”
2. For any instances in the corpus where deletions or similar non-spanning problems were noted, a dummy word was introduced and tagged for an error. Although this is an imprecise measure of the size for such errors, it allowed them to be counted as a word in this analysis.
3. All non-word characters (punctuation, brackets, etc.) except for spaces were stripped. 4. The number of “good” and “bad” words was calculated for each system type. 5. An approximation of the edit distance was calculated by dividing the number of “bad”
words into the total words for each MT type, giving the percentage words that had to be changed in some fashion.
No filtering for different quality levels was made. The results are presented in Table 12:
Total words “Bad” words Calculated post-edit distance smt1 504 226 45% smt2 227 44 19% rbmt1 675 195 29% rbmt2 529 196 37% Total 1935 661 34%
Table 12. Rough calculation of word-level post-edit distance based on MQM markup. While these results are not equivalent to actual post-edit distance, they do provide some indication of the amount of editing required to “fix” the sentences in the pilot corpus. The numbers appear higher than one expect given the initial selection that focused on those sen-tences that required less than 25% edits. However, differences in marking errors versus min-imal post-editing may account for much of the difference. In addition, some of the numbers appear to be inflated because of the inclusion of sentences in the corpus that should have been categorized as “bad”. When those segments that were marked in their entirety as Unintelligible are removed (four sentences for smt1 and two for rbmt2), the scores improve, as shown in Table 13:
Total words “Bad” words Calculated post-edit distance smt1 430 152 35% smt2 227 44 19% rbmt1 675 195 29% rbmt2 482 149 31% Total 1814 540 30%
Table 13. Revised calculation of post-edit distance based on MQM markup with “junk” sentences re-moved.
Preparation and Launch of a Large-scale Action for Quality Translation Technology D1.2.2 Error Analysis in Near Miss Translations
14
These changes bring all of the figures into a more reasonable approximation of the original automatic assessment and confirm that the MQM-based error markup approach is at least roughly congruent with the automatic assessment. We anticipate that additional clean-up of the corpus would yield further improvement in the scores, as would using cleaner source material.
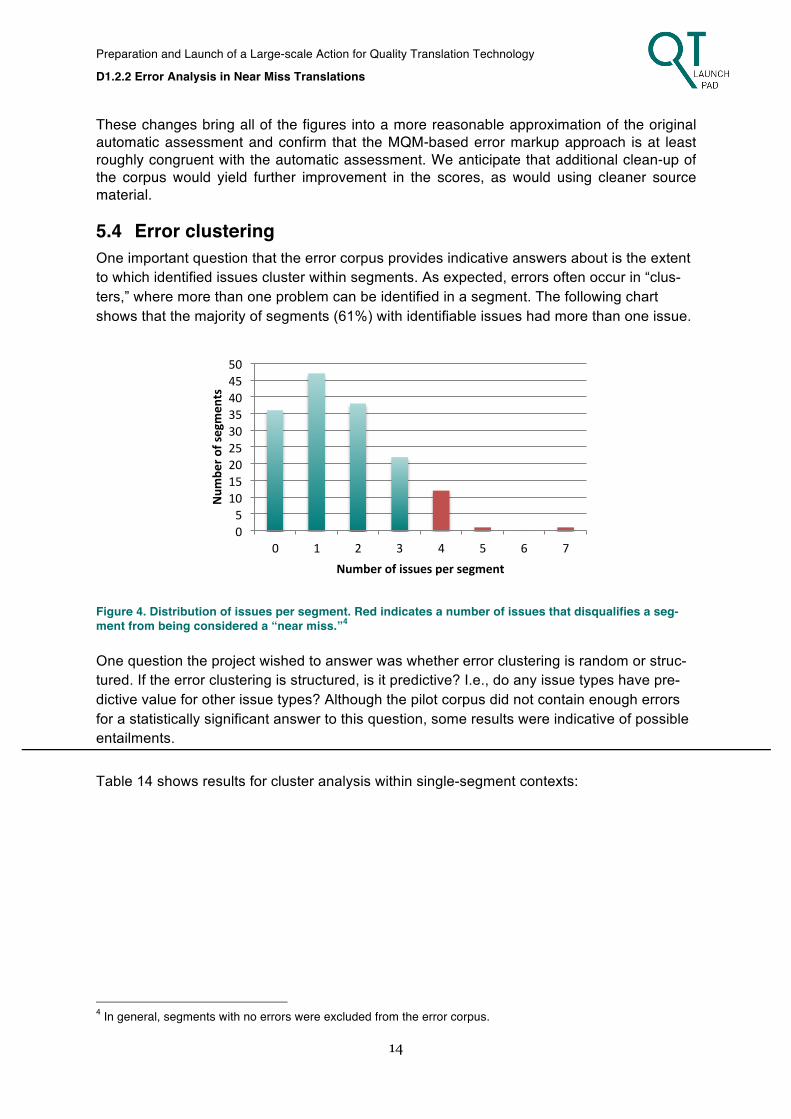
5.4 Error clustering One important question that the error corpus provides indicative answers about is the extent to which identified issues cluster within segments. As expected, errors often occur in “clus-ters,” where more than one problem can be identified in a segment. The following chart shows that the majority of segments (61%) with identifiable issues had more than one issue.
Figure 4. Distribution of issues per segment. Red indicates a number of issues that disqualifies a seg-ment from being considered a “near miss.”4
One question the project wished to answer was whether error clustering is random or struc-tured. If the error clustering is structured, is it predictive? I.e., do any issue types have pre-dictive value for other issue types? Although the pilot corpus did not contain enough errors for a statistically significant answer to this question, some results were indicative of possible entailments.
Table 14 shows results for cluster analysis within single-segment contexts:
4 In general, segments with no errors were excluded from the error corpus.
0 5 10 15 20 25 30 35 40 45 50
0 1 2 3 4 5 6 7
Num
ber o
f segmen
ts
Number of issues per segment

This document is part of the Coordination and Support Action “Preparation and Launch of a Large-scale Action for Quality Translation Technology (QTLaunchPad)”, funded by the 7th Framework Programme of the European Commission through the contract 296347.
Te
rm
ino
log
y
Mis
tra
ns
latio
n
Om
iss
ion
Ad
dit
ion
Un
tra
ns
late
d
Sty
le
Sp
ell
ing
Ca
pit
ali
za
tio
n
Ty
po
gra
ph
y
Pu
nc
tu
atio
n
Gra
mm
ar
Mo
rp
ho
log
y
Pa
rt o
f s
pe
ec
h
Ag
re
em
en
t
Wo
rd
o
rd
er
Fu
nc
tio
n w
ord
s
Un
inte
llig
ible
42 43 14 2 11 16 15 11 6 4 9 0 10 8 15 32 10
Terminology 42 — 24% 10% 0% 5% 17% 7% 0% 10% 5% 0% 0% 2% 5% 14% 21% 0%
Mistranslat ion 43 23% — 12% 2% 9% 12% 7% 14% 2% 0% 9% 0% 5% 5% 5% 23% 2%
Omission 14 21% 36% — 7% 7% 0% 14% 7% 0% 7% 7% 0% 0% 7% 36% 21% 14%
Addit ion 2 0% 50% 50% — 0% 0% 0% 0% 0% 0% 0% 0% 0% 0% 50% 50% 0%
Untranslated 11 18% 27% 9% 0% — 9% 0% 9% 0% 0% 0% 0% 0% 0% 18% 9% 0%
Style 16 44% 25% 0% 0% 6% — 6% 0% 6% 6% 6% 0% 6% 0% 13% 13% 0%
Spel l ing 15 20% 20% 13% 0% 0% 13% — 7% 7% 0% 0% 0% 13% 20% 7% 7% 7%
Capital izat ion 11 0% 55% 9% 0% 9% 0% 9% — 0% 0% 9% 0% 0% 0% 0% 18% 0%
Typography 6 100% 17% 0% 0% 0% 33% 17% 0% — 0% 0% 0% 0% 0% 0% 0% 0%
Punctuat ion 4 50% 0% 25% 0% 0% 25% 0% 0% 0% — 0% 0% 0% 0% 25% 75% 0%
Grammar 9 0% 44% 11% 0% 0% 11% 0% 11% 0% 0% — 0% 22% 0% 11% 22% 0%
Morphology 0 — — — — — — — — — — — — — — — — —
Part of speech 10 10% 20% 0% 0% 0% 10% 20% 0% 0% 0% 20% 0% — 10% 20% 20% 0%
Agreement 8 25% 50% 25% 0% 0% 0% 25% 0% 0% 0% 0% 0% 13% — 0% 0% 0%
Word order 15 40% 27% 40% 7% 13% 13% 7% 0% 0% 7% 20% 0% 27% 0% — 40% 0%
Function words 32 31% 25% 9% 3% 3% 6% 3% 3% 0% 9% 6% 0% 6% 0% 13% — 0%
Unintel l ig ible 10 0% 10% 20% 0% 0% 0% 10% 0% 0% 0% 0% 0% 0% 0% 0% 0% —
Table 14. Error clustering by issue type. The table can be read as “Y in the context of X.” E.g., selecting the “Omission” row and “Function words” column returns a value of 21% indicating that 21% of Omission issues occurred in segments that also included a Function words issue. Dark blue cells indicate clusterings that did not occur in the pilot corpus. Green cells highlight instances in which over 50% of instances of an issue type occurred in the context of another issue type. Yellow indicates instances in which the percentage of cooccurrence was 25% or greater and less than 50%

This document is part of the Coordination and Support Action “Preparation and Launch of a Large-scale Action for Quality Translation Technology (QTLaunchPad)”, funded by the 7th Framework Programme of the European Commission through the contract 296347.
Although statistical significance was not reached, these results suggest that problems with function words and word order may be particularly indicative of terminology and mistransla-tion problems and that agreement errors are particularly likely to indicate other mistransla-tions. One of the goals of this sort of analysis is to see if automatically detectable errors (e.g., spelling, grammar, and terminology) are predictive of overall quality. This analysis, however, must await a larger corpus. The cluster-analysis techniques outlined here will be used for this future research.
6 Ongoing Work Anticipating Task 2.2 of the QTLaunchPad description of work, we started to compare the sentences that have been annotated with issues in the error corpus with alternative transla-tions of alternative machine translation systems. Table 15 provides once such example. In the given sentence translated by a rule-based system (rbmt1), a grammar error was anno-tated. If we look at the alternative translations from another rule-based system (rbmt2) and the two statistical systems (smt1, smt2), it becomes apparent in this case that the latter both do not make this error while it can be argued that rbmt2 makes the same error or a closely related one. It may or may not be necessary to have human annotators validate the answer to this yes/no-question. We will continue this line of research and deliver the results in Deliv-ery D1.3.1.
System type
Error Source Target Reference Same error?
RBMT-1 Grammar Durch Klicken auf das Feld aktivieren Sie den Überschreibmodus.
By clicks on the field you acti-vate the overwriting mode.
By clicking on the field, you activate the overwriting mode.
SMT-1 Clicking the mark the over-write mode.
no
SMT-2 When you click the field select the overwrite mode.
no
RBMT-2 Through click onto the field you activate the overwrite mode.
?
Table 15. Contrasting an annotated error with alternative machine translations. Although this analysis has not been conducted systematically in the pilot corpus (D1.2.1), a limited number of examples were coded to indicate this, as shown in Figure 5, below.

Preparation and Launch of a Large-scale Action for Quality Translation Technology D1.2.2 Error Analysis in Near Miss Translations
17
Figure 5. Screen shot from error corpus showing markup for alternative translations. A ✘ mark indicates that the alternative translation makes the same error and a ✔ indicates that it did not make this error (i.e., this aspect of the alternative translation is correct). We anticipate that the development of larger corpora from better source texts will allow us to make more conclusive statements about the impact of various systems and about clustering of errors.

Preparation and Launch of a Large-scale Action for Quality Translation Technology D1.2.2 Error Analysis in Near Miss Translations
18
7 References [Avramidis et al. 2012] Eleftherios Avramidis, Aljoscha Burchardt, Christian Federmann, Ma-
ja Popovic, Cindy Tscherwinka and David Vilar Torres. “Involving Language Profession-als in the Evaluation of Machine Translation”. In 8th ELRA Conference on Language Re-sources and Evaluation. International Conference on Language Resources and Evalua-tion (LREC-12), pages 1127-1130, Istanbul, Turkey, European Language Resources As-sociation (ELRA), May 2012.
[Callison-Burch et. al 2012] Chris Callison-Burch, Philipp Koehn, Christof Monz, Matt Post,
Radu Soricut and Lucia Specia. “Findings of the 2012 Workshop on Statistical Machine Translation”. In Proceedings of the Seventh Workshop on Statistical Machine Translation (WMT 12), pages 10-51, Montreal, Canada, June 2012.
[Popović 2011] Maja Popović. “Hjerson: An Open Source Tool for Automatic Error Classifica-
tion of Machine Translation Output”. Prague Bulletin of Mathematical Linguistics, (96), pages 59-68, October 2011.
[Specia 2011] Lucia Specia. “Exploiting Objective Annotations for Measuring Translation
Post-editing Effort”. In Proceedings of the 15th Annual Conference of the European As-sociation for Machine Translation (EAMT 11), pages 73-80, Leuven, Belgium, May 2011.