delivering disaster risk reduction by 2030 · delivering disaster risk reduction by 2030 pathways...
TRANSCRIPT
Delivering disaster risk reduction by 2030Pathways to progressEmily Wilkinson, John Twigg, Lena Weingärtner and Katie Peters
Report
May 2017

Overseas Development Institute203 Blackfriars RoadLondon SE1 8NJ
Tel. +44 (0) 20 7922 0300 Fax. +44 (0) 20 7922 0399 Email: [email protected]
www.odi.org www.odi.org/facebook www.odi.org/twitter
Readers are encouraged to reproduce material from ODI Reports for their own publications, as long as they are not being sold commercially. As copyright holder, ODI requests due acknowledgement and a copy of the publication. For online use, we ask readers to link to the original resource on the ODI website. The views presented in this paper are those of the author(s) and do not necessarily represent the views of ODI.
© Overseas Development Institute 2017. This work is licensed under a Creative Commons Attribution-NonCommercial Licence (CC BY-NC 4.0).
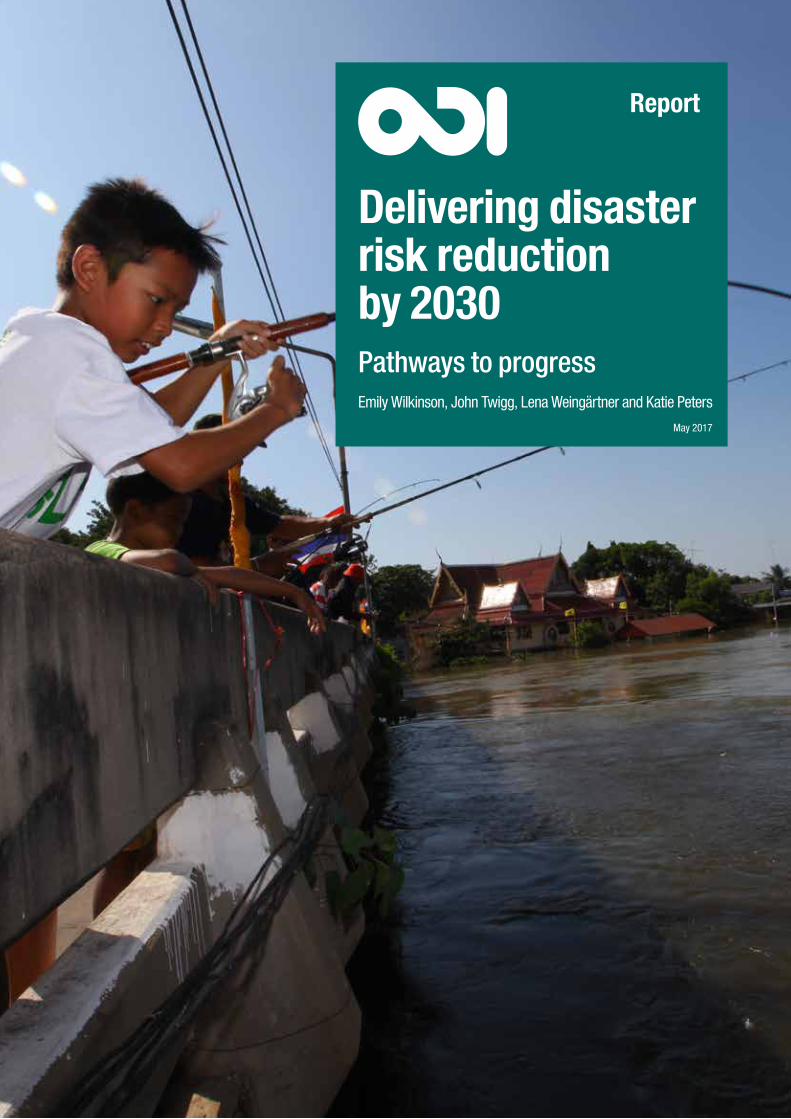
Cover photo: A boy fishes in flood waters in Lop Buri, Thailand. Heavier-than-usual rains during the monsoon season flooded 61 of Thailand’s 77 provinces, affecting 8.2 million people. Corporal Robert J Maurer/US Marine Corps, 2011. Public domain.

Delivering disaster risk reduction by 2030 3
About this reportThis report makes recommendations based on an analysis of the HFA country reports of nine countries: low-income countries (Guinea Bissau, Togo and Nepal), lower-middle-income (Fiji, Sri Lanka and Thailand) and upper-middle-income (Czech Republic, Mexico, and St Kitts and Nevis). These countries have different starting points, trajectories of progress, risk profiles and levels of per capita income. The reports give a good indication of what was prioritised by governments from 2005 to 2015.
The nine case studies are supplemented by an analysis of changes under the HFA against the new global targets and indicators. This includes the Munich Re NatCatSERVICE database on economic losses and frequency of natural disaster events, EM-DAT data on mortality and affected people, and World Bank data on economic losses relative to gross domestic product (GDP) and human impacts as a share of the population.
AcknowledgementsThe authors thank all the case study authors: Giselle Bernard (Togo); Amy Kirbyshire (Guinea Bissau, Saint Kitts and Nevis, Sri Lanka); Virginie Le Masson (Togo); Emma Lovell (Thailand); Sejal Patel (Thailand); Katie Peters (Fiji, Nepal); John Twigg (Czech Republic); and Emily Wilkinson (Mexico).
We also thank the research assistants who helped with the data collection for the case studies and this report: Sejal Patel (Fiji, Nepal, Sri Lanka, Thailand); Gladys Le Masson (Czech Republic, Saint Kitts and Nevis, Togo); Katarina Šoltésová (Czech Republic); Maria Tyldesley (Guinea Bissau, Mexico, Nepal).
Thanks to Donna Lagdemo (Technical Adviser, Red Cross Climate Centre), Ritsuko Yamazaki-Honda (Risk Knowledge Section, United Nations Office for Disaster Risk Reduction) and Rebecca Nadin (Overseas Development Institute) for their valuable comments and review of this report. Thanks also to the case study reviewers: Dak Martin Doleagbenou (Togolese Red Cross) and Laurent Dufour (United Nations Office for the Coordination of Humanitarian Affairs) (Togo); Marie Adámkova (Department of Security and Crisis Management & ISDR Focal Point), Miroslav Havránek (Charles University Environment Centre), Pavel Danihelka (Technical University of Ostrava), Jan Daňhelka (Czech Hydrometeorological Institute) and Jiří Musílek (Fire Rescue Service) (Czech Republic); Senaka Basnayake (Asian Disaster Preparedness Center) and Rajesh Sharma (UNDP, Bangkok Regional Hub) (Thailand); UWL Chandradasa (Sri Lanka Disaster Management Centre) and Bart Klem (University of Melbourne) (Sri Lanka); Carl Herbert (St Kitts and Nevis National Emergency Management Agency (NEMA)) and Ilan Kelman (University College London) (Saint Kitts and Nevis); Felipe de Jesús Colorado González (UNDP-Mexico) and Liliana López Ortiz (UNISDR) (Mexico); and Junko Nakai (UNDP Guinea-Bissau) (Guinea Bissau).
Our thanks also go to Linda Ellis for help in copy-editing this report, and to Hannah Caddick for her support with the production process and communications.
4 ODI Report

Delivering disaster risk reduction by 2030 5
Contents
About this report 3
Acknowledgements 4
Executive summary 9
Towards a national strategy for DRR 9
Prioritising initiatives that are catalytic and accelerate change 9
Towards a longer-term strategy for institutional change 10
A theory of change to achieve 2030 goals 10
1. Introduction 12
2. Methodology 14
3. Tracking progress across the HFA ‘priorities for action’ 16
4. Disaster losses during the HFA 28
Disaster events 28
Economic losses from disasters 28
International support and cooperation for DRR 30
5. Looking ahead to 2030: taking a strategic approach to DRR 32
Prioritising initiatives that are catalytic and accelerate change 32
Towards a longer-term strategy for institutional change 33
6. Next steps: creating a theory of change for DRR 35
References 36
Annex 1. Methodological clarifications 38
Tables
Table 1. Countries selected for analysis 16
Figures
Figure 1. Linking HFA priorities to SFDRR 13
Figure 2. Number of reports per country in the four HFA reporting periods 14
Figure 3. Frequency of disasters 1995–2015 28
Figure 4. Disaster losses by income group (relative to GDP) 29
Figure 5. Disaster losses by country group 1995–2015 (relative to GDP) 30
Figure 6. Disaster-related deaths by income category (pre- and during the HFA) 31
Figure 7. ODA disbursements for disaster prevention and preparedness (relative to GDP) 31
Figure 8. Example of a theory of change for DRR policies 35
List of boxes, tables and figures
Boxes
Pillar 1. Key areas of progress and next steps 19
Pillar 2. Key areas of progress and next steps 21
Pillar 3. Key areas of progress and next steps 23
Pillar 4. Key areas of progress and next steps 25
Pillar 5. Key areas of progress and next steps 26
6 ODI Report
Delivering disaster risk reduction by 2030 7
Acronyms
AADMER ASEAN Agreement on Disaster Management and Emergency Response
ADB Asian Development Bank
ADPC Asian Disaster Preparedness Centre
ADRC Asian Disaster Reduction Center
ANPC National Agency for Civil Protection (Togo)
ASEAN Association of Southeast Asian Nations
CBDBM community based disaster risk management (Thailand)
CBO community-based organisation
CCA climate change adaptation
CDEMA Caribbean Disaster Emergency Management Agency
CDM Comprehensive Disaster Management (St Kitts and Nevis)
CENAPRED Centro Nacional de Prevención de Desastres (Mexico)
CHARM Comprehensive Hazard And Risk Management (Fiji)
CISNPC Commission to Establish the National Civil Protection Service (Guinea Bissau)
CNPC National Council of Civil Protection (Guinea-Bissau)
CSO civil society organisation
DDPM Department of Disaster Prevention and Mitigation (Thailand)
DEC District Emergency Committee (St Kitts and Nevis)
DENARP National Strategy for Poverty Reduction (Guinea-Bissau)
DMC Disaster Management Centre (Sri Lanka)
DPM Disaster Prevention and Mitigation (Thailand)
DPP disaster prevention and preparedness
DRM disaster risk management
DRR disaster risk reduction
ECHO European Civil Protection and Humanitarian Aid Operations
ECLAC Economic Commission for Latin America
ECOWAS Economic Community of West African States
EIA environmental impact assessments
ENNP European Network of National Platforms
EU European Union
EVHAC European Voluntary Humanitarian Aid Corps
EWS early warning system(s)
FONDEN Natural Disasters Fund (Mexico)
FOPREDEN Fund for Disaster Prevention (Mexico)
GDP gross domestic product
GFDRR Global Facility For Disaster Reduction and Recovery
GIS geographic information system
HFA Hyogo Framework for Action 2005–2015
HIC high-income country
IDP internally displaced person
IDNDR International Decade for Natural Disaster Reduction
IFRC International Federation of Red Cross and Red Crescent Societies
ISDR International Strategy for Disaster Reduction
LDC Least Developed Country
LGCC General Law on Climate Change (Mexico)
LGPC Civil Protection Law (Mexico)
LIC low-income country
LLDC Landlocked Developing Country
LMIC lower-middle-income country
MDM Ministry of Disaster Management (Sri Lanka)
MIC middle-income country
MoE Ministry of Education
NAPA National Adaptation Programme of Action
NCDM National Council for Disaster Management (Sri Lanka, Nepal)
NDM National Disaster Management
NDMCC National Disaster Management Coordinating Committee (Sri Lanka)
NDMA National Disaster Management Authority (Nepal)
NDMO National Disaster Management Office (Fiji)
NDPMC National Disaster Prevention and Mitigation Committee (Thailand)
NDRM National Disaster Risk Management
NDRMA National Disaster Risk Management Arrangement (Fiji)
NDRMC National Disaster Risk Management Council (Fiji)
NEOC National Emergency Operations Center (Nepal)
NESDP National Economic and Social Development Plan (Thailand)
NGO non-governmental organisation
NRA National Reconstruction Authority (Nepal)
NRRC Nepal Risk Reduction Consortium
NSDRM National Strategy for Disaster Risk Management (Nepal)
NSET National Society for Earthquake Technology (Nepal)
ODA official development assistance
OECD Organisation for Economic Co-operation and Development
PDNA post-disaster needs assessment
R&D research and development
RCC Regional Consultative Committee on Disaster Management (Thailand)
SDG Sustainable Development Goal
SFDRR Sendai Framework for Disaster Risk Reduction 2015–2030

SIDS Small Island Developing State
SINAPROC National System of Civil Protection (Mexico)
SNAP Strategic National Action Plan (Thailand)
SNPC National Civil Protection Service
UMIC upper-middle-income country
UN United Nations
UNDP United Nations Development Programme
UNECA United Nations Economic Commission for Africa
UNESCAP United Nations Economic and Social Commission for Asia and the Pacific
UNFCCC United Nations Framework Convention on Climate Change
UNICEF United Nations Children’s Fund
UNISDR United Nations Office for Disaster Risk Reduction
UN-OHRLLS United Nations Office of the High Representative for the Least Developed Countries, Landlocked Developing Countries and Small Island Developing States
UNV UN Volunteers (Guinea Bissau)
WCDR World Conference on Disaster Reduction
WHO World Health Organization
8 ODI Report

Delivering disaster risk reduction by 2030 9
Executive summary
Towards a national strategy for DRRThe pressure is on for signatories to the Sendai Framework for Disaster Risk Reduction 2015–2030 (SFDRR) to achieve and demonstrate a reduction in disaster losses by 2030. Evidence from a review of government self-assessed progress under the preceding Hyogo Framework for Action (HFA) suggests that achieving positive outcomes under the Sendai Framework is attainable, but developing a national strategy for disaster risk reduction (DRR) is a pre-requisite for reducing the impact of disasters. Institutional change will need to be part of the strategy and this will take longer to achieve. Hence a national DRR strategy needs to be put in place well before the 2020 deadline for achieving global target ‘e’ of the Sendai Framework (to ‘Substantially increase the number of countries with national and local disaster risk reduction strategies by 2020’ (United Nations, 2016)).
The 2017 Global Platform for Disaster Risk Reduction in Cancun marks a turning point for national governments. Two years into the new global agreement, it is time to take stock of progress under the HFA, and reflect on advances and delays in implementation of the SFDRR. This report finds that disaster losses increased during the HFA period, but also that most DRR interventions were not evaluated so they may not have been as effective as they could have been in reducing risk. Only by having a broader view of what governments focused on during the HFA period, the rate of change and key achievements, can decision-makers identify critical gaps and see where new approaches might be needed to accelerate change.
This report aims to help national governments, their sub-national counterparts, and donors better understand the pace of change required to deliver on the seven global targets of the SFDRR by 2030. To do so, the report systematically reviews governments’ own reporting on progress against the previous framework for DRR, the HFA, the type of which has not been done. This grounds recommendations for what should happen next in a deeper understanding of historical pathways for change.
The report finds that an impressive number of DRR activities were conducted during the 10 years of the HFA, demonstrating commitment by governments to act to manage risk. Countries in very different economic situations and with diverse risk profiles prioritised many of the same activities, such as incorporating DRR in school curricula and running public-awareness campaigns. Most of these actions were relatively low cost, facing few political
barriers and requiring limited institutional or structural changes. But a fundamental shift is required to achieve the SFDRR: national governments will need to focus not only on these pragmatic measures, but also take a more strategic approach – one that will require deeper engagement with civil society and the private sector. This approach may be more challenging, but will bear fruit over the longer term.
Countries will need to work on two tracks: (1) prioritising initiatives that are catalytic, making more effective use of external funding and accelerating other agendas; and (2) developing a longer-term strategy for institutional change on DRR, backed by national financing mechanisms. Neither track is a ‘quick win’ as both require sustained resourcing and commitment.
Prioritising initiatives that are catalytic and accelerate changeGovernments should initiate policy and legislative reforms after disasters. High-impact disasters can prompt improvements in financing and commitment to DRR. During the HFA, where DRR legislation was already in place, subsequent major events prompted policy reforms due to public pressure and the scale of impacts. Policy-makers can anticipate these events, including putting in place inquiry systems to examine the causes of disaster after an event.
Public awareness campaigns can enhance interest in DRR for specific hazards. Campaigns have tended to focus too narrowly on emergency response and, while demonstrating impressive reach to the local level, often lack evidence of impact. Greater and longer-lasting impact could be achieved by linking public awareness work and formal education programmes more closely.
Climate change debates and environmental issues can catalyse changes in DRR legislation. DRR practitioners should seek to actively engage with these debates and policy processes, harnessing political interest in climate change to advance DRR policy and coordination across sectors.
Changes in the political situation may warrant a new approach to DRR. Even during periods of military leadership, improvements in emergency preparedness and response can be achieved through engagement with civil society organisations. This has happened in Fiji and elsewhere. For progress to be made across all aspects of DRR, stability in governance arrangements and political buy-in is essential.

Externally funded projects can catalyse DRR reforms. This is particularly important in low-income countries (LICs). In contexts where DRR is not prioritised across government, and funding is limited or piecemeal, national governments can use externally funded projects to initiate change or regenerate interest in DRR. However, a multitude of projects and parallel efforts may not spur political engagement in DRR, and national governments should request support to existing national programmes with a preference for measures that strengthen national institutional capacities.
Regional and international initiatives can help establish standards and encourage knowledge sharing. Regional initiatives and institutions such as the Association of Southeast Asian Nations (ASEAN) Agreement on Disaster Management and Emergency Response (AADMER) programme encourage information sharing, coordination, resource mobilisation and good practice. They can also help promote standardisation on issues such as integrating DRR into school curricula (as can be seen through campaigns such as the Worldwide Initiative for Safe Schools, coordinated by the United Nations Office for Disaster Risk Reduction (UNISDR)). Governments need to take ownership of such initiatives and turn them into national programmes that can be monitored and evaluated.
Towards a longer-term strategy for institutional changeStrengthening capacity and knowledge to implement legislation and policy. LICs generally have fewer human, technical and financial resources, meaning that law and regulation enforcement can be a challenge. This presents a major barrier to sustained progress on DRR. Knowledge sharing and capacity-building to implement laws and policies needs to become a priority for Sendai Framework implementation at all scales.
Incentivising private sector investment and compliance with DRR regulations. A longer-term strategy for incentivising private sector investments in DRR and for enhancing compliance with Environmental Impact Assessments, land-use plans and building codes is needed. As this requires structural changes along with a combination of incentives and enforceable sanctions, this will demand a longer-term political commitment and civil society engagement. Monitoring and publishing results of risk assessments – for example, public and private buildings that do not comply with standards or are in high-risk areas – can increase accountability.
Sustained civil society engagement in DRR has clear benefits. The HFA reports had relatively little to say about this, but civil society groups play an important role in raising awareness, providing training, helping to ensure consideration of gender issues, increasing access to early warning systems, and other critical areas of DRR. More systematic and sustained engagement with these groups
is needed to achieve SFDRR targets (including target ‘g’ on increasing the availability of and access to multi-hazard early warning systems and disaster risk information). Countries should also monitor and measure progress in this engagement.
Overcoming size limitations and finite resources. Smaller countries – in particular small-island developing states (SIDS) – and local governments face specific challenges. Faced with limited budgets, countries and local governments tend to focus on less costly activities, for example disaster preparedness activities. Targeting key issues such as exposure to cyclones and floods in coastal areas, and harnessing specialist skills from regional bodies and line ministries, can help to overcome some of the constraints of size and geography.
Overcoming barriers posed by weak institutions, political instability and very low levels of development. Technical and capacity constraints within government are repeatedly noted as barriers to change. In places with weak institutions, very limited resources and/ or experiencing political instability, change will inevitably require some international support, but developing and implementing a DRR strategy should be collaborative. For national governments this will mean working with non-state actors.
A theory of change to achieve 2030 goalsDRR policies are essentially in need of a theory of change, and having to report on disaster losses in 2030 provides a good incentive to develop one. A theory of change describes the logical sequence of an initiative from inputs to outcomes to goals. It is produced through a process of reflection and dialogue amongst stakeholders, through which ideas about change are discussed alongside underlying assumptions of how and why change might happen as an outcome of different initiatives (Vogel, 2012).
To produce an effective national DRR strategy, governments and their partners will need a theory of change for DRR policies that defines the national goals and the objectives, and interventions that will contribute to achieving those goals. Given the anticipated difficulties in using loss data alone to assess progress over the next 13 years towards the disaster loss goals, realising and measuring reductions in disaster risk, will be critical objectives. These risk management objectives should centre on preventing new risks, reducing existing risks and strengthening resilience (UNISDR, 2015c), which will require measuring and modelling changes in capacities and in vulnerability and exposure to different hazards. The types of activities or interventions that are needed to achieve these risk management outcomes can then be identified.
10 ODI Report
Delivering disaster risk reduction by 2030 11
Through this approach, the precise link between activities and the achievement of the long-term goals can be better understood, leading to better planning and evaluation. Developing a national DRR strategy is
a priority for implementing Sendai and using a theory of change to guide planning should yield significant benefits, improving the chances of achieving national goals by 2030.

1. Introduction
1 Member States will report against outcome indicators (Targets A–D) and input indicators (Targets E–G) as well as additional indicators and targets in nationally determined monitoring schemes for the Sendai Framework Monitor.
As we move into the implementation of the Sendai Framework for Disaster Risk Reduction 2015–2030 (SFDRR), with a new set of global targets and indicators (UNISDR, 2015a), the pressure is on to demonstrate impact. The Sendai Framework (2015–2030) emphasises on four priority areas (Figure 1). Countries will be assessed (not self-assessed, as under the HFA) on their ability to develop plans as well as to reduce disaster losses.1 SFDRR targets and indicators are now linked to the Sustainable Development Goals (SDGs), and reducing losses is seen as critical to achieving poverty reduction and a number of other SDGs. The challenge is huge, and governments will need to be realistic about what they can do vis-à-vis what they should be encouraging others to do.
This report aims to help national governments, their sub-national counterparts, and donors better understand the pace of change required to deliver on the seven global targets of the SFDRR by 2030. The targets are attainable, but achieving them requires a fundamental shift in the way national governments approach the task of reducing disaster risk. The report identifies the critical need for a national DRR strategy to accelerate progress towards the seven global targets of the SFDRR. Countries should aim to have this strategy in place well before 2020 (the deadline set for achieving global target ‘e’ to ‘Substantially increase the number of countries with national and local disaster risk reduction strategies by 2020’ (UNISDR 2015a)). Developing a DRR strategy is a pre-requisite for achieving the outcome-level targets that centre on reducing disaster losses.
As the first internationally agreed DRR framework, the Hyogo Framework for Action 2005–2015 (HFA) was a landmark in global commitment to implement a DRR agenda. HFA national progress reports provide a unique perspective on the efforts made by governments to manage risk over the past 10 years. However, no systematic review has been conducted of governments’ own reporting on progress against the HFA. By analysing these and comparing changes across several countries, this report offers a critical reflection on what was achieved, grounding recommendations for what should happen in a deeper understanding of historical pathways for change.
Under the HFA, the ‘priorities for action’ were grouped into five areas (see Figure 1). Under each of these came a set of recommended processes and outputs, such as setting up a national platform for DRR, conducting a national risk assessment and ensuring that effective land-use plans and building codes are in place (UNISDR, 2005). Governments were free to focus their attention on any or all aspects of each of the pillars and develop the policies, plans, actions and capacities that they considered most important or feasible. Surprisingly, however, countries have done some very similar things.
Yet the HFA was not very prescriptive in terms of expected outcomes; progress was self-reported using quantitative and qualitative indicators and means of verification; and the range of actions – and detail – in the reports is vast. Ten years is not a long time in terms of policy and legislative change but by exploring what governments were able to achieve over the period of the HFA, we have a more realistic understanding of the pace of change required over the next 13 years (to 2030) under the SFDRR.
In recognition of this, and to compare like with like, this report examines changes in DRR policies and practices in nine countries with different levels of per capita income in 2005: three low-income countries (Guinea-Bissau, Nepal and Togo); three lower-middle-income countries (Fiji, Sri Lanka and Thailand) and three upper-middle-income countries (the Czech Republic, Mexico and Saint Kitts and Nevis). These countries experienced different rates of progress against these pillars, prioritising different elements and often choosing pragmatic, short-term activities – which were relatively low cost, facing few political barriers or opposition from other sectors, and that did not require institutional or structural changes. The extent to which these activities managed to reduce risk and therefore disaster losses during the HFA is not clear from what was reported.
This report consists of four main sections. Following the introduction, Section 2 describes the methodology used to assess progress under the HFA for different income groups (and other groups considered in need of special attention). Section 3 presents the results of an in-depth analysis of the HFA reports for nine country case studies describing the main trajectories
12 ODI Report

Delivering disaster risk reduction by 2030 13
and progress under each of the HFA pillars. Section 4 traces progress and showcases developments in disaster-related losses for different groups of countries, aggregated by their geographies and income levels. The fifth section then summarises some of the major changes
that have taken place under the HFA, classifying what have been prioritised so far as ‘pragmatic’ and ‘strategic’ measures; and Section 6 sets out key issues that need to be addressed if countries are to make significant progress towards outcome-oriented targets in the SFDRR.
Priority for Action 1Ensure that disaster risk reduction is a national and a local priority with a strong institutional basis for implementation
Priority for Action 2Risk governance:
Strengthening disaster risk governance
Priority for Action 1Risk knowledge:
Understanding disaster risk
Priority for Action 3Investment in DRR for resilience:
• Reducing existing risk• Preventing new risk generation
Priority for Action 4Enhancing preparedness for response and Build Back Better
• Preparedness• Build back better
Priority for Action 2Identify, assess and monitor disaster risks
and enhance early warning
Priority for Action 3Use knowledge, innovation and education to build a culture
of safety and resilience at all levels
Priority for Action 4Reduce the underlying risk factors
Priority for Action 5Strengthen disaster preparedness for
effective response at all levels
Proposed groups of public policy indicators fo theSendai Framework for DRR 2015–2030
Hyogo Framework for Action 2005–2015
Figure 1. Linking HFA priorities to SFDRR
Source: ‘Considerations on Developing a System of Indicators Based on the Sendai Framework for Disaster Risk Reduction 2015–2030:
A proposal for monitoring progress’. Document prepared for the Expert Meeting on Developing Indicators for Disaster Risk Reduction,
27–29 July 2015, Geneva (UNISDR, 2015b).
2. Methodology
2 To allow for the maximum possible difference in time between reporting, this report only consider countries that reported in 2009–2011 and 2013–2015 when assessing change in levels of progress under the HFA. For a full list of these countries, see Annex 1.
3 During the HFA, four of the case study countries changed income group category: Fiji (from lower-middle to upper-middle income), Czech Republic (from upper-middle to high income), Saint Kitts and Nevis (from upper-middle to high income) and Thailand (from lower-middle to upper-middle income).
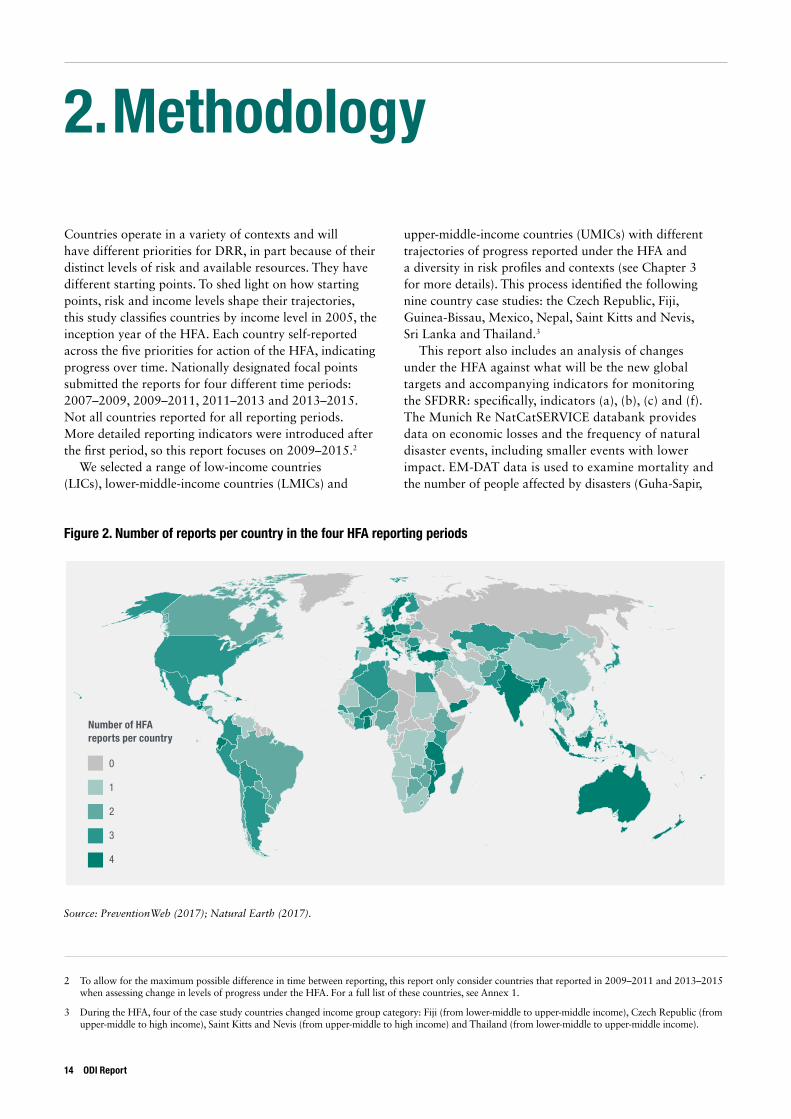
Countries operate in a variety of contexts and will have different priorities for DRR, in part because of their distinct levels of risk and available resources. They have different starting points. To shed light on how starting points, risk and income levels shape their trajectories, this study classifies countries by income level in 2005, the inception year of the HFA. Each country self-reported across the five priorities for action of the HFA, indicating progress over time. Nationally designated focal points submitted the reports for four different time periods: 2007–2009, 2009–2011, 2011–2013 and 2013–2015. Not all countries reported for all reporting periods. More detailed reporting indicators were introduced after the first period, so this report focuses on 2009–2015.2
We selected a range of low-income countries (LICs), lower-middle-income countries (LMICs) and
upper-middle-income countries (UMICs) with different trajectories of progress reported under the HFA and a diversity in risk profiles and contexts (see Chapter 3 for more details). This process identified the following nine country case studies: the Czech Republic, Fiji, Guinea-Bissau, Mexico, Nepal, Saint Kitts and Nevis, Sri Lanka and Thailand.3
This report also includes an analysis of changes under the HFA against what will be the new global targets and accompanying indicators for monitoring the SFDRR: specifically, indicators (a), (b), (c) and (f). The Munich Re NatCatSERVICE databank provides data on economic losses and the frequency of natural disaster events, including smaller events with lower impact. EM-DAT data is used to examine mortality and the number of people affected by disasters (Guha-Sapir,
0
1
2
3
4
Number of HFA reports per country
Figure 2. Number of reports per country in the four HFA reporting periods
Source: PreventionWeb (2017); Natural Earth (2017).
14 ODI Report

Delivering disaster risk reduction by 2030 15
Below and Hoyois, 2017).4 Official development assistance (ODA) support to DRR is derived from the Organisation for Economic Co-operation and Development (OECD) creditor reporting system. World Bank data is used to supplement this section (Section 4) and calculate economic losses relative to gross domestic product (GDP) and human impacts as a share of population (World Bank, 2017b).
The case studies were selected from a limited set of countries because not all reported more than once under the HFA (see Figure 2). Hence, while Section 4 of this report covers a range of income levels and risk profiles, some regions are missing from the analysis (for example, Central, Eastern and southern Africa), although a range of income levels, risk profiles and contexts are included in the analysis. Similar to the case study countries, others have also shifted between income groups over the time span of the analysis.5
4 The SFDRR monitoring indicators define affected people as those experiencing physical harm, movement or displacement or suffering from other direct damage. EM-DAT views affected people more narrowly as those requiring immediate emergency assistance. Mortality, injuries and homelessness as a direct result of disasters are listed separately. Figures for affected populations as used in this report are based on EM-DAT’s category of ‘Total affected’ populations, which entails the affected, injured and homeless categories (Guha-Sapir et al., 2017). For a more detailed definition of terms see www.emdat.be/Glossary
5 For more detail on income group composition by each year, see World Bank (2017a).
Governments self-reported on progress under the HFA; therefore the scores are not always reliable or a consistent measure between countries or over time. These reports are valuable nonetheless because they represent what governments have focussed on – it is what they think is most important. It is not always clear from the self-reporting whether plans were fully implemented so where possible this data has been supplemented with other sources and has been verified by independent DRR experts (see Annexes 2–10, available online at odi.org). Even less information is provided on whether programmes and plans have been achieved – if they have been evaluated, the results are not included in HFA reports. Nonetheless, we are able to provide a comparative analysis of the nine countries with more depth and objectivity than the HFA scores alone permit.

3. Tracking progress across the HFA ‘priorities for action’
This section reviews changes in DRR policies and practices across the five HFA pillars for countries in each of the three income groups. The analysis draws on the country case study reports presented in Annexes 2–10 (available online). More detail and references for the information presented in this report can be found under each of the case studies.
Importantly, the changes and limitations that are described are those that governments themselves have recognised as being important. This section is not so much a systematic review of everything that has happened in these countries, but rather a synthesis of what has been prioritised by government. Combined with an analysis of disaster losses (see Section 4), it therefore provides useful insights as to the particular challenges that groups of countries will face in implementing the SFDRR.
An impressive number of DRR activities were conducted during the 10 years of the HFA, demonstrating commitment by governments to take action to manage risk. Countries in very different economic situations and with diverse risk profiles prioritised many of the same activities. These actions were relatively low cost, faced fewer political barriers than more strategic actions (they could be led
by a specialist DRR agency and did not face opposition from other sectors of stakeholders) and did not require institutional or structural changes. Some can be considered ‘quick wins’, stimulating interest in DRR amongst other actors and catalysing change beyond the immediate focus of the intervention. The most prominent examples of these pragmatic measures are described below.
Pillar 1. Ensure that disaster risk reduction is a national and a local priority with a strong institutional basis for implementation
1. A national platform for DRROne of the most important advances globally during the HFA period was the establishment of national platforms to bring stakeholders together for improved coordination of DRR activities (mainly preparedness related to specific hazards). In some cases, this has also served as a space to debate and provide policy recommendations. Nearly all of the countries reviewed for this report have national platforms (the exceptions are Guinea-Bissau and Saint
Table 1. Countries selected for analysis
Annex Country Income group (in 2005) Change in reported progress under the HFA (relative to income group)
2 Togo LIC Lowest
3 Nepal LIC Middle
4 Guinea-Bissau LIC Highest
5 Thailand LMIC Lowest
6 Sri Lanka LMIC Middle
7 Fiji LMIC Highest
8 Mexico UMIC Lowest
9 Saint Kitts and Nevis UMIC Middle
10 Czech Republic UMIC Highest
16 ODI Report

Delivering disaster risk reduction by 2030 17
Kitts and Nevis), but their composition and functions vary widely. In the LICs these were set up and supported by donors after 2005, while some of the middle-income countries (MICs) had their own multi-stakeholder platforms prior to the HFA. These evolved from 2005 to 2015, with members meeting regularly and increasingly discussing issues beyond those related to preparedness.
In some cases it has been difficult to get non-DRR specialist agencies to participate in these platforms. This was the case in Sri Lanka, where many government agencies did not consider DRR issues to be of relevance to them; to address this, the national platform was restructured in 2010 with the aim of improving participation of government agencies and civil society organisations.
2. Comprehensive DRR legislation During the HFA, more than 120 countries undertook DRR legal or policy reforms (UNISDR, 2015c). Indeed, important changes to DRR legislation were made in all case study countries from 2005 to 2015, albeit at different rates. Although in some cases planning went ahead before legislation was updated because legislative processes were slow (as is the case in Fiji), legislation has served to define responsibilities and coordination across government agencies. Some countries had disaster-related legislation pre-HFA but this needed updating (Nepal (1982); Fiji (1998); Thailand (1979); Saint Kitts and Nevis (1999); Mexico (2000); Czech Republic (2000)).
In Mexico, legislative reform after 2005 brought it in line with international recommendations on promoting pre-disaster measures. Mexico has an authoritative political history that DRR reforms have slowly (but not entirely) shaken off. Legislative reforms under the HFA have been dramatic, with increasingly precise coordination and operational structures and mandates for administrative levels of government. In Mexico, legislative reform at national level tends to be replicated at state level, and some states have already updated their laws in line with the national reforms of 2012. None of the other case study countries’ sub-national governments have their own DRR legislation. However, DRR legislation in the Czech Republic does promote institutionalisation of DRR into sub-national policies.
In two of the case study countries (Nepal and Fiji), updates to DRR legislation were delayed during the HFA period, and this is acknowledged as being problematic for the implementation of plans. In Fiji, the delay has created uncertainty surrounding the assignment of roles and responsibilities under the various committees. In Nepal, delays have been partly due to lessons from disasters, in particular the 2015 Gorkha earthquake, resulting in the bill needing to be amended. These legislative delays have stalled progress on implementing the national DRR strategy.
In some countries, climate change debates and environmental issues appear to have catalysed changes in DRR legislation. In Togo, DRR has been promoted
directly through the Environmental Law (2008); while in Mexico the new Civil Protection Law (2012) was drafted alongside the Climate Change Law (2012), benefiting from commitment within the climate change community to ensure coherence with other sectoral laws.
3. National DRR strategies and plansBy the end of the HFA, few countries actually had something they could refer to as a national DRR strategy – i.e. something that outlines a set of objectives, and the measures and resources needed to achieve them. National DRR plans and programmes are produced by governments for their term in office, but these tend to describe a limited set of processes and outputs. In some cases they are very focused on specific hazards (e.g. Guinea-Bissau and Czech Republic). Although it is not always clear whether plans were fully implemented or what they achieved, submissions from the wealthier MICs note some improvements in the plans themselves over time (in Saint Kitts, operational plans have been developed since 2013 based on the national strategy; in Mexico, there is a trend towards DRR plans that link to national development priorities and strengthening cooperation across government; and in the Czech Republic some DRR principles are included in flood protection plans, although the need for more preventative measures is acknowledged).
4. Local DRR strategies and plansAll countries have some kind of local-level decision-making structure for DRR, although these are mainly community emergency committees of some kind. Local DRR strategies and plans are far less common. In the LICs, there were no local plans at the beginning of the HFA period. By the end, however, these had been drawn up by or for a number of local authorities, led and supported by external agencies.
The huge push under the HFA to devolve responsibilities and functions for DRR to local governments can be seen clearly across most of the MICs in this study (both LMICs and UMICs), driven principally by national-level legislation mandating local governments (although not always the lowest administrative units) to take responsibility for DRR. In most cases this decentralisation of DRR responsibilities was driven by broader decentralisation agendas. As this has not been accompanied by changes in funding structures or by any additional resources being decentralised for DRR, it is unsurprising that local DRR plans focus mainly on preparedness and response activities and coordination, as these are less costly than more upstream measures to reduce risk.
Nonetheless, in many of the MICs studied, DRR is formally decentralised. Local governments are given legal responsibility for DRR functions such as planning; and hence in these countries local authorities – even in small,

remote municipalities – have started developing their own DRR plans where they are mandated to do so by national law. In Sri Lanka, for example, the number of provincial governments with disaster preparedness plans increased under the HFA after DRR was incorporated into the Local Government Act (2009). In Thailand, this happened after the 2007 Disaster Preparedness and Management Act, with provinces becoming responsible for developing their own disaster prevention and mitigation action plan and budget, and for responding to small-scale disasters.
Resources to implement the plans remain limited, however. There is no evidence in any of the case study countries of budgets being earmarked and reliably transferred to sub-national units or governments for DRR; local governments are expected to allocate resources from unconditional transfers and from their own revenues. In Thailand this is mandated: local governments have a legal responsibility to allocate 1–2% of local budgets to DRR. Because of scarce resources available outside urban areas in all of the LMICs and UMICs, DRR plans are limited in scope. Annual activities tend to focus on identifying the key hazards and responsibilities of key local departments in emergency preparedness and response. The one exception is Mexico, where municipalities can access additional funding for DRR through the Disaster Prevention Fund (FOPREDEN). This gives state governments considerable control, theoretically, to plan and implement DRR measures – although in practice, local autonomy over DRR decisions is limited in all but the largest municipalities because of the control state government exercises over municipal budgets, and because small municipalities lack technical capacity to implement DRR measures.
5. Sectoral DRR plansAcross a number of government departments there was a growing interest in DRR under the HFA period in all case study countries. In each country, different departments are mentioned as having ‘DRR plans’ – usually emergency plans for their sectors. In the LICs, the sectors with DRR plans are those that are important in national planning. In Guinea-Bissau, for example, DRR sectoral plans are most clearly seen from 2008 onwards in public health, as well as specific national programmes on food security and on refugees and internally displaced persons (IDPs). In Togo, on the other hand, by 2013 agriculture and environment sectors were the ones with DRR plans; since the creation of a national DRR strategy in 2013, more sectors have been encouraged to integrate DRR and, importantly, DRR was identified as a priority in Togo’s Strategy for Accelerated Growth and Employment Promotion. In Nepal, only specific sectors such as environment and health are noted to incorporate DRR measures, but the development of a National Adaptation Programme of Action (NAPA) appears to have spurred interest in DRR across a number of other sectors including water, agriculture, energy and
public health. Overall, for all LICs, the implementation of these sectoral DRR plans and programmes is very much dependent on external funding.
In the MICs, there has been a concerted effort to mainstream DRR into sectoral planning (rather than departments simply having a ‘DRR plan’), including through the use of risk-assessment tools for planning and budgeting purposes. The sectors or departments are slightly different in each country, suggesting that DRR mainstreaming is by no means a uniform process. In Fiji, the National Development Plan (2007–2011) mandated the use of Comprehensive Hazard and Risk Management (CHARM) in development planning. Thus by 2014 DRR was reportedly integrated in a number of sectors of the economy (water, housing, waste management, marine and biosecurity). Similarly, but perhaps less comprehensively, DRR has been mainstreamed across some sectors in Sri Lanka: by 2013 risk assessments were being used for decision-making in urban areas, and by 2015 this had expanded to roads, housing and tourism. In Thailand the focus is on flood risk management and, particularly since the 2011 floods, there has been a concerted effort to coordinate actions across a number of departments for short- and longer-term water management. Similarly, in Saint Kitts and Nevis following Hurricane Omar in 2008, a growth and poverty-reduction strategy was developed to recover from the disaster and transition the economy towards a path of strong, sustainable growth. The two wealthier countries in this study, Mexico and the Czech Republic, already had provisions for drought risk management in water (Mexico) and agriculture (Czech Republic) sectors before the HFA began. In these countries, from 2005 onwards, more of a mainstreaming approach was adopted, with some effort to use risk assessments in planning and investment decisions in a few key sectors (still related to particular hazards).
6. Mandated community participationCommunity participation in DRR policies and plans is not mandated in any of the LICs or LMICs reviewed for this report despite the considerable attention paid in the HFA to participation and community-based approaches to managing risk. Nonetheless, the HFA period witnessed an increasing number of externally promoted and supported community-level initiatives, including what are regarded as ‘good practices’ of formalising participation, particularly in Nepal (although community participation appears to have been affected by the insurgency up to 2007). Capturing these local experiences and sharing good practices remains a challenge in all the case study countries.
In the higher-income countries, commitment to promoting community participation in DRR decisions is varied and certainly not stronger than in lower-income countries. In Saint Kitts and Nevis, community participation in DRR was encouraged from early in the HFA, and was bolstered in 2013 with the election of community members
18 ODI Report

Delivering disaster risk reduction by 2030 19
as district managers, tasked to work with community-based organisations and strengthen the disaster response capacity of communities. In Mexico, participation was mandated in 2012, but a subsequent HFA report notes that in practice community participation in DRR is limited. In the Czech Republic, it is not mandated and is reportedly not prioritised by either governments or communities.
Overall, there is little information in the HFA reports from these countries regarding community involvement in decision-making around DRR. The lack of resources to implement local-level DRR measures described above means that local governments could usefully involve communities in emergency preparedness and response planning and other DRM activities, but the HFA reports do not describe the level or nature of this participation. This is surprising given the widespread rhetoric of participation in international DRR statements, but likely reflects the fact that local governments were not directly involved in the reporting process – i.e. the reports may under-represent the level of participation.
7. Explicit recognition of genderThe HFA notes that women face particular vulnerabilities and that gender considerations should be integrated in DRR policies and mechanisms such as early warning systems. In all three LICs reviewed in this study, gender dimensions of DRR were not considered in policies at the start of the HFA period but have become more prominent over time. The specific needs of women and men are recognised in emergency response plans, but in practice actions have not changed. Recognition of the needs of certain groups does not represent a comprehensive general
strategy. In LMICs, different approaches to improving gender considerations were adopted under the HFA: in Fiji, there was a focus on vulnerability but also recognition of the need for women’s inclusion; in Sri Lanka, a rights-based approach to DRR was called for; while in Thailand, gender mainstreaming was attempted, although in 2015 it was noted that gender-focused activities were still not a key component of DRR. In Saint Kitts and Nevis too, a gender mainstreaming approach was adopted in 2013, while in the other UMICs gender is recognised as an important issue in DRR but legislation and plans continue to be gender blind. As with community participation (described above), this is surprising given the attention paid to gender in international rhetoric on DRR during the HFA.
Pillar 2. Identify, assess and monitor disaster risks and enhance early warning
8. Conducting a national risk assessmentSimilar issues can be identified across the case study sample. Fully comprehensive, multi-hazard, national risk assessment has not been achieved in any of the case study countries, irrespective of size or level of wealth, although all appear to have made progress towards improving risk assessments over the 2005–2015 reporting period. National-level risk assessments of one kind or another have been carried out in Nepal, Thailand, Saint Kitts and Nevis, Mexico and the Czech Republic, although it is not clear how comprehensive these are. Mexico has a national risk atlas for states and municipalities, although the resolution
Pillar 1. Key areas of progress and next steps
Key areas of progress
1. Setting up a national platform under the HFA was an early action for countries that did not already have one. For those that already had some kind of inter-agency platform for discussion on DRR, reforms to these platforms took place with the result of improving coordination of DRR activities.
2. Legislative reform was prioritised in all nine case study countries, although in some, institutional barriers have prevailed and legislation has not yet been passed. Updates to legislation after 2005 have brought countries in line with international DRR discourse and recommendations, meaning more of a focus on pre-disaster activities and on coordination with non-DRR specialised agencies.
Next steps
1. Greater attention now needs to be paid to increasing non-government stakeholder participation in national platforms and local consultative equivalents, and to link DRR platforms to other platforms or high-level groups on climate change, health, the environment and related issues. Progress on reducing disaster losses will be more effective with the sustained engagement of the private sector and civil society.
2. The longer-term and more significant challenge is now to ensure legislation is implemented. This will require more detailed regulations that specify actions, standards, incentives and penalties, supported by greater involvement of a wider range of government departments.

is not good enough to inform planning decisions. Hazard profiles have also been prepared for Sri Lanka, but no national risk assessments have been conducted in Togo (except in relation to health), Guinea-Bissau or Fiji. Single-hazard and sub-national assessments remain the most common forms of risk assessment; the former are usually aimed at key hazards (e.g. floods in the Czech Republic). Multi-hazard assessments are rare and more likely to take place at local levels, so are conducted as one-off studies.
The rate and extent of progress on national risk assessments are affected by a range of factors: availability of financial and other resources is important, but there are other major challenges, including the technical complexity and scale of the task, and the length of time needed to carry it out. Systems to collect, analyse and disseminate data cannot be built rapidly. These constraints also inhibit repetition or updating of assessments: information is likely to be out of date within a few years, but all of the major risk assessments identified in the case studies were one-off initiatives.
Risk-assessment methods and contents appear to vary considerably in all countries. Unsurprisingly, hazard data collection and mapping are important elements in risk assessments everywhere, but the picture regarding vulnerability assessment is unclear in all of the case study countries. Very few even mention it, although it may be included in risk assessments in practice. It is also unclear how different national governments define and understand ‘vulnerability’.
The involvement of many different government departments and official technical institutions, with different specialist skills and areas of interest, has enhanced the generation of information but has not resulted in the production of comprehensive, multi-hazard assessments. There is little methodological consistency between studies (for instance regarding scales and time periods, and data formats), a problem exacerbated by the variety of donor-funded technical and research reports. The involvement of so many stakeholders also presents data sharing and coordination challenges. The HFA reports are inconsistent in indicating how assessment information is shared or used and the mechanisms for sharing data across agencies; even where intra-governmental mechanisms are established, as in Sri Lanka, data exchange has remained a challenge. It is also hard to demonstrate the contribution of risk assessments to changes in policy, legislation and planning from the existing evidence. A number of risk assessments aimed to support sectoral planning in one form or another, although the extent to which assessments were included in sectoral development plans is also unclear.
In LICs, lack of government financial and technical capacity is acknowledged by governments to be a major constraint, necessitating a focus on specific hazards and
6 UNISDR is now developing technical guidance for monitoring the SFDRR global indicators, including on methodologies, data standards and metadata.
risks, on regions within the country, on geographical areas such as river basins, or on community-level assessment. These countries rely heavily on studies carried out or funded by other organisations (e.g. a minor risks analysis in Togo carried out by Plan Togo in 2006; World Bank support for a risk and vulnerability assessment in Nepal in 2010; United Nations Development Programme (UNDP) assistance for community risk profiling in Guinea-Bissau).
Regional initiatives have stimulated progress in other country categories. This includes the risk assessments carried out in Thailand as part of the Association of Southeast Asian Nations (ASEAN) Agreement on Disaster Management and Emergency Response (AADMER) programme, and Fiji’s benefiting from Pacific regional networks, initiatives and technical centres aimed at collecting and sharing risk information on transboundary risk.
9. Systematic collection of loss informationThe limited and sometimes vague evidence from the case study countries makes it difficult to reach firm conclusions regarding the extent, accuracy and coverage of their loss data, or about how data are reported, monitored and analysed. Overall, the evidence suggests that there is considerable room for progress in this area – an issue that is vital to the implementation of the Sendai Framework.
The main concerns voiced by reporting countries include the challenge of maintaining databases (highlighted by Sri Lanka, for instance); the lack of common methodologies and procedures to assess damage, loss and needs when disasters occur; unsystematic collection of data, particularly at the local level and across sectors; and the challenge in updating information. Limited technical capacity and financial constraints hinder data collection, analysis and reporting.6
In general, the MICs in the sample appear to have better loss data than the LICs, as one would expect – for example, Mexico carries out systematic socioeconomic impact assessments of all major disasters every two years – but this is not consistent. For instance, Nepal has loss reports from 1991 to 2010 for earthquakes, floods, fires and landslides, and the government is improving loss/post-disaster data collection systems, which it seeks to align with international approaches; while Saint Kitts and Nevis has yet to compile a digital database of disaster information.
New data-gathering and coordination initiatives are mentioned in several reports during the period (e.g. a ‘disaster data warehouse’ in Thailand following the 2011 floods), but their operational effectiveness and outputs are not described. Some losses and damages were assessed by reinsurance companies but these datasets are not openly accessible. The Disaster Information Management System (DesInventar), supported by a number of international organisations, including the UNISDR, appears to be
20 ODI Report

Delivering disaster risk reduction by 2030 21
the primary source of data on disaster impacts in Togo, and it hosts 30 years of official data collected in Sri Lanka. Unlike other systems, it includes data on smaller events (extensive risks) – but for all datasets, maintaining and updating records remains a challenge.
Overall, individual post-disaster impact and needs assessments have been a key source of information in countries across the income categories. While not giving a comprehensive picture, they often supply detailed data, and in the case of LICs may attract support from international organisations (e.g. a post-flood needs assessment in Togo in 2010, conducted with support from the World Bank and UNDP).
10. Coverage of early warning systemsCoverage of early warning systems (EWS) is difficult to measure,7 but all of the case study countries regard national and local EWS as a priority, and in general they made significant progress in this area during the HFA period. For example, Togo’s flood EWS grew from a test programme in 100 villages in 2009 into a national system with 19 local platforms by 2016; and in 2013 Nepal launched a 15-year plan to implement EWS across the country. Some of this progress was stimulated by major disasters, notably the 2004 tsunami, which led to significant progress towards national-level and multi-hazard EWS in Sri Lanka and Thailand in the following years.
Most effort seems to have has gone into systems for specific prominent hazards, but several multi-hazard systems exist, and there is growing emphasis on this approach. Many countries have engaged in long-range climate forecasting and simulations, particularly to support their National Adaptation Programmes of Action, but two (Guinea Bissau, and Saint Kitts and Nevis) did not invest in this, possibly due to lack of capacity and resources. Overall, there is very little information on use of forecasts in sectoral planning.
7 An EWS has four key elements, each of which could represent coverage. See United Nations (2016) Report of the open-ended intergovernmental expert working group on indicators and terminology relating to disaster risk reduction: www.preventionweb.net/files/50683_oiewgreportenglish.pdf
There are relatively few reported constraints on EWS progress in the HFA progress reports, but these include inadequate infrastructure, lack of equipment and trained personnel, and the challenges of translating scientific and technical information into a format accessible by the general public and of raising awareness among local communities. EWS coverage is also difficult to assess. Countries with higher resource levels tend have well established EWS, pre-dating the HFA period, that are more extensive in geographical scope and hazards coverage. Regular tests and exercises enable systems to be reviewed and modified, although the Czech Republic was the only country to report on this.
Non-governmental actors have sometimes played an important role in EWS development. For instance, work on the Togo flood EWS originated as an initiative of the Togolese Red Cross, and Red Cross volunteers play a key role in its operation; whilst in Nepal collaboration between government departments and non-governmental organisations (NGOs) is a feature of many district-level EWS. In many countries, the media are key partners in warning dissemination.
National EWS are also linked to scientific information providers overseas and associated regional and global networks. In Sri Lanka, for example, the Ministry of Health coordinates with the World Health Organisation over disease outbreaks; Saint Kitts and Nevis receives weather satellite imagery access and forecasting support from the US National Oceanic and Atmospheric Administration; and the Czech Republic cooperates closely over flood data and warning exchange with neighbouring countries sharing the same river system. The role of international donor funding is also acknowledged by some countries as having been an important catalyst for the development of national EWS.
Pillar 2. Key areas of progress and next steps
Key areas of progressCoverage of early warning systems (EWS). Developing effective EWS has been prioritised in all countries. Improvements in coverage of EWS and their effectiveness in reducing loss of life are not captured in the HFA reporting data. Nevertheless, the relationship between EWS and a reduction in loss of life has been established elsewhere (for example in Bangladesh, see Haque et al., 2011) and investing in these systems is a sensible priority for LICs in particular, given that they are relatively low cost (compared to other structural DRR measures) and attract donor funding.
Next stepsThe next step is to invest in more integrated EWS working across different geographical and time scales, including the use of short-, medium- and long-term forecasts in river basins, making DRR interventions climate-smart and ecosystem-based.
Pillar 3. Use knowledge, innovation and education to build a culture of safety and resilience at all levels
11. DRR in school curriculaIn all categories, most progress was made in the latter part of the HFA reporting period. Overall, there was clear progress towards more comprehensive, integrated approaches, and in some cases towards mandatory teaching on DRR. Yet levels of achievement varied widely between countries, with countries in the same income brackets showing very different levels of commitment and achievement. The wealthier countries demonstrated mixed progress.
LICs appear to have taken the issue seriously, but they were greatly constrained by a lack of funding (for DRR education and the education sector as a whole) and a lack of qualified teachers. Other actors and funders played an important role in resourcing and promoting DRR teaching – such as UNDP’s support for putting DRR into primary and secondary school curricula in Togo in 2014, and into primary education in Guinea-Bissau in 2015. However, one-off interventions and funding favour a project-type approach to education instead of continuing improvement. The need for appropriate teacher training was also highlighted in MICs.
Higher education and university courses were not mentioned by LICs, but in some MICs (principally Sri Lanka and Thailand) there was more emphasis on their role in DRR education. External agencies and international initiatives have played some role in stimulating progress in DRR education in the MICs (e.g. the influence of the UNSIDR global campaign ‘Disaster Risk Reduction Begins at School’ on Fiji’s initiatives to mainstream DRR in schools), although the HFA reports do not demonstrate clear causal links in most cases.
A common feature of the reporting in all country categories was ambiguity about the content of DRR education. It is not clear to what extent this was a stand-alone subject or integrated into a range of subjects within the curriculum; nor whether it focused on immediate, practical aspects such as emergency drills, or took a broader DRR perspective. By sharing frameworks, standards and best practices between countries, greater harmonisation in the quality of DRR education could be achieved.
12. Training and capacity-building in DRR plansThe HFA reports have little to say on the range of training and capacity-building activities that took place, the coverage or the impact. The reports focus on training, principally by government institutions and for government officials, although in some cases other training providers are mentioned. In general, this area appears to be underdeveloped, although this impression may be due to the very limited reporting available.
Overall, the HFA reports may not accurately reflect what was happening on the ground. Trainings and capacity-building initiatives at the local level were not always included. Some initiatives and innovations do appear to have taken place, but there are no visible trends during the reporting period. Instead of taking a strategic view, governments across the categories appear to have developed patchworks of training initiatives on DRR or on specific technical aspects, such as safe building or post-disaster needs assessments.
In LICs, training and capacity-building appears to be a significant area of weakness, being limited and sporadic except where donor funding is available. Some MICs have established national DRR colleges to train professionals and government officials (e.g. Mexico and Thailand). There are few references however to volunteer or community-level training initiatives led by governments. Given the lack of capacity to design and implement DRR actions expressed in the HFA reports, capacity-building is clearly an important component of a longer-term DRR strategy.
13. Public awareness and media outreach campaignsThere is no discernible trend in improving awareness and outreach during the HFA reporting period. All countries recognise the importance of public awareness-raising, but the HFA reports do not suggest that they have long-term strategies for this (with the exception of Fiji, where high impact disasters have motivated politicians to take this issue more seriously).
National campaigns (e.g. designated disaster days or weeks) are the most prominent activities across the countries surveyed. The emphasis appears to be on disaster preparedness and response. Some countries put resources into activities at particularly hazardous times of year (e.g. the hurricane season) or focusing on particularly significant hazards (e.g. diseases). It is not clear whether these awareness-raising initiatives were linked to EWS or not. Reports show that these activities can reach large numbers of people: for example, Guinea-Bissau’s health and hygiene campaign in 2008 reached over 400,000 people; civil protection public outreach activities in the Czech Republic between 2012 and 2014 reached over 1 million people. However, little detail is given and there is very little evidence of impact.
Lack of finance is a notable constraint on activity in LICs, which depend on international funding to a large extent. In general, MICs are more active in public awareness, are engaged with a wider range of media, are more conscious of the need to reach local levels, and are possibly more involved in international awareness-raising campaigns. Nevertheless, these countries vary in their levels of commitment. Only one HFA report amongst all those reviewed in this study (Thailand’s HFA report, 2015) spoke of the importance of considering indigenous knowledge in this area of activity. This is an interesting finding given
22 ODI Report

Delivering disaster risk reduction by 2030 23
indigenous and traditional knowledge is commonly used to prepare for, cope with and survive disasters. Communication of this indigenous knowledge would be a relatively low-cost and beneficial measure.
Pillar 4. Reduce the underlying risk factors
14. DRR in climate change adaptation policiesAs national adaptation action plans and programmes were developed during the HFA period, many appear to have drawn on existing DRR policies and experience in considering how to manage climate-related risks over the short term. DRR policies and legislation are often referred to in climate change adaptation (CCA) policy documents. However, in all but a few of the case study countries, there have been difficulties in jointly developing CCA and DRR plans. Implementation is led by different departments, and this institutional separation means that activities are usually carried out in parallel. In Thailand, lack of technical capacity is cited as the problem for integrating these two related sets of policies.
One exception is Fiji, where there is a Joint National Action Plan for DRR and CCA. In the Czech Republic, towards the end of the HFA period, a more concerted effort was made to link DRR and adaptation in the 6th National Communication under the United Nations Framework Convention on Climate Change (UNFCCC), which refers to specific DRR measures needed to reduce climate change impacts, and an interdepartmental working group on climate change was set up to develop action plans.
15. DRR in environmental policies and impact assessmentsGovernments reported very differently on how DRR is incorporated into environmental policies and impact assessments. In some countries, DRR now needs to be included in environmental impact assessments (EIAs) by law (Fiji, Saint Kitts and Nevis, and Mexico), but this is established by different types of legislation. In Mexico, for example, it is the Civil Protection Law (2012) that establishes that an EIA for new developments must integrate risk, while in Fiji the EIA legislation includes a section on hazards and risks so that DRR can be embedded into the planning process. In the LICs, DRR is referred to in EIAs or environmental impact studies, but these are not conducted in a consistent or comprehensive way. In these and other countries, a common approach has been to develop specific environmental protection policies with a focus on environmentally fragile and hazard-prone places.
16. Making hospitals safeHospital safety was a key focus of the HFA, and a number of international agencies invested heavily in programmes to retrofit and safely build public health facilities. Nonetheless, in the LICs there was little progress in assessing the safety of hospital buildings during the HFA period. No measures to improve hospital safety were reported in Guinea-Bissau or Togo from 2005 to 2015, while in Nepal some assessments were carried out towards the end of the HFA period and 10 structural plans developed for hospitals. Some earthquake risk reduction programmes exist for hospitals in Nepal and retrofitting has reportedly taken place, but the scope of this was not reported.
Pillar 3. Key areas of progress and next steps
Key areas of progress1. Incorporating DRR in school curricula was one of the DRR activities where most attention seems to have
been paid during the HFA, helped in part by donor-funded NGO/CSO projects targeting specific school areas or hazards. All countries have made efforts to embed teaching of DRR in schools through the development of topics and modules in school curricula. Wealthier countries show different levels of commitment, indicating that in this area it is not so much about availability of resources as government interest.
2. National DRR awareness-raising campaigns are relatively low cost and popular everywhere. These tend to be one-off or infrequent initiatives. There is some monitoring of coverage but there is little discussion of what campaigns have achieved.
Next steps
1. Knowledge-sharing initiatives highlighting best practices can now be promoted to harmonise and improve the quality of DRR education and standardisation of content.
2. If public awareness and media outreach campaigns were evaluated, their effectiveness could be better understood and used as an incentive to promote awareness raising more regularly and consistently across the country.

In the MICs with fewer resources, legislation and/or guidelines for hospital safety were developed later in the HFA period, and there are a number of initiatives in these countries promoted by eternal agencies such as the UN Children’s Fund (UNICEF) earthquake resistant health centres and social case centres and UNISDR’s One Million Safe Schools and Hospitals campaign. In the wealthier MICs, there appear to have been more extensive programmes of risk assessment of hospital buildings: in Mexico, this began at the start of the HFA (although many still have not been assessed); in Saint Kitts and Nevis, an extensive assessment process took place in 2009; and in the Czech Republic, 90% had been assessed by 2015. It is not clear, however, what proportion of those assessed were deemed unsafe and how many have been retrofitted or rebuilt as a result. This data could be used as an indicator of physical vulnerability.
17. Making schools safeFor school safety, similarly, there have been only a few initiatives reported in LICs (with the exception of Nepal, which has received significant funding for retrofitting), while in the MICs with fewer resources, more attention has been gradually paid to ensuring that new school buildings in hazard-prone areas adhere to building standards under the HFA. This was supported through external funding and technical assistance from around 2013, when the One Million Safe Schools and Hospitals campaign was launched (supported by UNISDR in collaboration with the World Health Organization (WHO); the UN Educational, Scientific and Cultural Organization (UNESCO); UNICEF; World Bank; and the Asian Development Bank (ADB)). In Mexico, the Czech Republic, and Saint Kitts and Nevis, school safety programmes also increased in the second half of the HFA, and more detail is presented in the HFA reports on progress in assessing schools and taking action to improve structures than in the lower-income countries. The Czech Republic reported that no schools were unsafe from disasters in 2015.
18. Risk-financing mechanisms and shock-responsive safety netsRisk-financing mechanisms exist in all of the reviewed countries, and it is notable that attempts have been made in the LICs to promote the use of microfinance to help households cope with disasters. The HFA reports of both Togo and Guinea-Bissau highlight the need for crop and property insurance schemes as well as strengthening of social safety nets to provide cash transfers after a disaster. In Nepal the insurance market is underdeveloped, and although the country received external support to develop risk-transfer mechanisms, the government notes that vulnerable groups are still not covered by either insurance or social safety nets.
Meanwhile, in Fiji the insurance market has been growing and is now the second largest in the Pacific. Fiji is ready to develop catastrophic risk insurance and will join other MICs Saint Kitts and Nevis (through the Caribbean Catastrophe Risk Insurance Facility) and Mexico in being able to use these kinds of instruments to transfer risk and avoid some of the substantial economic impacts disasters have caused in the past. The Mexican CAT Bond was developed early (in 2006 it was the world’s first government catastrophic bond), and this instrument has been developed since to provide coverage against major losses from earthquakes and hurricanes.
All the MICs have crop insurance schemes and insurance for property and other economic activities, but the coverage is not adequate. In Mexico, only 20% of losses from two hurricanes in 2013 were insured. In the Czech Republic the coverage is higher: before the HFA, when floods hit in 2002, 40% of losses were insured (although this was through commercial insurance schemes, not government initiatives).
Social safety nets of some form exist in all the MICs, and in a few (for example, the ‘Oportunidades’ scheme in Mexico) these have the capacity to be scaled up in a disaster, usually through the delivery of conditional cash transfers (cash-for-work or temporary employment schemes), although it is not clear how comprehensive these would be. The term ‘shock responsive’ was not used to refer to national social safety nets in any of the HFA reports submitted for these countries. This is a relatively new concept and there is growing interest in using existing social protection systems to channel support to those affected by disaster, and this is likely to become a more prominent feature of the SFDRR.
19. Land-use planning and building codesAt the start of the HFA, land-use planning was weak or non-existent in two of the LICs reviewed (Togo and Guinea-Bissau). During the HFA some attention was paid to integrating risk in planning instruments, but this was not taken much further. The Togolese government admitted that poor people who move into urban areas often end up in high-risk locations where building codes are ignored. In Nepal, the government has paid greater attention to improving the building codes themselves, and made them more relevant to local conditions (to include relevant risks) in 2008, but implementation has been patchy. Safer building construction was a government priority even before the 2015 earthquake, but beyond initiatives to build safer public buildings (and use safer building practices in reconstruction after a disaster) it is not clear how this priority is being applied throughout the country.
In the lower and upper MICs, the HFA saw increasing interest in land-use planning as an approach to reducing risk (or avoiding risk creation), particularly
24 ODI Report

Delivering disaster risk reduction by 2030 25
in urban areas. Fiji also has a rural land-use policy to avoid desertification, and in Sri Lanka hazards maps have been used to inform construction in landside-prone areas. In Thailand, building construction regulations have been developed especially for earthquakes. Although Thailand, Sri Lanka, and Saint Kitts and Nevis have some of the required instruments to control land use and construction, poor implementation of these regulations is cited as a major problem.
Both the Czech Republic and Mexico had policies and regulations to control development in hazardous areas before the HFA. In the Czech Republic these dealt principally with flood risk (and still do), and are fairly comprehensive, incorporating legal instruments (regulations for land use and infrastructure development) as well as broader spatial development policies and urban plans for water management. It is acknowledged that the building codes need updating and are not always followed but there is some monitoring of compliance. Mexico has adopted a stronger line on enforcement: under the 2012 national civil protection law, public officials can be penalised for authorising land-use permits without a risk assessment and formal approval. Municipal governments in Mexico are responsible for producing land-use regulations, issuing licenses and permits, and ensuring compliance but technical capacities to do this are still lacking in many municipalities, and a clear national strategy is needed to implement the ambitions of the 2012 law.
In all the case study countries, the social and economic pressures driving increasing construction in high-risk areas (in cities and along coasts in particular), as well as the poor quality of new housing, are key drivers of risk. Developing codes and regulations that can be implemented, as well as monitoring and incentivising compliance with these, remain huge challenges and are clearly a priority for implementing the SFDRR.
Pillar 5: Strengthen disaster preparedness for effective response at all levels
20. National and local contingency plansIn 2005, the majority of these case study countries had developed some kind of contingency plan at national level and many at the local level too. In a number of cases these were very top-down, but only one country, Guinea-Bissau, did not have a contingency plan in 2005.
Over the next 10 years, national and local contingency plans developed to include more hazard types, to expand geographical coverage, and to go across scales (namely from national down to local level). The Czech Republic is a notable exception, where relatively well-established structures for preparedness and response do not appear to have altered fundamentally over the reporting period. In a number of other case study examples, emphasis is placed on sectoral contingency planning at the national level. This was the case for Nepal with the development of the cluster-based approach to DRR through the Nepal Risk Reduction Consortium (NRRC).
National and local contingency plans may exist almost everywhere, but hazard coverage and quality vary greatly. Plans for predictable and seasonable hazards are more common, though these plans are often designed in isolation from other hazards.
Contingency plans that were developed or updated during the HFA demonstrate a shift in focus: from detailing only rescue and response activities to including preparedness and recovery actions. In Togo, for example, the 2008 rescue plan (Plan ORSEC) was adapted over time based on lessons from disasters, and by 2015 a multi-risk National Contingency Plan was adopted, providing a framework for decision-making, coordination, action and funding.
By 2015 a number of contingency plans were supported by national financing arrangements to enable rapid mobilisation of resources in the event of a disaster, including to the sub-national level. Fiji for example includes a National Contingency Fund with financial reserves to support and scale up National Disaster Management Office (NDMO) operations as required.
There is significant variation in the maturity of specific aspects of contingency plans, across scales. Taking the example of search and rescue, the country cases range from having a relatively well-developed network of operations (Czech Republic) through to having no state-funded search-and-rescue operations (Nepal). Moreover, trainings and drills are frequently referenced in national progress reports as components of contingency plans, but no countries demonstrate a strategic approach to building capacity to enable improved action as a result of contingency plans, and exercises relate to only some parts of the crisis management cycle.
Pillar 4. Key areas of progress and next steps
Key areas of progressThere were no quick wins for this pillar, although several countries made some progress in school and hospital safety.
Next stepsReducing underlying risk requires a wide range of actions to address the complex structural factors that shape risk and vulnerability. These actions should be core components of a national DRR strategy (see section 5).
Overall, more support is needed to strengthen contingency planning and training and to standardise emergency procedures. Where most progress has taken place, plans have extended to improve coordination across levels of government, sectors, and private sector actors – and include consideration of gender – as is the case for Mexico.
21. Emergency fundBy 2015, all of the countries had an emergency fund of some form except for two of the LICs – Togo and Guinea-Bissau. Where a fund does not exist, the intention to establish an emergency fund is often cited, but constraints include a lack of state funds (Togo and Guinea-Bissau); and where resource allocation is limited, the lack of approval by Treasury is cited as a constraint (Sri Lanka).
Where national funds for response and recovery are in operation, the focus is on the provision of goods and services primarily covering the period of immediate response, often determined by Post Disaster Needs Assessments. Some funds are specifically named as the initiative of heads of state or government (Fiji, Nepal). Less focus is given to longer-term recovery or rehabilitation.
For isolated mega disasters, the international community may be called upon through the UN Office for the Coordination of Humanitarian Affairs (OCHA), flash appeals and other mechanisms, as was the case for the 2015 earthquake in Nepal and the 2012 Tropical Cyclone Evan in Fiji. For Togo, in the absence of a national emergency fund, flash appeals and international assistance are the primary sources of response funding.
In Fiji and Thailand national funds were made available to support reconstruction activities and to provide victim compensation, with the expectation that investments
would be made in prevention as well as recovery – to ‘build back better’ and avoid losses in the future.
Of all the case studies, Mexico is a notable exception. Mexico’s emergency response and recovery fund has matured to include resourcing for risk reduction measures, and although the emphasis remains on reconstruction, the proportion allocated to DRR is slowly increasing.
22. Culture of volunteerism and participationSome countries (e.g. Guinea-Bissau, Thailand, and Fiji) had national committees of volunteers prior to the HFA. In Thailand, these were historically rooted in civil defence groups. In other cases committees were established during the HFA period, along with membership-based networks of volunteers from civil society organisations (CSOs). In contrast, in the Czech Republic a legacy of centralised civil protection has resulted in limited civil society engagement in DRR, though the government recognises the need to increase the range of stakeholders involved in DRR (with a draft law on volunteerism in discussion).
The trend during the HFA was to adopt piecemeal approaches to capacity-building and to the integration of volunteer groups into formal assistance and relief efforts, and in all case study countries comprehensive data on volunteerism is lacking (including on training given to volunteers). This is surprising given that the core activities of many CSOs working in DRR is to raise awareness and provide training to community members to improve preparedness and response. As with community participation in DRR policies and plans, records of volunteer group activities are limited in the HFA reports due to lack of government awareness of this civil society engagement.
Pillar 5. Key areas of progress and next steps
Key areas of progress1. Emergency funds were set up in all but a few of the lower-income countries. Failure to set up a fund was
linked to resource constraints rather than lack of interest. Some emergency funds expanded in scope to include elements of preparedness, recovery and rehabilitation (e.g. Mexico, Nepal), but overall the focus remained on emergency response and recovery. There was very little additional funding for pre-emptive DRR activities.
2. Most countries had contingency plans in 2005 but they were limited in scope. Developing the quality and the scope of these to include not only emergency response but more preparedness activities is an important trend across all countries regardless of income level.
Next steps1. Creating an annual fund that government ministries and local governments can access to invest in risk
reduction is an important next step in creating a comprehensive risk-financing structure.2. Contingency plans should be further promoted and refined under the SFDRR as a sub-component of a national
DRR Strategy. These plans will need to be adequately resourced – all potential funding sources should be identified in advance.
26 ODI Report

Delivering disaster risk reduction by 2030 27
An exception is the work of the National Red Cross Societies, which is noted in all country reports. The Red Cross is a key player in response operations and active in mobilising and training local volunteers as first responders (e.g. for earthquakes in Nepal) and in raising awareness of health and hygiene to avoid
disease outbreaks and epidemics (e.g. for cholera in Togo). Participation is substantial, with 8,000 active volunteers in the Czech Republic and over 1 million volunteers in Thailand who have led community-based DRM training. In Nepal the network is extensive, with volunteers able to mobilise across all 75 districts.
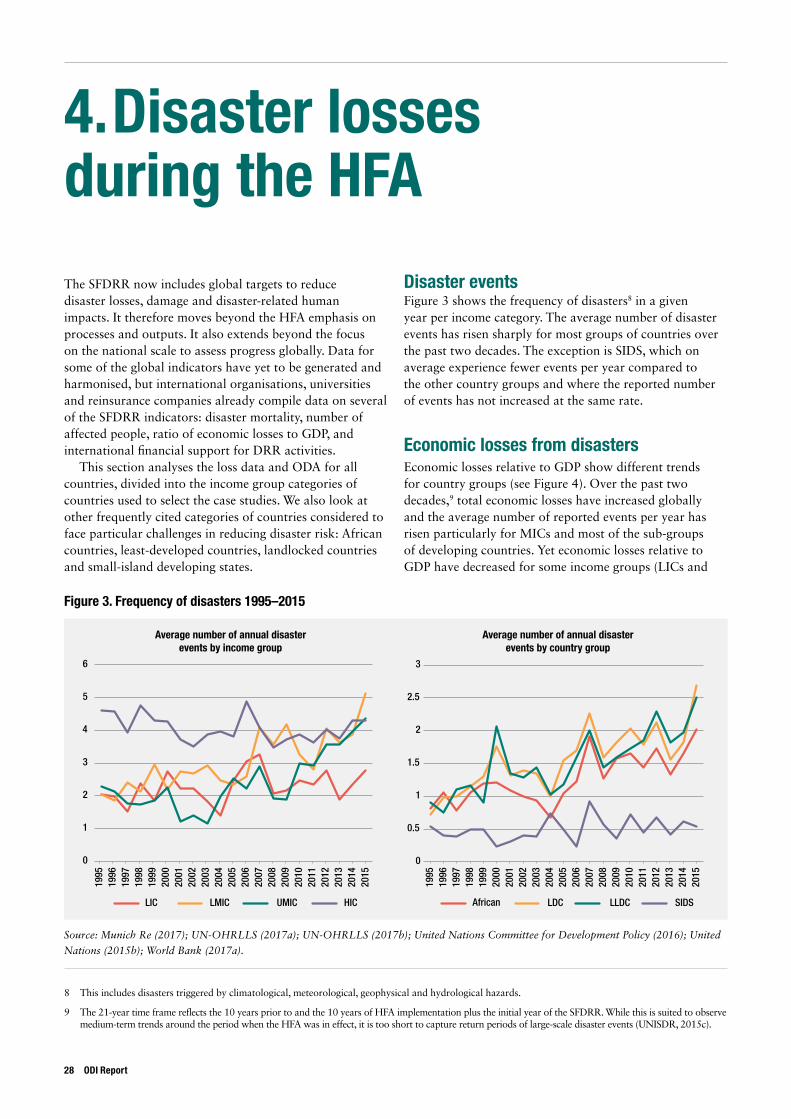
4. Disaster losses during the HFA
8 This includes disasters triggered by climatological, meteorological, geophysical and hydrological hazards.
9 The 21-year time frame reflects the 10 years prior to and the 10 years of HFA implementation plus the initial year of the SFDRR. While this is suited to observe medium-term trends around the period when the HFA was in effect, it is too short to capture return periods of large-scale disaster events (UNISDR, 2015c).
The SFDRR now includes global targets to reduce disaster losses, damage and disaster-related human impacts. It therefore moves beyond the HFA emphasis on processes and outputs. It also extends beyond the focus on the national scale to assess progress globally. Data for some of the global indicators have yet to be generated and harmonised, but international organisations, universities and reinsurance companies already compile data on several of the SFDRR indicators: disaster mortality, number of affected people, ratio of economic losses to GDP, and international financial support for DRR activities.
This section analyses the loss data and ODA for all countries, divided into the income group categories of countries used to select the case studies. We also look at other frequently cited categories of countries considered to face particular challenges in reducing disaster risk: African countries, least-developed countries, landlocked countries and small-island developing states.
Disaster eventsFigure 3 shows the frequency of disasters8 in a given year per income category. The average number of disaster events has risen sharply for most groups of countries over the past two decades. The exception is SIDS, which on average experience fewer events per year compared to the other country groups and where the reported number of events has not increased at the same rate.
Economic losses from disastersEconomic losses relative to GDP show different trends for country groups (see Figure 4). Over the past two decades,9 total economic losses have increased globally and the average number of reported events per year has risen particularly for MICs and most of the sub-groups of developing countries. Yet economic losses relative to GDP have decreased for some income groups (LICs and
0
0.5
1
1.5
2
2.5
3
1995
19
96
1997
19
98
1999
20
00
2001
20
02
2003
20
04
2005
20
06
2007
20
08
2009
20
10
2011
20
12
2013
20
14
2015
African LDC LLDC SIDS
Average number of annual disaster events by income group
Average number of annual disaster events by country group
0
1
2
3
4
5
6
LIC LMIC UMIC HIC
1995
19
96
1997
19
98
1999
20
00
2001
20
02
2003
20
04
2005
20
06
2007
20
08
2009
20
10
2011
20
12
2013
20
14
2015
Figure 3. Frequency of disasters 1995–2015
Source: Munich Re (2017); UN-OHRLLS (2017a); UN-OHRLLS (2017b); United Nations Committee for Development Policy (2016); United
Nations (2015b); World Bank (2017a).
28 ODI Report

Delivering disaster risk reduction by 2030 29
LMICs), while they have stagnated or increased for others (UMICs and HICs) over the same period.11
LICs experience lower disaster-related losses relative to GDP than the other income groups for most years; LMICs have had the highest losses relative to GDP for many of the last 20 years, although these losses have come down more rapidly than for the other groups.12
The SFDRR highlights the relevance of different country contexts and starting points and, in particular, the need to focus on countries in ‘special situations’. African developing countries, Least Developed Countries (LDCs), Landlocked Developing countries (LLDCs) and Small Island Developing States (SIDS) all face specific challenges and require closer attention (UNSIDR, 2015c).
Losses from disasters relative to GDP have traditionally been higher in SIDS than for other groups of countries, but this appears to be changing with relative losses now higher for LDCs (see Figure 5). The general trend seen in Figure 5 appears to be one of decreasing losses relative to GDP across all the country groups in special situations, with the exception of LLDCs and African countries.
10 Losses are in USD adjusted to 2016 Consumer Price Index (CPI) while GDP is constant at 2010 USD values in all figures. Linear trends need to be interpreted with caution as data is truncated and zero losses in a given year can be a result of no event as much as a result of an event with no economic impact.
11 Similar to the number of events per year, an increase in losses may be related to enhanced access to information and better reporting over time (Kron et al., 2012). These improvements mostly concern very small events, particularly in developing countries and emerging economies. While some regard the effect of these small events on overall loss amount statistics as negligible (Eichner et al., 2015), the 2015 Global Assessment Report (GAR) on DRR estimates that losses are underestimated by up to 40%, which can be partially attributed to the difficulty of capturing small events (UNISDR, 2015c).
12 This trend can be observed in Figure 4 but it is not a statistically significant change. Country groups are aggregated to reflect total losses relative to total GDP for the whole group. This follows the suggested indicators for the SFDRR but may disguise disaster impacts in smaller economies. Assessing losses relative to average GDP per capita can rebalance the importance of smaller economies in the aggregation.
13 For a detailed definition of the different types of natural disasters as used by EM-DAT and the NatCatSERVICE, see Annex 1 and http://www.emdat.be/classification
The different trajectories of SIDS may be related to the specific profile of hazards they experience. In these countries, meteorological events such as storms or extreme temperatures13 are more common than in other country groups and these have relatively higher economic and human impacts as compared to other hazards (see Annex 1). This is reflected in the SIDS case study countries Fiji and Saint Kitts and Nevis, where, between 1995 and 2015, meteorological events accounted for about 49% and 99% of overall disaster-related losses respectively. However, while GDP grew in SIDS from 1995–2015, the average number of disaster events remained fairly constant and in combination with increasing economic activity in less exposed areas or sectors, this may partially explain why relative losses declined (despite an increase in absolute losses).
Human impacts of disasterLICs and LMICs have the largest share of global disaster fatalities, as shown in Figure 6, and the number of people affected by disasters (per 100,000) is also highest in LICs and LMICs for most years since 1995, reaching almost 15% of the total population of LICs
-0.002
0
0.002
0.004
0.006
0.008
0.010
0.012
0.014
0.016
LIC LMIC UMIC HIC Linear (LIC) Linear (LMIC) Linear (UMIC) Linear (HIC)
1995
1996
1997
1998
1999
2000
2001
2002
2003
2004
2005
2006
2007
2008
2009
2010
2011
2012
2013
2014
2015
Figure 4. Disaster losses by income group (relative to GDP)10
Source: Munich Re (2017); World Bank (2017a); World Bank (2017b).

in 2002 (own calculations based on Guha-Sapir et al., 2017). Individual high-impact disasters largely drive the numbers of fatalities and people affected within countries and across country groups. This is the case, for example, with the Nepal earthquake in April of 2015, where fatalities reached over 30 for every 100,000 people and close to 20% of the country’s entire population was directly affected by the event (own calculations based on Guha-Sapir et al., 2017).
Disasters related to different hazards have different economic and human impacts. The proportion of economic losses and the share of affected population resulting from climatological events, for instance, are relatively high in African and LLDCs (see Annex 1). Climatological events, including droughts, are reported to be responsible for relatively high numbers affected and economic losses, especially in African countries, but are less linked to mortality, injuries and homelessness compared to other hazards. This may be partly related to the definition of impacts used by current databases, which focus mostly on direct disaster impacts. Long-term and indirect impacts are not captured, but may have serious consequences nonetheless: for instance, declining health as a result of malnutrition related to a drought; the spread of diseases in the aftermath of flooding; and loss of employment after disaster-related disruptions to the economy (Wilkinson and Peters, 2015). Simonet et al. (2017) find that a disaster can have negative impacts on national economic growth
14 DRR 1990–2010 (Watson et al., 2015; Kellett and Caravani, 2013). However, the online database has not been updated with information after 2010, and recent international financial flows beyond ODA intended for action on DRR are therefore difficult to track.
as long as three years after the event. A concrete example of indirect consequences are the Thailand floods of 2011, which affected around 700,000 jobs and interrupted supply chains, especially in the electronics and automobile manufacturing industries. Populations in non-flooded areas also experienced this shock due to the detrimental impacts of the floods on the national economy as a whole (Haraguchi and Lall, 2014; Poaponsakorn and Meethom, 2013; Bland and Kwong, 2011).
International support and cooperation for DRRODA funding for disaster prevention and preparedness (DPP), as one part of overall humanitarian aid, is tracked through the OECD creditor reporting system.14 Figure 7 shows the increase in earmarked funding relative to GDP since 2002, when the first ODA disbursements were explicitly allocated as DPP. Studies of DRR aid between 1990 and 2010 that include non-ODA flows show that DRR financing has previously been heavily concentrated on MICs (Kellett and Caravani, 2013), but DPP flows relative to GDP in LICs have grown much faster in recent years.
Despite this increase in reported ODA, international support for DRR represents only a fraction of disaster-related aid flows and development assistance more broadly (Watson et al., 2015). Very little is known about the specific allocation of international financial
LIC27%
UMIC7%
HIC15%
LMIC21%
UMIC10%
HIC5%
Deaths from natural disasters1996–2005
Deaths from natural disasters2006–2015
LIC64%
LMIC51%
Figure 6. Disaster-related deaths by income category (pre- and during the HFA)
Source: Guha-Sapir et al. (2017); World Bank (2017a).
0
0.005
0.010
0.015
0.020
0.025
0.030
0.035
0.040
0.045
African LDC LLDC SIDS
1995
1996
1997
1998
1999
2000
2001
2002
2003
2004
2005
2006
2007
2008
2009
2010
2011
2012
2013
2014
2015
Linear (African) Linear (LDC) Linear (LLDC) Linear (SIDS)
Figure 5. Disaster losses by country group 1995–2015 (relative to GDP)
Source: Munich Re (2017); World Bank (2017b); UN-OHRLLS (2017a); UN-OHRLLS (2017b) United Nations Committee for Development
Policy (2016); United Nations (2015b).
30 ODI Report

Delivering disaster risk reduction by 2030 31
in 2002 (own calculations based on Guha-Sapir et al., 2017). Individual high-impact disasters largely drive the numbers of fatalities and people affected within countries and across country groups. This is the case, for example, with the Nepal earthquake in April of 2015, where fatalities reached over 30 for every 100,000 people and close to 20% of the country’s entire population was directly affected by the event (own calculations based on Guha-Sapir et al., 2017).
Disasters related to different hazards have different economic and human impacts. The proportion of economic losses and the share of affected population resulting from climatological events, for instance, are relatively high in African and LLDCs (see Annex 1). Climatological events, including droughts, are reported to be responsible for relatively high numbers affected and economic losses, especially in African countries, but are less linked to mortality, injuries and homelessness compared to other hazards. This may be partly related to the definition of impacts used by current databases, which focus mostly on direct disaster impacts. Long-term and indirect impacts are not captured, but may have serious consequences nonetheless: for instance, declining health as a result of malnutrition related to a drought; the spread of diseases in the aftermath of flooding; and loss of employment after disaster-related disruptions to the economy (Wilkinson and Peters, 2015). Simonet et al. (2017) find that a disaster can have negative impacts on national economic growth
14 DRR 1990–2010 (Watson et al., 2015; Kellett and Caravani, 2013). However, the online database has not been updated with information after 2010, and recent international financial flows beyond ODA intended for action on DRR are therefore difficult to track.
LIC27%
UMIC7%
HIC15%
LMIC21%
UMIC10%
HIC5%
Deaths from natural disasters1996–2005
Deaths from natural disasters2006–2015
LIC64%
LMIC51%
Figure 6. Disaster-related deaths by income category (pre- and during the HFA)
Source: Guha-Sapir et al. (2017); World Bank (2017a).
0
0.005
0.010
0.015
0.020
0.025
0.030
0.035
0.040
0.045
African LDC LLDC SIDS
1995
1996
1997
1998
1999
2000
2001
2002
2003
2004
2005
2006
2007
2008
2009
2010
2011
2012
2013
2014
2015
Linear (African) Linear (LDC) Linear (LLDC) Linear (SIDS)
Figure 5. Disaster losses by country group 1995–2015 (relative to GDP)
Source: Munich Re (2017); World Bank (2017b); UN-OHRLLS (2017a); UN-OHRLLS (2017b) United Nations Committee for Development
Policy (2016); United Nations (2015b). DRR support, and data on non-ODA DRR flows is not systematically made available (Kellett and Peters, 2013). In the HFA reports submitted by case study countries, none specify how much money was spent on DRR each year.
In the absence of better data, it remains unclear how much additional support for DRR has been provided, beyond what is reported by donors, or for what
15 ODA is in constant 2014 USD. GDP is in constant 2010 USD.
purposes this financing is used. Capturing detailed information on support for technology, innovation or capacity-building (as is suggested in the monitoring indicators for the SFDRR), will require new reporting mechanisms and clearer tracking of DRR financing at the national level, as well as for financing flows involving non-state actors.
0
0.001
0.002
0.003
0.004
0.005
0.006
LIC LMIC UMIC HIC African LDC LLDC SIDS
0
0.001
0.002
0.003
0.004
0.005
0.006
0.007
0.008
0.009
0.010
2002
2003
2004
2005
2006
2007
2008
2009
2010
2011
2012
2013
2014
2015
2002
2003
2004
2005
2006
2007
2008
2009
2010
2011
2012
2013
2014
2015
Total ODA for disaster prevention and preparedness relative to GDP
Total ODA for disaster prevention and preparedness relative to GDP
Figure 7. ODA disbursements for disaster prevention and preparedness (relative to GDP)15
Source: OECD (2017); UN-OHRLLS (2017a); UN-OHRLLS (2017b) United Nations Committee for Development Policy (2016);
United Nations (2015b); World Bank (2017a); World Bank (2017b).
5. Looking ahead to 2030: taking a strategic approach to DRR
Our review of changes under the HFA points strongly to the need for national governments to be more strategic and coordinated in their approach to DRR. Under the HFA, reporting focused on DRR processes and outputs, but the SFDRR requires governments and their partners to focus on the effectiveness of activities in reducing disaster impacts. It is difficult to estimate how effective DRR has been so far as there have been few evaluations of any interventions and interpreting the loss data for the HFA period needs to be done with care. The data are not perfect and come in many forms, and major events can disguise trends. Yet it seems clear that globally, disaster risk is increasing (UNISDR, 2015c); and the number of disasters and absolute losses have also risen since 1995. Nonetheless, economic losses relative to GDP appear to have decreased for some country groups. Further research is needed to better understand this trend but certainly, better monitoring and evaluation of DRR interventions is needed to understand which are having the greatest impact and why.
To make progress against the SFDRR outcome-level goals (reducing disaster mortality, numbers affected, economic losses, and damage to critical infrastructure) will involve a step change: from the individual, pragmatic measures described above to more coordinated national strategies for DRR. Governments will need to set clear objectives for the risk reduction outcomes they want to achieve by 2030 and strategies to achieve them, tracking progress and adapting to changes in the context as needed.
This will require working on two tracks: (1) prioritising initiatives that are catalytic in nature, making more effective use of external funding and accelerating other agendas; and (2) developing a longer-term strategy for institutional change on DRR, backed by national financing mechanisms. Neither track is a ‘quick win’ as both require sustained resourcing.
Prioritising initiatives that are catalytic and accelerate change
Governments should initiate policy and legislative reforms after disasters. High-impact disasters have prompted improvements in financing and while this is not a new finding, there are patterns of consecutive high-impact events that have promoted cumulative steps forward in the development and commitment to DRR. Where DRR legislation was already in place, subsequent major events prompted further reforms, such as accompanying financial mechanisms. For example, in Fiji, major disaster events have led to important legislative and policy reforms. The Tropical Cyclone in 2012 and repeated flood events then prompted renewed attention to the need for comprehensive financial mechanisms for risk transfer and response. These events should be used to stimulate public debate and reflection on the adequacy of policies and development models in place, and not only to suggest ways to be better prepared. Where this isn’t already happening, countries could consider establishing a public inquiry process to determine the causes of disasters related to natural hazards (as is often carried out for ‘man-made’ disasters).
Public awareness campaigns can enhance interest in DRR for specific hazards. However, campaigns tend to focus too narrowly on emergency response and, while demonstrating impressive reach to the local level, often lack evidence of impact. This is the case for Nepal, for example, where although substantial investment in safer schools and public awareness-raising activities has taken place, it remains to be seen how increased DRR knowledge has led to change in societal behaviour and decision-making. Greater and longer-lasting impact could be achieved by creating synergies between public awareness campaigns (which tend to be one-off) and formal education programmes (which lasts longer).
Climate change debates and environmental issues can catalyse changes in DRR legislation. This has happened in Togo, where DRR has been promoted directly through the Environmental Law (2008); while in Mexico the new
32 ODI Report

Delivering disaster risk reduction by 2030 33
Civil Protection Law (2012) was drafted alongside the Climate Change Law (2012), benefiting from commitment within the climate change community to ensure coherence with other sectoral laws. DRR practitioners should seek to actively engage with these debates and policy processes, harnessing political interest in climate change to advance DRR policy and coordination across sectors.
Changes in political situation may warrant a new approach to DRR. In Fiji, during the period of military leadership following the 2006 coup, significant delays were incurred in passing legislation on the new National Disaster Risk Management (NDRM) arrangements. Similar delays to legislative changes were seen in Nepal as a result of political upheaval. Changes in approach to DRR may be required in such situations: for instance, in Fiji, greater emphasis on best practice for civil-military engagement in response was emphasised during the period of military leadership. Nonetheless, it is clear that for progress to be made across all aspects of DRR, some stability in governance arrangements is required. For example, in Guinea-Bissau, progress across the HFA pillars increased slowly from 2014 after the move to a democratically elected government, but political buy-in from senior members of the new transitional government remains an obstacle. Meanwhile, progress in Sri Lanka accelerated rapidly after the war ended, particularly in the northern and eastern provinces.
Externally funded projects can catalyse DRR reforms. This is particularly important to LICs. In contexts where DRR is not prioritised across government, and funding is limited or piecemeal, national governments can use externally funded projects to initiate change or regenerate interest in DRR. However, lots of projects and parallel efforts may not spur political engagement in DRR, and these approaches often persist even when there is a stable and engaged government architecture through which DRR investment and capacity-building could take place (for example, in Nepal and Fiji). National governments should request support to existing national programmes with a preference for measures that strengthen national institutional capacities.
Regional and international initiatives can help set standards and encourage knowledge sharing. The case studies suggest that regional initiatives and institutions like the Association of Southeast Asian Nations (ASEAN) Agreement on Disaster Management and Emergency Response (AADMER) programme encourage information sharing and good practice. Indeed, this study suggests that regional and international agencies are very much needed to encourage knowledge exchange and standard setting on issues such as how to integrate DRR into school curricula. International campaigns can be also influential (for example, the Worldwide Initiative for Safe Schools, coordinated by UNISDR, appears to have stimulated progress) but are inevitably piecemeal, and governments need to take ownership of such initiatives and turn them into national programmes that can be monitored and evaluated.
Towards a longer-term strategy for institutional changeStrengthening capacity and knowledge to implement legislation and policy: With a greater focus on the outcomes of DRR policies in the SFDRR, knowledge and capacities are becoming increasingly important for achieving global targets. LICs generally lack human, technical and financial resources, and MICs need to prioritise capacity-building as a longer-term strategy rather than addressing it in an ad hoc manner. Progress has been slow on enforcement of laws and regulations, irrespective of whether these were established prior to the HFA period or during it. Many countries – including Sri Lanka, Fiji, and Saint Kitts and Nevis – grapple with the challenges of enforcing land-use regulations and building codes, and of ensuring different government entities take responsibility for DRR in their respective sectors or territories in accordance with national legislation. This presents a major barrier to sustained progress on risk reduction. Knowledge sharing and capacity-building to implement laws and policies needs to become a priority for SFDRR implementation.
Incentivising private sector investment and compliance with DRR regulations: If the goals of the SFDRR are to be achieved by 2030, a longer-term strategy is needed for incentivising private sector investments in DRR and for enhancing compliance with EIAs, land-use plans and building codes. As this requires structural changes along with a combination of incentives and enforceable sanctions, it will take time and will demand a longer-term political commitment. Monitoring and publishing results on hazard exposure of public and private buildings that do not comply with standards or are located in high-risk areas can increase accountability. This can be done in partnership with civil society.
Sustained civil society engagement in DRR has clear benefits, yet the HFA reports had relatively little to say about this. Non-state actors play a role in raising awareness, providing training, helping to ensure consideration of gender issues, increasing access to early warning systems, and other critical areas of DRR; all of which have been under-reported by governments. More systematic and sustained engagement with civil society groups will be needed to achieve SFDRR targets (including target ‘g’ on increasing the availability of and access to multi-hazard early warning systems and disaster risk information), as will monitoring and measuring progress in this engagement.
Overcoming size limitations and finite resources: Smaller countries, in particular Small-Island Developing States, and small units of government face different challenges than larger ones. Many SIDS are MICs but the size of the economy is small and they are unable to make significant investments in protective infrastructure, for example. Similarly, Mexico has 2,430 municipalities, some of which are very small and lack resources to

develop and implement plans and regulatory tools to manage risk. Faced with limited budgets, countries and local governments focus on less costly things and on those activities where physical proximity is an advantage, for example engaging communities in disaster preparedness activities (Wilkinson, 2012). A clear strategy that targets key issues like reducing risk in coastal areas, and accessing regional skills and services, could help to overcome some of the constraints of size and geography. At the local level, some earmarked resources will need to be reliably transferred to sub-national units or governments for DRR for local plan to be implemented.
Overcoming constraints of weak institutions, political instability and very low levels of development: Technical and capacity constraints within government are repeatedly noted as barriers to change. There are examples, however, of this being addressed through external support. Togo,
for instance, is reliant on OCHA appeals for major disasters and continually lacks capacity to respond to smaller-scale disaster events. To address this issue, the government, with support from UNDP, created a new agency in 2017 with funding dedicated solely to DRR. Changes in the political climate can also, however, present critical opportunities for altering DRR approaches. In Sri Lanka, after the civil war, efforts to implement national policy for DRR ramped up. Similarly, in Guinea-Bissau, the installation in 2014 of a democratically elected government prompted a series of gradual changes across the HFA priorities for action. Change will inevitably require some international support, but developing and implementing a DRR strategy should be collaborative. For national governments this will mean working with non-state actors and adjusting to new structures, as for example under military rule in Fiji.
34 ODI Report

Delivering disaster risk reduction by 2030 35
6. Next steps: creating a theory of change for DRR
The SFDRR global target ‘e’ is to ‘substantially increase the number of countries with national and local disaster risk reduction strategies by 2020’ (United Nations, 2016). However, according to the analysis presented in this report, governments will need to put in place a national DRR strategy before 2020 if they are to make progress on the disaster loss targets by 2030. The Global Platform for Disaster Risk Reduction being held in Cancun should therefore mark a turning point for national governments – a time to take stock of advances and delays since the HFA. Time is passing by and there is an urgent need to begin working on the more catalytic and longer-term strategies for institutional change that will be needed to deliver results on reducing disaster impacts by 2030.
DRR strategies ‘define goals and objectives across different timescales and with concrete targets, indicators and time frames’ (United Nations, 2016). The next step for government agencies and their partners is to define their national goals, and the sectoral and local objectives that will contribute to achieving those goals. Given the anticipated difficulties in using loss data alone to assess progress over the next 13 years, measuring changes in disaster risk, and in particular vulnerability and exposure, will also be critical. Setting national standards for risk assessments (including agreed definitions, indicators of vulnerability and exposure, and procedures for collecting and recording data), and following these consistently, will be essential to tracking progress against the SFDRR.
Progress should be characterised in terms of ‘preventing the creation of disaster risk, the reduction of existing risk and the strengthening of economic, social, health and environmental resilience’ (UNISDR, 2015a). This means that countries will need to understand not only current patterns of exposure and vulnerability, but also determine where these are likely to increase in the future under a
‘business as usual’ scenario. An analysis of the different components of risk and how they are created is also an important input into the strategic planning process.
DRR policies are essentially in need of a theory of change, and having to report on disaster losses provides a good incentive to develop one. A theory of change describes the logical sequence of an initiative from inputs to outcomes to goals. It is produced through a process of reflection and dialogue amongst stakeholders, through which ideas about change are discussed alongside underlying assumptions of how and why change might happen as an outcome of different initiatives (Vogel, 2012).
Once countries have agreed their national DRR goals, the next step is to work back from these to identify the risk management objectives that need to be reached to get there. These objectives should centre on preventing new risks, reducing existing risks and strengthening resilience (UNISDR, 2015c), which will require measuring and modelling changes in vulnerability and exposure to different hazards and capacities. Next, governments and their partners will need to identify the types of activities or interventions under each of the SFDRR priority areas that will lead to the objectives identified as preconditions for achieving the long-term goals.
Assumptions about how changes will happenThrough this approach, the precise link between activities and the achievement of the long-term goals can be better understood, leading to improved planning and evaluation. Developing a national DRR strategy is a priority for implementing Sendai and using a theory of change to guide planning should yield significant benefits, improving the chances of achieving national goals by 2030.
INTERVENTIONS
• Provide DRR services• Actions to avoid risk (risk-informed
planning)• Regulate private sector activity • Promote collective action and
private sector activity• Coordinate multi-stakeholder activities
OBJECTIVES
• Reduction in exposure and vulnerability objectives (current and future)
• Increase in capacity objectives
GOALS
• Reduce disaster losses• Improve access to and use of
early warning systems and risk assessments
• Improve partnerships for DRR
Figure 8. Example of a theory of change for DRR policies

ReferencesBland, B. and Kwong, R. (2011) ‘Supply chain disruption: sunken ambitions’. 3 November. Financial Times.Eichner, J., Löw, P., Steuer, M. (2015) ‘Innovative new ways of analysing historical loss events’. NatCatSERVICE and
Research. Munich Re.Guha-Sapir, Below, D.R. and Hoyois, Ph. (2017) EM-DAT: International Disaster Database. Brussels: Catholique de
Louvain (www.emdat.be/).Haque, U., Hashizume, M., Kolivras, K.N., Overgaard, H.J., Das, B. and Yamamoto, T. (2011) ‘Reduced death rates from
cyclones in Bangladesh: What more needs to be done?’, Bulletin of the World Health Organization 90 (2): 150–156.Haraguchi, M. and Lall, U. (2014) ‘Flood risk and impacts: A case study of Thailand’s floods in 2011 and research
questions for supply chain decision making’, International Journal of Disaster Risk Reduction 14 (3): 256–272.Kellett, J. and Caravani, A. (2013) Financing disaster risk reduction. A 20 year story of international aid. London: Overseas
Development Institute (www.odi.org/sites/odi.org.uk/files/odi-assets/publications-opinion-files/8574.pdf).Kellett, J. and Peters, K. (2013) Dare to prepare: taking risk seriously. London: Overseas Development Institute
(www.odi.org/publications/7955-dare-prepare-taking-risk-seriously).Kron, W., Steuer, M., Löw, P. and Wirtz, A. (2012) ‘How to deal properly with a natural catastrophe database – analysis
of flood losses’, Natural Hazards and Earth System Sciences 12(3): 535–550.Munich Re (2017) NatCatSERVICE database.Natural Earth (2017) Admin – 0 Countries. Version 2.0.0. (www.naturalearthdata.com/
downloads/10m-cultural-vectors/10m-admin-0-countries/).OECD (2017) Creditor reporting system (CRS) (https://stats.oecd.org/Index.aspx?DataSetCode=CRS1). OECD (2017).UN-OHRLLS (2017a) Small Island Developing States Country Profiles (http://unohrlls.org/about-sids/country-profiles/)
OHRLLS (2017).UN-OHRLLS (2017b) Landlocked Developing Countries Country Profiles (http://unohrlls.org/about-lldcs/
country-profiles/).United Nations Committee for Development Policy (2016) List of Least Developed Countries (www.un.org/en/
development/desa/policy/cdp/ldc/ldc_list.pdf).Poaponsakorn, N., Meethom, P. (2013) ‘Impact of the 2011 Floods, and Flood Management in Thailand’. ERIA
Discussion Paper Series No. 34.PreventionWeb (2017) HFA National Progress Query Tool (www.preventionweb.net/applications/hfa/qbnhfa/).Simonet, C., Comba, E. and Wilkinson, E. (2017) Disasters and national economic resilience. An analysis of BRACED
countries. BRACED Working Paper. London: Overseas Development Institute.United Nations (2016) Report of the open-ended intergovernmental expert working group on indicators and terminology
relating to disaster risk reduction, A/71/644. (www.preventionweb.net/files/50683_oiewgreportenglish.pdf).United Nations International Strategy for Disaster Risk Reduction (UNISDR) (2005) Hyogo Framework for Action
2005–2015: Building the resilience of nations and communities to disasters (www.preventionweb.net/files/1037_hyogoframeworkforactionenglish.pdf).
United Nations International Strategy for Disaster Risk Reduction (UNISDR) (2013) Global assessment report on disaster risk reduction 2013: From shared risk to shared value, the business case for disaster risk reduction (www.unisdr.org/we/inform/publications/33013).
United Nations International Strategy for Disaster Risk Reduction (UNISDR) (2015a) Sendai Framework for Disaster Risk Reduction 2015–2030. Geneva: UNISDR (www.preventionweb.net/files/43291_sendaiframeworkfordrren.pdf).
United Nations International Strategy for Disaster Risk Reduction (UNISDR) (2015b) ‘Considerations on Developing a System of Indicators Based on the Sendai Framework for Disaster Risk Reduction 2015–2030: A proposal for monitoring progress’. Document prepared for the Expert Meeting on Developing Indicators for Disaster Risk Reduction, 27–29 July 2015. Geneva: UNISDR.
United Nations International Strategy for Disaster Risk Reduction (UNISDR) (2015c) Global Assessment Report on disaster risk reduction 2015: Making development sustainable: The future of disaster risk management (www.preventionweb.net/english/hyogo/gar/2015/en/gar-pdf/GAR2015_EN.pdf).
UN-OHRLLS (2017a) Small Island Developing States Country Profiles (http://unohrlls.org/about-sids/country-profiles/)OHRLLS (2017).
UN-OHRLLS (2017b) Landlocked Developing Countries Country Profiles (http://unohrlls.org/about-lldcs/country-profiles/).
Vogel, I. (2012) Review of the use of ‘Theory of Change’ in international development: Review Report. London: UK Department for International Development.
36 ODI Report
Delivering disaster risk reduction by 2030 37
Watson, C., Caravani, A., Mitchell, T., Kellett, J. and Peters, K. (2015) Finance for reducing disaster risk: 10 things to know. London: Overseas Development Institute (www.odi.org/sites/odi.org.uk/files/odi-assets/publications-opinion-files/9480.pdf).
Wilkinson, E. (2013) ‘Why “small is beautiful” in municipal disaster risk reduction: Evidence from the Yucatán peninsula, Mexico’, Environmental Hazards, 11(2): 155–171.
Wilkinson, E. and Peters, K. (eds.) (2015) Climate extremes and resilient poverty reduction: Development designed with uncertainty in mind. London: Overseas Development Institute.
World Bank (2017a) World Bank Country and Lending Groups. (https://datahelpdesk.worldbank.org/knowledgebase/articles/906519-world-bank-country-and-lending-groups).
World Bank (2017b) World Development Indicators. World Bank DataBank. (http://databank.worldbank.org/data/reports.aspx?source=2&series=NY.GDP.MKTP.KD&country=).

Annex 1. Methodological clarifications
Definition of natural hazards
Source: Adjusted from EM-DAT (2017) General Classifications (www.emdat.be/classification); Kron et al. (2012).
The EM-DAT and NatCatSERVICE database also define biological and extraterrestrial hazards as part of natural hazards, but these two subgroups are not included in this paper due to lack of data availability of sum indicators and low occurrence in relation to other hazards respectively.
Disaster Subgroup Definition Disaster Type
Geophysical A hazard originating from solid earth. This term is used interchangeably with the term geological hazard.
Earthquake
Mass movement
Volcanic activity
Meteorological A hazard cause by short-lived, micro- to meso-scale extreme weather and atmospheric conditions that last from minutes to days.
Extreme temperature
Fog
Storm
Hydrological A hazard caused by the occurrence, movement, and distribution of surface and subsurface freshwater and saltwater.
Flood
Landslide
Wave action
Climatological A hazard caused by long-lived, meso- to macro-scale atmospheric processes ranging from intra-seasonal to multi-decadal climate variability.
Drought
Glacial lake outburst
Wildfire
38 ODI Report
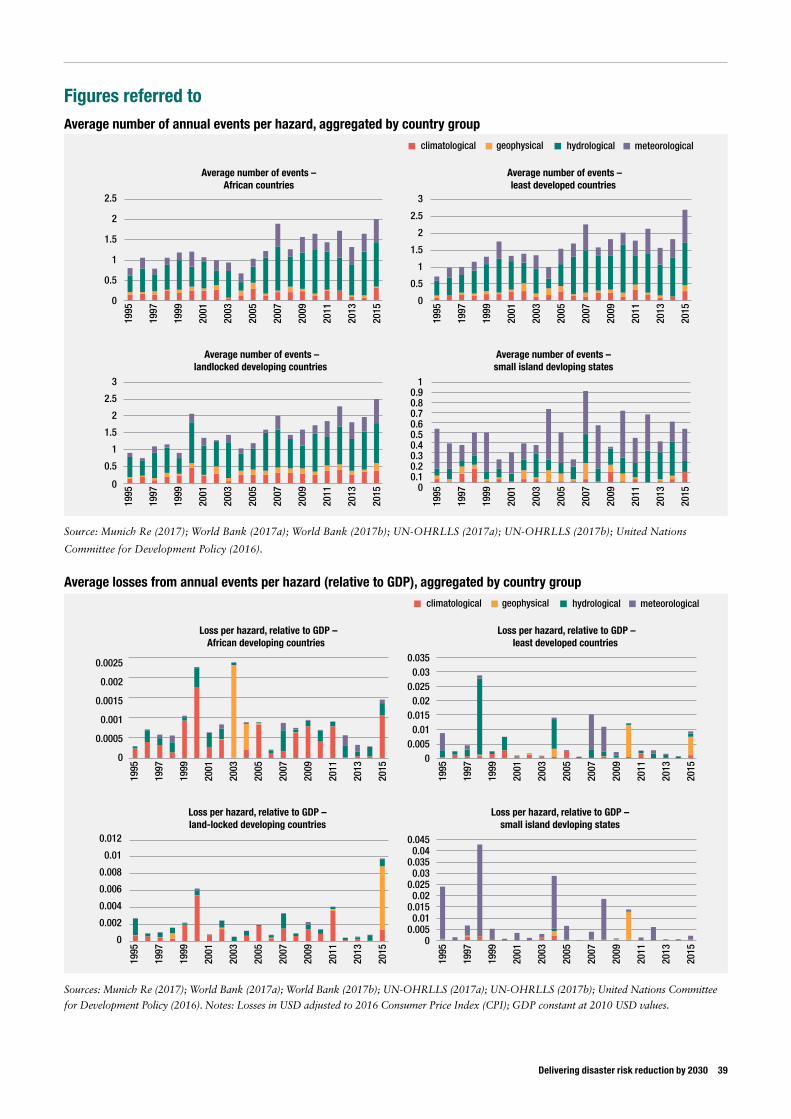
Delivering disaster risk reduction by 2030 39
Figures referred toAverage number of annual events per hazard, aggregated by country group
Source: Munich Re (2017); World Bank (2017a); World Bank (2017b); UN-OHRLLS (2017a); UN-OHRLLS (2017b); United Nations
Committee for Development Policy (2016).
Average losses from annual events per hazard (relative to GDP), aggregated by country group
Sources: Munich Re (2017); World Bank (2017a); World Bank (2017b); UN-OHRLLS (2017a); UN-OHRLLS (2017b); United Nations Committee
for Development Policy (2016). Notes: Losses in USD adjusted to 2016 Consumer Price Index (CPI); GDP constant at 2010 USD values.
climatological geophysical hydrological meteorological
0
0.5
1
1.5
2
2.5
3
Average number of events –least developed countries
Average number of events –African countries
0
0.5
1
1.5
2
2.5
3
Average number of events –landlocked developing countries
0 0.1 0.2 0.3 0.4 0.5 0.6 0.7 0.8 0.9
Average number of events – small island devloping states
0
0.5
1
1.5
2
2.5
1995
1997
1999
2001
2003
2005
2007
2009
2011
2013
2015
1995
1997
1999
2001
2003
2005
2007
2009
2011
2013
2015
1995
1997
1999
2001
2003
2005
2007
2009
2011
2013
2015
1995
1997
1999
2001
2003
2005
2007
2009
2011
2013
2015
1
climatological geophysical hydrological meteorological
0
0.0005
0.001
0.0015
0.002
0.0025
Loss per hazard, relative to GDP –African developing countries
0
0.002
0.004
0.006
0.008
0.01
0.012
Loss per hazard, relative to GDP – land-locked developing countries
0 0.005 0.01
0.015 0.02
0.025 0.03
0.035 0.04
0.045
Loss per hazard, relative to GDP – small island devloping states
0 0.005 0.01
0.015 0.02
0.025 0.03
0.035
Loss per hazard, relative to GDP –least developed countries
1995
1997
1999
2001
2003
2005
2007
2009
2011
2013
2015
1995
1997
1999
2001
2003
2005
2007
2009
2011
2013
2015
1995
1997
1999
2001
2003
2005
2007
2009
2011
2013
2015
1995
1997
1999
2001
2003
2005
2007
2009
2011
2013
2015
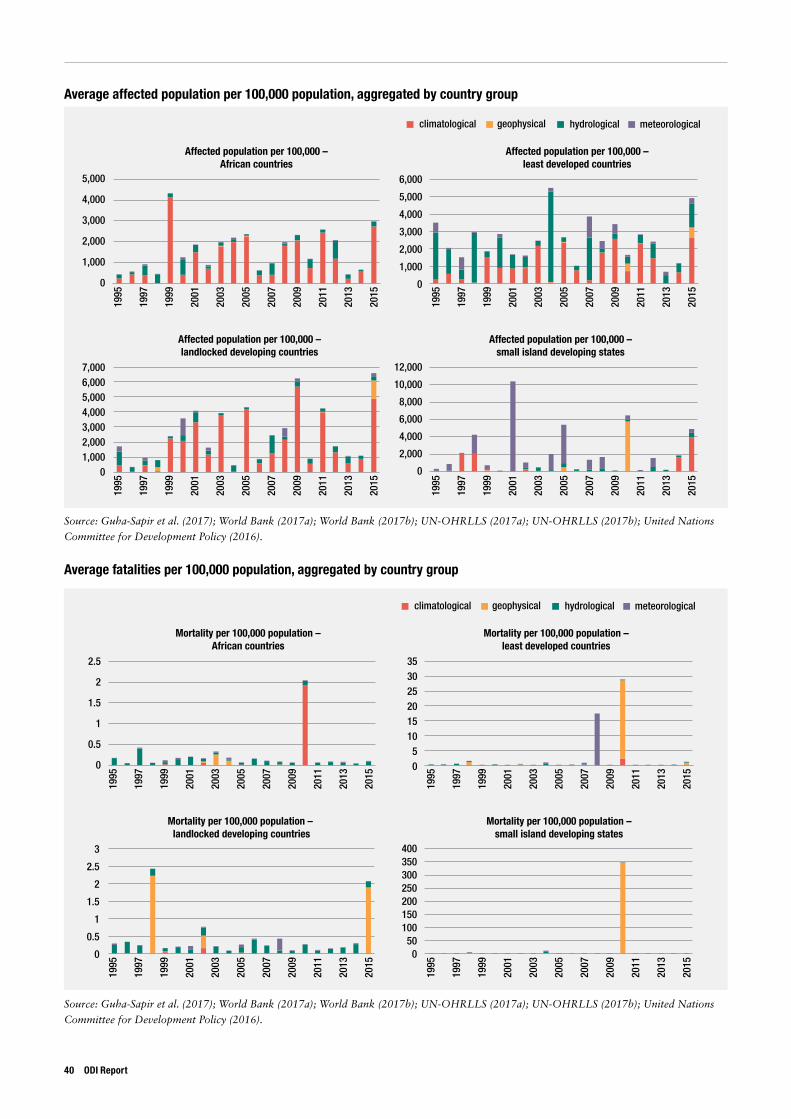
Average affected population per 100,000 population, aggregated by country group
Source: Guha-Sapir et al. (2017); World Bank (2017a); World Bank (2017b); UN-OHRLLS (2017a); UN-OHRLLS (2017b); United Nations
Committee for Development Policy (2016).
Average fatalities per 100,000 population, aggregated by country group
Source: Guha-Sapir et al. (2017); World Bank (2017a); World Bank (2017b); UN-OHRLLS (2017a); UN-OHRLLS (2017b); United Nations
Committee for Development Policy (2016).
climatological geophysical hydrological meteorological
0
1,000
2,000
3,000
4,000
5,000
Affected population per 100,000 –African countries
0
1,000
2,000
3,000
4,000
5,000
6,000
Affected population per 100,000 –least developed countries
0 1,000 2,000 3,000 4,000 5,000 6,000 7,000
Affected population per 100,000 –landlocked developing countries
0
2,000
4,000
6,000
8,000
10,000
12,000
Affected population per 100,000 –small island developing states
1995
1997
1999
2001
2003
2005
2007
2009
2011
2013
2015
1995
1997
1999
2001
2003
2005
2007
2009
2011
2013
2015
1995
1997
1999
2001
2003
2005
2007
2009
2011
2013
2015
1995
1997
1999
2001
2003
2005
2007
2009
2011
2013
2015
climatological geophysical hydrological meteorological
0
0.5
1
1.5
2
2.5
Mortality per 100,000 population –African countries
0 5
10 15 20 25 30 35
Mortality per 100,000 population –least developed countries
0
0.5
1
1.5
2
2.5
3
Mortality per 100,000 population – landlocked developing countries
0 50
100 150 200 250 300 350 400
Mortality per 100,000 population –small island developing states
1995
1997
1999
2001
2003
2005
2007
2009
2011
2013
2015
1995
1997
1999
2001
2003
2005
2007
2009
2011
2013
2015
1995
1997
1999
2001
2003
2005
2007
2009
2011
2013
2015
1995
1997
1999
2001
2003
2005
2007
2009
2011
2013
2015
40 ODI Report

Delivering disaster risk reduction by 2030 41
Average injured population per 100,000, aggregated by country group
Source: Guha-Sapir et al. (2017); World Bank (2017a); World Bank (2017b); UN-OHRLLS (2017a); UN-OHRLLS (2017b); United Nations
Committee for Development Policy (2016).
Average homeless population per 100,000, aggregated by country group
Source: Guha-Sapir et al. (2017); World Bank (2017a); World Bank (2017b); UN-OHRLLS (2017a); UN-OHRLLS (2017b); United Nations
Committee for Development Policy (2016).
climatological geophysical hydrological meteorological
0
0.5
1
1.5
2
2.5
3
Injured population per 100,000 –African countries
0 5
10 15 20 25 30 35 40
Injured population per 100,000 –least developed countries
0 2 4 6 8
10 12 14 16 18
Injured population per 100,000 –landlocked developing countries
0
100
200
300
400
500
Injured population per 100,000 –small island developing states
1995
1997
1999
2001
2003
2005
2007
2009
2011
2013
2015
1995
1997
1999
2001
2003
2005
2007
2009
2011
2013
2015
1995
1997
1999
2001
2003
2005
2007
2009
2011
2013
2015
1995
1997
1999
2001
2003
2005
2007
2009
2011
2013
2015
climatological geophysical hydrological meteorological
0 10 20 30 40 50 60 70 80
Homeless population per 100,000 –African developing countries
0
50
100
150
200
250
300
Homeless population per 100,000 –least developed countries
0 50
100 150 200 250 300 350 400 450
Homeless population per 100,000 –landlocked developing countries
0 50
100 150 200 250 300 350
Homeless population per 100,000 –small island developing states
1995
1997
1999
2001
2003
2005
2007
2009
2011
2013
2015
1995
1997
1999
2001
2003
2005
2007
2009
2011
2013
2015
1995
1997
1999
2001
2003
2005
2007
2009
2011
2013
2015
1995
1997
1999
2001
2003
2005
2007
2009
2011
2013
2015


ODI is the UK’s leading independent think tank on international development and humanitarian issues.
Readers are encouraged to reproduce material from ODI Reports for their own publications, as long as they are not being sold commercially. As copyright holder, ODI requests due acknowledgement and a copy of the publication. For online use, we ask readers to link to the original resource on the ODI website. The views presented in this paper are those of the author(s) and do not necessarily represent the views of ODI.© Overseas Development Institute 2017. This work is licensed under a Creative Commons Attribution-NonCommercial Licence (CC BY-NC 4.0).
All ODI Reports are available from www.odi.org
A boy fishes in flood waters in Lop Buri, Thailand. Corporal Robert J Maurer/US Marine Corps, 2011. Public domain.
Overseas Development Institute203 Blackfriars Road London SE1 8NJTel +44 (0) 20 7922 0300 Fax +44 (0) 20 7922 0399
odi.org