delivering on our promises barclays bank plc annual report 2010
TRANSCRIPT

Delivering on our promisesBarclays Bank PLC Annual Report 2010barclays.com/annualreport10
Contents
02 Keyperformanceindicators06 Financialreview68 Directors’report72 IndependentAuditors’report74 Consolidatedaccounts
RegisteredandHeadoffice:1ChurchillPlaceLondonE145HPTel:+44(0)2071161000
CompanyNo.1026167
Coverimage:BarclaysistheexclusivesponsorofBarclaysCycleHirewhichwaslaunchedon30thJuly2010inLondon.Italreadyseesmorethan5,000cyclesavailableincentralLondon,withnearly3millionjourneyscompleted.TheschememakesapositivecontributiontosocietyinLondonandpartnersBarclayswithasustainableandenvironmentallyfriendlymodeoftransport.
Theterm‘BarclaysPLCGroup’meansBarclaysPLCtogetherwithitssubsidiariesandtheterm‘BarclaysBankPLCGroup’or'Group'meansBarclaysBankPLCtogetherwithitssubsidiaries.‘Barclays’isusedtorefertoeitheroftheprecedinggroupswhenthesubjectmatterisidentical.Theterm‘ParentCompany’or‘Parent’referstoBarclaysPLCandtheterm‘Bank’or'Company'referstoBarclaysBankPLC.Theterm‘AbsaGroupLimited’isusedtorefertoAbsaGroupLimitedanditssubsidiariesandtheterm‘Absa’isusedtorefertotheBarclayssegmentrepresentedbythisbusinessasdescribedonpage160.Inthisreport,theabbreviations‘£m’and‘£bn’representmillionsandthousandsofmillionsofpoundssterlingrespectively;theabbreviations‘US$m’and‘US$bn’representmillionsandthousandsofmillionsofUSDollarsrespectivelyand‘€m’and‘€bn’representmillionsandthousandsofmillionsofeurosrespectively.InformationrelatestotheGroupunlessotherwisestated.
Unlessotherwisestated,theincomestatementanalysescomparethetwelvemonthsto31stDecember2010tothecorrespondingtwelvemonthsof2009andbalancesheetcomparisons,relatetothecorrespondingpositionat31stDecember2009.Unlessotherwisestated,alldisclosedfiguresrelatetocontinuingoperations.RelevanttermsthatareusedinthisdocumentbutarenotdefinedunderapplicableregulatoryguidanceorInternationalFinancialReportingStandards(IFRS)areexplainedintheglossaryintheBarclaysPLC2010AnnualReport.
Forward-looking statementsThisdocumentcontainscertainforward-lookingstatementswithinthemeaningofSection21EoftheUSSecuritiesExchangeActof1934,asamended,andSection27AoftheUSSecuritiesActof1933,asamended,withrespecttocertainoftheGroup’splansanditscurrentgoalsandexpectationsrelatingtoitsfuturefinancialconditionandperformance.Barclayscautionsreadersthatnoforward-lookingstatementisaguaranteeoffutureperformanceandthatactualresultscoulddiffermateriallyfromthosecontainedintheforward-lookingstatements.Theseforward-lookingstatementscanbeidentifiedbythefactthattheydonotrelateonlytohistoricalorcurrentfacts.Forward-lookingstatementssometimesusewordssuchas‘may’,‘will’,‘seek’,‘continue’,‘aim’,‘anticipate’,‘target’,‘expect’,‘estimate’,‘intend’,‘plan’,‘goal’,‘believe’orotherwordsofsimilarmeaning.Examplesofforward-lookingstatementsinclude,amongothers,statementsregardingtheGroup’sfuturefinancialposition,incomegrowth,assets,impairmentcharges,businessstrategy,capitalratios,leverage,paymentofdividends,projectedlevelsofgrowthinthebankingandfinancialmarkets,projectedcosts,estimatesofcapitalexpenditures,andplansandobjectivesforfutureoperationsandotherstatementsthatarenothistoricalfact.Bytheirnature,forward-lookingstatementsinvolveriskanduncertaintybecausetheyrelatetofutureeventsandcircumstances,including,butnotlimitedto,UKdomesticandglobaleconomicandbusinessconditions,theeffectsofcontinuedvolatilityincreditmarkets,marketrelatedriskssuchaschangesininterestratesandexchangerates,effectsofchangesinvaluationofcreditmarketexposures,changesinvaluationofissuednotes,thepoliciesandactionsofgovernmentalandregulatoryauthoritiesincludingcapitalrequirments,changesinlegislation,thefurtherdevelopmentofstandardsandinterpretationsunderIFRSapplicabletopast,currentandfutureperiods,evolvingpracticeswithregardtotheinterpretationandapplicationofstandardsunderIFRS,theoutcomeofpendingandfuturelitigation,thesuccessoffutureacquisitionsandotherstrategictransactionsandtheimpactofcompetition–anumberofsuchfactorsbeingbeyondtheGroup’scontrol.Asaresult,theGroup’sactualfutureresultsmaydiffermateriallyfromtheplans,goals,andexpectationssetforthintheGroup’sforward-lookingstatements.
Anyforward-lookingstatementsmadehereinspeakonlyasofthedatetheyaremade.ExceptasrequiredbytheUKFinancialServicesAuthority(FSA),theLondonStockExchangeorapplicablelaw,Barclaysexpresslydisclaimsanyobligationorundertakingtoreleasepubliclyanyupdatesorrevisionstoanyforward-lookingstatementscontainedinthisannouncementtoreflectanychangeinBarclaysexpectationswithregardtheretooranychangeinevents,conditionsorcircumstancesonwhichanysuchstatementisbased.Thereadershould,however,consultanyadditionaldisclosuresthatBarclayshasmadeormaymakeindocumentsithasfiledormayfilewiththeSEC.
BarclaysBankPLCAnnualReport2010 www.barclays.com/annualreport10 01

Capital KPIs
Definition Why it’s important to the business and management
CoreTier1ratio
Capitalrequirementsarepartoftheregulatoryframeworkgoverninghowbanksanddepositoryinstitutionsaremanaged.Capitalratiosexpressabank’scapitalasapercentageofitsriskweightedassets.BothCoreTier1andTier1capitalresourcesaredefinedbytheUKFSA.CoreTier1isbroadlytangibleshareholders’fundslesscertaincapitaldeductionsfromTier1.
TheGroup’scapitalmanagementactivitiesseektomaximiseshareholders’valuebyprudentlyoptimisingthelevelandmixofitscapitalresources.TheGroup’scapitalmanagementobjectivesaretomaintainsufficientcapitalresourcesto:ensurethefinancialholdingcompanyiswellcapitalisedrelativetotheminimumregulatorycapitalrequirementssetbytheUKFSAandUSFederalReserve;ensurelocallyregulatedsubsidiariescanmeettheirminimumregulatorycapitalrequirements;supporttheGroup’sriskappetiteandeconomiccapitalrequirements;andsupporttheGroupandtheBank’screditratings.
During2010,theBank’sCoreTier1ratioimproved0.8%to10.9%,largelythrough£4.2bnofattributableprofits,demonstratingtheGroup’sabilitytogeneratecapitalorganically.
10 – 10.9%09 – 10.1%08 – 5.6%
Adjustedgrossleverage
AdjustedgrossleverageisdefinedasthemultipleofadjustedtotaltangibleassetsovertotalqualifyingTier1Capital.Adjustedtotaltangibleassetsaretotalassetslessderivativecounterpartynetting,assetsundermanagementonthebalancesheet,settlementbalances,goodwillandintangibleassets.Tier1CapitalisdefinedbytheUKFSA.
Barclaysbelievesthattherewillbemorecapitalandlessleverageinthebankingsystemandthatlowerlevelsofleverageareregardedasakeymeasureofstabilitygoingforward.Thisisconsistentwiththeviewsofourregulatorsandinvestors.
In2010,adjustedgrossleveragewasbroadlyflatat20timesprincipallyasaresultofa£4billionincreaseinTier1Capitalto£53.7billionoffsetbytheimpactofa£84.6billionincreaseinadjustedtotaltangibleassets.
10 – 20x09 – 19x08 – 28x
Returns KPIs
Definition Why it’s important to the business and management
Profitbeforetax
Profitbeforetaxandadjustedprofitbeforetaxarethetwoprimaryprofitabilitymeasuresusedtoassessperformance.Profitbeforetaxrepresentstotalincomelessimpairmentchargesandoperatingexpenses.Adjustedprofitbeforetaxrepresentsprofitbeforetaxadjustedformovementsonowncredit,gainsonacquisitionsanddisposals,andgainsondebtbuy-backs,forcomparativepurposes.
Profitbeforetaxisakeyindicatoroffinancialperformancetomanyofourstakeholders.
Adjustedprofitbeforetaxincreased11%to£5,478mfrom£4,916m.
Profitbeforetax10–£6,079m09–£4,559m08–£5,094m
Adjustedprofitbeforetax10–£5,478m09–£4,916m08–£674m
Cost:incomeratio
Cost:incomeratioisdefinedasoperatingexpensescomparedtototalincomenetofinsuranceclaims.
Thisisameasuremanagementusestoassesstheproductivityofthebusinessoperations.Restructuringthecostbaseisakeyexecutionpriorityformanagementandincludesareviewofallcategoriesofdiscretionaryspendingandananalysisofhowwecanrunthebusinesstoensurethatcostsincreaseataslowerratethanincome.Wehavesetatargettotake£1bnoffourrun-ratecostbaseonafullyearbasisby2013.
10 – 63%09 – 57%08 – 63%
Keyperformanceindicators
02 BarclaysBankPLCAnnualReport2010 www.barclays.com/annualreport10

Returns KPIs continued
Definition Why it’s important to the business and management
Loanlossrate
Theloanlossraterepresentstheimpairmentchargeonloansandadvancesasaproportionoftheperiodendbalances.
ThegrantingofcreditisoneofBarclaysmajorsourcesofincomeanditsmostsignificantrisk.Theloanlossrateisanindicatorofthecostofgrantingcredit.
During2010impairmentcontinuedtoimproveacrossallourbusinesseswithoneexception,thecorporateportfolioinSpain,resultinginaloanlossrateof118bpscomparedto156bpsreportedin2009.
10 – 118 bps09 – 156 bps08 – 95 bps
Income growth KPIs
Definition Why it’s important to the business and management
Totalincome
Definedastotalincomenetofinsuranceclaims. TotalincomeisakeyindicatoroffinancialperformancetomanyofourstakeholdersandincomegrowthakeyexecutionpriorityforBarclaysmanagement.
Grouptotalincomeincreased8%to£31.5billion.
10 – £31,450m09 – £29,094m08 – £21,153m
Incomebygeography
Definedastotalincomenetofinsuranceclaimsgeneratedindistinctgeographicsegments.Geographicsegmentalanalysisisbasedoncustomerlocationandthedefinitonofthecountrieswithineachregionareprovidedintheglossary.
Thegoalofincreasingtheinternationaldiversificationofourincomehelpstoreduceriskbyprovidingexposuretodifferenteconomiccylesandandisdemonstratedbyourratioofnon-UKtoUKbusinessincome.
Geographic split of income2010
%2009
%2008
%
UK&Ireland 40 45 57EuropeanRegion 15 15 19Americas 25 22 0Africa 15 14 17Asia 5 4 7
BarclaysBankPLCAnnualReport2010 www.barclays.com/annualreport10 03

Keyperformanceindicatorscontinued
Citizenship KPIs
Definition Why it’s important to the business and management
GrossnewlendingtoUKhouseholdsandbusinesses
DefinedaslendingtoUKhouseholdsandthosebusinesseswithUK-basedactivities.
Wehaveremained'openforbusiness'duringtheeconomicdownturn,andarefocusedonlendingresponsiblytoourcustomersandclientsaroundtheworld.In2009,wecommittedtomakeanadditional£11billionofcreditavailabletotheUKeconomy,andbytheendof2009,wehadlentanadditional£35billiontoUKhouseholdsandbusinesses.Supportingcustomersindifficultyhasneverbeenmorecritical,butprovidingaccesstocreditmustbebasedontheabilitytorepay.WeincreasedourlendingacrosstheUKto£43billionin2010,including£7.5billionarisingfromtheacquisitionofStandardLifeBank.
WeseethisasanimportantperformancemetricandhaveformallymeasuredUKgrosslendingsince2009.
10 – £43bn09 – £35bn08 – n/a
Globalinvestmentinourcommunities
DefinedasBarclaystotalcontributiontosupportingthecommunitieswhereweoperate.
Thesuccessandcompetitivenessofabusinessandtheextenttowhichitcontributestoandisintegratedinthecommunitiesinwhichitoperatesarecloselyrelated.Wearecommittedtomaintaininginvestmentinourcommunitiesforthelong-termbothingoodtimesandinbad.Thisperformancemetricdemonstratestheconsistencyofourcommitmentovertime.
10 – £55.3m09 – £54.9m08 – £52.2m
Colleaguesinvolvedinvolunteering,regulargivingandfundraisinginitiatives
DefinedasthetotalnumberofBarclaysemployeestakingpartinvolunteering,givingorfundraisingactivities.
Barclayscommunityinvestmentprogrammeaimstoengageandsupportcolleaguesaroundtheworldtogetinvolvedwithourmainpartnerships,aswellasthelocalcausestheycareabout.Harnessingtheirenergy,timeandskillsdeliversrealbenefittolocalcommunities,totheirownpersonaldevelopmentandtotheirengagementwithBarclays.
10 – 62,00009 – 58,00008 – 57,000
GroupEmployeeOpinionSurvey(EOS)-ProudtobeBarclays
Employeeopinionssurveysareusedacrosstheorganisationtounderstandouremployees'viewsandprioritisemanagementactionsinordertomeetemployeeneeds.ThisKPIisacalibrationofdifferentsurveyscoresacrossBarclaysforaquestionmeasuringsenseofprideinbeingassociatedwithorworkingforBarclays.Theaveragescoresforeachyeararegiven.
UnderstandinglevelsofemployeeengagementandsenseofcommitmenttoBarclaysisimportantasthereisastrongcorrelationbetweenthesefactorsandouremployees’commitmenttoservingtheneedsofourcustomersandclients.
10 – 83%09 – 81%08 – 81%
Percentageofseniormanagerswhoarefemale
ThenumberoffemalecolleagueswhoareworkingacrossallBarclaysbusinessesattheseniormanagementlevelasapercentageofthetotalseniormanagerpopulation.
DiversityisimportanttoBarclaysaswebelievethatonlythroughaccesstothemostdiversepooloftalentwillwerecruitandretainthemosttalentedindividualstoserveourcustomersandclients.
Thenumberoffemalesattheseniormanagementlevelhasremainedflatdemonstratingthatthereisstillworktobedonetoincreasethenumberofwomenreachingandretainingrolesatthislevelofmanagement.
10 – 24%09 – 24%08 – 25%
04 BarclaysBankPLCAnnualReport2010 www.barclays.com/annualreport10

Previously reported KPIs:KPIsareupdatedperiodicallyasourstrategyandexecutionprioritiesevolve.MeasuresnolongeridentifiedasKPIsthatwerereportedintheprioryearareasfollows:
Measures 2010 2009 2008
Tier1ratio 13.5% 13.0% 8.6%
Averagetermofunsecuredliabilities 30months 26months 14months
UKRetailBankingcustomersatisfaction 64.0% 62.5% n/a
BarclaycardInternational–numberofcustomers 10.5m 10.8m 11.8m
NumberofdistributionoutletsoutsidetheUK 2,906 3,603 3,158
ProportionofGlobalRetailandCommercialBankinginternationalincome ReplacedbyincomebygeographyfollowingGroupreorganisation
NetlendinginBarclaysCommercialBank ReplacedbyGrossnewlendingtoUKhouseholdsandbusinesses
BarclaysBankPLCAnnualReport2010 www.barclays.com/annualreport10 05

Barclays delivered profit before tax of £6,079m in 2010, an increase of 33% (2009: £4,559m). Excluding movements on own credit, gains on debt buy-backs and gains on acquisitions and disposals, Group profit before tax increased 11% to £5,478m (2009: £4,916m).
Income increased 8% to £31,450m (2009: £29,094m). Barclays Capital reported a 17% increase in total income to £13,600m (2009: £11,625m). This reflected a substantial reduction in losses taken through income relating to credit market exposures which fell to £124m (2009: £4,417m) and a gain relating to own credit of £391m (2009: loss of £1,820m). Top-line income at Barclays Capital, which excludes these items, declined 25% to £13,333m relative to the exceptionally strong levels seen in 2009. Overall activity levels improved towards the end of the year, with top-line income in the fourth quarter of 2010 increasing 20% on the third quarter to £3,380m. Global Retail Banking income increased 1% to £10,507m, with good growth in UK Retail Banking and Barclays Africa, with income flat in Barclaycard, and a decline in Western Europe Retail Banking. Income was up 14% in Absa. Barclays Corporate reported a decrease in income of 7% and income was up 18% in Barclays Wealth.
Impairment charges and other credit provisions improved 30% to £5,672m (2009: £8,071m). This was after an increase of £630m in impairment on the Spanish loan book in Barclays Corporate – Continental Europe. All other businesses reported improvements in impairment charges. Overall impairment charges as a proportion of Group loans and advances as at 31st December 2010 was 118bps, compared to 156bps for 2009.
As a result, net income for the Group after impairment charges increased 23% to £25,778m (2009: £21,023m).
Operating expenses increased £3,255m to £19,967m, a 19% rise compared to the 23% growth in net income. Costs at Barclays Capital increased £1,703m, largely reflecting investment in the business across sales, origination, trading and research functions, investment in technology and infrastructure, and increased charges relating to prior year deferrals. Across the Group, restructuring charges totalled £330m (2009: £87m) particularly in Barclays Corporate (£119m) and Barclays Capital (£90m) focusing on delivering future cost and business efficiencies. Goodwill of £243m was written off in Barclays Corporate – New Markets to reflect impairment to the carrying value of Barclays Bank Russia business as our activities there are refocused. As a result, the Group’s cost: income ratio increased to 63% (2009: 57%). The cost: net income ratio improved from 79% to 77%, reflecting the reduced impairment charges compared with 2009.
Staff costs increased 20% to £11.9bn (2009: £9.9bn), of which performance costs amounted to £3.5bn (2009: £2.8bn). Within this total, 2010 charges relating to prior year deferrals increased by £0.7bn relative to 2009. The Group 2010 performance awards (which exclude charges relating to prior year deferrals but include current year awards vesting in future years) were down 7% on 2009 at £3.4bn. Within this, the Barclays Capital 2010 performance awards were down 12% at £2.6bn, compared to an increase in headcount of 7%.
Financial reviewIncome statement commentary
06 Barclays Bank PLC Annual Report 2010 www.barclays.com/annualreport10

Total assetsTotal assets increased £111bn to £1,490bn.
Cash, balances at central banks and items in the course of collection have increased £15.9bn contributing to the increase in the Group liquidity pool. Trading portfolio assets increased £17.5bn and reverse repurchase lending increased £62.3bn reflecting business growth while keeping our adjusted gross leverage at 20x (2009: 19x). Financial assets designated at fair value have decreased by £1.1bn primarily due to a decrease in debt securities.
Derivative financial assets increased £3.5bn reflecting increases in the mark to market positions in interest rate and foreign exchange derivatives due to movements in forward interest rate curves and volatility in the foreign exchange market. This was partially offset by decreases in credit, equity and commodities derivatives due to reduced volatility.
Loans and advances to banks and customers increased £4.4bn due to an increase in lending to retail customers, including the effect of the acquisition of Standard Life Bank, offset by a reduction in borrowings by wholesale customers and banks.
Available for sale financial investments increased £8.8bn primarily driven by purchase of government bonds increasing the Group’s liquid assets and the transfer from loans and advances to available for sale assets of the receivables arising as part of the acquisition of the North American business of Lehman Brothers. This was partially offset by a £0.8bn reduction in the fair value of the Group’s investment in BlackRock, Inc.
Total liabilitiesTotal liabilities increased £107bn to £1,427bn.
Deposits from banks, and items in the course of collection from banks and customer accounts increased £24.7bn reflecting the acquisition of Standard Life Bank and customer deposit growth across the Group. Financial liabilities designated at fair value increased £9.8bn primarily due to increased debt securities and debt issuances strengthening the Group’s liquidity position. Debt securities in issue increased £20.7bn primarily due to increases in bonds, medium term notes, certificates of deposit and commercial paper. This growth was primarily to fund the increased liquidity pool and business growth.
Trading portfolio liabilities increased £21.4bn and repurchase agreements and other similar secured borrowing increased £26.8bn reflecting business growth.Derivative financial liabilities increased £2.1bn broadly in line with the increase in gross derivative assets. Subordinated liabilities increased £2.7bn primarily reflecting issuances and acquisitions partially offset by redemptions. Other liabilities decreased £1.3bn reflecting reduced retirement benefit liabilities, current tax liabilities and other creditors.
Shareholders’ EquityTotal shareholders’ equity increased £3.9bn to £62.6bn (2009: £58.7bn). Retained earnings increased £4.4bn to £41.5bn (2009: £37.1bn). Profit attributable to the equity holders of the Parent of £4.2bn and proceeds from capital injection by Barclays PLC were partially offset by dividends paid to shareholders of £0.2bn.
Significant movements in other reserves comprise: the redemption of £0.5bn reserve capital instruments, available for sale reserve movement of £1.3bn, primarily due to the decrease in the fair value of the Group’s investment in BlackRock Inc. of £0.8bn, partially offset by increases in the fair value of other available for sale assets. Currency translation reserve movement of £0.8bn is largely due to the appreciation in the Rand and US Dollar, offset by the depreciation in the Euro.
Non-controlling interests increased £0.7bn to £3.5bn (2009: £2.8bn). The increase primarily reflects profit for the year attributable to non-controlling interests of £0.4bn and currency translation differences of £0.4bn, offset by distributions of £0.2bn.
Adjusted Gross LeverageBarclays continues to operate within the limits and targets for balance sheet usage as part of its balance sheet management activities.
The adjusted gross leverage was 20x as at 31st December 2010 (2009:19x) principally as a result of a £4.0bn increase in Tier 1 Capital to £53.7bn offset by the impact of a £87.3bn increase in adjusted total tangible assets. At month ends during 2010 the ratio moved in a range from 20x to 24x, with fluctuations arising as a result of normal trading activities, primarily due to increases in reverse repurchase trading and changes in holdings of trading portfolio assets.
The ratio of total assets to total shareholders equity was 24x as at 31st December 2010 (2009: 24x). The ratio moved within a month end range of 24x to 29x, driven by trading activity fluctuations noted above, as well as changes in gross interest rate derivatives and settlement balances.
The Basel Committee of Banking Supervisors (BCBS) issued final guidelines for ‘Basel III: a global regulatory framework for more resilient banks and banking systems’ in December 2010. The guidelines include a proposed leverage metric, to be implemented by national supervisors in parallel run from 1st January 2013 (migrating to a Pillar 1 measure by 2018). Based on our interpretation of the current BCBS proposals the Group’s Basel III leverage ratio as at 31st December 2010 would be within the proposed limit of 33x.
Financial reviewBalance sheet commentary
Barclays Bank PLC Annual Report 2010 www.barclays.com/annualreport10 07

Capital ManagementAt 31st December 2010, on a Basel II basis, the Group’s Core Tier 1 ratio was 10.9% (2009: 10.1%) and the Tier 1 ratio was 13.5% (2009: 13.0%), representing a strengthening of our capital ratios ahead of the effects of expected regulatory capital changes.
Risk weighted assets increased 4% from £383bn to £398bn in 2010. Year on year there was a £22bn reduction in underlying risk weighted assets (predominantly in Barclays Capital) as a result of capital management efficiencies and reduced levels of risk and inventory. This was offset by both methodology and model changes, which increased risk weighted assets by approximately £28bn. Foreign exchange and other movements accounted for a further increase of £9bn.
The Basel Committee of Banking Supervisors issued final Basel III guidelines in December 2010 and January 2011. The new standards include changes to risk weights applied to our assets and to the definition of capital resources and are applicable from 1st January 2013 with some transitional rules to 2018. The Basel III guidelines have yet to be implemented into European and UK law and therefore remain subject to refinement and change. Recognising the new rules are not complete, based on our current assessment of the guidelines, we expect that we will continue to have a strong capital position post implementation.
Liquidity The liquidity pool held by the Group increased £27bn to £154bn at 31st December 2010 (2009: £127bn), of which £140bn was in FSA-eligible pool assets.
The Basel III guidelines propose two new liquidity metrics: the Liquidity Coverage Ratio, which measures short term liquidity stress and is broadly consistent with the FSA framework, and the Net Stable Funding Ratio, which measures the stability of long term structural funding. Applying the metrics to the Group balance sheet as at 31st December 2010, the Liquidity Coverage Ratio was estimated at 80% and the Net Stable Funding Ratio was estimated at 94%.
The Group continues to attract deposits in unsecured money markets and to raise additional secured and unsecured term funding in a variety of markets. As at 31st December 2009, the Group had £15bn of publicly issued term debt maturing during 2010. The corresponding figure for 2011 is £25bn. During 2010 the Group issued approximately £35bn of term funding, which refinanced the 2010 requirement, comprising both maturities and early repayments, as well as pre-financed some of the 2011 and 2012 maturities. Additional term funding raised in 2011 will support balance sheet growth, further extension of liability maturities and strengthening of our liquidity position.
Financial reviewBalance sheet commentary continued
08 Barclays Bank PLC Annual Report 2010 www.barclays.com/annualreport10

Financial reviewAnalysis of results by business
Business performance
Global Retail BankingGlobal Retail Banking (GRB) performance exhibited encouraging signs of growing momentum against a challenging backdrop. Overall profit before tax was £1,829m (2009: £1,821m) with strong profit growth in UK Retail Banking and Barclays Africa, good growth in Barclaycard and a loss in Western Europe Retail Banking. Total GRB income increased 1% to £10,507m (2009: £10,374m) reflecting business growth, increased net interest margins in Barclaycard and Barclays Africa, a stable margin in UK Retail Banking and a lower margin in Western Europe Retail Banking. Risk appetite remained consistent with improved collections and better economic conditions leading to lower impairment which drove an improved risk adjusted net interest margin. Operating expenses increased 10% to £6,020m (2009: £5,490m) primarily due to higher pension costs, the impact of acquisitions and higher regulatory-related costs. Overall GRB return on average risk weighted assets improved to 1.7% (2009: 1.5%) and GRB’s loan to deposit ratio improved to 140% (2009: 144%). The performance of the businesses within GRB is summarised below:
UK Retail BankingUK Retail Banking (UKRB) profit before tax increased 39% to £989m (2009: £710m), including a £100m gain on the acquisition of Standard Life Bank, with good income growth and lower impairment charges more than offsetting an increase in operating expenses. Income increased 6% to £4,518m (2009: £4,276m). Impairment charges decreased 21% to £819m (2009: £1,031m), reflecting good risk management and improving economic conditions. As a result, net income grew 14% to £3,699m (2009: £3,245m). Operating expenses increased 11% to £2,809m (2009: £2,538m), reflecting higher pension costs, the impact of the acquisition of Standard Life Bank and increased regulatory-related costs. Excluding these items, operating expenses were in line with prior year.
BarclaycardBarclaycard profit before tax increased 9% to £791m (2009: £727m) largely as a result of lower impairment charges. Income was £4,024m (2009: £4,041m) with the impact of regulation offset by business growth. Impairment charges reduced 6% to £1,688m (2009: £1,798m) as a result of focused risk management and improving economic conditions. Delinquency trends were lower in all major areas of the Barclaycard business. Operating expenses increased 3% to £1,570m (2009: £1,527m).
Western Europe Retail BankingWestern Europe Retail Banking incurred a loss before tax of £139m (2009: profit of £280m). The deterioration was driven by the challenging economic environment, continued investment in the franchise and £157m of profit on disposal recognised in 2009. Income fell 12% to £1,164m (2009: £1,318m) principally due to margin compression and the decline in the average value of the Euro against Sterling, partially offset by higher fees and commissions and the growth in credit cards. Impairment charges improved by 7% to £314m (2009: £338m). Operating expenses increased 16% to £1,033m (2009: £887m) mainly due to continued investment in developing the franchise in Portugal and Italy, notably the expansion of the credit card businesses in these countries.
Barclays AfricaBarclays Africa profit before tax increased 81% to £188m (2009: £104m). 2010 included a one-off gain of £77m from the sale of the custody business to Standard Chartered Bank which was partially offset by £40m of restructuring costs. 2009 included a one-off gain of £24m from the sale of shares in Barclays Bank of Botswana Limited. Income grew 8% to £801m (2009: £739m) as a result of improved net interest margins and income from treasury management. Impairment charges decreased 32% to £82m (2009: £121m) as a result of a better economic environment and improved collections. Operating expenses increased 13% to £608m (2009: £538m) reflecting £40m of restructuring costs, investment in infrastructure and an increase in staff-related costs.
AbsaAbsa Group Limited reported profit before tax of R11,851m (2009: R9,842m), an increase of 20%. In Barclays segmental reporting, the results of the Absa credit card business are included in Barclaycard, the investment banking operations in Barclays Capital and wealth operations in Barclays Wealth. The other operations of Absa Group Limited are reported in the Absa segment. Absa profit before tax increased 17% to £616m (2009: £528m), driven by the appreciation in the average value of the Rand against Sterling. The impact of exchange rate movements also impacted income, which increased 14%, operating expenses, which increased 25%, and impairment charges, which decreased 15%. Impairment charges in Rand terms improved 26% reflecting an improvement in economic conditions.
Barclays CapitalBarclays Capital profit before tax increased to £4,780m (2009: £2,464m). Excluding own credit, profit before tax grew 2% to £4,389m (2009: £4,284m). Total income increased 17% to £13,600m (2009: £11,625m). This reflected a significant reduction in losses taken through income relating to credit market exposures which fell to £124m (2009: £4,417m) and a gain relating to own credit of £391m (2009: loss of £1,820m). Top-line income, which excludes these items, was £13,333m, down 25% on the very strong prior year performance. Fixed Income, Currency and Commodities (FICC) top-line income of £8,811m declined 35%, reflecting lower contributions from Rates and Commodities. Equities and Prime Services top-line income of £2,040m declined 6%, as growth in cash equities and equity financing was more than offset by subdued market activity in European equity derivatives. Investment Banking top-line income of £2,243m increased 3%.
Top-line income in the fourth quarter of 2010 was £3,380m, up 20% on the third quarter of 2010 reflecting higher activity levels and contributions from Equities and Prime Services up 74% and Investment Banking up 45%. FICC top-line income was broadly in line with the prior quarter.
Impairment charges, including impairment of £532m relating to the Protium loan which follows a reassessment of the expected realisation period, improved significantly to £543m (2009: £2,591m), resulting in a 45% increase in net income to £13,057m. Operating expenses increased 26% which largely reflected the continuing investment in our sales, origination, trading and research activities, increased charges relating to
Barclays Bank PLC Annual Report 2010 www.barclays.com/annualreport10 09

prior year deferrals and restructuring costs. Excluding the impact of own credit, the cost: net income ratio was 65% (2009: 61%) and compensation costs represented 43% of income (2009: 33%).
Barclays CorporateBarclays Corporate recorded a loss before tax of £631m (2009: profit of £157m). An improvement in the results of the profitable UK & Ireland business was more than offset by increased losses in New Markets and Continental Europe, notably Spain. Total income decreased 7% to £2,974m (2009: £3,181), reflecting lower treasury management income and reduced risk appetite outside the UK. Impairment charges increased £138m to £1,696m, with significant improvements in UK & Ireland and New Markets more than offset by an increase of £630m in Spain to £898m due to depressed market conditions in the property and construction sector. Operating expenses increased to £1,907m, principally reflecting the write down of the £243m of goodwill relating to Barclays Bank Russia and associated restructuring costs of £25m, as well as previously announced restructuring costs of £94m in other geographies within New Markets (predominantly relating to Indonesia).
Barclays WealthBarclays Wealth profit before tax increased 14% to £163m (2009: £143m) as very strong growth in income was partially offset by costs of the strategic investment in growing the business. Income increased 18% to £1,560m principally from strong growth in the High Net Worth businesses and higher attributable net interest income from the revised internal funds pricing mechanism. Impairment charges reduced slightly to £48m (2009: £51m). Operating expenses increased 19% to £1,349m (2009: £1,129m),
principally due to the start of Barclays Wealth’s strategic investment programme which accounted for £112m of additional costs, as well as the impact of growth in High Net Worth business revenues on staff and infrastructure costs.
Investment ManagementInvestment Management profit before tax of £67m (2009: £22m) principally reflected dividend income from the 19.9% holding in BlackRock, Inc. Total assets decreased to £4.6bn (2009: £5.4bn) reflecting the fair value of the 37.567m shares held in BlackRock, Inc.
Head Office Functions and Other OperationsHead Office Functions and Other Operations loss before tax increased by £169m to £745m (2009: loss of £576m). The results for 2009 reflected a net gain on debt buy-backs of £1,164m, while 2010 benefited from a significant decrease in the costs of the central funding activity as money market dislocations eased and a reclassification of profit from the currency translation reserve to the income statement.
Financial reviewAnalysis of results by business continued
10 Barclays Bank PLC Annual Report 2010 www.barclays.com/annualreport10

Risk Factors
The following information describes the risk factors which the Group believes could cause its future results to differ materially from expectations. However, other factors could also adversely affect the Group’s results and so the factors discussed in this report should not be considered to be a complete set of all potential risks and uncertainties.
The Group’s approach to identifying, assessing, managing and reporting risks is formalised in its Principal Risks framework and supporting processes. Definitions of the thirteen Principal Risks are provided in the table below. The risk categories relevant to operational risk are : People, Legal, Regulatory, Operations, Financial Crime, Technology, Financial Reporting and Taxation . This summary also includes discussions of the impact of business conditions and the general economy and regulatory changes which can impact risk factors and so influence the Group’s results. The Principal Risks described below can potentially impact the Group's reputation and brand.
Business conditions and general economy Barclays operates a universal banking business model and its services range from current accounts for personal customers to inflation-risk hedging for governments and institutions. The Group also has significant activities in a large number of countries. Consequently there are many ways in which changes in business conditions and the general economy can adversely impact profitability, whether at the level of the Group, the individual business units or specific countries of operation.
The Group’s stress testing framework helps it to understand the impact of changes in business conditions and the general economy, as well as the sensitivity of its business goals to such changes and the scope of management actions to mitigate their impact.
The general recovery in the global economy resulted in an improvement in credit conditions in our main markets during 2010. In the UK, the economy recovered slightly during 2010 reflecting the lower than expected growth in unemployment rates, the sustained low interest rate environment and moderate GDP growth. However a slowdown in growth was evident in the fourth quarter which is likely to lead to uncertainty in the near term. In addition, persistent unemployment and inflation, fiscal tightening, the possibility of weakening house prices, and possible rising oil prices may have an adverse impact on the strength of the recovery which could increase the risk that a higher proportion of the Group’s customers and counterparties may be unable to meet their obligations. Economic credit conditions have also continued to show signs of improvement in many other key geographies, although in Spain the housing sector remains depressed which led to significantly increased impairment in our Spain wholesale portfolios in 2010. Unemployment rates remain high in the US.
The business conditions facing the Group in 2011 are subject to significant uncertainties, most notably:
– the extent and sustainability of economic recovery particularly in the UK, US, Spain and South Africa;
– the dynamics of unemployment particularly in the UK, US, Spain and South Africa and the impact on delinquency and charge-off rates;
– the speed and extent of possible rises in interest rates in the UK, US, South Africa and the Eurozone;
– the possibility of any further falls in residential property prices in the UK, South Africa and Western Europe;
– the impact of potentially deteriorating sovereign credit quality;
– the potential for single name losses in different sectors and geographies where credit positions are sensitive to economic downturn;
– the potential impact of increasing inflation on economic growth and corporate profitability;
– possible deterioration in our remaining credit market exposures, including commercial real estate, leveraged finance and a loan to Protium Finance LP (Protium);
– changes in the value of Sterling relative to other currencies, which could increase risk weighted assets and therefore raise the capital requirements of the Group;
– continued turmoil in the Middle East and North Africa region could result in loss of business in the affected countries, increased oil prices, increased volatility and risk aversion to this region; and
– the liquidity and volatility of capital markets and investors’ appetite for risk, which could lead to a decline in the income that the Group receives from fees and commissions.
Regulatory changes2010 has seen significant regulatory change. This has been, and remains, the subject of close management attention. Where regulatory change has strategic implications this will tend to affect more than one Principal Risk factor. Such issues are dealt with on a Group wide basis by cross-disciplinary teams working under an accountable executive reporting to senior management. Issues dealt with in this manner in 2010 included:
– The Independent Commission on Banking (ICB): The ICB has been charged by the UK Government with reviewing the UK banking system. Its findings are expected by September 2011. Although the ICB has yet to make recommendations, and it is not possible to predict what the Government’s response to any recommendations that are made will be, there is a possibility that the ICB could recommend change to the structure of UK banks which may require Barclays to make major changes to its structure and business.
– Recovery and Resolution Plans: there has been a strong regulatory focus on resolvability in 2010, both from UK and international regulators. The Group has been engaged, and continues to be engaged, with the authorities on taking forward recovery planning and identifying information that would be required in the event of a resolution.
– The Dodd-Frank Wall Street Reform and Consumer Protection Act (DFA): the DFA will have an impact on the Group and its business. The full scale of this impact remains unclear as many of the provisions of the Act require rules to be made to give them effect and this process is still under way. Barclays has taken a centralised approach to monitoring this process and to ensuring compliance with the rules that are developed as a result.
Risk managementRisk factors
Barclays Bank PLC Annual Report 2010 www.barclays.com/annualreport10 11

Risk managementRisk factors continued
A summary of the Group’s 13 principal risks is as follows
Principal Risk Factor Principal Risk Management Key Specific Risks and Mitigation
1. Wholesale Credit Risk and2. Retail Credit Risk
Credit Risk is the risk of the Group suffering financial loss if any of its customers, clients or market counterparties fails to fulfil their contractual obligations to the Group.
This can also arise when an entity’s credit rating is downgraded, leading to a fall in the value of Barclays investment in its issued financial instruments.
The Board and management have established a number of key committees to review credit risk management, approve overall Group credit policy and resolve all significant credit policy issues. These comprise: the Board Risk Committee, the Risk Oversight Committee, the Wholesale Credit Risk Management Committee and the Retail Credit Risk Management Committee.
Barclays constantly reviews its concentration in a number of areas including, for example, portfolio segments, geography, maturity, industry and investment grade.
Diversification is achieved through setting maximum exposure guidelines to individual counterparties sectors and countries, with excesses reported to the Risk Oversight Committee and the Board Risk Committee. For further information, see page 21.
Specific areas and scenarios where credit risk could lead to higher impairment charges in future years include:
Credit Market ExposuresBarclays Capital holds certain exposures to credit markets that became illiquid during 2007. These exposures primarily relate to commercial real estate, leveraged finance and a loan to Protium. The Group actively managed down some of these exposures in 2010. For further information, see pages 43 to 45.
Sovereign RiskEU deficits approached very high levels during 2010, leading to a loss of market confidence in certain countries to which the Group is exposed. The Group has put certain countries on watch list status with detailed monthly reporting to the Wholesale Credit Risk Management Committee. For further information, see page 46.
Economic UncertaintyConditions have continued to show signs of improvement in many key markets, although the UK has experienced a slowdown in growth in the fourth quarter, US unemployment rates remain high and the Spanish housing sector continues to be depressed, impacting our wholesale and retail credit risk exposures.
In particular, in Spain, the Group has experienced elevated impairment across its operations, following a marked reduction in construction activity and shrinking consumer spending. The Group has reduced its credit risk appetite to the most severely affected segments of the economy. In particular, new lending to the property and construction sector ceased and workout team resources have been increased significantly.
12 Barclays Bank PLC Annual Report 2010 www.barclays.com/annualreport10

Principal Risk Factor Principal Risk Management Key Specific Risks and Mitigation
3. Market Risk
Market Risk is the risk that the Group’s earnings or capital, or its ability to meet business objectives, will be adversely affected by changes in the level or volatility of market rates or prices such as interest rates, credit spreads, commodity prices, equity prices and foreign exchange rates. The Group is exposed to market risk through traded market risk non-traded interest rate risk and the pension fund.
The Board approves market risk appetite for trading and non-trading activities, with limits set within this context by the Group Market Risk Director.
The head of each business market risk team is responsible for implementing the Barclays Market Risk Control Framework which sets out how market risk should be identified, measured, controlled, reported and reviewed. Oversight and challenge is provided by business committees, Group committees and the central Group market risk team.
Non-traded interest rate risk is hedged with the external market by a business Treasury operation or Group Treasury. For further information, see pages 47 to 52.
Traded Market Risk Exposures
While the Group is exposed to continued market volatility, Barclays Capital’s trading activities are principally a consequence of supporting customer activity.
Primary stress testing applies stress moves to each of the major asset classes. Most asset class stress limits were, at some point during 2010, near to their limit. There was one instance of an excess to limit in relation to equity risk in March 2010. This was appropriately escalated and remediated promptly.
Barclays Capital's 2010 market risk exposure, as measured by average total DVaR, decreased to £53m (2009: £77m) For further information, see pages 47 to 49.
Non-traded Interest Rate Risk
The Group is exposed to three main types of non-traded interest rate risk:
– fixed rate loans and deposits that are not hedged or matched;
– structural risk due to variability of earnings on structural product and equity balances which have no contractual maturity and an interest rate which does not move in line with the base rate; and
– margin compression.
Fixed rate loan risk is mitigated by hedging the risk with the external market either via Group Treasury, or a business treasury operation. Structural risk and margin compression are hedged by equity and structural hedges managed by Group Treasury. The maturities of these hedges were extended during 2010.
Due to economic concerns in the third quarter, gilts purchased as part of the equity structural hedge extension were sold. The duration extension process was resumed towards the end of 2010 and is expected to be completed by the end of 2011. For further information, see pages 47 to 52.
Pension Fund Risk
Barclays could be required or might choose to make extra contributons to the pension fund. Financial details of the pension fund are in Note 27.
Barclays Bank PLC Annual Report 2010 www.barclays.com/annualreport10 13

Risk managementRisk factors continued
Principal Risk Factor Principal Risk Management Key Specific Risks and Mitigation
4. Capital Risk
Capital Risk is the risk that the Group has insufficient capital resources to: ensure the financial holding company is well capitalised relative to the minimum regulatory capital requirements set out by the UK FSA and US Federal Reserve; ensure locally regulated subsidiaries can meet their minimum regulatory requirements; support the Group’s Risk Appetite and economic capital requirements; and support the Group’s credit rating.
Primary responsibility for managing Capital Risk rests with the Group Treasury Committee, which has defined and implemented a Capital Risk governance framework.
The Committee monitors the Group’s actual and forecast capital positions on both a pre and post stress basis. Stress testing considers the impact to capital resources and requirements as a result of macroeconomic stresses. The Committee also considers major risks to the capital forecast such as changes to the regulatory requirements.
The Group has a number of regulated legal entities within the UK and overseas. Local management has primary responsibility for ensuring these entities comply with their local capital requirements. Where necessary, injections of capital may be made. Such injections are approved by Group Treasury Committee.
Increasing Capital Requirements
There have been a number of recent developments in regulatory capital requirements which are likely to have a significant impact on the Group. Most significantly, during 2010, the Capital Requirement Directives 2 and 3 and the guidelines from the Basel Committee for strengthening capital requirements (Basel III) have been finalised.
Aligned to this, markets and credit rating agencies now expect equity capital levels significantly in excess of the current regulatory minimum.
As a result, and in anticipation of the future regulatory changes, the Group continues to build its capital base and actively manage its risk weighted assets. As at 31st December 2010, the Group’s Core Tier 1 Capital ratio was 10.9% (2009: 10.1%). For further information, see page 53.
5. Liquidity Risk
Liquidity Risk is the risk that the Group is unable to meet its obligations as they fall due resulting in: an inability to support normal business activity; failing to meet liquidity regulatory requirements; or rating agency concerns.
The Group maintains a substantial liquidity buffer comprised of deposits with central banks and investments in highly liquid securities or deposits.
Stress reporting for a number of liquidity scenarios is run on a daily basis. These tests measure the survival periods under Barclays defined stress scenarios. Similar stresses are run for key entities within the Group as well as at the Group level.
Since June 2010, the Group has also reported its liquidity position against backstop Individual Liquidity Guidance provided by the FSA. Calibration of the Group’s liquidity framework anticipated final FSA rules and is therefore broadly consistent with current FSA standards.
Daily reporting monitors a number of indicators or stress as well as daily cash activity.
Inability To Meet Obligations As They Fall Due, At Reasonable Cost
As a result of sudden, large and potentially protracted increases in cash outflows, the cash resources of the group could be severely depleted. These outflows could be principally through customer withdrawals, wholesale counterparties removing financing, ratings downgrades or loan drawdowns. This could result in:
– limited ability to support client lending, trading activities and investments;
– forced reduction in balance sheet and sales of assets;
– inability to fulfil lending obligations; and
– regulatory breaches under the liquidity standards introduced by the FSA on 1st December 2009.
These outflows could be the result of general market dislocations or specific concerns about Barclays. For further information, see pages 54 to 62.
14 Barclays Bank PLC Annual Report 2010 www.barclays.com/annualreport10

Principal Risk Factor Principal Risk Management Key Specific Risks and Mitigation
6. People Risk
People Risk arises from failures of the Group to manage its key risks as an employer, including lack of appropriate people resource, failure to manage performance and reward, unauthorised or inappropriate employee activity and failure to comply with employment related requirements.
People Risk is mitigated through the operation of the People Risk Framework (PRF). The PRF consists of Group wide policies which mandate the minimum controls that all businesses globally need to operate to mitigate their people risks and covers the following areas:
– Recruitment;
– Pre-employment screening;
– Employment agreements;
– Performance management;
– Reward;
– Discipline, Capability and Grievance;
– Health and Safety;
– Exit management;
– Employee feedback; and
– Hiring former employees of the statutory auditor.
Conformance with the policies is monitored by the HR Risk Committee through regular conformance reviews and quarterly key indicators. Further oversight of the management of People Risk is provided by the Board Remuneration Committee and the Group Operating Committee.
Compensation and People Retention Risk
During 2010, external regulatory developments in relation to remuneration continued to impact the People Principal Risk.
On 17th December 2010, the FSA published its final Remuneration code following the July 2010 Consultation Paper. The code was updated in order to implement the remuneration rules required by the Capital Requirements Directive (CRD 3) and the Financial Service Act 2010. The code applies to remuneration paid from 1st January 2011, including remuneration in respect of 2010 performance.
Barclays remuneration approach has been reviewed in detail and enhancements made as appropriate to ensure continued compliance with the FSA Code.
During 2010, Barclays developed a Group wide policy formalising the role of risk functions in remuneration activities and ensuring regulatory requirements are fulfilled. An independent review of Barclays approach was conducted on behalf of the Board Risk Committee by a third party. The review concluded Barclays approach is market leading and satisfies regulatory requirements.
7. Legal Risk
The Group is subject to a comprehensive range of legal obligations in all countries in which it operates. As a result, the Group is exposed to many forms of legal risk, which may arise in a number of ways:
– Business may not be conducted in accordance with applicable laws around the world.
– Contractual obligations may either not be enforceable as intended or may be enforced in an adverse way.
– Intellectual property may not be adequately protected.
– Liability for damages may be incurred to third parties harmed by the conduct of its business.
Legal Risk is owned and managed by the Legal Function both at a Group level and by the business unit legal teams.
The General Counsel for each business unit is responsible for management and reporting of Legal Risk. The adequacy and effectiveness of the controls operated in the business units is overseen by the Group Legal Executive Committee.
Specific risks relating to Legal Risk are reported on a quarterly basis to the Executive Committee and the Board.
Key Legal Risks to which the Group was exposed during 2010 have included:
– Litigation in relation to Lehman Brothers Holdings Inc
– Litigation in relation to American Depository Shares
– Developments in relation to Payment Protection Insurance (see Regulatory Risk below)
– Compliance with US economic sanctions (see Regulatory risk)
Further details of these matters and other Legal Risks are set out in the Legal Proceedings Note (see page 117) and the Competition and Regulatory Matters Note (see page 118).
Barclays Bank PLC Annual Report 2010 www.barclays.com/annualreport10 15

Risk managementRisk factors continued
Principal Risk Factor Principal Risk Management Key Specific Risks and Mitigation
8. Regulatory Risk
Regulatory Risk arises from a failure or inability to comply fully with the laws, regulations or codes applicable specifically to the financial services industry. Non-compliance could lead to fines, public reprimands, damage to reputation, increased prudential requirements, enforced suspension of operations or, in extreme cases, withdrawal of authorisations to operate.
Regulatory Risk is owned and managed by the Compliance Function. Business Unit compliance functions monitor and control compliance risks, applying a range of Compliance policies under the co-ordination and oversight of Group Compliance. The primary focus is on adherence to the regulatory framework currently in place.
Specific reports on regulatory compliance are prepared on a regular basis for the Group Operating Committee, the Group Governance and Control Committee and the Board Audit Committee.
Compliance risk and control issues are also included in quarterly reporting by the Legal and Compliance functions to the Executive Committee and the Board.
Not all risks that might be considered to be regulatory in origin fall under the Regulatory Principal Risk. Most notably, prudential regulatory risks are managed and mitigated in the manner outlined in the sections on Wholesale and Retail Credit Risk, Market Risk, Operational Risk, Capital Risk and Liquidity Risk.
Regulatory ChangeThe regulatory response to the financial crisis has led to very substantial regulatory change in the UK, EU and US and in the other countries in which the Group operates. It has also led to a change in the style of supervision in a number of territories, with a more assertive approach being demonstrated by the authorities.
Anti-bribery and CorruptionAmong other things, the Bribery Act 2010, which applies to UK companies worldwide, has created an offence of failure by a commercial organisation to prevent a bribe being paid on its behalf. However, it will be a defence if the organisation has adequate procedures in place to prevent bribery. In anticipation of the entry into force of the Bribery Act later in 2011, the Group has been enhancing its framework of controls to comply with the provisions of the Act.
Payment Protection Insurance (PPI)PPI has been under scrutiny by the UK competition authorities and financial services regulators. The UK Competition Commission (CC) has undertaken an in-depth enquiry into the PPI market which has resulted in the CC introducing a number of remedies including a prohibition on sale of PPI at the point of sale. In addition a judicial review has been launched regarding the treatment of PPI complaints by the FSA and Financial Ombudsman Services.
US Economic SanctionsAs announced on 18th August 2010, Barclays reached settlements with the US Authorities in relation to the investigation by those agencies into compliance with US sanctions and US dollar payment practices.
In addition, an Order to Cease and Desist has been issued upon consent by the Federal Reserve Bank of New York and the New York State Banking Department. Barclays has taken significant steps to enhance further its compliance programmes including: the further development and implementation of its Sanctions Policy; substantial investment in advanced payment and customer screening technology; and the delivery of mandatory sanctions training for more than 100,000 staff around the world. For further information, see pages 63-65 and 118.
9. Operations Risk
Operations Risk has a broad scope and, for that reason, it is defined at a more granular level. The risks are:
– Transaction operations;
– New product development;
– Premises;
– External suppliers;
– Payments process; and
– Information, data quality and records management.
These risks are managed by Business Units in accordance with control requirements articulated via mandated Group Policies and/or Risk Control Frameworks. The adequacy and effectiveness of the controls operated in the Business Units is overseen by the Group Principal Risk Owner teams in the Group Centre via regular management information, conformance reviews and quarterly Risk Review meetings (attended by Business Unit representatives). The Group Operating Committee is responsible for oversight of these risks.
During 2010 there were enhancements to the management of external suppliers and transaction operations risks.
16 Barclays Bank PLC Annual Report 2010 www.barclays.com/annualreport10

Principal Risk Factor Principal Risk Management Key Specific Risks and Mitigation
10. Financial Crime Risk
Financial Crime Risk is the risk that the Group suffers losses as a result of internal and external fraud or intentional damage, loss or harm to people, premises or moveable assets.
The Group Financial Crime Team, Fraud Oversight Committee and Security Risk Management Committee provide oversight of the implementation of the Fraud Risk Control Framework and the Group Security Risk Control Framework. Oversight is achieved via conformance reviews and other review activity undertaken by Group Financial Crime and within business units.
Monthly reports on fraud losses across the Group are produced for the Fraud Oversight Committee which monitors these events and considers the actions to be taken on a case by case basis. Where relevant, the Fraud Oversight Committee takes actions to drive remediation of the root cause of such events.
Quarterly Financial Crime reports are submitted to the Group Risk Oversight Committee and Board Risk Committee.
As a major financial institution, Barclays continues to be a target for financial crime. The group has frameworks and systems in place to enable it to respond to threats to both the organisation and its customers as they emerge.
11. Technology Risk
Technology Risk includes the non-availability of IT systems, inadequate design and testing of new and changed IT solutions and inadequate IT system security. Data privacy issues are covered under Regulatory Risk and external supplier issues relating to technology are covered under Operations Risk.
Technology is a key business enabler and requires an appropriate level of control to ensure that the most significant technology risks are effectively managed. Technology Risk is managed through a formal risk governance framework. A set of Key Risk Indicators (KRIs), consistent across Business Units, is periodically collated and reviewed by management. Each KRI has a specific target state, defining the Group's attitude to risk. Any areas falling short of this standard are highlighted to management for action.
Regular technology risk reporting is provided to the Group Operating Committee, the Governance and Control Committee and the Board Audit Committee.
Similar to many large organisations, Barclays is exposed to the risk that systems may not be continually available. This risk is monitored closely and enhancements to certain key systems are being undertaken.
Barclays Bank PLC Annual Report 2010 www.barclays.com/annualreport10 17

Risk managementRisk factors continued
Principal Risk Factor Principal Risk Management Key Specific Risks and Mitigation
12. Financial Reporting Risk
Financial Reporting Risk arises from a failure or inability to comply fully with the laws, regulations or codes in relation to the disclosure of financial information. Non-compliance could lead to fines, public reprimands, damage to reputation, enforced suspension of operations or, in extreme cases, withdrawal of authorisations to operate.
Group wide requirements and any material external requirements are set out in the Financial Reporting Risk Control Framework.
During 2010 a review of the Financial Reporting Risk was undertaken, resulting in a broadening of its scope. The Group monitoring process was also strengthened to provide the Group Financial Controller with a more effective oversight.
All business units and Group centre functions are required to comply with the Risk Control Framework requirements and retain evidence to support this accordingly. Compliance with the Financial Reporting Risk policies is reported at Group level through core key indicators on at least a quarterly basis. Group oversight is undertaken via conformance review, other ongoing monitoring activities and quarterly review meetings are held between the Group Financial Controller and Business Unit Finance Directors to review and challenge the Business Unit Financial Reporting Risk status and assessment.
Quarterly Financial Reporting Risk reports are submitted to the Group Operating Committee for oversight and monitoring. Additionally, specific reports are submitted to the Group Governance & Control Committee and to the Board Audit Committee around the Group compliance with Sarbanes Oxley requirements.
Changes in accounting standards
As set out in Future Accounting Developments on page 91, the International Accounting Standards Board is undertaking a significant programme of revision to IFRS which it aims to complete by 30th June 2011. The final form of IFRS requirements, the time period over which new requirements will need to be applied and the impact on the results and financial positions is not yet known. The Group is taking steps to ensure that it is able to appropriately respond to the changes as they emerge, however, the situation is evolving rapidly.
Increased scrutiny
Following the financial crisis, the financial reporting of banks has been subject to greater scrutiny by regulators. This has included consideration of accounting policies, accounting for particular transactions and financial statement disclosures.
For Barclays, this has included the accounting treatment of Protium Finance LP. Further details are provided on page 44.
The Group continues to maintain an effective system of internal control over financial reporting and to enhance its disclosures in response to feedback received and the British Bankers Association (BBA) Disclosure Code. Further details on internal control over financial reporting can be found on page 73 and on the BBA code and improvements to Annual Report disclosures on page 71.
18 Barclays Bank PLC Annual Report 2010 www.barclays.com/annualreport10

Principal Risk Factor Principal Risk Management Key Specific Risks and Mitigation
13. Taxation Risk
Tax Risk is the risk that the Group suffers losses associated with changes in tax law or in the interpretation of tax law. It also includes the risk of failure to comply with procedures required by tax authorities. Failure to manage tax risks could lead to an additional tax charge. It could also lead to reputational damage or a financial penalty for failure to comply with required tax procedures or other aspects of tax law.
The Group's strategy is to maximise returns for shareholders whilst complying with relevant tax laws, disclosure requirements and regulations under an appropriate risk control framework.
The Group takes a responsible and transparent approach to the management and control of its tax affairs and related tax risk, specifically tax risks are assessed as part of the Group’s formal governance processes and are reviewed by the Executive Committee, Group Finance Director and the Board Risk Committee. The tax charge is reviewed by the Board Audit Committee. Barclays has adopted the Code of Practice for Taxation of Banks (The Code) and has confirmed to HMRC that it will have regard to the spirit of the law and the intent of Parliament in managing its tax affairs.
The Group employs high-quality tax professionals and takes appropriate advice from reputable professional firms. Effective, well-documented and controlled processes are in place to ensure compliance with tax disclosure and filing obligations.
Where disputes arise with tax authorities with regard to the interpretation and application of tax law, the Group is committed to addressing the matter promptly and resolving the matter with the tax authority in an open and constructive manner.
During 2010 the Group settled open issues in a number of jurisdictions, principally the UK and South Africa, including agreement of the UK bank payroll tax liability with HMRC.
Governance and controls have been put in place to ensure compliance with the UK government's Code of Practice for Taxation of Banks.
The profit forecasts that support the Group's deferred tax assets, principally in the UK, US and Spain, have been subject to close scrutiny by management.
The Group continues to monitor the potential impact of proposed taxes aimed at banks such as the UK bank levy (see also pages 93 to 95).
Barclays Bank PLC Annual Report 2010 www.barclays.com/annualreport10 19

Overview (audited)There are no differences in the manner in which financial risks are managed and measured between the Barclays Bank PLC Group and the Barclays PLC Group. Therefore, the explanations of the management, the control responsibilities and the measurement described in this section and the following sections on credit risk, market risk, capital and liquidity risk management are those for the Barclays PLC Group, which includes the Barclays Bank PLC Group. The amounts included in these sections are those for Barclays Bank PLC.
The Group is a major global financial services provider engaged in retail and commercial banking, credit cards, investment banking, wealth management and investment management services. Financial instruments are fundamental to the Group’s business and managing financial risks, especially credit risk, is a fundamental part of its business activity.
The Group’s risk management policies and processes are designed to identify and analyse risk, to set appropriate risk appetite, limits, and controls, and to monitor the risks and adherence to limits by means of reliable and up-to-date data. Risk management policies, models and systems are regularly reviewed to reflect changes to markets, products and best market practice.
Risk responsibilities (audited)The Board approves risk appetite and the Board Risk Committee (BRC) monitors the Group’s risk profile against this appetite:
– The Chief Risk Officer, under delegated authority from the Group Chief Executive and Group Finance Director, has responsibility for ensuring effective risk management and control;
– Business Heads are responsible for the identification and management of risk in their businesses;
– Business risk teams, each under the management of a Business Risk Director, are responsible for assisting Business Heads in the identification and management of their business risk profiles for implementing appropriate controls. These risk management teams also assist Group Risk in the formulation of Group Risk policy and the implementation of it across the businesses;
– Within Group Risk, Risk-Type Heads and their teams are responsible for establishing a risk control framework and risk oversight; and
– Internal Audit is responsible for the independent review of risk management and the control environment.
Oversight of risk management is exercised by the Group Risk Oversight Committee which is chaired by the Chief Risk Officer under authority delegated by the Group Finance Director. The Group Risk Oversight Committee oversees management of the Group’s risk profile, exercised through the setting, review and challenge of the size and constitution of the profile when viewed against the Group risk appetite.
The Executive Committee monitors and manages risk-adjusted performance of businesses and receives a regular update on forward risk trends.
The BRC reviews the Group risk profile, approves the Group Control Framework and approves minimum control requirements for principal risks.
The Board Audit Committee (BAC) considers the adequacy and effectiveness of the Group Control Framework and receives quarterly reports on control issues of significance and half-yearly reports on impairment allowances and regulatory reports.
Both BRC and BAC also receive reports dealing in more depth with specific issues relevant at the time. The proceedings of both Committees are reported to the full Board. The Board approves the overall Group risk appetite.
The Group Risk Oversight Committee is chaired by the Chief Risk Officer and oversees the management of the Group’s risk profile and all of its significant risks. Oversight is exercised through the setting, review and challenge of the size and constitution of the profile when viewed against the Group’s risk appetite. It has delegated and apportioned responsibility for credit risk management to the Retail and Wholesale Credit Risk Management Committees.
The main financial risks affecting the Group are discussed on pages 21 to 62.
Risk managementFinancial risk management
All disclosures in this section (page 20) are unaudited unless otherwise indicated.
20 Barclays Bank PLC Annual Report 2010 www.barclays.com/annualreport10

Risk managementCredit risk management
All disclosures in this section (pages 21 to 46) are unaudited unless otherwise indicated.
Overview (audited)Credit risk is the risk of suffering financial loss should any of the Group’s customers, clients or market counterparties fail to fulfil their contractual obligations to the Group.
The credit risk that the Group faces arises mainly from wholesale and retail loans and advances, together with the counterparty credit risk arising from derivative contracts entered into with clients. Other sources of credit risk arise from trading activities, including debt securities, settlement balances with market counterparties, available for sale assets and reverse repurchase agreements.
Losses arising from exposures held for trading (derivatives, debt securities) are accounted for as trading losses, rather than impairment charges, even though the fall in value causing the loss may be attributable to credit deterioration.
Maximum exposure to credit risk before collateral held or other credit enhancements (audited)The following tables present the maximum exposure at 31st December 2010 and 2009 to credit risk of balance sheet and off-balance sheet financial instruments, before taking account of any collateral held or other credit enhancements and after allowance for impairment and netting where appropriate.
For financial assets recognised on the balance sheet, the exposure to credit risk equals their carrying amount. For financial guarantees granted, the maximum exposure to credit risk is the maximum amount that Barclays would have to pay if the guarantees were to be called upon. For loan commitments and other credit related commitments that are irrevocable over the life of the respective facilities, the maximum exposure to credit risk is the full amount of the committed facilities.
This analysis and all subsequent analyses of credit risk include only financial assets subject to credit risk. They exclude other financial assets, mainly equity securities held in the trading portfolio or as available for sale assets, as well as non-financial assets. The nominal value of off-balance sheet credit related instruments is also shown, where appropriate.
Financial assets designated at fair value held in respect of linked liabilities to customers under investment contracts have not been included as the Group is not exposed to credit risk on these assets. Credit losses in these portfolios, if any, would lead to a reduction in the linked liabilities and result in no direct loss to the Group.
Whilst the Group’s maximum exposure to credit risk is the carrying value of the assets or, in the case of off-balance sheet items, the amount guaranteed, committed, accepted or endorsed, in most cases the likely exposure is far less due to collateral, credit enhancements and other actions taken to mitigate the Group’s exposure.
Barclays Bank PLC Annual Report 2010 www.barclays.com/annualreport10 21

Risk managementCredit risk management continued
Maximum exposure to credit risk (audited) Asset class
As at 31st December 2010
Loans and advancesa
£m
Debtsecuritiesand other
billsb
£mDerivativesc
£m
Reverserepurchase
agreementsd
£mOther
£m
Totalassets
£m
The Group On-balance sheet: Cash and balances at central banks – – – – 97,630 97,630Items in the course of collection from other banks – – – – 1,384 1,384Trading portfolio assets: Debt securities – 139,240 – – – 139,240Traded loans 2,170 – – – – 2,170Total trading portfolio assets 2,170 139,240 – – – 141,410Financial assets designated at fair value: Loans and advances 22,352 – – – – 22,352Debt securities – 1,918 – – – 1,918Other financial assets – – – 7,559 2,542 10,101Total financial assets designated at fair value 22,352 1,918 – 7,559 2,542 34,371Derivative financial instruments – – 420,319 – – 420,319Loans and advances to banks 37,799 – – – – 37,799Loans and advances to customers: Home loans 168,055 – – – – 168,055Credit card receivables 22,658 – – – – 22,658Other personal lending 26,608 – – – – 26,608Wholesale and corporate 200,618 – – – – 200,618Finance lease receivables 10,003 – – – – 10,003Total loans and advances to customers 427,942 – – – – 427,942Reverse repurchase agreements and other similar secured lending – – – 205,772 – 205,772Available for sale debt securities – 59,629 – – – 59,629Other assets – – – – 2,824 2,824Total on-balance sheet 490,263 200,787 420,319 213,331 104,380 1,429,080
Off-balance sheet: Securities lending arrangements 27,672Guarantees and letters of credit pledged as collateral security 13,783Acceptances and endorsements 331Documentary credits and other short-term trade related transactions 1,194Standby facilities, credit lines and other commitments 222,963Total off-balance sheet 265,943Total maximum exposure to credit risk 1,695,023
Notesa Further analysis of loans and advances is on pages 32 to 40.b Further analysis of debt securities and other bills is on page 40.c Further analysis of derivitives is on page 41.d Further analysis of reverse repurchase agreements is on page 42.
22 Barclays Bank PLC Annual Report 2010 www.barclays.com/annualreport10

Maximum exposure to credit risk (audited) Asset class
As at 31st December 2010
Loans and advances
£m
Debtsecuritiesand other
bills£m
Derivatives£m
Reverserepurchase
agreements£m
Other£m
Totalassets
£m
The Bank On-balance sheet: Cash and balances at central banks – – – – 92,686 92,686Items in the course of collection from other banks – – – – 1,268 1,268Trading portfolio assets: Debt securities – 86,328 – – – 86,328Traded loans 2,500 – – – – 2,500Total trading portfolio assets 2,500 86,328 – – – 88,828Financial assets designated at fair value: Loans and advances 25,093 – – – – 25,093Debt securities – 783 – – – 783Other financial assets – – – 2,489 805 3,294Total financial assets designated at fair value 25,093 783 – 2,489 805 29,170Derivative financial instruments – – 441,145 – – 441,145Loans and advances to banks 40,390 – – – – 40,390Loans and advances to customers: Home loans 123,995 – – – – 123,995Credit card receivables 12,184 – – – – 12,184Other personal lending 14,230 – – – – 14,230Wholesale and corporate 372,301 – – – – 372,301Finance lease receivables 226 – – – – 226Total loans and advances to customers 522,936 – – – – 522,936Reverse repurchase agreements and other similar secured lending – – – 227,343 – 227,343Available for sale debt securities – 45,076 – – – 45,076Other assets – – – – 1,054 1,054Total on-balance sheet 590,919 132,187 441,145 229,832 95,813 1,489,896
Off-balance sheet: Securities lending arrangements 27,672Guarantees and letters of credit pledged as collateral security 11,823Acceptances and endorsements 302Documentary credits and other short-term trade related transactions 924Standby facilities, credit lines and other commitments 173,795Total off-balance sheet 214,516 Total maximum exposure to credit risk 1,704,412
Barclays Bank PLC Annual Report 2010 www.barclays.com/annualreport10 23

Risk managementCredit risk management continued
Maximum exposure to credit risk (audited) Asset class
As at 31st December 2009
Loans and advances
£m
Debtsecuritiesand other
bills£m
Derivatives£m
Reverserepurchase
agreements£m
Other£m
Totalassets
£m
The Group On-balance sheet: Cash and balances at central banks – – – – 81,483 81,483 Items in the course of collection from other banks – – – – 1,593 1,593 Trading portfolio assets: Debt securities – 126,520 – – – 126,520 Traded loans 2,962 – – – – 2,962 Total trading portfolio assets 2,962 126,520 – – – 129,482 Financial assets designated at fair value: Loans and advances 22,390 – – – – 22,390 Debt securities – 4,007 – – – 4,007 Other financial assets 557 – – 7,757 344 8,658 Total financial assets designated at fair value 22,947 4,007 – 7,757 344 35,055 Derivative financial instruments – – 416,815 – – 416,815 Loans and advances to banks 41,135 – – – – 41,135 Loans and advances to customers: Home loans 149,099 – – – – 149,099 Credit card receivables 21,889 – – – – 21,889 Other personal lending 25,435 – – – – 25,435 Wholesale and corporate 212,928 – – – – 212,928 Finance lease receivables 10,873 – – – – 10,873 Total loans and advances to customers 420,224 – – – – 420,224 Reverse repurchase agreements and other similar secured lending – – – 143,431 – 143,431 Available for sale debt securities – 49,807 – – – 49,807 Other assets – – – – 3,476 3,476 Total on-balance sheet 487,268 180,334 416,815 151,188 86,896 1,322,501
Off-balance sheet: Securities lending arrangements 27,406 Guarantees and letters of credit pledged as collateral security 15,406 Acceptances and endorsements 375 Documentary credits and other short-term trade related transactions 762 Standby facilities, credit lines and other commitments 206,513 Total off-balance sheet 250,462 Total maximum exposure to credit risk 1,572,963
24 Barclays Bank PLC Annual Report 2010 www.barclays.com/annualreport10

Maximum exposure to credit risk (audited) Asset class
As at 31st December 2009
Loans and advances
£m
Debtsecuritiesand other
bills£m
Derivatives£m
Reverserepurchase
agreements£m
Other£m
Totalassets
£m
The Bank On-balance sheet: Cash and balances at central banks – – – – 78,447 78,447 Items in the course of collection from other banks – – – – 1,373 1,373 Trading portfolio assets: Debt securities – 83,680 – – – 83,680 Traded loans 2,945 – – – – 2,945 Total trading portfolio assets 2,945 83,680 – – – 86,625 Financial assets designated at fair value: Loans and advances 21,636 – – – – 21,636 Debt securities – 3,338 – – – 3,338 Other financial assets 423 – – 2,083 99 2,605 Total financial assets designated at fair value 22,059 3,338 – 2,083 99 27,579 Derivative financial instruments – – 429,895 – – 429,895 Loans and advances to banks 42,963 – – – – 42,963 Loans and advances to customers: Home loans 110,605 – – – – 110,605 Credit card receivables 11,523 – – – – 11,523 Other personal lending 14,125 – – – – 14,125 Wholesale and corporate 375,513 – – – – 375,513 Finance lease receivables 362 – – – – 362 Total loans and advances to customers 512,128 – – – – 512,128 Reverse repurchase agreements and other similar secured lending – – – 145,433 – 145,433 Available for sale debt securities – 35,984 – – – 35,984 Other assets – – – – 1,198 1,198 Total on-balance sheet 580,095 123,002 429,895 147,516 81,117 1,361,625
Off-balance sheet: Securities lending arrangements 27,406 Guarantees and letters of credit pledged as collateral security 13,150 Acceptances and endorsements 350 Documentary credits and other short-term trade related transactions 535 Standby facilities, credit lines and other commitments 159,281 Total off-balance sheet 200,722 Total maximum exposure to credit risk 1,562,347
Barclays Bank PLC Annual Report 2010 www.barclays.com/annualreport10 25

Risk managementCredit risk management continued
Credit risk concentrations (audited)A concentration of credit risk exists when a number of counterparties are located in a geographical region, or are engaged in similar activities and have similar economic characteristics that would cause their ability to meet contractual obligations to be similarly affected by changes in economic or other conditions. The analyses of credit risk concentrations presented below are based on the location of the counterparty or customer or the industry in which they are engaged.
Credit risk concentrations by geographical sector (audited)
As at 31st December 2010
UnitedKingdom
£m
OtherEuropean
Union£m
UnitedStates
£mAfrica
£m
Rest of theWorld
£mTotal
£m
The Group On-balance sheet: Cash and balances at central banks 18,535 13,558 41,288 2,293 21,956 97,630 Items in the course of collection from other banks 1,169 114 – 100 1 1,384 Trading portfolio assets 16,063 30,066 66,148 1,516 27,617 141,410 Financial assets designated at fair value 14,800 3,613 9,001 2,918 4,039 34,371 Derivative financial instruments 129,183 129,497 110,467 4,234 46,938 420,319 Loans and advances to banks 5,233 10,375 12,559 1,475 8,157 37,799 Loans and advances to customers 209,995 83,269 53,297 52,938 28,443 427,942 Reverse repurchase agreements and other similar secured lending 50,044 45,265 77,430 23 33,010 205,772 Available for sale financial investments 25,466 14,839 6,399 7,281 5,644 59,629 Other assets 1,612 235 314 537 126 2,824 Total on-balance sheet 472,100 330,831 376,903 73,315 175,931 1,429,080
Off-balance sheet: Securities lending arrangements – – 27,672 – – 27,672 Guarantees and letters of credit pledged as collateral security 3,803 2,273 4,266 2,179 1,262 13,783 Acceptances and endorsements 125 4 6 29 167 331 Documentary credits and other short-term trade related transactions 476 156 143 183 236 1,194 Standby facilities, credit lines and other commitments 94,676 29,985 64,812 24,522 8,968 222,963 Total off-balance sheet 99,080 32,418 96,899 26,913 10,633 265,943 Total 571,180 363,249 473,802 100,228 186,564 1,695,023
The Bank On-balance sheet: Cash and balances at central banks 18,425 12,805 40,160 83 21,213 92,686 Items in the course of collection from other banks 1,169 93 – 5 1 1,268 Trading portfolio assets 15,269 28,383 24,873 168 20,135 88,828 Financial assets designated at fair value 20,554 3,424 1,290 208 3,694 29,170 Derivative financial instruments 158,106 128,684 107,005 947 46,403 441,145 Loans and advances to banks 4,473 11,175 15,356 678 8,708 40,390 Loans and advances to customers 390,007 64,225 38,924 3,277 26,503 522,936 Reverse repurchase agreements and other similar secured lending 53,665 50,170 97,375 10 26,123 227,343 Available for sale financial investments 24,716 9,353 5,184 202 5,621 45,076 Other assets 919 66 20 1 48 1,054 Total on-balance sheet 687,303 308,378 330,187 5,579 158,449 1,489,896
Off-balance sheet: Securities lending arrangements – – 27,672 – – 27,672 Guarantees and letters of credit pledged as collateral security 3,744 1,916 4,755 147 1,261 11,823 Acceptances and endorsements 125 3 6 1 167 302 Documentary credits and other short-term trade related transactions 476 43 143 27 235 924 Standby facilities, credit lines and other commitments 87,208 25,599 51,390 397 9,201 173,795 Total off-balance sheet 91,553 27,561 83,966 572 10,864 214,516 Total 778,856 335,939 414,153 6,151 169,313 1,704,412
26 Barclays Bank PLC Annual Report 2010 www.barclays.com/annualreport10

Credit risk concentrations by geographical sector (audited)
As at 31st December 2009
UnitedKingdom
£m
OtherEuropean
Union£m
UnitedStates
£mAfrica
£m
Rest of theWorld
£mTotal
£m
The Group On-balance sheet: Cash and balances at central banks 37,697 5,584 32,279 1,742 4,181 81,483 Items in the course of collection from other banks 1,340 56 – 196 1 1,593 Trading portfolio assets 12,232 35,088 52,229 1,414 28,519 129,482 Financial assets designated at fair value 13,945 3,986 10,800 2,352 3,972 35,055 Derivative financial instruments 133,713 128,881 111,269 2,511 40,441 416,815 Loans and advances to banks 5,117 12,697 13,137 2,388 7,796 41,135 Loans and advances to customers 203,582 84,343 58,355 47,495 26,449 420,224 Reverse repurchase agreements and other similar secured lending 22,222 44,014 60,759 527 15,909 143,431 Available for sale financial investments 16,752 14,028 7,175 4,993 6,859 49,807 Other assets 1,565 417 651 661 182 3,476 Total on-balance sheet 448,165 329,094 346,654 64,279 134,309 1,322,501
Off-balance sheet: Securities lending arrangements – – 27,406 – – 27,406 Guarantees and letters of credit pledged as collateral security 3,337 2,783 5,443 1,795 2,048 15,406 Acceptances and endorsements 134 5 – 26 210 375 Documentary credits and other short-term trade related transactions 357 94 – 174 137 762 Standby facilities, credit lines and other commitments 94,763 26,250 57,598 19,306 8,596 206,513 Total off-balance sheet 98,591 29,132 90,447 21,301 10,991 250,462 Total 546,756 358,226 437,101 85,580 145,300 1,572,963
The Bank On-balance sheet: Cash and balances at central banks 37,619 4,983 31,690 54 4,101 78,447 Items in the course of collection from other banks 1,339 25 – 8 1 1,373 Trading portfolio assets 11,808 34,614 17,687 161 22,355 86,625 Financial assets designated at fair value 17,208 3,931 2,939 151 3,350 27,579 Derivative financial instruments 151,461 130,841 107,394 908 39,291 429,895 Loans and advances to banks 7,927 12,828 14,109 789 7,310 42,963 Loans and advances to customers 375,761 61,909 47,520 3,654 23,284 512,128 Reverse repurchase agreements and other similar secured lending 26,661 44,778 60,993 9 12,992 145,433 Available for sale financial investments 17,085 9,738 4,505 254 4,402 35,984 Other assets 1,036 11 72 1 78 1,198 Total on-balance sheet 647,905 303,658 286,909 5,989 117,164 1,361,625
Off-balance sheet: Securities lending arrangements – – 27,406 – – 27,406 Guarantees and letters of credit pledged as collateral security 3,271 2,380 5,445 7 2,047 13,150 Acceptances and endorsements 134 5 – 1 210 350 Documentary credits and other short-term trade related transactions 356 14 – 26 139 535Standby facilities, credit lines and other commitments 87,410 21,876 41,773 391 7,831 159,281 Total off-balance sheet 91,171 24,275 74,624 425 10,227 200,722 Total 739,076 327,933 361,533 6,414 127,391 1,562,347
Barclays Bank PLC Annual Report 2010 www.barclays.com/annualreport10 27
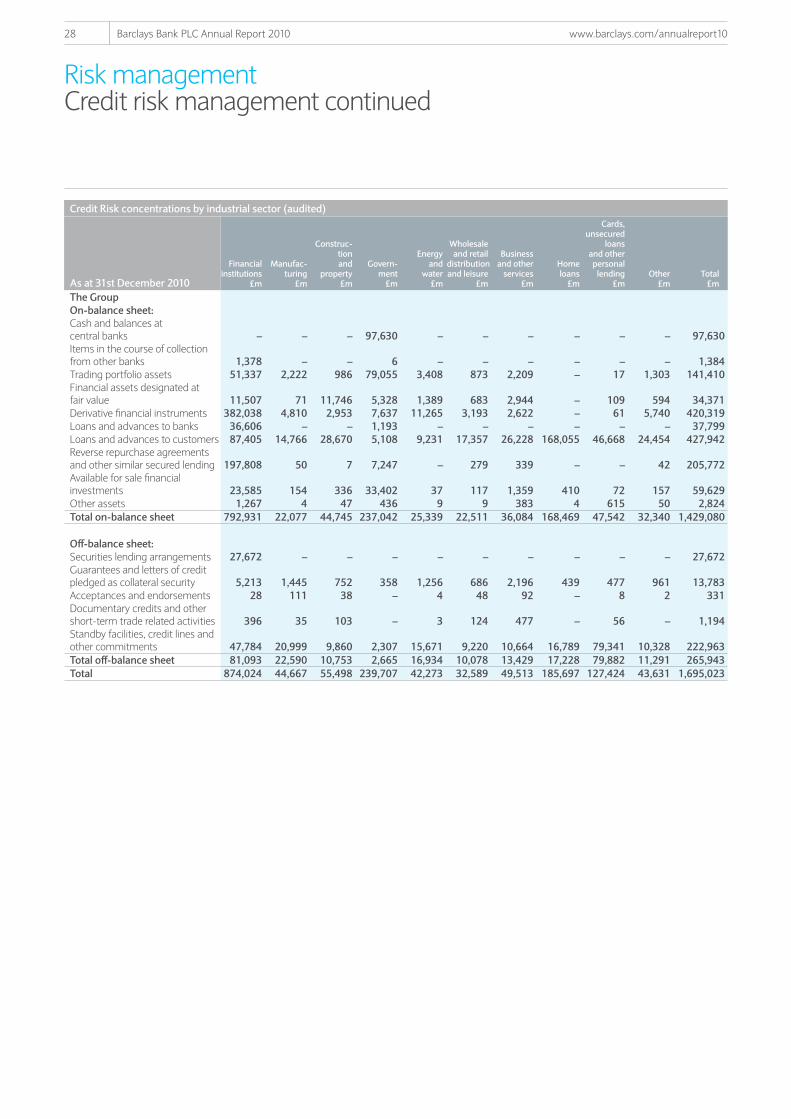
Risk managementCredit risk management continued
Credit Risk concentrations by industrial sector (audited)
As at 31st December 2010
Financialinstitutions
£m
Manufac-turing
£m
Construc-tionand
property£m
Govern-ment
£m
Energyand
water£m
Wholesaleand retail
distributionand leisure
£m
Businessand other
services£m
Homeloans
£m
Cards,unsecured
loansand otherpersonal
lending£m
Other£m
Total£m
The Group On-balance sheet: Cash and balances at central banks – – – 97,630 – – – – – – 97,630Items in the course of collection from other banks 1,378 – – 6 – – – – – – 1,384Trading portfolio assets 51,337 2,222 986 79,055 3,408 873 2,209 – 17 1,303 141,410Financial assets designated at fair value 11,507 71 11,746 5,328 1,389 683 2,944 – 109 594 34,371Derivative financial instruments 382,038 4,810 2,953 7,637 11,265 3,193 2,622 – 61 5,740 420,319Loans and advances to banks 36,606 – – 1,193 – – – – – – 37,799Loans and advances to customers 87,405 14,766 28,670 5,108 9,231 17,357 26,228 168,055 46,668 24,454 427,942Reverse repurchase agreements and other similar secured lending 197,808 50 7 7,247 – 279 339 – – 42 205,772 Available for sale financial investments 23,585 154 336 33,402 37 117 1,359 410 72 157 59,629 Other assets 1,267 4 47 436 9 9 383 4 615 50 2,824 Total on-balance sheet 792,931 22,077 44,745 237,042 25,339 22,511 36,084 168,469 47,542 32,340 1,429,080
Off-balance sheet: Securities lending arrangements 27,672 – – – – – – – – – 27,672 Guarantees and letters of credit pledged as collateral security 5,213 1,445 752 358 1,256 686 2,196 439 477 961 13,783 Acceptances and endorsements 28 111 38 – 4 48 92 – 8 2 331 Documentary credits and other short-term trade related activities 396 35 103 – 3 124 477 – 56 – 1,194 Standby facilities, credit lines and other commitments 47,784 20,999 9,860 2,307 15,671 9,220 10,664 16,789 79,341 10,328 222,963 Total off-balance sheet 81,093 22,590 10,753 2,665 16,934 10,078 13,429 17,228 79,882 11,291 265,943 Total 874,024 44,667 55,498 239,707 42,273 32,589 49,513 185,697 127,424 43,631 1,695,023
28 Barclays Bank PLC Annual Report 2010 www.barclays.com/annualreport10

Credit Risk concentrations by industrial sector (audited)
As at 31st December 2010
Financialinstitutions
£m
Manufac-turing
£m
Construc-tionand
property£m
Govern-ment
£m
Energyand
water£m
Wholesaleand retail
distributionand leisure
£m
Businessand other
services£m
Homeloans
£m
Cards,unsecured
loansand otherpersonal
lending£m
Other£m
Total£m
The Bank On-balance sheet: Cash and balances at central banks – – – 92,686 – – – – – – 92,686 Items in the course of collection from other banks 1,263 – – 5 – – – – – – 1,268 Trading portfolio assets 22,985 1,040 669 58,317 2,740 656 1,714 – – 707 88,828 Financial assets designated at fair value 9,861 51 10,654 4,816 398 447 2,791 – – 152 29,170 Derivative financial instruments 402,702 4,824 2,950 7,637 10,994 3,415 2,936 – 36 5,651 441,145 Loans and advances to banks 39,486 – – 904 – – – – – – 40,390 Loans and advances to customers 273,376 12,785 20,413 3,969 8,378 15,424 26,556 123,995 27,383 10,657 522,936 Reverse repurchase agreements and other similar secured lending 219,560 50 7 7,066 – 279 339 – – 42 227,343 Available for sale financial investments 20,466 154 337 23,498 3 52 387 – 23 156 45,076 Other assets 296 4 15 40 – 2 238 1 457 1 1,054 Total on-balance sheet 989,995 18,908 35,045 198,938 22,513 20,275 34,961 123,996 27,899 17,366 1,489,896
Off-balance sheet: Securities lending arrangements 27,672 – – – – – – – – – 27,672 Guarantees and letters of credit pledged as collateral security 4,878 1,321 619 358 1,196 591 1,822 – 196 842 11,823 Acceptances and endorsements 27 111 38 – 4 48 64 – 8 2 302 Documentary credits and other short-term trade related transactions 395 35 – – 3 124 311 – 56 – 924 Standby facilities, credit lines and other commitments 36,982 20,509 8,825 2,307 15,246 9,024 12,956 14,570 43,219 10,157 173,795 Total off-balance sheet 69,954 21,976 9,482 2,665 16,449 9,787 15,153 14,570 43,479 11,001 214,516 Total 1,059,949 40,884 44,527 201,603 38,962 30,062 50,114 138,566 71,378 28,367 1,704,412
Barclays Bank PLC Annual Report 2010 www.barclays.com/annualreport10 29

Risk managementCredit risk management continued
Credit Risk concentrations by industrial sector (audited)
As at 31st December 2009
Financialinstitutions
£m
Manufac-turing
£m
Construc-tionand
property£m
Govern-ment
£m
Energyand
water£m
Wholesaleand retail
distributionand leisure
£m
Businessand other
services£m
Homeloans
£m
Cards,unsecured
loansand otherpersonallending
£mOther
£mTotal
£m
The Group On-balance sheet: Cash and balances at central banks – – – 81,483 – – – – – – 81,483 Items in the course of collection from other banks 1,586 – – 7 – – – – – – 1,593 Trading portfolio assets 41,482 3,899 1,063 76,454 3,136 608 1,569 – – 1,271 129,482 Financial assets designated at fair value 13,366 78 11,929 5,435 330 775 2,569 150 4 419 35,055 Derivative financial instruments 379,901 4,230 2,416 6,119 12,081 3,472 5,627 – 69 2,900 416,815 Loans and advances to banks 36,710 – – 4,425 – – – – – – 41,135 Loans and advances to customers 93,113 18,197 29,175 4,801 10,723 19,156 29,603 149,099 40,575 25,782 420,224 Reverse repurchase agreements and other similar secured lending 136,184 87 926 5,347 – 279 608 – – – 143,431 Available for sale financial investments 30,398 285 269 16,320 57 82 1,896 416 – 84 49,807 Other assets 1,588 23 60 414 13 38 478 106 682 74 3,476 Total on-balance sheet 734,328 26,799 45,838 200,805 26,340 24,410 42,350 149,771 41,330 30,530 1,322,501
Off-balance sheet: Securities lending arrangements 27,406 – – – – – – – – – 27,406 Guarantees and letters of credit pledged as collateral security 5,711 1,266 715 – 2,872 955 2,164 584 411 728 15,406 Acceptances and endorsements 85 108 2 – 33 45 8 – 5 89 375 Documentary credits and other short-term trade related transactions 242 33 80 – – 171 233 – 3 – 762 Standby facilities, credit lines and other commitments 39,564 19,530 10,567 1,687 13,502 7,949 9,243 15,356 79,052 10,063 206,513 Total off-balance sheet 73,008 20,937 11,364 1,687 16,407 9,120 11,648 15,940 79,471 10,880 250,462 Total 807,336 47,736 57,202 202,492 42,747 33,530 53,998 165,711 120,801 41,410 1,572,963
30 Barclays Bank PLC Annual Report 2010 www.barclays.com/annualreport10

Credit Risk concentrations by industrial sector (audited)
As at 31st December 2009
Financialinstitutions
£m
Manufac-turing
£m
Construc-tionand
property£m
Govern-ment
£m
Energyand
water£m
Wholesaleand retail
distributionand leisure
£m
Businessand other
services£m
Homeloans
£m
Cards,unsecured
loansand otherpersonallending
£mOther
£mTotal
£m
The Bank On-balance sheet: Cash and balances at central banks – – – 78,447 – – – – – – 78,447 Items in the course of collection from other banks 1,373 – – – – – – – – – 1,373 Trading portfolio assets 20,065 2,552 605 58,375 2,690 307 1,223 – – 808 86,625 Financial assets designated at fair value 9,611 41 10,077 4,806 113 474 2,353 24 – 80 27,579 Derivative financial instruments 393,237 4,199 2,415 5,983 11,925 3,456 5,845 – 16 2,819 429,895 Loans and advances to banks 40,187 – – 2,776 – – – – – – 42,963 Loans and advances to customers 272,970 16,457 20,683 4,748 9,706 17,961 23,710 110,605 25,297 9,991 512,128 Reverse repurchase agreements and other similar secured lending 139,505 87 7 5,009 – 279 546 – – – 145,433 Available for sale financial investments 25,688 285 167 8,928 3 82 330 469 – 32 35,984 Other assets 414 13 13 31 – 7 233 – 487 – 1,198 Total on-balance sheet 903,050 23,634 33,967 169,103 24,437 22,566 34,240 111,098 25,800 13,730 1,361,625
Off-balance sheet: Securities lending arrangements 27,406 – – – – – – – – – 27,406 Guarantees and letters of credit pledged as collateral security 5,064 1,125 596 – 2,822 886 1,899 – 129 629 13,150 Acceptances and endorsements 63 108 2 – 33 45 7 – 5 87 350 Documentary credits and other short-term trade related transactions 176 33 – – – 171 152 – 1 2 535 Standby facilities, credit lines and other commitments 29,986 19,025 9,311 1,687 13,115 7,402 11,051 13,377 44,549 9,778 159,281 Total off-balance sheet 62,695 20,291 9,909 1,687 15,970 8,504 13,109 13,377 44,684 10,496 200,722 Total 965,745 43,925 43,876 170,790 40,407 31,070 47,349 124,475 70,484 24,226 1,562,347
Barclays Bank PLC Annual Report 2010 www.barclays.com/annualreport10 31

Risk managementCredit risk management continued
Loans and advances (audited)Governance and responsibilitiesThe credit risk management teams in each business are accountable to the business risk directors in those businesses who, in turn, report to the heads of their businesses and also to the Chief Risk Officer.
The credit risk function provides Group wide direction of credit risk-taking. The teams within this function manage the resolution of all significant credit policy issues and run the Credit Committee, which approves major credit decisions. Each business segment has an embedded credit risk management team. These teams assist Group Risk in the formulation of Group Risk policy and its implementation across the businesses.
The principal committees that review credit risk management, formulate overall Group credit policy and resolve all significant credit policy issues are the Board Risk Committee, the Group Risk Oversight Committee, the Wholesale Credit Risk Management Committee and the Retail Credit Risk Management Committee.
On a semi-annual basis, the Credit Risk Impairment Committee (CRIC) obtains assurance on behalf of the Group that all businesses are recognising impairment in their portfolios accurately, promptly and in accordance with policy, accounting standards and established governance.
CRIC is chaired by the Credit Risk Director and reviews the movements in impairment, including those already agreed at Credit Committee, as well as potential credit risk loans, loan loss rates, asset quality metrics and impairment coverage ratios.
CRIC makes twice-yearly recommendations to the Board Audit Committee on the adequacy of Group impairment allowances. Impairment allowances are reviewed relative to the risk in the portfolio, business and economic trends, current policies and methodologies, and the Group’s position relative to peer banks.
Credit monitoringWholesale and corporate loans which are deemed to contain heightened levels of risk are recorded on early-warning or watch lists. These lists are graded in line with the perceived severity of the risk attached to the lending and its probability of default. The lists are updated on a monthly basis and are closely monitored.
Regardless of whether they are recorded on early-warning or watch lists, all Wholesale and corporate loans are subject to a full review of all facilities on, at least, an annual basis. More frequent interim reviews may be undertaken should circumstances dictate.
Retail loans (which tend to comprise homogeneous assets) are monitored on a portfolio basis.
Credit risk measurementBarclays uses statistical modelling techniques throughout its business in its credit rating systems. They enable a coherent approach to risk measurement across all credit exposures, Retail and Wholesale. The key building blocks in the measurement system are the probability of customer default (PD), exposure in the event of default (EAD), and severity of loss-given-default (LGD). The models are reviewed regularly to monitor their robustness relative to actual performance and amended as necessary to optimise their effectiveness.
For Wholesale and corporate lending, Barclays assesses the credit quality of borrowers and other counterparties and assigns them an internal risk rating. Barclays credit rating contains 21 grades, representing the Group’s best estimate of credit risk for a counterparty based on current economic conditions. Retail customers are not all assigned internal risk ratings in this way for account management purposes, therefore their probability of default is considered.
The Group considers credit risk loans (defined as all customers overdue by 90 days or more, and/or individually impaired or restructured) and loan loss rates when assessing the credit performance of its loan portfolios, other than those held at fair value. For the purposes of historical and business unit comparison, loan loss rates are defined as total annualised credit impairment charge (excluding available for sale assets and reverse repurchase agreements) divided by gross loans and advances to customers and banks (at amortised cost).
Credit risk mitigationWhere appropriate, the Group takes action to mitigate credit risk such as reducing amounts outstanding (in discussion with the customers, clients or counterparties if appropriate), using credit derivatives, securitising assets, and disposals.
Diversification to avoid unwanted credit risk concentrations is achieved through setting maximum exposure guidelines to individual counterparties. Excesses are reported to the Board Risk Committee and the Group Risk Oversight Committee. Mandate and scale limits are used to limit the stock of current exposures in a loan portfolio and the flow of new exposures into a loan portfolio. Limits are typically based on the term and nature of the lending.
32 Barclays Bank PLC Annual Report 2010 www.barclays.com/annualreport10

Collateral and securityThe Group routinely obtains collateral and security to mitigate credit risk.
The Group ensures that any collateral held is sufficiently liquid, legally effective, enforceable and regularly reassessed. Before attaching value to collateral, businesses holding specific, agreed classes of collateral must ensure that they are holding a correctly perfected charge.
Before reliance is placed on third party protection in the form of bank, government or corporate guarantees or credit derivative protection from financial intermediary counterparties, a credit assessment is undertaken.
Security structures and legal covenants are subject to regular review, at least annually, to ensure that they remain fit for purpose and remain consistent with accepted local market practice.
Credit quality of loans and advances (audited)All loans and advances are categorised as either:
– neither past due nor individually impaired;
– past due but not individually impaired; or
– individually impaired, which includes restructured loans.
A loan is considered past due when the borrower has failed to make a payment when due under the terms of the loan contract.The impairment allowance includes allowances against financial assets that have been individually impaired and those subject to collective impairment. Loans subject to collective impairment allowances are included in either Neither past due but not impaired or Past due but not impaired.
Credit risk loans comprise loans and advances to banks and customers 90 days overdue or more and those subject to individual impairment. The coverage ratio is calculated by reference to the total impairment allowance and the carrying value (before impairment) of credit risk loans.
Credit quality of loans and advances (audited)
As at 31st December 2010
Neitherpast due
norindividually
impaireda
£m
Past duebut not
individuallyimpairedb
£m
Individuallyimpaired
£mTotal
£m
Impairmentallowance
£m
Totalcarrying
value£m
Creditrisk loansc
£m
Coverageratio
%
The Group Trading portfolio: Traded loans 2,170 – – 2,170 – 2,170 – – Financial assets designated at fair value: Loans and advances 22,273 79 – 22,352 – 22,352 – – Other financial assets – – – – – – – – Loans and advances to banks 37,149 663 35 37,847 (48) 37,799 35 100.0 Loans and advances to customers: Home loans 156,908 9,488 2,513 168,909 (854) 168,055 4,294 19.9 Credit card receivables 20,734 1,253 3,112 25,099 (2,441) 22,658 3,642 67.0 Other personal lending 24,363 1,975 3,397 29,735 (3,127) 26,608 3,886 80.5Wholesale and corporate 181,473 6,746 18,010 206,229 (5,611) 200,618 19,331 29.0Finance lease receivables 9,338 589 427 10,354 (351) 10,003 694 50.6 Total 454,408 20,793 27,494 502,695 (12,432) 490,263 31,882 39.0
The Bank Trading portfolio: Traded loans 2,500 – – 2,500 – 2,500 – – Financial assets designated at fair value: Loans and advances 25,022 71 – 25,093 – 25,093 – – Other financial assets – – – – – – – – Loans and advances to banks 39,794 609 35 40,438 (48) 40,390 35 100.0 Loans and advances to customers: Home loans 116,983 6,296 931 124,210 (215) 123,995 1,461 14.7 Credit card receivables 11,097 645 1,831 13,573 (1,389) 12,184 2,044 68.0 Other personal lending 13,012 1,293 1,986 16,291 (2,061) 14,230 2,262 91.1 Wholesale and corporate 358,760 2,311 15,641 376,712 (4,411) 372,301 16,196 27.2 Finance lease receivables 226 – – 226 – 226 – – Total 567,394 11,225 20,424 599,043 (8,124) 590,919 21,998 36.9
Notesa Financial assets subject to collective impairment allowance are included in this column if
they are not past due.b Financial assets subject to collective impairment allowance are included in this column if
they are past due.c Credit Risk Loans include the loan to Protium of £7,560m against which an impairment of
£532m is held.
Barclays Bank PLC Annual Report 2010 www.barclays.com/annualreport10 33

Risk managementCredit risk management continued
Credit quality of loans and advances (audited)
As at 31st December 2009
Neitherpast due
norindividually
impaireda
£m
Past duebut not
individuallyimpairedb
£m
Individuallyimpaired
£mTotal
£m
Impairmentallowance
£m
Totalcarrying
value£m
Creditrisk loans
£m
Coverageratio
%
The Group Trading portfolio: Traded loans 2,962 – – 2,962 – 2,962 – – Financial assets designated at fair value: Loans and advances 22,210 180 – 22,390 – 22,390 – – Other financial assets 557 – – 557 – 557 – – Loans and advances to banks 38,859 2,280 57 41,196 (61) 41,135 57 100.0 Loans and advances to customers: Home loansc 139,045 8,839 1,854 149,738 (639) 149,099 3,758 17.0 Credit card receivables 20,195 1,544 2,459 24,198 (2,309) 21,889 3,068 75.3 Other personal lending 23,796 2,175 2,372 28,343 (2,908) 25,435 3,466 83.9 Wholesale and corporate 199,800 7,598 10,088 217,486 (4,558) 212,928 11,497 39.6 Finance lease receivables 10,128 664 402 11,194 (321) 10,873 696 46.1 Total 457,552 23,280 17,232 498,064 (10,796) 487,268 22,542 47.9
The Bank Trading portfolio: Traded loans 2,945 – – 2,945 – 2,945 – – Financial assets designated at fair value: Loans and advances 21,467 169 – 21,636 – 21,636 – – Other financial assets 423 – – 423 – 423 – – Loans and advances to banks 40,784 2,183 57 43,024 (61) 42,963 57 100.0 Loans and advances to customers: Home loansc 103,883 5,893 977 110,753 (148) 110,605 1,686 8.8 Credit card receivables 10,920 582 1,363 12,865 (1,342) 11,523 1,578 85.0 Other personal lending 13,043 1,030 1,959 16,032 (1,907) 14,125 2,485 76.7 Wholesale and corporate 365,778 3,854 9,825 379,457 (3,944) 375,513 10,584 37.3 Finance lease receivables 362 – – 362 – 362 – – Total 559,605 13,711 14,181 587,497 (7,402) 580,095 16,390 45.2
Notesa Financial assets subject to collective impairment allowance are included in this column if
they are not past due.b Financial assets subject to collective impairment allowance are included in this column if
they are past due.c Comparative figures for home loans have been restated to align with externally disclosed
arrears definition.
34 Barclays Bank PLC Annual Report 2010 www.barclays.com/annualreport10

Loans and advances neither past due nor individually impaired (audited)2010 2009
As at 31st December Strong
£mSatisfactory
£mHigher risk
£mTotal
£mStrong
£mSatisfactory
£mHigher risk
£mTotal
£m
The Group Trading portfolio: Traded loans 352 1,203 615 2,170 1,366 1,290 306 2,962 Financial assets designated at fair value: Loans and advances 17,496 2,100 2,677 22,273 15,909 3,809 2,492 22,210 Other financial assets – – – – 261 – 296 557 Loans and advances to banks 35,666 1,360 123 37,149 35,825 2,492 542 38,859 Loans and advances to customers: Home loans 85,351 69,784 1,773 156,908 66,831 69,890 2,324 139,045 Credit card receivables – 20,538 196 20,734 – 20,038 157 20,195 Other personal lending 5,555 16,130 2,678 24,363 3,417 18,108 2,271 23,796 Wholesale and corporate 115,783 59,921 5,769 181,473 119,764 70,132 9,904 199,800 Finance lease receivables 3,684 5,228 426 9,338 2,664 7,082 382 10,128 Total 263,887 176,264 14,257 454,408 246,037 192,841 18,674 457,552
The Bank Trading portfolio: Traded loans 337 1,203 960 2,500 1,366 1,273 306 2,945 Financial assets designated at fair value: Loans and advances 21,808 1,342 1,872 25,022 17,657 2,892 918 21,467 Other financial assets – – – – 423 – – 423 Loans and advances to banks 35,607 3,403 784 39,794 37,160 1,851 1,773 40,784 Loans and advances to customers: Home loans 75,658 41,131 194 116,983 59,900 42,935 1,048 103,883 Credit card receivables – 11,097 – 11,097 – 10,920 – 10,920 Other personal lending 5,088 5,780 2,144 13,012 2,911 8,178 1,954 13,043 Wholesale and corporate 309,533 45,146 4,081 358,760 303,545 54,510 7,723 365,778 Finance lease receivables – 226 – 226 – 362 – 362 Total 448,031 109,328 10,035 567,394 422,962 122,921 13,722 559,605
For the purposes of the analysis of credit quality, the following internal measures of credit quality have been used:
Retail lending Wholesale lending
Financial Statements description Probability of default Probability of default Default Grade
Strong 0.0-0.60% 0.0-0.05% 1-30.05-0.15% 4-50.15-0.30% 6-80.30-0.60% 9-11
Satisfactory 0.60-10.00% 0.60-2.15% 12-142.15-11.35% 15-19
Higher risk 10.00%+ 11.35%+ 20-21
Financial statement descriptions can be summarised as follows:
Strong – there is a very high likelihood of the asset being recovered in full.
Satisfactory – whilst there is a high likelihood that the asset will be recovered and therefore of no cause for concern to the Group, the asset may not be collateralised, or may relate to retail facilities, such as credit card balances and unsecured loans, which have been classified as satisfactory, regardless of the fact that the output of internal grading models may have indicated a higher classification. At the lower end of this grade there are customers that are being more carefully monitored, for example, corporate customers which are indicating some evidence of some deterioration, mortgages with a high loan to value ratio, and unsecured retail loans operating outside normal product guidelines.
Higher risk – there is concern over the obligor’s ability to make payments when due. However, these have not yet converted to actual delinquency. There may also be doubts over value of collateral or security provided. However, the borrower or counterparty is continuing to make payments when due and is expected to settle all outstanding amounts of principal and interest.
Barclays Bank PLC Annual Report 2010 www.barclays.com/annualreport10 35

Risk managementCredit risk management continued
Loans and advances that are past due but not individually impaired (audited)An age analysis of loans and advances that are past due but not individually impaired is set out below.
For the purposes of this analysis an asset is considered past due and included below when any payment due under strict contractual terms is received late or missed. The amount included is the entire financial asset, not just the payment, of principal or interest or both, overdue.
The table below provides a breakdown of total financial assets past due but not individually impaired. In general, retail and wholesale loans fall into this category for two separate reasons. Retail loans and advances to customers may come under this category because the impairment allowance on such loans is calculated on a collective – not individual – basis. This reflects the homogenous nature of the assets, which allows statistical techniques to be used, rather than individual assessment.
In contrast, some loans to Wholesale customers and banks may come under this category because of instances where a payment on a loan is past due without requiring an individual impairment allowance. For example, an individual impairment allowance will not be required when a loss is not expected due to a corporate loan being fully secured or collateralised. As a result, it is past due but not individually impaired.
Loans and advances past due but not individually impaired (audited)
As at 31st December 2010
Past due up to 1 month
£m
Past due 1-2
months£m
Past due2-3
months£m
Past due 3-6
months£m
Past due6 monthsand over
£mTotal
£m
Of whichcredit risk
loans£m
The Group Financial assets designated at fair value: Loans and advances – – 70 1 8 79 – Loans and advances to banks 663 – – – – 663 – Loans and advances to customers: Home loans 4,915 1,875 917 1,381 400 9,488 1,781 Credit card receivables 214 156 353 441 89 1,253 530 Other personal lending 422 672 392 362 127 1,975 489Wholesale and corporate 4,104 788 533 620 701 6,746 1,321Finance lease receivables 175 80 67 266 1 589 267 Total financial assets past due but not individually impaired 10,493 3,571 2,332 3,071 1,326 20,793 4,388
The Bank Financial assets designated at fair value: Loans and advances – – 70 1 – 71 – Loans and advances to banks 609 – – – – 609 – Loans and advances to customers: Home loans 3,445 1,561 760 342 188 6,296 530 Credit card receivables 78 77 277 202 11 645 213 Other personal lending 107 581 329 186 90 1,293 276 Wholesale and corporate 1,220 269 267 260 295 2,311 555 Total financial assets past due but not individually impaired 5,459 2,488 1,703 991 584 11,225 1,574
36 Barclays Bank PLC Annual Report 2010 www.barclays.com/annualreport10

Loans and advances past due but not individually impaired (audited)
As at 31st December 2009
Past due up to 1 month
£m
Past due 1-2
months£m
Past due2-3
months£m
Past due 3-6
months£m
Past due6 monthsand over
£mTotal
£m
Of whichcredit risk
loans£m
The Group Financial assets designated at fair value: Loans and advances 170 – 1 – 9 180 – Loans and advances to banks 2,280 – – – – 2,280 – Loans and advances to customers: Home loans 4,849 1,453 633 1,403 501 8,839 1,904 Credit card receivables 501 214 220 459 150 1,544 609 Other personal lending 369 295 417 413 681 2,175 1,094 Wholesale and corporate 5,403 292 494 866 543 7,598 1,409 Finance lease receivables 186 86 98 282 12 664 294 Total financial assets past due but not individually impaired 13,758 2,340 1,863 3,423 1,896 23,280 5,310
The Bank Financial assets designated at fair value: Loans and advances 169 – – – – 169 – Loans and advances to banks 2,183 – – – – 2,183 – Loans and advances to customers: Home loans 3,648 1,183 353 539 170 5,893 709 Credit card receivables 209 67 91 207 8 582 215 Other personal lending 87 185 232 290 236 1,030 526 Wholesale and corporate 2,629 161 305 377 382 3,854 759 Total financial assets past due but not individually impaired 8,925 1,596 981 1,413 796 13,711 2,209
Loans and advances individually assessed as impaired (audited) 2010 2009
As at 31st December
Originalcarryingamount
£m
Impairmentallowance
£m
Revisedcarryingamount
£m
Originalcarryingamount
£m
Impairmentallowance
£m
Revisedcarryingamount
£m
The Group Total loans and advances to banks individually impaired 35 (31) 4 57 (49) 8 Loans and advances to customers: Home loans 2,513 (627) 1,886 1,854 (317) 1,537 Credit card receivables 3,112 (2,025) 1,087 2,459 (1,690) 769 Other personal lending 3,397 (2,075) 1,322 2,372 (1,531) 841 Wholesale and corporate 18,010 (4,986) 13,024 10,088 (3,837) 6,251 Finance lease receivables 427 (265) 162 402 (233) 169 Total loans and advances individually impaired 27,494 (10,009) 17,485 17,232 (7,657) 9,575 Collective impairment allowance (2,423) (3,139) Total impairment allowance (12,432) (10,796)
The Bank Total loans and advances to banks individually impaired 35 (31) 4 57 (49) 8 Loans and advances to customers: Home loans 931 (116) 815 977 (92) 885 Credit card receivables 1,831 (1,048) 783 1,363 (826) 537 Other personal lending 1,986 (1,432) 554 1,959 (1,331) 628 Wholesale and corporate 15,641 (3,841) 11,800 9,825 (3,323) 6,502 Total loans and advances individually impaired 20,424 (6,468) 13,956 14,181 (5,621) 8,560 Collective impairment allowance (1,656) (1,781) Total impairment allowance (8,124) (7,402)
Barclays Bank PLC Annual Report 2010 www.barclays.com/annualreport10 37

Risk managementCredit risk management continued
The movements on the impairment allowance during the year were as follows:
Movements in allowance for impairment by asset class (audited)
2010
At beginningof year
£m
Acquisitionsand
disposals£m
Unwind ofdiscount
£m
Exchangeand other
adjustments£m
Amountswritten off
£mRecoveries
£m
Amountscharged to
incomestatement
£m
Balance at31st
December£m
The Group Loans and advances to banks 61 – – (1) (11) 17 (18) 48 Loans and advances to customers: Home loans 639 18 (54) 63 (134) 6 316 854 Credit card receivables 2,309 74 (100) 50 (1,374) 77 1,405 2,441 Other personal lending 2,908 – (47) 45 (1,059) 37 1,243 3,127 Wholesale and corporate 4,558 (14) (6) 148 (1,547) 40 2,432 5,611 Finance lease receivables 321 – (6) 26 (185) 24 171 351 Total loans and advances to customers 10,735 78 (213) 332 (4,299) 184 5,567 12,384 Total impairment allowance 10,796 78 (213) 331 (4,310) 201 5,549 12,432
The Bank Loans and advances to banks 61 – – (1) (11) 12 (13) 48 Loans and advances to customers: Home loans 148 18 (3) (1) (22) 1 74 215 Credit card receivables 1,342 63 (89) (17) (811) 78 823 1,389 Other personal lending 1,907 – (23) 8 (715) 14 870 2,061 Wholesale and corporate 3,944 – – 124 (1,417) 32 1,728 4,411 Finance lease receivables – – – – – – – – Total loans and advances to customers 7,341 81 (115) 114 (2,965) 125 3,495 8,076 Total impairment allowance 7,402 81 (115) 113 (2,976) 137 3,482 8,124
Movements in allowance for impairment by asset class (audited)
2009
At beginningof year
£m
Acquisitionsand
disposals£m
Unwind ofdiscount
£m
Exchangeand other
adjustments£m
Amountswritten off
£mRecoveries
£m
Amountscharged to
incomestatement
£m
Balance at31st
December£m
The Group Loans and advances to banks 51 – – (11) – 10 11 61 Loans and advances to customers: Home loans 321 19 (59) 46 (82) 3 391 639 Credit card receivables 1,445 415 (79) (28) (1,009) 78 1,487 2,309 Other personal lending 1,869 – (26) (89) (633) 21 1,766 2,908 Wholesale 2,699 – (15) (48) (1,538) 28 3,432 4,558 Finance lease receivables 189 – (6) 3 (118) 10 243 321 Total loans and advances to customers 6,523 434 (185) (116) (3,380) 140 7,319 10,735 Total impairment allowance 6,574 434 (185) (127) (3,380) 150 7,330 10,796
The Bank Loans and advances to banks 51 – – (11) – 7 14 61 Loans and advances to customers: Home loans 91 19 (2) 6 (18) – 52 148 Credit card receivables 901 115 (79) 5 (336) 38 698 1,342 Other personal lending 1,232 14 (28) (103) (397) 10 1,179 1,907 Wholesale 2,999 – – (867) (1,393) 25 3,180 3,944 Finance lease receivables – – – – – – – – Total loans and advances to customers 5,223 148 (109) (959) (2,144) 73 5,109 7,341 Total impairment allowance 5,274 148 (109) (970) (2,144) 80 5,123 7,402
38 Barclays Bank PLC Annual Report 2010 www.barclays.com/annualreport10

Loan loss rates (audited)
As at 31st December
Gross loans and advances
£m
Impairment allowance
£m
Loans and advances
net of impairment
£m
Impairment charge
£m
Loan loss rate bps
The Group 2010 478,173 (12,432) 465,741 5,625 118 2009 472,155 (10,796) 461,359 7,358 156 The Bank 2010 571,450 (8,124) 563,326 3,476 612009 562,493 (7,402) 555,091 5,195 92
Renegotiated loans and advances (audited)Loans and advances are generally renegotiated either as part of an ongoing customer relationship or in response to an adverse change in the circumstances of the borrower. In the latter case renegotiation can result in an extension of the due date of payment or repayment plans under which the Group offers a concessionary rate of interest to genuinely distressed borrowers. This will result in the asset continuing to be overdue and will be individually impaired where the renegotiated payments of interest and principal will not recover the original carrying amount of the asset. In other cases, renegotiation will lead to a new agreement, which is treated as a new loan.
Collateral and other credit enhancements held (audited)Financial assets that are past due or individually assessed as impaired may be partially or fully collateralised or subject to other forms of credit enhancement.
Assets in these categories subject to collateralisation are mainly corporate loans, Home Loans and finance lease receivables. Credit card receivables and other personal lending are generally unsecured (although in some instances a charge over the borrower’s property or other assets may be sought).
Corporate loans (audited)Security is usually taken in the form of a fixed charge over the borrower’s property or a floating charge over the assets of the borrower. Loan covenants may be put in place to safeguard the Group’s financial position. If the exposure is sufficiently large, either individually or at the portfolio level, credit protection in the form of guarantees, credit derivatives or insurance may be taken out. For these and other reasons collateral given is only accurately valued on origination of the loan or in the course of enforcement actions and as a result it is not practicable to estimate the fair value of the collateral held.
Home loans (audited)Home Loans are secured by a fixed charge over the property.
A description and the estimated fair value of collateral held in respect of Home Loans that are past due or individually assessed as impaired is as follows:
Nature of assets (audited) The Group The Bank
As at 31st December
2010 Fairvalue
£m
2009 Fairvalue
£m
2010 Fairvalue
£m
2009 Fairvalue
£m
Residential property 10,057 9,628 6,132 6,255
Collateral included in the above table reflects the Group’s interest in the property in the event of default. That held in the form of charges against residential property in the UK is restricted to the outstanding loan balance. In other territories, where the Group is not obliged to return any sale proceeds to the mortgagee, the full estimated fair value has been included.
Finance lease receivables (audited)The net investment in the lease is secured through retention of legal title to the leased assets.
Barclays Bank PLC Annual Report 2010 www.barclays.com/annualreport10 39

Risk managementCredit risk management continued
Collateral and other credit enhancements obtained (audited)The carrying value of assets held by the Group as at 31st December 2010 as a result of the enforcement of collateral was as follows:
Assets received (audited) The Group The Bank
As at 31st December
2010Carryingamount
£m
2009Carryingamount
£m
2010Carryingamount
£m
2009Carryingamount
£m
Residential property 71 71 19 22 Commercial and industrial property 14 66 – – Other credit enhancements 210 248 177 209 Total 295 385 196 231
Any properties repossessed are made available for sale in an orderly and timely fashion, with any proceeds realised being used to reduce or repay the outstanding loan. For business customers, in some circumstances, where excess funds are available after repayment in full of the outstanding loan, they are offered to any other, lower ranked, secured lenders. Any additional funds are returned to the customer. Barclays does not, as a rule, occupy repossessed properties for its business use.
The Group does not use assets obtained in its operations. Assets obtained are normally sold, generally at auction, or realised in an orderly manner for the maximum benefit of the Group, the borrower and the borrower’s other creditors in accordance with the relevant insolvency regulations.
Debt Securities (audited)Credit Quality of Debt SecuritiesTrading portfolio assets, financial assets designated at fair value and available for sale assets are measured on a fair value basis. The fair value will reflect, among other things, the credit risk of the issuer.
Most listed and some unlisted securities are rated by external rating agencies. The Group mainly uses external credit ratings provided by Standard & Poor’s or Moody’s. Where such ratings are not available or are not current, the Group will use its own internal ratings for the securities.
Securities rated as investment grade amounted to 93.0% of the portfolio (2009: 91.8%). An analysis of the credit quality of the Group’s debt securities is set out below:
Debt securities (audited) 2010 2009
As at 31st December
AAA to BBB-(investment
grade) £m
BB+ to B£m
B- andbelow
£mTotal
£m
AAA to BBB-(investment
grade) £m
BB+ to B£m
B- andbelow
£mTotal
£m
The GroupTrading portfolio 130,744 6,663 1,833 139,240 119,138 5,346 2,036 126,520Financial assets designated at fair value 942 644 332 1,918 2,200 1,791 16 4,007Available for sale financial investments 55,107 2,022 2,500 59,629 44,233 5,055 519 49,807Total debt securities 186,793 9,329 4,665 200,787 165,571 12,192 2,571 180,334% of total 93.0% 4.7% 2.3% 100.0% 91.8% 6.8% 1.4% 100.0%
Included in the table above are impaired available for sale debt securities with a carrying value at 31st December 2010 of £358m (2009: £265m), after a write down of £583m (2009: £692m).
Debt securities (audited) 2010 2009
As at 31st December
AAA to BBB-(investment
grade) £m
BB+ to B£m
B- andbelow
£mTotal
£m
AAA to BBB-(investment
grade) £m
BB+ to B£m
B- andbelow
£mTotal
£m
The BankTrading portfolio 80,732 3,774 1,822 86,328 79,144 3,568 968 83,680Financial assets designated at fair value 244 252 287 783 1,901 1,422 15 3,338Available for sale financial investments 42,656 287 2,133 45,076 33,893 1,942 149 35,984Total debt securities 123,632 4,313 4,242 132,187 114,938 6,932 1,132 123,002% of total 93.5% 3.3% 3.2% 100.0% 93.5% 5.6% 0.9% 100.0%
Collateral is not generally obtained directly from the issuers of debt securities. Certain debt securities may be collateralised by specifically identified assets that would be obtainable in the event of default.
40 Barclays Bank PLC Annual Report 2010 www.barclays.com/annualreport10

Derivatives (audited)Derivatives are measured on a fair value basis.
The credit quality of the Group’s derivative assets according to the credit quality of the counterparty at 31st December 2010 and 2009 was as follows:
Credit quality (audited) 2010 2009
AAA to BBB-(investment
grade) £m
BB+ to B£m
B- andbelow
£mTotal
£m
AAA to BBB-(investment
grade) £m
BB+ to B£m
B- andbelow
£mTotal
£m
The Group Derivatives 401,242 15,598 3,479 420,319 399,534 15,565 1,716 416,815
95.5% 3.7% 0.8% 100.0% 95.9% 3.7% 0.4% 100.0% The Bank Derivatives 423,625 14,046 3,474 441,145 413,816 14,366 1,713 429,895
96.0% 3.2% 0.8% 100.0% 96.3% 3.3% 0.4% 100.0%
Credit risk from derivatives is mitigated where possible through netting agreements whereby derivative assets and liabilities with the same counterparty can be offset. Group policy requires all netting arrangements to be legally documented. The ISDA Master Agreement is the Group’s preferred agreement for documenting OTC derivatives. It provides the contractual framework within which dealing activities across a full range of OTC products are conducted and contractually binds both parties to apply close-out netting across all outstanding transactions covered by an agreement if either party defaults or other predetermined events occur.
Collateral is obtained against derivative assets, depending on the creditworthiness of the counterparty and/or nature of the transaction. Any collateral taken in respect of OTC trading exposures will be subject to a ‘haircut’ which is negotiated at the time of signing the collateral agreement. A haircut is the valuation percentage applicable to each type of collateral and will be largely based on liquidity and price volatility of the underlying security. The collateral obtained for derivatives is either cash, direct debt obligation government (G14+) bonds denominated in the domestic currency of the issuing country, debt issued by supranationals or letters of credit issued by an institution with a long-term unsecured debt rating of A+/A3 or better. Where the Group has ISDA master agreements, the collateral document will be the ISDA Credit Support Annex (CSA). The collateral document must give Barclays the power to realise any collateral placed with it in the event of the failure of the counterparty, and to place further collateral when requested or in the event of insolvency, administration or similar processes, as well as in the case of early termination.
Derivative assets and liabilities would be £378bn (2009: £374bn) lower than reported if netting were permitted for assets and liabilities with the same counterparty or for which the Group holds cash collateral.
Barclays Bank PLC Annual Report 2010 www.barclays.com/annualreport10 41

Risk managementCredit risk management continued
Reverse Repurchase Agreements and Other Financial Assets (audited)Reverse repurchase agreements and securities borrowing arrangements are collateralised loans typically of short maturities.
The loans are fully collateralised with highly liquid securities legally transferred to the Group. The level of collateral is monitored daily and further collateral called when required.
Credit quality (audited) 2010 2009
AAA toBBB-
(investmentgrade)
£mBB+ to B
£m
B- and below
£mTotal
£m
AAA toBBB-
(investmentgrade)
£mBB+ to B
£m
B- and below
£mTotal
£m
The Group Financial assets designated at fair value: Other financial assets 7,285 271 3 7,559 4,749 1,955 1,053 7,757 Reverse repurchase agreements 179,625 24,801 1,346 205,772 136,366 6,674 391 143,431 Total reverse repurchase agreements 186,910 25,072 1,349 213,331 141,115 8,629 1,444 151,188
87.6% 11.8% 0.6% 100.0% 93.3% 5.7% 1.0% 100.0% The Bank Financial assets designated at fair value: Other financial assets 2,324 165 – 2,489 1,890 73 120 2,083 Reverse repurchase agreements 208,120 17,920 1,303 227,343 140,739 4,391 303 145,433 Total reverse repurchase agreements 210,444 18,085 1,303 229,832 142,629 4,464 423 147,516
91.5% 7.9% 0.6% 100.0% 96.7% 3.0% 0.3% 100.0%
No reverse repurchase agreements held by the Group at 31st December 2010 or 2009 were individually impaired, however during the year, the Group wrote back £4m of impairment on reverse repurchase agreements (2009: £43m charge).
Other Credit Risk Assets (audited)Cash and balances at central banksCash and balances with central banks were £97,630m (2009: £81,483m). There is a reduced level of credit risk in relation to balances at central banks.
Items in the course of collection from other banksItems in the course of collection from other banks were £1,384m (2009: £1,593m), of which there is reduced credit risk in light of the banking industry clearing system.
Other financial assetsOther financial assets comprise £2,824m (2009: £3,476m) of other assets and £2,542m (2009: £344m) of assets held at fair value.
Off-balance sheetThe Group applies fundamentally the same risk management policies for off-balance sheet risks as it does for its on-balance sheet risks. In the case of commitments to lend, customers and counterparties will be subject to the same credit management policies as for loans and advances. Collateral may be sought depending on the strength of the counterparty and the nature of the transaction.
42 Barclays Bank PLC Annual Report 2010 www.barclays.com/annualreport10

Credit market exposuresBarclays Capital’s credit market exposures primarily relate to commercial real estate, leveraged finance and a loan to Protium Finance LP. These include positions subject to fair value movements in the income statement and positions that are classified as loans and advances and as available for sale.
The balances and write downs presented below represent credit market exposures held at the time of the market dislocation in mid-2007. Similar assets acquired subsequent to the market dislocation are actively traded in secondary markets and are therefore excluded from the disclosure.
The balances and write downs to 31st December 2010 are set out by asset class below:
Barclays Capital credit market exposuresa (audited) As at 31st December Year ended 31st December 2010
2010$m
2009$m
2010£m
2009£m
Fair value (losses)/
gains£m
Impairment (charge)/
release£m
Total(losses)/
gains£m
US Residential MortgagesABS CDO Super Senior 3,085 3,127 1,992 1,931 – 137 137 Other US sub-prime and Alt-Ab 1,025 1,447 662 894 (43) (11) (54)Monoline protection on US RMBS – 9 – 6 (1) – (1)
Commercial MortgagesCommercial real estate loans and properties owned 11,006 12,525 7,106 7,734 (110) – (110)Commercial mortgage-backed securitiesb 184 352 119 218 (5) – (5)Monoline protection on CMBS 18 49 12 30 40 – 40
Other Credit MarketLeveraged Financec 7,636 8,919 4,930 5,507 – (242) (242)SIVs, SIV-Lites and CDPCs 618 896 399 553 50 27 77 Monoline protection on CLO and other 2,541 3,443 1,641 2,126 (55) – (55)
Loan to Protium 10,884 12,727 7,028 7,859 – (532) (532)
Total 36,997 43,494 23,889 26,858 (124) (621) (745)
During the year ended 31st December 2010, these credit market exposures decreased £2,969m to £23,889m (2009: £26,858m). The decrease reflected net sales and paydowns and other movements of £3,000m and total write downs of £745m, offset by foreign exchange rate movements of £776m, primarily relating to the appreciation of the US Dollar against Sterling.
In the year ended 31st December 2010, write downs comprised £621m (2009: £1,669m) of impairment charges and £124m (2009: £4,417m) of net fair value losses through income. Total write downs included an impairment charge of £532m (2009: £nil) relating to the Protium loan, losses of £75m (2009: £3,007m) against commercial mortgage positions and losses of £220m (2009: £997m) against other credit market positions, partially offset by a gain of £82m (2009: loss of £2,082m) against US residential mortgage positions.
Loan to ProtiumOn 16th September 2009, Barclays Capital sold assets of £7,454m ($12,285m), including £5,087m ($8,384m) in credit market assets, to Protium Finance LP (Protium), a newly established fund. As part of the transaction Barclays extended a $12,641m 10 year loan to Protium.
The table below includes all assets held by Protium as collateral for the loan. At 31st December 2010, there were assets wrapped by a monoline insurer with a fair value of $4,806m (2009: $4,095m). Following the commutation of contracts with one monoline insurer in January 2011, there are no longer any assets wrapped by monoline insurers. Cash and cash equivalents at 31st December 2010 were $1,364m (2009: $688m) including cash realised from sales and paydowns and funds available to purchase third party assets. Other assets at 31st December 2010 were $811m (2009: $567m) including residential mortgage-backed securities purchased by Protium post inception and other asset-backed securities.
Principal and interest payments have been received in accordance with contractual terms. However, following a reassessment of the expected realisation period, the loan is carried at an amount equivalent to the fair value of the underlying collateral. This has resulted in an impairment charge of $824m (£532m).
Notesa As the majority of exposure is held in US Dollars, the exposures above are shown in both
US Dollars and Sterling.b 31st December 2009 comparatives have been adjusted to exclude actively traded
positions relating to other US sub-prime and Alt-A of £498m and commercial mortgage-backed securities of £253m.
c Includes undrawn commitments of £264m (2009: £257m).
Barclays Bank PLC Annual Report 2010 www.barclays.com/annualreport10 43
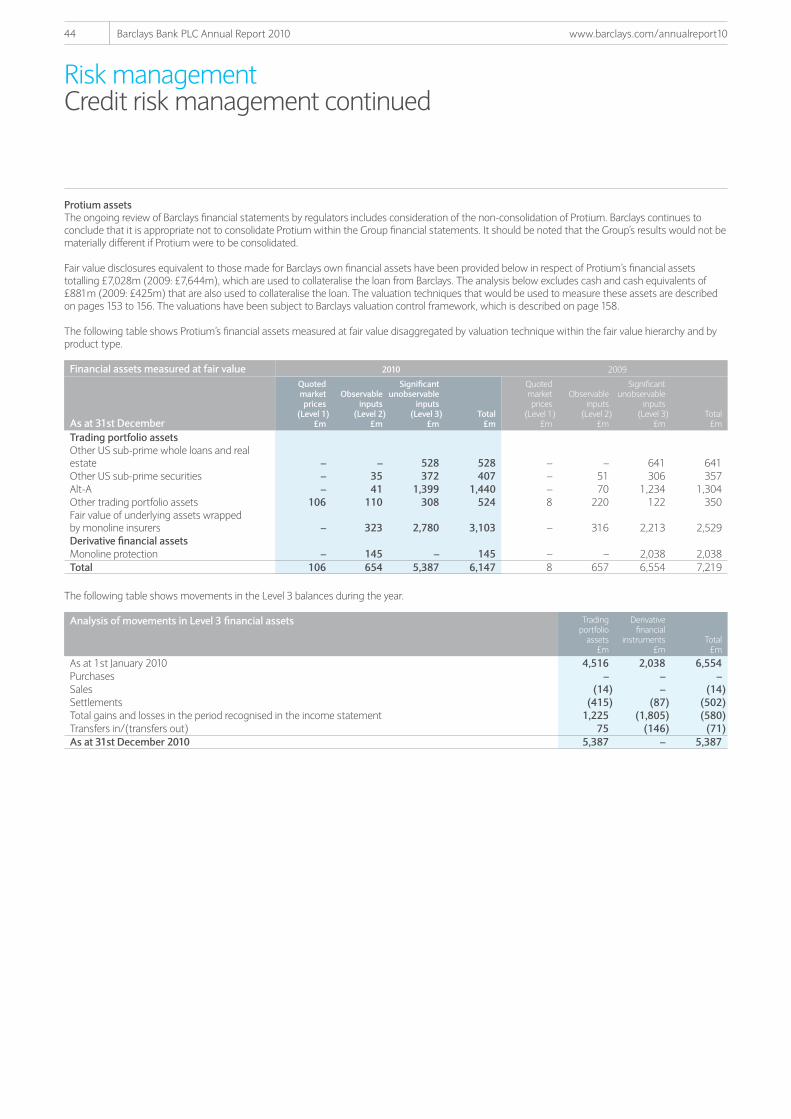
Risk managementCredit risk management continued
Protium assetsThe ongoing review of Barclays financial statements by regulators includes consideration of the non-consolidation of Protium. Barclays continues to conclude that it is appropriate not to consolidate Protium within the Group financial statements. It should be noted that the Group’s results would not be materially different if Protium were to be consolidated.
Fair value disclosures equivalent to those made for Barclays own financial assets have been provided below in respect of Protium’s financial assets totalling £7,028m (2009: £7,644m), which are used to collateralise the loan from Barclays. The analysis below excludes cash and cash equivalents of £881m (2009: £425m) that are also used to collateralise the loan. The valuation techniques that would be used to measure these assets are described on pages 153 to 156. The valuations have been subject to Barclays valuation control framework, which is described on page 158.
The following table shows Protium’s financial assets measured at fair value disaggregated by valuation technique within the fair value hierarchy and by product type.
Financial assets measured at fair value 2010 2009
As at 31st December
Quotedmarketprices
(Level 1)£m
Observableinputs
(Level 2)£m
Significantunobservable
inputs(Level 3)
£mTotal
£m
Quotedmarketprices
(Level 1)£m
Observableinputs
(Level 2)£m
Significantunobservable
inputs(Level 3)
£mTotal
£m
Trading portfolio assets Other US sub-prime whole loans and real estate – – 528 528 – – 641 641 Other US sub-prime securities – 35 372 407 – 51 306 357 Alt-A – 41 1,399 1,440 – 70 1,234 1,304 Other trading portfolio assets 106 110 308 524 8 220 122 350 Fair value of underlying assets wrapped by monoline insurers – 323 2,780 3,103 – 316 2,213 2,529 Derivative financial assets Monoline protection – 145 – 145 – – 2,038 2,038 Total 106 654 5,387 6,147 8 657 6,554 7,219
The following table shows movements in the Level 3 balances during the year.
Analysis of movements in Level 3 financial assets Tradingportfolio
assets£m
Derivativefinancial
instruments£m
Total£m
As at 1st January 2010 4,516 2,038 6,554 Purchases – – –Sales (14) – (14)Settlements (415) (87) (502) Total gains and losses in the period recognised in the income statement 1,225 (1,805) (580)Transfers in/(transfers out) 75 (146) (71) As at 31st December 2010 5,387 – 5,387
44 Barclays Bank PLC Annual Report 2010 www.barclays.com/annualreport10

The significant movements in the Level 3 positions during the year ended 31st December 2010 are explained below:
– Settlements represent assets that were paid in full, amortisation of principal, and payments from monoline insurers.
– Total gains and losses represent changes in the fair value of the assets, and losses due to commutation of contracts with monoline insurers.
Sensitivity analysis of valuations using unobservable inputs 2010 2009
As at 31st DecemberTotal assets
£m
Favourable changes
£m
Unfavourable changes
£mTotal assets
£m
Favourable changes
£m
Unfavourable changes
£m
Trading portfolio assets Other US sub-prime whole loans and real estate 528 75 (43) 641 112 (92)Other US sub-prime securities 372 53 (31) 306 54 (44)Alt-A 1,399 198 (115) 1,234 216 (178)Other trading portfolio assets 308 5 (4) 122 6 (3)Fair value of underlying assets wrapped by monoline insurers 2,780 166 (162) 2,213 227 (446)Derivative financial assets Monoline protection – – – 2,038 209 (411)Total 5,387 497 (355) 6,554 824 (1,174)
The effect of stressing the unobservable assumptions to a range of reasonably possible alternatives would be to increase the fair values by up to £0.5bn (2009: £0.8bn) or to decrease the fair values by up to £0.4bn (2009: £1.2bn) with all the potential effect impacting profit and loss.
The stresses applied take account of the nature of valuation techniques used, as well as the availability and reliability of observable proxy and historic data.
In all cases, an assessment is made to determine the suitability of available data. The sensitivity methodologies that are used to assess the Protium assets are described on pages 157 to 158 and are consistent with that of Barclays valuation control framework.
Analysis of Barclays Capital credit market exposures by asset class
As at 31st December
Tradingportfolioassets –
debt securities
£m
Financialassets
designatedat fair
value – equity
securities£m
Financialassets
designatedat fair
value – debt
securities£m
Financialassets
designatedat fair
value – L&A£m
Derivativefinancial
instruments£m
L&A tocustomers
£m
Availablefor sale
debt securities
£m
Otherassets
£m
2010Total
£m
2009Total
£m
ABS CDO Super Senior – – – – – 1,992 – – 1,992 1,931 Other US Sub-prime and Alt-A – – – – 250 5 407 – 662 894 Monoline Protection on US RMBS – – – – – – – – – 6 Commercial Real Estate Loans and Property – 743 – 4,712 – – – 1,651 7,106 7,734 CMBS 154 – – – (35) – – – 119 218 Monoline Protection on CMBS – – – – 12 – – – 12 30 Leveraged Financea – – – – – 4,666 – – 4,666 5,250 SIVs, SIV-lites and CDPCs – – 345 – 54 – – – 399 553 Monoline Protection on CLO and Other – – – – 1,641 – – – 1,641 2,126 Loan to Protium Finance LP – – – – – 7,028 – – 7,028 7,859 Total exposures 154 743 345 4,712 1,922 13,691 407 1,651 23,625 26,601
Notea Undrawn commitments of £264m (2009: £257m) are off-balance sheet and therefore not
included in the table above.
Barclays Bank PLC Annual Report 2010 www.barclays.com/annualreport10 45

Risk managementCredit risk management continued
Exposures to Selected Eurozone and Other CountriesThe tables below show the Group’s exposures to selected countries (Spain, Italy, Portugal and Ireland), representing Eurozone countries that have a credit rating of AA or below from Standard and Poor’s and where the Group has an exposure of over £0.5bn.
The Group’s exposure to Greece, which has a sovereign credit rating of BB+, was below £0.5bn. The Group’s balance sheet exposure to Egypt was approximately £2bn, a significant proportion of which represented available for sale assets held in Treasury bills with a maturity less than one year. In addition, contingent liabilities and commitments included less than £1bn relating to Barclays Africa trade finance business in Egypt.
The balances included in the tables below represent the Group’s exposure to retail customers and wholesale customers (comprising corporates and sovereigns) in each of the respective countries.
Assets are stated gross of any trading liability positions and before any risk mitigation but net of impairment allowances and of derivative counterparty netting and collateral held.
Retail exposures As at 31st December 2010 As at 30th June 2010
Loans andadvances at
amortisedcost£m
Contingentliabilities and commitments
£m
Loans andadvances at
amortisedcost£m
Contingentliabilities and
commitments£m
Spain 19,053 1,306 18,124 1,805 Italy 16,324 1,004 14,239 945 Portugal 5,813 1,384 4,978 1,162 Ireland 77 9 142 19
Retail exposures mainly related to our domestic lending in Spain, Italy and Portugal, principally residential mortgages. The credit quality of our mortgage lending in Spain and Italy reflects low LTV lending, with average mark to market LTVs at 31st December 2010 in Spain of 58% and in Italy of 45%. Credit risk loan balances in Spain and Italy increased by 22% to £832m and 15% to £553m, respectively.
Wholesale exposures Loans and advances at amortised cost Assets held at fair value
Total£m
Of whichGovernment
£mTotal
£m
Of whichGovernment
£m
Contingentliabilities and
commitments£m
As at 31st December 2010Spain 6,574 86 8,625 6,665 2,550 Italy 3,180 – 9,258 7,382 2,622 Portugal 2,706 7 2,495 1,207 1,739 Ireland 3,069 – 3,320 452 1,422
As at 30th June 2010Spain 7,167 133 8,731 6,403 3,182Italy 3,159 – 10,466 8,606 1,546Portugal 2,405 19 2,408 1,177 1,543Ireland 3,324 – 3,160 328 1,482
Wholesale exposures relating to Barclays Capital and Barclays Corporate activities in Spain, Italy, Portugal and Ireland cover a broad range of SME, corporate and investment banking activities, as well as Western Europe treasury operations’ holdings of sovereign and corporate bonds in those countries. Loans and advances include exposures at 31st December 2010 to the property and construction industry in Spain of £2,951m, in Portugal of £937m, in Ireland of £195m and in Italy of £71m.
Assets held at fair value primarily comprise trading portfolio assets, which are highly liquid in nature, available for sale positions in investment grade debt securities, and derivatives.
46 Barclays Bank PLC Annual Report 2010 www.barclays.com/annualreport10

Risk managementMarket risk management
All disclosures in this section (pages 47 to 52) are unaudited unless otherwise indicated.
Market Risk is the risk that Barclays earnings or capital, or its ability to meet business objectives, will be adversely affected by changes in the level or volatility of market rates or prices such as interest rates, credit spreads, commodity prices, equity prices and foreign exchange rates.
Overview (audited)The main sources of risk are traded market risk, non-traded interest rate risk, translational foreign exchange risk and pension risk. Traded risk resides primarily in Barclays Capital while non-traded market risk resides mainly in Global Retail Banking, Barclays Corporate, Barclays Wealth and Group Treasury. Translational foreign exchange risk is managed by Group Treasury. Pension risk is managed centrally with the cost borne by respective businesses.
Barclays market risk objectives are to:
– understand and control market risk by robust measurement and the setting of limits;
– facilitate business growth within a controlled and transparent risk management framework;
– ensure traded market risk resides primarily in Barclays Capital; and
– minimise non-traded market risk.
Organisation and structureThe Board approves market risk appetite for trading and non-trading activities. The Group Market Risk Director is responsible for the Barclays Market Risk Control Framework and, under delegated authority from the Chief Risk Officer, sets a limit framework within the context of the approved market risk appetite. A daily market risk report summarises Barclays market risk exposures against agreed limits. This daily report is sent to the Chief Risk Officer, the Group Market Risk Director, the Group Finance Director and the appropriate Business Risk Directors.
Market Risk Committee approves, and makes recommendations concerning the market risk profile across Barclays. This includes approving Barclays Market Risk Control Framework and Group Policies; reviewing current and forward issues, limits and utilisation; and proposing risk appetite levels for the Board. The Committee is chaired by the Group Market Risk Director and attendees include the Chief Risk Officer, respective business risk managers and senior managers from Group Market Risk.
The head of each business, assisted by the business market risk management team, is accountable for all market risks associated with its activities. The head of each business market risk team is responsible for implementing the Barclays Market Risk Control Framework which sets out how market risk should be identified, measured, controlled, reported and reviewed. The Framework also outlines and references Group market risk policies.
Market risk oversight and challenge is provided by business committees, Group Committees including Market Risk Committee and the Group Market Risk team.
Traded market risk (audited)Traded market risk is predominantly the result of client facilitation in wholesale markets. This involves market making, offering hedge solutions, pre-hedging and assisting clients to execute large trades. Not all client trades are hedged completely, giving rise to market risk. In Barclays Capital, trading risk is measured for the trading book, as defined for regulatory purposes, and certain banking books. Barclays policy is to concentrate trading activities in Barclays Capital.
Risk MeasurementBarclays uses a range of complementary technical approaches to measure and control traded market risk including: Daily Value at Risk (DVaR), Expected Shortfall, 3W, Primary and Secondary risk factor stress testing and Combined scenario stress testing.
DVaR is an estimate of the potential loss arising from unfavourable market movements, if the current positions were to be held unchanged for one business day. Barclays Capital uses the historical simulation methodology with a two-year equally weighted historical period, at the 95% confidence level.
The historical simulation methodology can be split into three parts:
– Calculate hypothetical daily profit or loss for each position over the most recent two years, using observed daily market moves;
– Sum all hypothetical profits or losses for day one across all positions, giving one total profit or loss. Repeat for all other days in the two-year history; and
– DVaR is the 95th percentile selected from the two-year history of daily hypothetical total profit or loss.
Market volatility in 2010 was impacted by concerns over future economic growth and the sovereign debt crisis, but remained below the high levels observed in 2008. During 2010, the high volatility observations of 2008 rolled out of the two year DVaR historical data set and were replaced in the data time series by less volatile 2010 observations.
Barclays Capital’s DVaR model has been approved by the FSA to calculate regulatory capital for certain trading book portfolios. The approval covers general market risk in interest rate, foreign exchange, commodities and equity products, and issuer specific risk for the majority of single name and portfolio traded credit products. For internal management purposes DVaR is also calculated for certain banking books as well as trading book portfolios.
Barclays Bank PLC Annual Report 2010 www.barclays.com/annualreport10 47

Risk managementMarket risk management continued
Traded market risk continued (audited)The FSA categorises a DVaR model as green, amber or red. A green model is consistent with a good working DVaR model and is achieved for models that have four or less back-testing exceptions in a 12-month period. Back-testing counts the number of days when a loss (as defined by the FSA) exceeds the corresponding DVaR estimate, measured at the 99% confidence level. For Barclays Capital’s DVaR model, green model status was maintained for 2010 and 2009.
The DVaR model is regularly assessed and reviewed internally by the Group Executive Models Committee and the Barclays Capital Model Committee.
When reviewing DVaR estimates, a number of considerations should be taken into account. These are:
– Historical simulation uses the most recent two years of past data to generate possible future market moves but the past may not be a good indicator of the future;
– The one-day time horizon does not fully capture the market risk of positions that cannot be closed out or hedged within one day;
– DVaR is based on positions as at close of business and consequently intra-day risk, the risk from a position bought and sold on the same day, is not captured; and
– DVaR does not indicate the potential loss beyond the 95th percentile.
In part due to the points above, and in part due to the desire to measure risk beyond DVaR, Barclays uses additional metrics. These include Expected Shortfall, 3W, Primary risk factor stress testing, Secondary risk factor stress testing and Combined scenario stress testing.
Both Expected Shortfall and 3W metrics use the same two-year historical simulation data set as used to calculate DVaR. Expected Shortfall is the average of all one day hypothetical losses beyond the 95% confidence level DVaR while 3W is the average of the three largest one day estimated losses.
Stress testing provides an estimate of potential significant future losses that might arise from extreme market moves or scenarios. Primary stress testing applies stress moves to key liquid risk factors for each of the major trading asset classes including interest rate, credit spread, commodity, equity and foreign exchange. Secondary stress testing applies stress moves to less liquid risks such as option volatility skew. Combined scenario stress testing applies simultaneous shocks to several risk factors, reflecting a defined extraordinary, but plausible scenario e.g. what is the estimated impact on profits of a fixed exchange rate becoming floating. This is assessed by applying respective changes on foreign exchange rates, interest rates, credit spreads and equities to the portfolio.
Risk ControlMarket Risk is controlled through the use of limits, where appropriate, on the above risk measures. Limits are set at the total Barclays Capital level, risk factor level e.g. interest rate risk, and business line level e.g. Emerging Markets. Stress limits and many book limits, such as foreign exchange and interest rate sensitivity limits, are also in place.
The total DVaR limit, risk factor DVaR limits, and 3W limit are approved by the Board Risk Committee. Primary stress limits are approved by the Chief Risk Officer and are tabled for noting by the Board Risk Committee. Compliance with limits is monitored by Barclays Capital’s Market Risk team with oversight provided by Group Market Risk.
In 2010, to further improve the application of the market risk control framework, Group Market Risk initiated an ongoing programme of conformance visits to Barclays Capital business areas. These visits review both the current market risk profile and potential market risk developments, as well as verifying conformance with Barclays Market Risk Control Framework.
The oversight and governance of Barclays Capital’s market risk models was also improved in 2010. This included making the model committee more granular by having two distinct committees, one specifically for model methodology and the other specifically for data integrity and infrastructure. Group Market Risk is a member of both these committees.
Risk ReportingBarclays Capital Market Risk team produce a number of detailed and summary market risk reports daily, weekly, fortnightly and monthly. These include, new for 2010, the Executive Key Risk Report (daily) and the Senior Management Significant Risk Pack (monthly). These reports summarise the positions, risks and top stresses covering interest rate, credit spread, commodity, equity and foreign exchange. Barclays Capital market risk reports are sent to Group Market Risk for review and inclusion in the Group Daily Market Risk Report.
Analysis of traded market risk exposures (audited)The trading environment in 2010 was characterised by weak underlying economic growth as well as unclear market direction resulting in lower client activity. In this environment, Barclays Capital’s market risk exposure, as measured by average total DVaR, decreased by 31% to £53m (2009: £77m). The reduction was due to a fall in exposures reflecting the lower client activity, increased diversification, and the rolling off of the 2008 highly volatile historical data points.
The two main risk factors with material DVaR were credit spread and interest rate. The average DVaR for each of these decreased by £10m (17%) and £11m (25%) respectively. Total DVaR as at 31st December 2010 was £48m (2009: £55m).
Expected Shortfall and 3W in 2010 averaged £78m and £144m respectively representing decreases of £43m (36%) and £65m (31%) compared to 2009.
As we enter 2011, the principal uncertainties which may impact Barclays market risk relate to volatility in interest rates, commodities, credit spreads, equity prices and foreign exchange rates. Price instability and higher volatility may arise as government policy targets future economic growth against a background of fiscal pressures, accommodatory monetary policy and exogenous economic events.
48 Barclays Bank PLC Annual Report 2010 www.barclays.com/annualreport10

The daily average, maximum and minimum values of DVaR, Expected Shortfall and 3W were calculated as below.
The daily average, maximum and minimum values of DVaR, Expected Shortfall and 3W (audited) Year ended 31st December 2010 Year ended 31st December 2009
DVaR (95%)Average
£mHigha
£mLowa
£mAverage
£mHigha
£mLowa
£m
Interest rate risk 33 50 21 44 83 23Credit Spread risk 48 62 30 58 102 35Commodity risk 16 25 9 14 20 11Equity risk 14 29 6 13 27 5Foreign exchange risk 6 15 2 8 15 3Diversification effect (64) n/a n/a (60) n/a n/aTotal DVaR 53 75 36 77 119 50Expected Shortfall 78 147 47 121 188 883W 144 311 72 209 301 148
The BankBarclays Capital’s market risk exposure, as measured by average total DVaR of 95%, decreased by 32% to £52m (2009: £76m). The high for the year was £74m (2009: £118m) and the low for the year was £35m (2009: £49m).
Non-traded interest rate risk (audited)Non-traded interest rate risk arises from the provision of retail and wholesale (non-traded) banking products and services, when the interest rate repricing date for loans (assets) is different to the repricing date for deposits (liabilities). This includes current accounts and equity balances which do not have a defined maturity date and an interest rate that does change when the base rate changes. The risk resides mainly in Global Retail Banking, Barclays Corporate, Barclays Wealth and Group Treasury.
Barclays objective is to minimise non-traded interest rate risk and this is achieved by transferring interest rate risk from the business to a local treasury or Group Treasury, which in turn hedges the net exposure with the external market. Limits exist to ensure no material risk is retained within any business or product area.
Risk measurementThe risk in each business is measured and controlled using both an income metric (Annual Earnings at Risk) and a present value metric (Economic Value of Equity, Economic Capital, Daily Value at Risk, risk factor stress testing, scenario stress testing).
Annual Earnings at Risk (AEaR) measures the sensitivity of net interest income over the next 12 months. It is calculated as the difference between the estimated income using the current yield curve and the lowest estimated income following a 100 basis points increase or decrease in interest rates, subject to a minimum interest rate of 0%.
The main model assumptions are:
– The balance sheet is kept at the current level i.e. no growth is assumed; and
– Balances are adjusted for an assumed behavioural profile. This includes the treatment of fixed rate loans including mortgages.
Economic Value of Equity (EVE) calculates the change in the present value of the banking book for a 100 basis point upward and downward rate shock. This calculation is equivalent to that of AEaR except Economic Value of Equity is a present value sensitivity while AEaR is an income sensitivity.
Economic Capital (EC) consistent models are used to measure: recruitment risk, the risk from customers not taking up their fixed rate loan offer; and prepayment risk, the risk of a customer deciding not to carry on with their fixed rate loan. Behavioural profiles are also used when modelling the balance sheet.
Daily Value at Risk (DVaR) and risk factor stress testing methodologies are consistent with those used by Barclays Capital. DVaR and stress are used by Treasuries that operate within liquid currencies such as Sterling, US Dollar and Euros while for Treasuries that operate in less liquid currencies, stress risk is the only present value metric used.
Risk ControlMarket Risk is controlled through the use of limits on the above risk measures. Limits are set at the total business level and then cascaded down. The total business level limits for AEaR, EVE, EC, DVaR and stress are agreed by Market Risk Committee. In 2010, a range of formal present value limits was extended to include stress and EVE limits. Compliance with limits is monitored by the respective business market risk team with oversight provided by Group Market Risk.
Market Risk is also controlled through an ongoing programme of conformance visits by both the business market risk departments and Group Market Risk. These visits review both the current market risk profile and potential market risk developments, as well as verifying conformance with Barclays policies and standards as detailed in the Barclays Market Risk Control Framework.
Notea The high (and low) DVaR figures reported for each category did not necessarily occur on
the same day as the high (and low) DVaR reported as a whole. Consequently a diversification effect number for the high (and low) DVaR figures would not be meaningful and it is therefore omitted from the above table.
Barclays Bank PLC Annual Report 2010 www.barclays.com/annualreport10 49

Risk managementMarket risk management continued
The interest rate risk for balances with no defined maturity date and an interest rate that is not linked to the base rate is managed by Group Treasury. A series of continuous equity and product structural hedges is used to mitigate the interest rate risk.
Risk Reporting (audited)Each business area is responsible for their respective market risk reports. A combination of daily and monthly risk reports are produced and used by the business. These are also sent to Group Market Risk for review and inclusion in the Group daily market risk report. A risk summary is also presented at Market Risk Committee and respective Asset and Liability Committees.
Analysis of Net Interest Income sensitivityThe table below shows the pre-tax net interest income for the non-trading financial assets and financial liabilities held at 31st December 2010 and 31st December 2009. The sensitivity has been measured using the AEaR methodology as described above. The benchmark interest rate for each currency is set as at 31st December 2010. The figures include the effect of hedging instruments but exclude banking book exposures held or issued by Barclays Capital as these are measured and managed using DVaR.
Net Interest Income Sensitivity (AEaR) by currency (audited) 31st December 2010 31st December 2009
The Group
+100 basispoints
£m
-100 basispoints
£m
+100 basispoints
£m
-100 basispoints
£m
GBP 297 (377) 30 (360)USD (12) (8) (43) 14 EUR (16) 12 (34) – ZAR 13 (10) 29 (27)Others – – (1) 4 Total 282 (383) (19) (369)As percentage of net interest income 2.25% (3.06%) (0.16%) (3.16%)
Non-traded interest rate risk, as measured by AEaR, was £383m as at 31st December 2010, an increase of of £14m compared to 31st December 2009. The 2010 and 2009 AEaR estimates both reflect the reduced spread generated on retail and commercial banking liabilities associated with a lower interest rate environment. If the interest rate hedges had not been in place then the AEaR for 2010 would have been £601m (2009: £704m).
DVaR is also used to control market risk in Western Europe Retail Banking and in Group Treasury. The indicative average 2010 DVaRs were £1.6m (2009: £1.4m) for Western Europe and £0.7m (2009: £1.0m) for Group Treasury.
Net Interest Income Sensitivity (AEaR) by currency (audited) 31st December 2010 31st December 2009
The Bank
+100 basispoints
£m
-100 basispoints
£m
+100 basispoints
£m
-100 basispoints
£m
GBP 172 (219) 16 (186)USD (7) (5) (22) 7 EUR (9) 7 (18) – ZAR 8 (6) 15 (14)Others – – (1) 2 Total 164 (223) (10) (191)As percentage of net interest income 2.25% (3.06%) (0.16%) (3.10%)
Note: This table excludes exposures held or issued by Barclays Capital as these are measured and managed using DVaR.
50 Barclays Bank PLC Annual Report 2010 www.barclays.com/annualreport10

Analysis of Equity sensitivity (audited)
Analysis of equity sensitivity (audited) 31st December 2010 31st December 2009
The Group
+100 basispoints
£m
-100 basispoints
£m
+100 basispoints
£m
-100 basispoints
£m
Net Interest Income 282 (383) (19) (369)Taxation effects on the above (70) 96 4 85 Effect on profit for the year 212 (287) (15) (284)As percentage of net profit after tax 4.65% (6.29%) (0.15%) (2.76%) Effect on profit for the year (per above) 212 (287) (15) (284)Available for sale reserve (2,051) 2,051 (527) 527 Cash flow hedge reserve (1,298) 1,288 (929) 957 Taxation effects on the above 835 (833) 335 (341)Effect on equity (2,302) 2,219 (1,136) 859 As percentage of equity (3.67%) 3.54% (1.94%) 1.46%
Analysis of equity sensitivity (audited) 31st December 2010 31st December 2009
The Bank
+100 basispoints
£m
-100 basispoints
£m
+100 basispoints
£m
-100 basispoints
£m
Net Interest Income 164 (223) (10) (191)Taxation effects on the above 19 (26) – (4)Effect on profit for the year 183 (249) (10) (195)As percentage of net profit after tax 7.27% (9.89%) (0.10%) (1.91%) Effect on profit for the year (per above) 183 (249) (10) (195)Available for sale reserve (1,865) 1,865 (334) 334 Cash flow hedge reserve (1,136) 1,126 (798) 826 Taxation effects on the above (356) 355 (24) 25 Effect on equity (3,174) 3,097 (1,166) 990 As percentage of equity (6.34%) 6.19% (2.44%) 2.07%
Foreign exchange risk (audited)The Group is exposed to two sources of foreign exchange risk.
a) Transactional foreign currency exposure Transactional foreign exchange exposures represent exposure on banking assets and liabilities, denominated in currencies other than the functional currency of the transacting entity.
The Group’s risk management policies prevent the holding of significant open positions in foreign currencies outside the trading portfolio managed by Barclays Capital which is monitored through DVaR.
There were no material net transactional foreign currency exposures outside the trading portfolio at either 31st December 2010 or 2009. Due to the low level of non-trading exposures no reasonably possible change in foreign exchange rates would have a material effect on either the Group’s profit or movements in equity for the year ended 31st December 2010 or 2009.
b) Translational foreign exchange exposureThe Group’s translational foreign currency exposure arises from both its capital resources (including investments in subsidiaries and branches, intangible assets, non-controlling interests, deductions from capital and debt capital instruments) and risk weighted assets (RWAs) being denominated in foreign currencies. Changes in foreign exchange rates result in changes in the Sterling equivalent value of foreign currency denominated capital resources and risk weighted assets. As a result, the Group’s regulatory capital ratios are sensitive to foreign exchange rate movements.
The Group’s capital ratio hedge strategy is to minimise the volatility of the capital ratios caused by foreign exchange rate movements. To achieve this, the Group aims to maintain the ratio of foreign currency Core Tier 1, Tier 1 and Total Capital resources to foreign currency RWAs the same as the Group’s capital ratios.
Barclays Bank PLC Annual Report 2010 www.barclays.com/annualreport10 51

Risk managementMarket risk management continued
The Group’s investments in foreign currency subsidiaries and branches create capital resources denominated in foreign currencies. Changes in the Sterling value of the investments due to foreign currency movements are captured in the currency translation reserve, resulting in a movement in Core Tier 1 capital.
During 2010, structural currency exposures net of hedging instruments increased from £12.5bn to £15.3bn as a result of hedging decisions taken in accordance with the Group’s capital ratio management strategy for foreign exchange rate movements.
To create foreign currency Tier 1 and Total Capital resources additional to the Core Tier 1 capital resources, the Group issues, where possible, debt capital in non-Sterling currencies. This is primarily achieved by the issuance of debt capital from Barclays Bank PLC, but can also be achieved by subsidiaries issuing capital in local currencies.
The carrying value of the Group’s foreign currency net investments in subsidiaries and branches and the foreign currency borrowings and derivatives used to hedge them as at 31st December 2010 were as follows:
Functional currency of the operation involved (audited)Foreign
currencynet
investments£m
Borrowingswhich hedge
the netinvestments
£m
Derivativeswhich hedge
the netinvestments
£m
Structuralcurrency
exposurespre economic
hedges£m
Economichedges
£m
Remainingstructuralcurrency
exposures£m
As at 31st December 2010US Dollar 22,646 7,406 – 15,240 6,330 8,910Euro 7,327 3,072 1,294 2,961 2,069 892Rand 4,826 – 1,626 3,200 – 3,200Japanese Yen 5,304 3,603 1,683 18 – 18Swiss Franc 152 – 157 (5) – (5)Other 3,139 – 824 2,315 – 2,315Total 43,394 14,081 5,584 23,729 8,399 15,330
As at 31st December 2009US Dollar 16,677 3,205 – 13,472 6,056 7,416Euro 6,772 3,418 – 3,354 2,902 452Rand 4,055 – 1,542 2,513 189 2,324Japanese Yen 4,436 3,484 940 12 – 12Swiss Franc 2,840 2,734 92 14 – 14Other 2,983 – 677 2,306 – 2,306Total 37,763 12,841 3,251 21,671 9,147 12,524
The economic hedges primarily represent the US Dollar and Euro Preference Shares and Reserve Capital Instruments in issue that are treated as equity under IFRS, and do not qualify as hedges for accounting purposes. During the year €850m Reserves Capital Instruments were redeemed.
The impact of a change in the exchange rate between Sterling and any of the major currencies would be:
– a higher or lower Sterling equivalent value of non-Sterling denominated capital resources and risk weighted assets. This includes a higher or lower currency translation reserve within equity, representing the retranslation of non-Sterling subsidiaries, branches and associated undertakings net of the impact of foreign exchange rate changes on derivatives and borrowings designated as hedges of net investments;
– a higher or lower profit after tax, arising from changes in the exchange rates used to translate items in the consolidated income statement; and
– a higher or lower value of available for sale investments denominated in foreign currencies, impacting the available for sale reserve.
52 Barclays Bank PLC Annual Report 2010 www.barclays.com/annualreport10

Risk managementCapital management
All disclosures in this section (page 53) are unaudited unless otherwise indicated.
Overview (audited)Barclays operates a centralised capital management model, considering both regulatory and economic capital. The Group’s capital management objectives are to maintain sufficient capital resources to:
– ensure the financial holding company is well capitalised relative to the minimum regulatory capital requirements set by the UK FSA and the US Federal Reserve;
– ensure locally regulated subsidiaries can meet their minimum regulatory capital requirements;
– support the Group’s Risk Appetite and Economic Capital requirements; and
– support the Group’s credit rating.
Capital is allocated to businesses to support the Group’s strategic objectives, including optimising returns on regulatory and economic capital.
The Group Treasury Committee manages compliance with the Group’s capital management objectives. The Committee reviews actual and forecast capital demand and resources on a monthly basis. The processes in place for delivering the Group’s capital management objectives are to:
– establishment of internal targets for capital demand and ratios;
– manage capital ratio sensitivity to foreign exchange movement; and
– manage local entity regulatory capital adequacy.
External regulatory capital requirements (audited)The Group is subject to minimum capital requirements imposed by the Financial Services Authority (FSA), following guidelines developed by the Basel Committee on Banking Supervision (the Basel Committee) and implemented in the UK via European Union Directives.
Under Basel II, effective from 1st January 2008, the Group has approval by the FSA to use the advanced approaches to credit and operational risk management. Pillar 1 capital requirements are generated using the Group’s risk models.
Under Pillar 2 of Basel II, the Group is subject to an overall regulatory capital requirement based on individual capital guidance (‘ICG’) received from the FSA. The ICG imposes additional capital requirements in excess of Pillar 1 minimum capital.
Outside the UK, the Group has operations (and main regulators) located in continental Europe, in particular France, Germany, Spain, Portugal and Italy (local central banks and other regulatory authorities); Asia Pacific (various regulatory authorities including the Hong Kong Monetary Authority, the Japanese FSA and the Monetary Authority of Singapore); Africa, where the Group’s operations are headquartered in Johannesburg, South Africa (The South African Reserve Bank and the Financial Services Board (FSB)) and the United States of America (the Board of Governors of the Federal Reserve System (FRB) and the Securities and Exchange Commission).
Local entity regulatory capital adequacyThe Group manages its capital resources to ensure that those Group entities that are subject to local capital adequacy regulation in individual countries meet their minimum capital requirements. The current policy of the Group is that the local capital requirements are met, to the greatest possible extent, through the retention of profit. Certain countries also operate exchange control regulations which limit the amount of dividends that can be remitted to non-resident shareholders. Local management manages compliance with subsidiary entity minimum regulatory capital requirements with reporting to local Asset and Liability Committees and to Treasury Committee, as required.
Injections of capital resources into Group entities are centrally controlled by the Group Treasury Committee, under authorities delegated from the Group Executive Committee. The Group’s policy is for surplus capital held in Group entities to be repatriated to Barclays Bank PLC in the form of dividends and/or capital repatriation, subject to local regulatory requirements, exchange controls and tax implications.
Other than as indicated above, the Group is not aware of any material impediments to the prompt transfer of capital resources or repayment of intra-group liabilities when due.
Regulatory capitalThe table below provides details of the regulatory capital resources managed by the Group.
Regulatory capital summary (audited) Basel II2010
£m
Basel II2009
£m
Total qualifying Tier 1 capital 53,729 49,722Total qualifying Tier 2 capital 15,823 14,620Total deductions (2,250) (880)Total net capital resources 67,302 63,462
Barclays Bank PLC Annual Report 2010 www.barclays.com/annualreport10 53

Risk managementLiquidity risk management
All disclosures in this section (pages 54 to 62) are unaudited unless otherwise indicated.
Liquidity risk is the risk that the Group is unable to meet its obligations when they fall due as a result of a sudden, and potentially protracted, increase in net cash outflows. Such outflows would deplete available cash resources for client lending, trading activities, investments and deposits. In extreme circumstances lack of liquidity could result in reductions in balance sheet and sales of assets, or potentially an inability to fulfil lending commitments. The risk that it will be unable to do so is inherent in all banking operations and can be affected by a range of institution-specific and market-wide events.
Organisation and structure (audited)Barclays Treasury operates a centralised governance and control process that covers all of the Group’s liquidity risk management activities. Businesses assist Barclays Treasury in policy formation and limit setting by providing relevant and expert input for their local markets and customers.
Execution of the Group’s liquidity risk management strategy is carried out at country level within agreed policies, controls and limits, with the Country Treasurer providing reports directly to Barclays Treasury to evidence conformance with the agreed risk profile. Liquidity risk is a standing agenda item at Country and Cluster Asset and Liability Committees and on a consolidated basis is reported to the Group’s Treasury Committee.
The objective of the Group’s liquidity risk management strategy is to ensure that the funding profile of individual businesses and the Group as a whole is appropriate to underlying market conditions and the profile of our business in each given country. Liquidity risk limits and controls are flexed to achieve that profile and are based on regular qualitative and quantitative assessments of conditions under both normal and stressed conditions. Businesses are only allowed to have funding exposure to wholesale markets where they can demonstrate that their market is sufficiently deep and liquid and then only relative to the size and complexity of their business.
Liquidity limits reflect both local regulatory requirements as well as the behavioural characteristics of their balance sheets. Breaches of limits are reported to Treasury Committee together with details of the requirements to return to compliance.
Liquidity risk framework (audited)Barclays has a comprehensive Liquidity Risk Management Framework (the Liquidity Framework) for managing the Group’s liquidity risk. The objective of the Liquidity Framework is for the Group to have sufficient liquidity to continue to operate for at least the minimum period specified by the FSA in the event that the wholesale funding markets are neither open to Barclays nor to the market as a whole. Stress tests applied under the Liquidity Framework consider a range of possible wholesale and retail factors leading to loss of financing including:
– Maturing of wholesale liabilities;
– Loss of secured financing and widened haircuts on remaining book;
– Retail and commercial outflows from savings and deposit accounts;
– Drawdown of loans and commitments;
– Potential impact of a 2 notch ratings downgrade; and
– Withdrawal of initial margin amounts by counterparties.
These stressed scenarios are used to assess the appropriate level for the Group’s liquidity pool, which comprises unencumbered assets and central bank deposits. Barclays regularly uses these assets to access secured funding markets, thereby testing the liquidity assumptions underlying pool composition. The Group does not presume the availability of central bank borrowing facilities to monetise the liquidity pool in any of the stress scenarios under the Liquidity Framework.
Liquidity pool (audited)The Group liquidity pool as at 31st December 2010 was £154bn gross (2009: £127bn) and comprised the following cash and unencumbered assets (of which £140bn are FSA eligible). The Group maintains additional liquid assets to support ongoing business requirements such as payment services. The cost of the Group liquidity pool for 2010 has been allocated on the basis of the projected stress outflows arising in each relevant business.
Composition of the Group liquidity poolCash and
deposits with central banks
£bn
Government guaranteed
bonds£bn
Governments and
supranational bonds
£bn
Other available liquidity
£bnTotal£bn
As at 31st December 2010 96 1 46 11 154As at 31st December 2009 81 3 31 12 127
54 Barclays Bank PLC Annual Report 2010 www.barclays.com/annualreport10

Liquidity regulationSince June 2010, the Group has reported its liquidity position against backstop Individual Liquidity Guidance (ILG) provided by the FSA. Calibration of the Group’s Liquidity Framework anticipated final FSA rules and is therefore broadly consistent with current FSA standards.
The Basel Committee of Banking Supervisors (BCBS) issued its final guidelines for liquidity risk management, standards and monitoring in December 2010. These guidelines include a short term liquidity stress metric (the Liquidity Coverage Ratio (LCR)) and a longer term liquidity metric (the Net Stable Funding Ratio (NSFR)). The BCBS guidelines have yet to be implemented into European and UK law and therefore remain subject to refinement and change.
However, the Group monitors compliance against these BCBS metrics and the FSA is expected to bring its ILG metrics into line with the Basel LCR over time. Applying the expected BCBS guidelines to the Group’s liquidity position as at 31st December 2010, the relevant ratios were estimated at 80% of the LCR requirement and 94% of the NSFR requirement.
Term financing (audited)The Group continues to attract deposits in unsecured money markets and to raise additional secured and unsecured term funding in a variety of markets. As at 31st December 2009, the Group had £15bn of publicly issued term debt maturing during 2010. The corresponding figure for 2011 is £25bn. During 2010, the Group issued approximately £35bn of term funding, comprising:
– £8bn equivalent of public senior term funding;
– £4bn equivalent of public covered bonds/ABS;
– £2bn equivalent of public subordinated debt; and
– £21bn equivalent of structured notes.
This £35bn of term funding refinanced the 2010 requirement, both maturities and early repayments, as well as pre-financed some of the 2011 and 2012 maturities. Additional term funding raised in 2011 will support balance sheet growth, further extension of liability maturities and strengthening of our liquidity position.
The Group liquidity pool is sufficient to cover more than one year of wholesale maturities.
Funding structure (audited)Global Retail Banking, Barclays Corporate, Barclays Wealth and Head Office Functions are structured to be self-funded through customer deposits, Barclays equity and other long term funding. Barclays Capital and, in part, Absa are funded through the wholesale secured and unsecured funding markets.
The loan to deposit and long term funding ratio improved to 77% at 31st December 2010 (2009: 81%). The loan to deposit ratio also improved to 124% at 31st December 2010 (2009: 130%).
Global Retail Banking, Barclays Corporate, Barclays Wealth and Head Office functions (audited)An important source of structural liquidity is provided by our core retail deposits in the UK, Europe and Africa; mainly current accounts and savings accounts. Although, contractually, current accounts are repayable on demand and savings accounts at short notice, the Group’s broad base of customers – numerically and by depositor type – helps to protect against unexpected fluctuations. Such accounts form a stable funding base for the Group’s operations and liquidity needs.
The Global Retail Banking, Barclays Corporate, Barclays Wealth businesses, together with Head Office functions, do not rely on short term wholesale funding. Rather, these businesses are funded through a combination of customer deposits and long term debt and equity.
In order to assess the funding requirement for these businesses, the balance sheet is modelled to reflect behavioural experience in both assets and liabilities. The maturity profile, excluding Absa, resulting from this behavioural modelling is set out below. As at 31st December 2010, behavioural modelling showed that expected repayments on assets are larger than the roll off of liabilities resulting in cash inflows for each of the first five years. Maturities of net liabilities are, therefore, behaviourally expected to occur after 5 years.
Barclays Bank PLC Annual Report 2010 www.barclays.com/annualreport10 55

Risk managementLiquidity risk management continued
Behavioural maturity profile of assets and liabilities (audited)Cash inflow/(outflow)
Fundingsurplus
£bn
Notmore
than 1 yra
£bn
Over1 yr but
not morethan2 yrs£bn
Over2 yrs butnot more
than3 yrs£bn
Over3 yrs butnot more
than4 yrs£bn
Over4 yrs butnot more
than5 yrs£bn
Over5 yrs£bn
As at 31st December 2010 89.9 4.7 17.7 30.1 10.4 2.2 (155.0)As at 31st December 2009 94.5 (10.2) 17.8 21.2 7.8 1.8 (132.9)
Included within the ‘Not More Than 1 yr’ time bucket in the above analysis are £18.9bn of Group liquidity pool assets. These assets have a contractual maturity of greater than 1 year. However, they could be used to generate short-term cash flows, either through the sale or secured funding and so the balance has been classified as generating cash flow inflows within 1 year.
Barclays Capital (audited)Barclays Capital manages its liquidity to be primarily funded through wholesale markets, generating sufficient liquidity to ensure that potential cash outflows in a stressed environment are covered. Much of the short term funding is invested in highly liquid assets and central bank cash and therefore contributes towards the Group liquidity pool.
Barclays Capital undertakes secured funding in the repo markets based on liquidity characteristics. 66% (2009: 73%) of the inventory is funded on a secured basis. Limits are in place for each security asset class reflecting liquidity in the cash and financing markets for these assets. The percentage of secured funding using each asset class as collateral is set out below:
Secured funding by asset class (audited) Govt%
Agency%
MBS%
ABS%
Corporate%
Equity%
Other%
As at 31st December 2010 64 7 9 3 7 7 3As at 31st December 2009 59 7 7 6 10 8 3
Unsecured wholesale funding for the Group (excluding Absa) is managed by Barclays Capital within specific term limits. Excluding short term deposits that are placed within the Group liquidity pool, the term of unsecured liabilities has been extended, with average life improving from at least 26 months at 31st December 2009 to at least 30 months at 31st December 2010.
Absa (audited)Absa operates in a market with structural dependence on wholesale funding sources. This dependence is a function of customer behaviours in relation to savings in South Africa as a whole, where there is a higher concentration of cash in investment funds than in the bank savings. This structural shortfall relating to bank savings is transparent and carefully monitored.
Notea Includes £18.9bn of Group liquidity pool assets that have a contractual maturity of greater
than one year but can be used to generate short-term cash flows either through sale or secured lending.
56 Barclays Bank PLC Annual Report 2010 www.barclays.com/annualreport10

Contractual maturity of financial assets and liabilities (audited)Details of contractual maturities for assets and liabilities form an important source of information for the management of liquidity risk. Such information is used (amongst other things) as the basis for modelling a behavioural balance sheet, for input into the liquidity framework, as discussed above.
The table below provides detail on the contractual maturity of all financial instruments and other assets and liabilities. Derivatives (other than those designated in a hedging relationship) and trading portfolio assets and liabilities are included in the on demand column at their fair value. Liquidity risk on these items is not managed on the basis of contractual maturity since they are not held for settlement according to such maturity and will frequently be settled before contractual maturity at fair value. Derivatives designated in a hedging relationship are included according to their contractual maturity.
Financial assets designated at fair value in respect of linked liabilities to customers under investment contracts have been included in other assets and other liabilities as the Group is not exposed to liquidity risk arising from them; any request for funds from creditors would be met by simultaneously liquidating or transferring the related investment.
Contractual maturity of financial assets and liabilities (audited)
At 31st December 2010The Group
Ondemand
£m
Not morethan three
months£m
Over threemonths but
not morethan sixmonths
£m
Over sixmonths but
not morethan one
year£m
Over oneyear
but notmore than
three years£m
Over threeyears butnot morethan five
years£m
Over fiveyears butnot morethan ten
years£m
Over tenyears
£mTotal
£m
Assets Cash and balances at central banks 96,842 788 – – – – – – 97,630 Items in the course of collection from other banks 1,168 216 – – – – – – 1,384 Trading portfolio assets 168,930 – – – – – – – 168,930 Financial assets designated at fair value 789 5,678 1,110 2,773 7,411 3,745 2,461 16,089 40,056 Derivative financial instruments 418,587 114 20 96 488 444 396 174 420,319 Loans and advances to banks 5,698 26,462 1,858 946 2,260 5 111 459 37,799 Loans and advances to customers 48,222 60,908 9,553 16,079 53,374 44,324 65,809 129,673 427,942 Reverse repurchase agreements and other similar secured lending 114 192,423 7,366 5,089 390 124 238 28 205,772 Available for sale financial investments 297 7,589 2,979 5,851 15,053 10,007 12,127 11,537 65,440 Other financial assets – 2,040 – – 784 – – – 2,824 Total financial assets 740,647 296,218 22,886 30,834 79,760 58,649 81,142 157,960 1,468,096 Other assets 21,942 Total assets 1,490,038 Liabilities Deposits from banks 5,754 65,755 2,161 2,247 739 790 249 280 77,975 Items in the course of collection due to other banks 1,312 9 – – – – – – 1,321 Customer accounts 230,895 77,607 13,958 11,423 5,211 3,539 2,263 906 345,802 Repurchase agreements and other similar secured borrowing 907 216,454 4,358 2,755 739 256 59 6 225,534 Trading portfolio liabilities 72,693 – – – – – – – 72,693 Financial liabilities designated at fair value 1,237 17,866 6,191 6,963 21,453 18,446 13,553 10,073 95,782 Derivative financial instruments 403,163 303 72 101 390 927 286 274 405,516 Debt securities in issue 17 50,735 17,982 33,172 23,130 13,032 12,028 6,527 156,623 Subordinated liabilities – 835 – 218 2,094 475 9,499 15,378 28,499 Other financial liabilities – 4,295 – – 990 – – – 5,285 Total financial liabilities 715,978 433,859 44,722 56,879 54,746 37,465 37,937 33,444 1,415,030 Other liabilities 12,367 Total liabilities 1,427,397 Cumulative liquidity gap 24,669 (112,972) (134,808) (160,853) (135,839) (114,655) (71,450) 53,066 62,641
Barclays Bank PLC Annual Report 2010 www.barclays.com/annualreport10 57

Risk managementLiquidity risk management continued
Contractual maturity of financial assets and liabilities (audited)
At 31st December 2010The Bank
Ondemand
£m
Not morethan three
months£m
Over threemonths but
not morethan sixmonths
£m
Over sixmonths but
not morethan one
year£m
Over oneyear
but notmore than
three years£m
Over threeyears butnot morethan five
years£m
Over fiveyears butnot morethan ten
years£m
Over tenyears
£mTotal
£m
Assets Cash and balances at central banks 92,041 645 – – – – – – 92,686 Items in the course of collection from other banks 1,165 103 – – – – – – 1,268 Trading portfolio assets 95,034 – – – – – – – 95,034 Financial assets designated at fair value 77 3,496 346 1,824 4,202 1,991 2,295 14,950 29,181 Derivative financial instruments 439,278 108 12 61 286 293 344 763 441,145 Loans and advances to banks 5,303 20,929 1,900 3,978 5,274 134 1,933 939 40,390 Loans and advances to customers 51,708 230,225 5,774 12,711 39,694 35,288 53,752 93,784 522,936 Reverse repurchase agreements and other similar secured lending 531 210,915 6,671 4,085 390 401 238 4,112 227,343 Available for sale financial investments 7 3,750 1,289 2,003 10,338 7,616 12,141 8,077 45,221 Other financial assets – 1,263 – – 241 – – – 1,504 Total financial assets 685,144 471,434 15,992 24,662 60,425 45,723 70,703 122,625 1,496,708 Other assets 39,582 Total assets 1,536,290 Liabilities Deposits from banks 23,008 67,112 2,311 2,418 1,348 637 250 442 97,526 Items in the course of collection due to other banks 1,261 9 – – – – – – 1,270 Customer accounts 182,057 223,697 19,040 8,741 9,374 5,313 4,346 1,258 453,826 Repurchase agreements and other similar secured borrowing 884 205,814 5,326 1,123 739 256 59 6 214,207 Trading portfolio liabilities 44,352 – – – – – – – 44,352 Financial liabilities designated at fair value 1,225 17,463 6,771 7,124 22,293 18,920 13,705 9,541 97,042 Derivative financial instruments 423,980 303 72 82 345 903 286 272 426,243 Debt securities in issue – 29,045 13,097 27,541 12,971 10,073 10,782 2,758 106,267 Subordinated liabilities – 833 – 218 760 155 9,499 15,529 26,994Other financial liabilities – 14,926 – – 291 – – – 15,217 Total financial liabilities 676,767 559,202 46,617 47,247 48,121 36,257 38,927 29,806 1,482,944Other liabilities 3,301Total liabilities 1,486,245 Cumulative liquidity gap 8,377 (79,391) (110,016) (132,601) (120,297) (110,831) (79,055) 13,764 50,045
58 Barclays Bank PLC Annual Report 2010 www.barclays.com/annualreport10

Contractual maturity of financial assets and liabilities (audited)
At 31st December 2009The Group
Ondemand
£m
Not morethan three
months£m
Over threemonths but
not morethan sixmonths
£m
Over sixmonths but
not morethan one
year£m
Over oneyear
but notmore than
three years£m
Over threeyears butnot morethan five
years£m
Over fiveyears butnot morethan ten
years£m
Over tenyears
£mTotal
£m
Assets Cash and balances at central banks 80,592 891 – – – – – – 81,483 Items in the course of collection from other banks 1,243 350 – – – – – – 1,593 Trading portfolio assets 151,395 – – – – – – – 151,395 Financial assets designated at fair value 679 10,795 1,679 2,456 5,514 3,998 2,293 13,897 41,311 Derivative financial instruments 415,638 216 115 89 236 101 334 86 416,815 Loans and advances to banks 5,114 30,385 314 1,787 2,396 544 98 497 41,135 Loans and advances to customers 44,826 68,876 8,987 17,848 51,886 38,357 63,180 126,264 420,224 Reverse repurchase agreements and other similar secured lending 248 129,095 3,558 5,604 4,680 31 210 5 143,431 Available for sale financial investments 1,157 6,999 8,356 3,434 20,530 6,039 6,802 3,334 56,651 Other financial assets – 2,816 – – 660 – – – 3,476 Total financial assets 700,892 250,423 23,009 31,218 85,902 49,070 72,917 144,083 1,357,514 Other assets 21,634 Total assets 1,379,148 Liabilities Deposits from banks 3,861 50,020 4,850 15,558 1,325 200 420 212 76,446 Items in the course of collection due to other banks 1,373 93 – – – – – – 1,466 Customer accounts 205,894 86,481 8,226 11,940 2,954 3,049 2,864 1,047 322,455 Repurchase agreements and other similar secured borrowing 502 189,843 5,446 2,525 326 108 29 2 198,781 Trading portfolio liabilities 51,252 – – – – – – – 51,252 Financial liabilities designated at fair value 1,219 17,599 5,755 7,145 18,780 14,701 14,647 6,356 86,202 Derivative financial instruments 402,019 186 68 37 111 433 394 168 403,416 Debt securities in issue 64 43,390 17,761 19,408 29,904 11,607 7,838 5,930 135,902 Subordinated liabilities – 173 1 27 1,234 1,375 9,871 13,135 25,816 Other financial liabilities – 4,959 – – 1,135 – – – 6,094 Total financial liabilities 666,184 392,744 42,107 56,640 55,769 31,473 36,063 26,850 1,307,830 Other liabilities 12,619 Total liabilities 1,320,449 Cumulative liquidity gap 34,708 (107,613) (126,711) (152,133) (122,000) (104,403) (67,549) 49,684 58,699
Barclays Bank PLC Annual Report 2010 www.barclays.com/annualreport10 59

Risk managementLiquidity risk management continued
Contractual maturity of financial assets and liabilities (audited)
At 31st December 2009The Bank
Ondemand
£m
Not morethan three
months£m
Over threemonths but
not morethan sixmonths
£m
Over sixmonths but
not morethan one
year£m
Over oneyear
but notmore than
three years£m
Over threeyears butnot morethan five
years£m
Over fiveyears butnot morethan ten
years£m
Over tenyears
£mTotal
£m
Assets Cash and balances at central banks 77,674 773 – – – – – – 78,447 Items in the course of collection from other banks 1,248 125 – – – – – – 1,373 Trading portfolio assets 93,806 – – – – – – – 93,806 Financial assets designated at fair value – 3,838 840 1,564 2,841 2,635 2,263 13,664 27,645 Derivative financial instruments 428,976 194 72 42 158 73 272 108 429,895 Loans and advances to banks 2,818 24,456 548 4,201 5,746 620 2,331 2,243 42,963 Loans and advances to customers 39,694 226,426 6,472 10,977 44,604 35,637 57,177 91,141 512,128 Reverse repurchase agreements and other similar secured lending 17 135,677 2,144 3,179 4,184 29 198 5 145,433 Available for sale financial investments 24 3,194 5,879 2,124 13,218 3,353 5,392 3,390 36,574 Other financial assets – 1,090 – – 108 – – – 1,198 Total financial assets 644,257 395,773 15,955 22,087 70,859 42,347 67,633 110,551 1,369,462 Other assets 29,966 Total assets 1,399,428 Liabilities Deposits from banks 14,251 52,537 5,143 14,700 2,575 125 497 425 90,253 Items in the course of collection due to other banks 1,374 10 – – – – – – 1,384 Customer accounts 162,323 245,996 6,036 12,223 10,874 3,139 2,183 1,745 444,519 Repurchase agreements and other similar secured borrowing – 156,450 5,550 2,435 326 108 324 2 165,195 Trading portfolio liabilities 33,534 – – – – – – – 33,534 Financial liabilities designated at fair value 1,146 16,805 5,692 6,767 18,071 14,454 14,341 6,270 83,546 Derivative financial instruments 417,055 170 63 31 90 413 381 151 418,354 Debt securities in issue – 21,775 12,059 12,287 20,608 8,043 6,378 991 82,141 Subordinated liabilities – – – 27 1,100 792 9,693 13,281 24,893 Other financial liabilities – 1,292 – – 277 – – – 1,569 Total financial liabilities 629,683 495,035 34,543 48,470 53,921 27,074 33,797 22,865 1,345,388 Other liabilities 6,209 Total liabilities 1,351,597 Cumulative liquidity gap 14,574 (84,688) (103,276) (129,659) (112,721) (97,448) (63,612) 24,074 47,831
Expected maturity dates do not differ significantly from the contract dates, except for:
– trading portfolio assets and liabilities and derivative financial instruments, which may not be held to maturity as part of the Group’s trading strategies. For these instruments, which are mostly held by Barclays Capital, liquidity and repricing risk is managed through the Daily Value at Risk (DVaR) methodology;
– retail deposits, which are included within customer accounts, are repayable on demand or at short notice on a contractual basis. In practice, these instruments form a stable base for the Group’s operations and liquidity needs because of the broad base of customers – both numerically and by depositor type; and
– financial assets designated at fair value held in respect of linked liabilities, which are managed with the associated liabilities.
60 Barclays Bank PLC Annual Report 2010 www.barclays.com/annualreport10

Contractual maturity of financial liabilities on an undiscounted basis (audited)The table below presents the cash flows payable by the Group under financial liabilities by remaining contractual maturities at the balance sheet date. The amounts disclosed in the table are the contractual undiscounted cash flows of all financial liabilities (i.e. nominal values); whereas the Group manages the inherent liquidity risk based on discounted expected cash inflows.
Contractual maturity of financial liabilities – undiscounted (audited)
At 31st December 2010On demand
£m
Within oneyear£m
Over one yearbut not morethan five years
£m
Over fiveyears
£mTotal
£m
The Group Deposits from banks 5,754 70,197 1,636 613 78,200 Items in the course of collection due to other banks 1,312 9 – – 1,321 Customer accounts 230,895 103,119 9,169 3,446 346,629 Repurchase agreements and other similar secured borrowing 907 223,589 1,099 71 225,666 Trading portfolio liabilities 72,693 – – – 72,693 Financial liabilities designated at fair value 1,237 32,408 45,573 34,745 113,963Derivative financial instruments 403,163 509 1,478 1,131 406,281 Debt securities in issue 17 103,437 39,519 26,304 169,277 Subordinated liabilities – 1,934 5,645 26,785 34,364Other financial liabilities – 4,295 990 – 5,285 Total financial liabilities 715,978 539,497 105,109 93,095 1,453,679Off-balance sheet items Loan commitments 188,958 17,755 5,912 10,416 223,041 Other commitments 227 806 183 – 1,216 Total off-balance sheet items 189,185 18,561 6,095 10,416 224,257 Total financial liabilities and off-balance sheet items 905,163 558,058 111,204 103,511 1,677,936
The Bank Deposits from banks 23,008 71,893 2,114 766 97,781 Items in the course of collection due to other banks 1,261 9 – – 1,270 Customer accounts 182,057 251,514 15,060 6,064 454,695 Repurchase agreements and other similar secured borrowing 884 212,285 1,099 71 214,339 Trading portfolio liabilities 44,352 – – – 44,352 Financial liabilities designated at fair value 1,225 32,831 46,971 34,504 115,531 Derivative financial instruments 423,980 488 1,437 1,117 427,022 Debt securities in issue – 71,119 26,429 19,364 116,912 Subordinated liabilities – 1,932 4,008 26,918 32,858Other financial liabilities – 14,926 291 – 15,217 Total financial liabilities 676,767 656,997 97,409 88,804 1,519,977 Off-balance sheet items Loan commitments 160,266 11,650 2,129 227 174,272 Other commitments 156 599 169 – 924 Total off-balance sheet items 160,422 12,249 2,298 227 175,196 Total financial liabilities and off-balance sheet items 837,189 669,246 99,707 89,031 1,695,173
Barclays Bank PLC Annual Report 2010 www.barclays.com/annualreport10 61

Risk managementLiquidity risk management continued
Contractual maturity of financial liabilities – undiscounted (audited)
At 31st December 2009On demand
£m
Within oneyear£m
Over one yearbut not more
than five years£m
Over fiveyears
£mTotal
£m
The Group Deposits from banks 3,861 70,645 1,607 773 76,886 Items in the course of collection due to other banks 1,373 93 – – 1,466 Customer accounts 205,894 106,991 6,899 5,488 325,272 Repurchase agreements and other similar secured borrowing 502 197,864 450 37 198,853 Trading portfolio liabilities 51,252 – – – 51,252 Financial liabilities designated at fair value 1,219 31,030 35,733 34,206 102,188 Derivative financial instruments 402,019 311 627 998 403,955 Debt securities in issue 64 82,215 46,055 22,243 150,577 Subordinated liabilities – 2,101 6,295 26,842 35,238 Other financial liabilities – 4,959 1,135 – 6,094 Total financial liabilities 666,184 496,209 98,801 90,587 1,351,781 Off-balance sheet items Loan commitments 127,540 74,111 4,181 861 206,693 Other commitments 386 384 19 – 789 Total off-balance sheet items 127,926 74,495 4,200 861 207,482 Total financial liabilities and off-balance sheet items 794,110 570,704 103,001 91,448 1,559,263
The Bank Deposits from banks 14,251 72,587 2,876 1,054 90,768 Items in the course of collection due to other banks 1,374 10 – – 1,384 Customer accounts 162,323 263,207 15,340 7,311 448,181 Repurchase agreements and other similar secured borrowing – 164,483 450 430 165,363 Trading portfolio liabilities 33,534 – – – 33,534 Financial liabilities designated at fair value 1,146 29,668 34,897 33,490 99,201 Derivative financial instruments 417,055 264 644 889 418,852 Debt securities in issue – 47,324 32,274 12,485 92,083 Subordinated liabilities – 1,785 5,242 26,535 33,562 Other financial liabilities – 1,292 277 – 1,569 Total financial liabilities 629,683 580,620 92,000 82,194 1,384,497 Off-balance sheet items Loan commitments 117,879 38,581 2,815 440 159,715 Other commitments 319 250 1 – 570 Total off-balance sheet items 118,198 38,831 2,816 440 160,285 Total financial liabilities and off-balance sheet items 747,881 619,451 94,816 82,634 1,544,782
The balances in the above table do not agree directly to the balances in the consolidated balance sheet as the table incorporates all cash flows, on an undiscounted basis, related to both principal as well as those associated with all future coupon payments.
Derivative financial instruments held for trading and trading portfolio liabilities are included in the on demand column at their fair value.
Financial liabilities designated at fair value in respect of linked liabilities under investment contracts have been excluded from this analysis as the Group is not exposed to liquidity risk arising from them.
62 Barclays Bank PLC Annual Report 2010 www.barclays.com/annualreport10

The Group’s operations, including its overseas offices, subsidiaries and associates, are subject to a significant body of rules and regulations that are a condition for authorisation to conduct banking and financial services business, constrain business operations and affect financial returns. These include reserve and reporting requirements and conduct of business regulations. These requirements are imposed by the relevant central banks and regulatory authorities that supervise the Group in the jurisdictions in which it operates. The requirements reflect global standards developed by, among others, the Basel Committee on Banking Supervision and the International Organisation of Securities Commissions. They also reflect requirements derived from EU directives.
In the UK, the Financial Services Authority (FSA) remains, pending the reorganisation of the UK regulatory regime (see below), the independent body responsible for the regulation and supervision of deposit taking, life insurance, home mortgages, general insurance and investment business. Barclays Bank PLC is authorised by the FSA under the Financial Services and Markets Act 2000 to carry on a range of regulated activities within the UK and is subject to consolidated supervision by the FSA. In its role as supervisor, the FSA seeks to maintain the safety and soundness of financial institutions with the aim of strengthening, but not guaranteeing, the protection of customers and the financial system. The FSA’s continuing supervision of financial institutions is conducted through a variety of regulatory tools, including the collection of information from statistical and prudential returns, reports obtained from skilled persons, visits to firms and regular meetings with management to discuss issues such as performance, risk management and strategy.
The FSA adopts a risk-based approach to supervision. The starting point for supervision of all financial institutions is a systematic analysis of the risk profile for each authorised firm. The FSA has adopted a homogeneous risk, processes and resourcing model in its approach to its supervisory responsibilities (known as the ARROW model) and the results of the risk assessment are used by the FSA to develop a risk mitigation programme for a firm. This is supplemented with a rolling programme of continuous engagement on prudential and conduct matters with high impact firms, such as Barclays. The FSA also promulgates requirements that banks and other financial institutions are required to meet on matters such as capital adequacy, limits on large exposures to individual entities and groups of closely connected entities, liquidity and rules of business conduct.
The Banking Act 2009 (the Banking Act) provides a permanent regime to allow the FSA, the UK Treasury and the Bank of England to resolve failing banks in the UK. Under the Banking Act, these authorities are given powers, including (a) the power to issue share transfer orders pursuant to which all or some of the securities issued by a bank may be transferred to a commercial purchaser or Bank of England entity and (b) the power to transfer all or some of the property, rights and liabilities of the UK bank to a purchaser or Bank of England entity. A share transfer order can extend to a wide range of securities including shares and bonds issued by a UK bank (including Barclays Bank PLC) or its holding company (Barclays PLC) and warrants for such shares and bonds. The Banking Act powers apply regardless of any contractual restrictions and compensation may be payable in the context of both share transfer orders and property appropriation.
The Banking Act also gives the Bank of England the power to override, vary or impose contractual obligations between a UK bank or its holding company and its former group undertakings for reasonable consideration, in order to enable any transferee or successor bank of the UK bank to operate effectively. There is also power for the Treasury to amend the law (excluding provisions made by or under the Banking Act) for the purpose of enabling it to use the regime powers effectively, potentially with retrospective effect. In addition, the Banking Act gives the Bank of England statutory responsibility for financial stability in the UK and for the oversight of payment systems.
The Financial Services Act 2010, among other things, requires the FSA to make rules about remuneration and to require regulated firms to have a remuneration policy that is consistent with both effective risk management and the standards issued by the Financial Stability Board. The FSA is mandated to make rules that require authorised firms (or a subset of authorised firms) to draw up recovery and resolution plans and to consult with the Treasury and the Bank of England on the adequacy of firms’ plans. This Act also allows the FSA to make rules requiring firms to operate a collective consumer redress scheme to deal with cases of widespread failure by regulated firms to meet regulatory requirements that may have created consumer detriment.
Banks, insurance companies and other financial institutions in the UK are subject to a single financial services compensation scheme (the Financial Services Compensation Scheme – FSCS) where an authorised firm is unable or is likely to be unable to meet claims made against it because of its financial circumstances. Most deposits made with branches of Barclays Bank PLC within the European Economic Area (EEA) which are denominated in Sterling or other EEA currencies (including the Euro) are covered by the FSCS. Most claims made in respect of investment business will also be protected claims if the business was carried on from the UK or from a branch of the bank or investment firm in another EEA member state. The FSCS is funded by levies on authorised UK firms such as Barclays Bank PLC. In the event that the FSCS raises those funds more frequently or significantly increases the levies to be paid by firms, the associated costs to the Group may have a material impact on the Group’s results. Further details can be found in Note 24 (Contingent liabilities and commitments) on pages 117 and 118.
Outside the UK, the Group has operations (and main regulators) located in continental Europe, in particular France, Germany, Spain, Switzerland, Portugal and Italy (local central banks and other regulatory authorities); Asia Pacific (various regulatory authorities including the Hong Kong Monetary Authority, the Financial Services Agency of Japan, the Australian Securities and Investments Commission, the Monetary Authority of Singapore, the China Banking Regulatory Commission and the Reserve Bank of India); Africa and the Middle East (various regulatory authorities including the South African Reserve Bank and the Financial Services Board and the regulatory authorities of the United Arab Emirates) and the United States of America (including the Board of Governors of the Federal Reserve System (FRB), the Office of the Comptroller of the Currency (OCC) and the Securities and Exchange Commission (SEC)).
The UK regulatory agenda is considerably shaped and influenced by the directives emanating from the EU. These form part of the European Single Market programme, an important feature of which is the framework for the regulation of authorised firms. This framework is designed to enable a credit institution or investment firm authorised in one EU member state to conduct banking or investment business through the establishment of branches or by the provision of services on a cross-border basis in other member states without the need for local authorisation. Barclays operations in Europe are authorised and regulated by a combination of both home (the FSA) and host regulators.
Barclays operations in South Africa, including Absa Group Limited, are supervised and regulated by the South African Reserve Bank (SARB) and the Financial Services Board (FSB). SARB oversees the banking industry and follows a risk-based approach to supervision whilst the FSB oversees the non-banking financial services industry and focuses on enhancing consumer protection and regulating market conduct.
Risk managementSupervision and regulation
All disclosures in this section (pages 63 to 65) are unaudited.
Barclays Bank PLC Annual Report 2010 www.barclays.com/annualreport10 63

Risk managementSupervision and regulation continued
In the United States, Barclays PLC, Barclays Bank PLC and Barclays US banking subsidiaries are subject to a comprehensive regulatory structure involving numerous statutes, rules and regulations, including the International Banking Act of 1978, the Bank Holding Company Act of 1956, as amended (BHC Act), the Foreign Bank Supervision Enhancement Act of 1991, the Financial Services Modernization Act of 1999 and the USA PATRIOT Act of 2001. Such laws impose restrictions on the activities of Barclays, including its US banking subsidiaries and the Bank’s US branches, as well as prudential restrictions, such as limits on extensions of credit by the Bank’s US branches and the US banking subsidiaries to affiliates. The New York and Florida branches of Barclays Bank PLC are subject to extensive federal and state supervision and regulation by the FRB and the New York and Florida banking supervisors. Barclays Bank PLC also operates a federal agency in California that is licensed by and subject to regulation and examination by the OCC. Barclays Bank Delaware, a Delaware-chartered commercial bank, is subject to supervision and regulation by the Delaware banking supervisor and the Federal Deposit Insurance Corporation (FDIC). Only the deposits of Barclays Bank Delaware are insured by the FDIC.
Barclays PLC and Barclays Bank PLC are bank holding companies registered with the FRB. Following the transfer of ownership of Barclays Bank Delaware from Barclays Group US Inc. to Barclays Bank PLC, Barclays Group US Inc. is no longer a bank holding company. Barclays PLC and Barclays Bank PLC have each elected to be treated as a financial holding company under the BHC Act. Financial holding companies may engage in a broader range of financial and related activities than are permitted to registered bank holding companies that do not maintain financial holding company status, including underwriting and dealing in all types of securities. To maintain financial holding company status, each of Barclays PLC and Barclays Bank PLC is required to meet or exceed certain capital ratios and to be deemed to be ‘well managed,’ and Barclays Bank Delaware must meet certain capital requirements, be deemed to be ‘well managed’ and must have at least a ‘satisfactory’ rating under the Community Reinvestment Act of 1977.
Barclays US securities broker/dealer, investment advisory and Investment banking operations are subject to ongoing supervision and regulation by the SEC, the Financial Industry Regulatory Authority (FINRA) and other government agencies and self-regulatory organisations as part of a comprehensive scheme of regulation of all aspects of the securities business under the US federal and state securities laws.
The credit card-related activities of the Group in the US are subject to the Credit Card Accountability, Responsibility and Disclosure Act of 2009 (Credit CARD Act) which was enacted by Congress in May 2009 to prohibit certain credit card pricing and marketing practices for consumer credit card accounts. Among the numerous provisions, which came into effect at various times through August 2010, are those that prohibit increasing rates on existing balances and over limit fees in most instances, restrict increasing fees and rates prospectively, restrict what penalty fees can be assessed, regulate how payments are to be allocated to different balances and how the billing process is to work, and revises all communications to cardholders.
Regulatory DevelopmentsIn the wake of the financial crisis there has been regulatory change that, when fully implemented, will have a substantial impact on all financial institutions, including the Group. Regulatory change is being pursued at a number of levels, globally notably through the G20, Financial Stability Board (FSB) and Basel Committee on Banking Supervision, regionally through the European Union and nationally, especially in the UK and US. It is of importance to the Group and to the banking industry generally that the various bodies work harmoniously and that a globally consistent approach is taken to banking regulation.
GlobalWhile some of the uncertainty surrounding the nature of the future regulation of banks has been resolved, the full extent of the impact of regulatory change is not yet fully clear. Nevertheless, the programme of reform of the global regulatory framework that was agreed by G20 Heads of Government in April 2009 has advanced substantially during 2010, notably through the issue of final guidelines on Basel III capital and liquidity standards in December 2010. The requirements of Basel III will be applicable from 1st January 2013 with a number of transitional provisions that run to the end of 2018. An initial assessment of the likely impact of the Basel III capital, leverage and liquidity requirements can be found on page 8 and 55.
The FSB has been designated by the G20 as the body responsible for co-ordinating the delivery of the global reform programme. It is continuing to work on developing additional regulation as well as guidelines for the supervision of systemically significant institutions. A key element of the global reform programme is that systemic institutions, including globally systemic financial institutions (G-SIFIs) should be capable of being resolved without recourse to taxpayer support. The details of the future regime for systemic banks remains one of the areas of uncertainty, although the FSB has made it clear that systemically significant institutions will be required to maintain loss absorbency that is greater than the standards that are implied by Basel III. This additional loss absorbency may take the form of some combination of capital surcharge, requirements to hold contingent capital instruments and bail-in debt. Systemic banks will be subject to enhanced supervision and a comprehensive crisis management framework within supervisory colleges. The concept of bail-in debt may, if pursued, affect the rights of senior unsecured creditors subject to any bail-in in the event of a resolution of a failing bank. Further proposals including the identification of G-SIFIs will be developed during the first half of 2011. Barclays is likely to be considered a systemically significant institution.
The FSB is also working on approaches to the resolution of systemically significant institutions that will include the preparation of Recovery and Resolution Plans, sometimes called ‘living wills’. Further detail is awaited from the FSB and from national regulatory bodies including the FSA, although the FSA has undertaken a pilot project with a group of large UK banks including Barclays.
While the Basel Committee on Banking Supervision has largely completed the process of setting new standards for capital and liquidity, a number of workstreams remain active that will affect the Group. These include a fundamental review of the trading book in addition to the enhanced capital requirements for trading book exposures that were implemented on 1st January 2011. The Basel Committee is also understood to be examining a regime for large exposures.
European UnionThe Basel Committee’s proposals will be implemented in the EU by amendment to the Capital Requirements Directive (CRD). Formal proposals to amend the CRD are expected in the summer of 2011 which will help address some of the remaining uncertainties. In addition, other amendments are being made to the EU framework of directives, including to the Directive on Deposit Guarantee Schemes. This may affect the amounts to which the Group may be liable to fund the compensation of depositors of failed banks. The proposal also envisages that national schemes should be pre-funded. This would be a significant change for UK banks where levies are currently raised as needed after failure. The financial impact on the Group is not yet clear.
64 Barclays Bank PLC Annual Report 2010 www.barclays.com/annualreport10

Further amendments to EU regulatory requirements are likely as the EU develops its response to the financial crisis, including the structure of the regulatory system in the EU. On 1st January 2011, a number of new bodies came into being, including a European Systemic Risk Board to monitor the financial system and advise on macroprudential actions and a European Banking Authority charged with the development of a single rulebook for banks in the EU and with enhancing co-operation between national supervisory authorities, especially in the context of the supervision of banks that operate across borders within the EU. The European Banking Authority will have the power to mediate between and override national authorities under certain circumstances. National authorities, however, remain responsible for the day-to-day supervision of financial institutions.
Other EU developments include consideration of European arrangements in respect of crisis management and the resolution of financial institutions. The European Commission issued a discussion paper in January 2011, and proposals for legislation are expected in 2011. These are likely to have an impact on the rights of shareholders and creditors of failing institutions. Proposals are also expected in relation to corporate governance, and to amend the Markets in Financial Instruments Directive which will affect many of the investment markets in which the Group operates and the instruments in which it trades.
United KingdomThe Government is reforming the structure of regulation to replace the FSA and the tripartite system that also involved the Bank of England and HM Treasury. It proposes that a Financial Policy Committee should be established in the Bank of England with responsibility for the monitoring and control of systemic risk, including the deployment of macro-prudential tools of supervision. Responsibility for prudential regulation will pass to a Prudential Regulation Authority to be established as a subsidiary of the Bank of England, while a Financial Conduct Authority (FCA) will be responsible for issues of business and market conduct and market regulation. The FCA will also be the UK listing authority. These reforms will require primary legislation to be passed by Parliament. This process is not expected to be complete before late 2012. In anticipation of the new regulatory structure, an interim Financial Policy Committee has been created and the FSA will reorganise itself into separate Prudential and Consumer and Markets business units on 4th April 2011. The Government is also considering the creation of an Economic Crime Agency to deal with serious financial crime.
On 16th June 2010, the Chancellor of the Exchequer announced the creation of the Independent Commission on Banking (ICB). The ICB has been asked to consider structural and related non-structural reforms to the UK banking sector to promote financial stability and competition, and to make recommendations to the Government by the end of September 2011. The ICB intends to publish an interim report in April, to be followed by a further round of consultation. Although the ICB has yet to make recommendations, and it is not possible to predict what the Government’s disposition to any recommendations that are made will be, there is a possibility that the Commission could recommend change to the structure of UK banks.
The FSA continues to develop its more intrusive and assertive approach to supervision and its policy of credible deterrence in relation to enforcement that has seen significant growth in the size of regulatory fines. In anticipation of international agreement, the FSA has established and implemented capital and liquidity requirements that are substantially increased from pre-crisis levels. The Retail Distribution Review and the Mortgage Market Review will affect the economics of investment advice and home finance provision respectively. The FSA has also launched a consultation on its intention to adopt a more interventionist approach to the design of financial products and to the governance processes around the design of new products. The Government has stated that these increasingly interventionist regulatory and supervisory policies will be carried through into the FCA when it is established.
United StatesThe Dodd-Frank Wall Street Reform and Consumer Protection Act (DFA) was signed into law in July 2010. The Act provides for a new Financial Stability Oversight Council (FSOC), governmental resolution authority for failing non-depository financial institutions (including bank holding companies) under the aegis of the Federal Deposit Insurance Corporation, reorganisation of several of the bank supervisory agencies, a new Consumer Financial Protection Bureau (CPFB) and a federal Insurance Office. It also imposes harsher capital, liquidity and leverage requirements, as well as wide-ranging new requirements including for derivatives, hedge funds, private equity funds, credit rating agencies, debit card interchange fees and corporate governance. The full scale of the DFA’s impact on the Group remains unclear because the rules required to implement many of the provisions of DFA have, in most cases, not been implemented and, in several important areas, have yet to be proposed by the responsible agencies. Nonetheless, certain provisions of the DFA are particularly likely to have an effect on the Group. These include:
– The ability of the FSOC to make recommendations to the Federal Reserve regarding the establishment of heightened supervisory requirements and prudential standards applicable to ‘systematically important’ entities and activities and work with all primary financial regulatory agencies to establish regulations, as necessary, to address financial stability concerns. It is not yet clear what regard the FSOC or the other agencies will have to the home country prudential regulators of non-US organisations such as the FSA, in the case of the Group;
– The so-called ‘Volcker Rule,’ which will, once effective, significantly restrict the ability of US bank holding companies and their affiliates, and the US branches of foreign banks, to conduct proprietary trading in securities and derivatives as well as certain activities related to hedge funds and private equity funds. The Volcker Rule is likely to have a significant impact on some of the Group’s US operations. The DFA states that the Rule does not affect activities conducted ‘entirely’ outside the United States by non-US organisations, but the Federal Reserve has not indicated how it intends to interpret this exclusion in practice;
– Significant changes to the trading and regulation of derivatives and participants in the derivatives markets. Among the changes mandated by the DFA are that many types of derivatives now traded in the over-the-counter markets be traded on an exchange or swap execution facility and centrally cleared. In addition, many participants in these markets will be required to register with the US Commodity Futures Trading Commission (CFTC) as ‘swap dealers’ or ‘major swap participants’ and/or with the US SEC as ‘securities swap dealers or major securities swap dealers’ and be subject to CFTC and SEC regulation and oversight. Barclays Bank PLC and one or more of its US subsidiaries may be subjected to these requirements;
– In addition to the ability of the FSOC to recommend heightened prudential standards for specific institutions the DFA, separate and apart from Basel III, also imposes higher capital, liquidity and leverage requirements on US banks and bank holding companies generally; and
– The ability of the CPFB to regulate the credit card industry, including the terms of credit card agreements with consumers, disclosures, and fees. Actions by the CPFB in this area are likely to impact the Group’s US credit card business.
Barclays Bank PLC Annual Report 2010 www.barclays.com/annualreport10 65

Citizenship
Our role is to help improve the lives of our customers. We must provide mortgages, allow businesses to invest and create jobs, protect savings, pay tax, be a good neighbour in the community while also generating positive economic returns for our investors Bob Diamond, Chief Executive
Our key areas of focus are contributing to growth and supporting our communities. Underpinning these is a foundation of sound business principles and practice that ensures integrity in the way we do business.
Our Group Executive Committee is responsible for our overall citizenship strategy, and supports the Chief Executive in its implementation. This Committee, along with the Board, uses a robust reporting framework to review progress.
Contributing to growthWe employ nearly 150,000 people around the world. In 2010, 2,000 new jobs were created and 1,200 graduates were hired in the UK, bringing the total employed in the UK to 65,000. Our global tax contributions amounted to £6.1bn, including £2.8bn paid on behalf of our employees. In addition, we paid more than £8.7bn to suppliers in 37 countries.
In 2010, Barclays provided £43bn of gross new lending in the UK including £7.5bn from the acquisition of Standard Life Bank and assisted more than 106,000 business start-ups, an increase of 12% over 2009. In South Africa, Absa’s Enterprise Development Centres helped almost 5,000 new businesses to start up in 2010.
In 2010 four out of five Barclays UK business lending applications were approved
We’re helping our customers, clients and other stakeholders invest in ways that contribute to growth tomorrow. We are providing financing solutions to private and public sector clients, facilitating investment in infrastructure, development and the low carbon economy.
Supporting our communities In 2010, we committed over £55m to community programmes across 37 countries. Our programmes are driven by the passion and energy of 62,118 colleagues around the world, who volunteered their time or took part in fundraising and regular giving. These efforts benefitted 1.5 million people and supported more than 8,000 organisations.
In the last five years, Barclays employees have volunteered over one million hours in their local communities and raised more than £75m through our matched fundraising scheme
Barclays Climate Action Programme 2011-2015 is our direct response to issues concerning the environment and climate change. We are focusing on the areas where we have the greatest potential to make a difference, including:
– Managing our carbon footprint – including a commitment to reduce absolute carbon emissions by 4% by 2013 and creating an African Carbon Fund to supply seed capital to carbon mitigation projects in Africa
– Developing products and services to help enable the transition to a low-carbon economy – including financing and risk-management solutions to enable capital to flow to lower carbon opportunities
– Managing climate change risks – including collaborating with other stakeholders to manage the risks of climate change to our operations, our clients and to society at large.
Citizenship
Contributing to growth
– Direct contribution, employment and economic value added
– Supporting growth today: customers and clients
– Investing in tomorrow
Supporting our communities
– Supporting social infrastructure
– Increasing access to financial services
– Investing in the community
– Building a diverse workforce
– Managing our environmental footprint
The way we do business
66 Barclays Bank PLC Annual Report 2010 www.barclays.com/annualreport10

Our PeopleGlobal minimum standardsTo maintain balance between overall control and effective local decision making we have established global governance frameworks and minimum standards to regulate how we manage and treat our employees around the world. The key areas covered are summarised below.
Performance management and compensationThe performance and development process provides employees with the opportunity to have regular discussions with their line managers about their performance and to receive coaching for their personal development. This is typically assessed twice a year and a performance rating agreed. We believe in pay for performance based on the performance of individuals and their businesses.
Diversity and inclusionBarclays operates across the globe and engages with employees across a wealth of diverse and rich cultures. Our mission is to create a truly inclusive environment through ensuring that we treat people fairly and value diversity.
Health and safetyOur commitment is to ensure the health, safety and welfare of our employees and to provide and maintain safe working conditions. Good working climates will help our employees to better serve our customers and create value for all our stakeholders.
TrainingDeveloping both existing and new employees is key to our future prosperity. We undertake this through formal classroom-based training and informal on-the-job training, education and coaching. Minimum mandatory training is provided to all employees on policies and regulatory responsibilities.
Global employment statistics
%
% of female employees
% of senior executiveswho are female% of senior managerswho are female% of employees working part-time
Turnover rate
Resignation rate
Sickness absence rate
52.051.1
16.115.3
23.723.6
8.25.2
16.916.9
10.59.9
3.02.3
20102009
Headcount by world region – full time equivalent
000s
UK
Africa and Middle East
Continental Europe
Americas
Asia Pacific
58.155.6
50.450.7
13.613.6
11.512.3
13.912.0
20102009
Barclays Bank PLC Annual Report 2010 www.barclays.com/annualreport10 67

Business Review The Company is required to set out in this report a fair review of the business of the Group during the financial year ended 31st December 2010 and of the position of the Group at the end of the financial year and a description of the principal risks and uncertainties facing the Group (known as a ‘Business Review’). The purpose of the Business Review is to enable shareholders to assess how the Directors have performed their duty under Section 172 of the Companies Act 2006 (duty to promote the success of the Company).
The information that fulfils the requirements of the Business Review can be found on pages 2 to 67 and is incorporated into this report by reference.
From the perspective of the Bank, the review of the business and the principal risks and uncertainties facing the Company are integrated with those of Barclays PLC, the Bank’s ultimate parent. Therefore additional information may be found in the 2010 Annual Report of Barclays PLC, which does not form part of this report.
Barclays is a major global financial services provider engaged in retail banking, credit cards, corporate and investment banking and wealth management. Barclays operates through branches, offices and subsidiaries in the UK and overseas.
The results of the Group show a pre-tax profit of £6,079m (2009 continuing operations: £4,559m) for the year and profit after tax of £4,563m (2009 continuing operations: £3,512m). The Group had net assets of £62,641m at 31st December 2010 (2009: £58,669m).
Profit AttributableThe profit attributable to the equity holders of the parent for the year amounted to £4,172m compared with £3,228m from continuing operations and £6,765m from discontinued operations in 2009.
DividendsTotal dividends on ordinary shares paid during 2010 are set out in Note 10 to the accounts. Dividends paid on preference shares for the year ended 31st December 2010 amounted to £485m (2009: £477m).
Share CapitalThere was no increase in ordinary share capital during the year. Barclays PLC owns 100% of the issued ordinary shares.
Directors The Directors of the Bank are listed on page 70. The Directors’ interests in shares are set out in Note 40 of Barclays PLC’s Annual Report and Accounts. The membership of the Boards of the Bank and of Barclays PLC is identical.
Board MembershipThe membership of the Boards of Directors of Barclays PLC and Barclays Bank PLC is identical. Dambisa Moyo and Alison Carnwath were appointed as non-executive Directors with effect from 1st May 2010 and 1st August 2010 respectively. Leigh Clifford and John Varley left the Board on 30th September 2010 and 31st December 2010 respectively.
Directors’ IndemnitiesQualifying third party indemnity provisions (as defined by section 234 of the Companies Act 2006) were in force during the course of the financial year ended 31st December 2010 for the benefit of the then Directors and, at the date of this report, are in force for the benefit of the Directors in relation to certain losses and liabilities which they may incur (or have incurred) in connection with their duties, powers or office.
Community Involvement Barclays has an extensive community investment programme covering many countries around the world. The Group provides funding and support to over 8,000 charities and voluntary organisations, ranging from small, local charities like The Passage, supporting homeless people in London, to international organisations like Unicef. We also have a very successful employee programme which in 2010 saw more than 62,000 employees and pensioners worldwide taking part in Barclays-supported volunteering, giving and fundraising activities. Further information on our community involvement is given on pages 4 and 66. The total commitment for 2010 was £55.3m (2009: £54.9m). The Group committed £28.6m in support of the community in the UK (2009: £27.4m) and £26.7m was committed in international support (2009: £27.5m). The UK commitment includes £22.9m of charitable donations (2009: £19.3m).
Employee InvolvementBarclays is committed to ensuring that employees share in the success of the Group. Staff are encouraged to participate in share option and share purchase schemes and have a substantial sum invested in barclays shares . Employees are kept informed of matters of concern to them in a variety of ways, including the business unit news magazines, intranets, briefings and mobile phone SMS messaging. These communications help achieve a common awareness among employees of the financial and economic factors affecting the performance of Barclays. Barclays is also committed to providing employees with opportunities to share their views and provide feedback on issues that are important to them. Employee Opinion Surveys are undertaken periodically across the Group with results being reported to the Board, all employees and to our European Works Council, Africa Forum, Unite (Amicus section), our recognised union in the UK and other recognised unions worldwide. Roadshows and employee forums also take place. In addition, Barclays undertakes regular and formal consultations with our recognised trade unions and work councils internationally.
Directors’ report
68 Barclays Bank PLC Annual Report 2010 www.barclays.com/annualreport10

Research and DevelopmentIn the ordinary course of business the Group develops new products and services in each of its business units.
Financial InstrumentsBarclays financial risk management objectives and policies, including the policy for hedging each major type of forecasted transaction for which hedge accounting is used, and the exposure to market risk, credit risk and liquidity risk are set out on pages 20 to 62.
Events after the Balance Sheet DateEvents after the balance sheet date are noted on page 166.
The AuditorsThe Board Audit Committee reviews the appointment of the external auditors, as well as their relationship with the Group, including monitoring the Group’s use of the auditors for non-audit services and the balance of audit and non-audit fees paid to the auditors. More details on this can be found in Note 8 to the accounts.
PricewaterhouseCoopers LLP have been the Company’s auditors for many years. Having reviewed the independence and effectiveness of the external auditors, the Committee has not considered it necessary to date to require them to tender for the audit work but will keep this issue under review. The external auditors are required to rotate the audit partners responsible for the Group and subsidiary audits every five years. Our previous lead audit partner, who had been in place for five years, was replaced for the 2010 year end. There are no contractual obligations restricting the Company’s choice of external auditor. The Committee has recommended to the Board that the existing auditors, PricewaterhouseCoopers LLP, be reappointed. PricewaterhouseCoopers LLP have signified their willingness to continue in office and ordinary resolutions reappointing them as auditors and authorising the Directors to set their remuneration will be proposed at the 2011 AGM. So far as each of the Directors are aware, there is no relevant audit information of which the Company’s auditors are unaware. Each of the Directors has taken all the steps that he or she ought to have taken as a Director in order to make himself or herself aware of any relevant audit information and to establish that the Company's auditors are aware of that information. For these purposes, ‘relevant audit information’ means information needed by the Company’s auditors in connection with preparing their report.
By order of the Board
Lawrence DickinsonJoint Secretary 10th March 2011
Diversity and InclusionThe diversity agenda at Barclays seeks to include customers, colleagues and suppliers. Our objective is to recruit and retain the best people, regardless of (but not limited to) race, religion, age, gender, sexual orientation or disability. We strive to ensure our workforce reflects the communities in which we operate and the international nature of the organisation. We recognise that diversity is a key part of responsible business strategy in support of our increasingly global business. In the UK, Barclays is committed to providing additional support to employees with disabilities and making it easier for them to inform us of their specific requirements, including the introduction of a dedicated intranet site and disability helpline. Through our UK Reasonable Adjustments Scheme, appropriate assistance can be given, including physical workplace adjustments, and relevant training and access to trained mentors is also provided for disabled employees. A wide range of recruitment initiatives have been taken to increase the number of people with disabilities working in Barclays.
Creditors’ Payment Policy Barclays values its suppliers and acknowledges the importance of paying invoices, especially those of small businesses, in a timely manner. Barclays policy follows the Department for Business, Innovation & Skills’ Prompt Payment Code, copies of which can be obtained from the Prompt Payment Code website at www.promptpaymentcode.org.uk.
The trade creditor payment days for Barclays Bank PLC for 2010 were 27 days (2009: 27 days). This is an arithmetical calculation based on the Companies Act Regulations and does not necessarily reflect our practice, which is described above, nor the experience of any individual creditor.
Essential business contractsThere are no persons with whom the Group has contractual or other arrangements that are considered essential to the business of the Group.
Contracts of SignificanceUnder the terms of a stock purchase agreement dated 16th June 2009 which was entered into by and among Barclays Bank PLC, Barclays PLC and BlackRock, Inc. (BlackRock), Barclays agreed to sell Barclays Global Investors (BGI) to BlackRock. The sale completed on 1st December 2009 following the receipt of all necessary shareholder and regulatory approvals and satisfaction of other closing conditions. The consideration at completion was US$15.2bn (£9.5bn), including 37.567 million new BlackRock shares, giving Barclays an economic interest of 19.9% of the enlarged BlackRock group. Barclays has provided BlackRock with customary warranties and indemnities in connection with the sale. Barclays Bank will also continue to provide support in respect of certain BGI cash funds until December 2013 and indemnities in respect of certain of BGI’s fully collateralised securities lending activities until 30th November 2012.
Barclays Bank PLC Annual Report 2010 www.barclays.com/annualreport10 69

Current Directors and Officers
Marcus Agius – Group Chairman
Executive Directors Bob Diamond – Chief ExecutiveChris Lucas – Group Finance Director
Non-executive Directors Sir Richard Broadbent – Deputy Chairman David Booth Alison CarnwathFulvio Conti Simon FraserReuben Jeffery IIISir Andrew LikiermanDambisa Moyo Sir Michael Rake Sir John Sunderland
Current Executive Committee membersAppointed to Executive
Committee
Bob Diamond Chief Executive 1997Chris Lucas Group Finance Director 2007Jerry del Missier Co-Chief Executive of Barclays
Capital and Co-Chief Executive of Corporate and Investment Banking
2009
Mark Harding Group General Counsel 2009Antony Jenkins Chief Executive, Global Retail
Banking2009
Tom Kalaris Chief Executive, Barclays Wealth 2009Robert Le Blanc Chief Risk Officer 2009
Maria Ramos Chief Executive, Absa 2009Rich Ricci Co-Chief Executive of Barclays
Capital and Co-Chief Executive of Corporate and Investment Banking
2009
Cathy Turnera Barclays Human Resources Director
2009
Other Officers Appointed to position
Lawrence Dickinson Joint Secretary 2002Patrick Gonsalves Joint Secretary 2002John Worthb Group Financial Controller 2011
Going concernThe Group’s business activities and financial position, the factors likely to affect its future development and performance, and its objectives and policies in managing the financial risks to which it is exposed and its capital are discussed in the Business Review.
The Directors have assessed, in the light of current and anticipated economic conditions, the Group’s ability to continue as a going concern. The Directors confirm they are satisfied that the Company and the Group have adequate resources to continue in business for the forseeable future. For this reason, they continue to adopt the ‘going concern’ basis for preparing accounts.
Statement of Directors’ responsibilities for accountsThe following statement, which should be read in conjunction with the Auditors’ report set out on page 72, is made with a view to distinguishing for shareholders the respective responsibilities of the Directors and of the auditors in relation to the accounts.
The Directors are required by the Companies Act 2006 to prepare accounts for each financial year and, with regards to Group accounts, in accordance with Article 4 of the IAS Regulation. The Directors have prepared individual accounts in accordance with IFRS as adopted by the European Union. The accounts are required by law and IFRS to present fairly the financial position of the Company and the Group and the performance for that period. The Companies Act 2006 provides, in relation to such accounts, that references to accounts giving a true and fair view are references to fair presentation.
The Directors consider that, in preparing the accounts on pages 74 to 79, and the additional information contained on pages 80 to 166, the Group has used appropriate accounting policies, supported by reasonable judgements and estimates, and that all accounting standards which they consider to be applicable have been followed.
The Directors have responsibility for ensuring that the Company and the Group keep accounting records which disclose with reasonable accuracy the financial position of the Company and the Group and which enable them to ensure that the accounts comply with the Companies Act 2006.
The Directors have general responsibility for taking such steps as are reasonably open to them to safeguard the assets of the Group and to prevent and detect fraud and other irregularities.
Disclosure controls and proceduresThe Chief Executive, Bob Diamond, and the Group Finance Director, Chris Lucas, conducted with Group Management an evaluation of the effectiveness of the design and operation of the Group’s disclosure controls and procedures as at 31st December 2010, which are defined as those controls and procedures designed to ensure that information required to be disclosed in reports filed or submitted under the US Securities Exchange Act of 1934 is recorded, processed, summarised and reported within the time periods specified in the US Securities and Exchange Commission’s rules and forms. As of the date of the evaluation, the Chief Executive and Group Finance Director concluded that the design and operation of these disclosure controls and procedures were effective.
The Directors confirm to the best of their knowledge that:
(a) The financial statements, prepared in accordance with the applicable set of accounting standards, give a true and fair view of the assets, liabilities, financial position and profit or loss of Barclays Bank PLC and the undertakings included in the consolidation taken as a whole; and
(b) The management report, which is incorporated into the Directors’ Report on pages 68 to 69, includes a fair review of the development and performance of the business and the position of Barclays Bank PLC and the undertakings included in the consolidation taken as a whole, together with a description of the principal risks and uncertainties that they face.
Signed on behalf of the Board
Marcus AgiusGroup Chairman 10th March 2011
Registered in England. Company No 1026167.
Directors and Officers and Statement ofDirectors’ responsibilities for accounts
Notesa Cathy Turner will leave the Group at the end of March 2011.b John Worth held the position of Interim Group Financial Controller during 2010.
70 Barclays Bank PLC Annual Report 2010 www.barclays.com/annualreport10

Presentation of information
Barclays Bank PLC is a public limited company registered in England under company number 1026167. The Bank was incorporated on 7th August 1925 under the Colonial Bank Act 1925 and on 4th October 1971 was registered as a company limited by shares under the Companies Acts 1948 to 1967. Pursuant to The Barclays Bank Act 1984, on 1st January 1985 the Bank was reregistered as a public limited company and its name was changed from Barclays Bank International Limited to Barclays Bank PLC.
All of the issued ordinary share capital of Barclays Bank PLC is owned by Barclays PLC.
BBA Code for Financial Reporting DisclosureIn September 2010, the British Bankers’ Association published a Code for Financial Reporting Disclosure. The Code sets out five disclosure principles together with supporting guidance. The principles are that UK banks will:
– provide high quality, meaningful and decision-useful disclosures;
– review and enhance their financial instrument disclosures for key areas of interest;
– assess the applicability and relevance of good practice recommendations to their disclosures acknowledging the importance of such guidance;
– seek to enhance the comparability of financial statement disclosures across the UK banking sector; and
– clearly differentiate in their annual reports between information that is audited and information that is unaudited.
Barclays PLC, the Parent Company of Barclays Bank PLC has adopted the BBA Code for Financial Reporting Disclosure and has prepared the 2010 Annual Report and Accounts in compliance with the Code.
The Group aims to continually enhance its disclosures and their usefulness to the readers of the financial statements in the light of developing market practice and areas of focus.
In particular, in 2010 we have refocused our financial statement disclosures to concentrate on material items and to reduce disclosures of immaterial items.
Please refer to the Barclays PLC Annual Report for the additional disclosure items arising from the adoption of the Code. Most significantly, additional information regarding the business model, more information on strategy, on critical accounting estimates, risk related information and a glossary of terms.
Differences between Barclays Bank PLC and the Parent Company – Barclays PLCBarclays Bank PLC is a wholly owned subsidiary of Barclays PLC, which is the Group’s ultimate parent company. The consolidated results and financial position of Barclays Bank PLC Group and Barclays PLC Group are materially the same, with the key differences being that, in accordance with IFRS:
- Barclays PLC shares held by the Group in employee share schemes and for trading purposes are deducted from reserves in Barclays PLC but recognised as available for sale and trading portfolio assets within Barclays Bank PLC; and
- Preference shares issued by Barclays Bank PLC are included within share capital and share premium in the Barclays Bank PLC Group but represent non-controlling interests in the Barclays PLC Group; and
- Certain issuances of reserve capital instruments and capital notes by Barclays Bank PLC are included within other shareholders’ equity in the Barclays Bank PLC Group, but represent non-controlling interests in Barclays PLC.
More extensive disclosures are contained in the Barclays PLC Annual Report for the year ended 31st December 2010, including risk exposures and business performance, which are materially the same as those in Barclays Bank PLC.
Presentation of information
Barclays Bank PLC Annual Report 2010 www.barclays.com/annualreport10 71

Independent Auditors’ report to the members of Barclays Bank PLC We have audited the financial statements of Barclays Bank PLC for the year ended 31 December 2010 which comprise: the Consolidated income statement and the related Consolidated statement of comprehensive income, Consolidated and Bank balance sheets, Consolidated and Bank Statements of changes in equity and Consolidated and Bank cash flow statements, the related notes and the parts of the Risk management section that are referenced as audited. The financial reporting framework that has been applied in their preparation is applicable law and International Financial Reporting Standards (IFRSs) as adopted by the European Union and, as regards the parent company financial statements, as applied in accordance with the provisions of the Companies Act 2006.
Respective responsibilities of directors and auditors As explained more fully in the Directors’ Responsibilities Statement, the directors are responsible for the preparation of the financial statements and for being satisfied that they give a true and fair view. Our responsibility is to audit and express an opinion on the financial statements in accordance with applicable law and International Standards on Auditing (UK and Ireland). Those standards require us to comply with the Auditing Practices Board’s Ethical Standards for Auditors.
This report, including the opinions, has been prepared for and only for the company’s members as a body in accordance with Chapter 3 of Part 16 of the Companies Act 2006 and for no other purpose. We do not, in giving these opinions, accept or assume responsibility for any other purpose or to any other person to whom this report is shown or into whose hands it may come save where expressly agreed by our prior consent in writing.
Scope of the audit of the financial statements An audit involves obtaining evidence about the amounts and disclosures in the financial statements sufficient to give reasonable assurance that the financial statements are free from material misstatement, whether caused by fraud or error. This includes an assessment of: whether the accounting policies are appropriate to the group’s and the parent company’s circumstances and have been consistently applied and adequately disclosed; the reasonableness of significant accounting estimates made by the directors; and the overall presentation of the financial statements.
Opinion on financial statements In our opinion:
– the financial statements give a true and fair view of the state of the group’s and of the parent company’s affairs as at 31 December 2010 and of the group’s profit and group’s and parent company’s cash flows for the year then ended;
– the group financial statements have been properly prepared in accordance with IFRSs as adopted by the European Union;
– the parent company financial statements have been properly prepared in accordance with IFRSs as adopted by the European Union and as applied in accordance with the provisions of the Companies Act 2006; and
– the financial statements have been prepared in accordance with the requirements of the Companies Act 2006.
Opinion on other matters prescribed by the Companies Act 2006 In our opinion the information given in the Directors’ Report for the financial year for which the financial statements are prepared is consistent with the financial statements.
Matters on which we are required to report by exception We have nothing to report in respect of the following matters where the Companies Act 2006 requires us to report to you if, in our opinion:
– adequate accounting records have not been kept by the parent company, or returns adequate for our audit have not been received from branches not visited by us; or
– the parent company financial statements are not in agreement with the accounting records and returns; or
– certain disclosures of directors’ remuneration specified by law are not made; or
– we have not received all the information and explanations we require for our audit
Andrew Ratcliffe (Senior Statutory Auditor)for and on behalf of PricewaterhouseCoopers LLPChartered Accountants and Statutory AuditorsLondon, United Kingdom10th March 2011
Independent Auditors’ report
Notes a The maintenance and integrity of the Barclays website is the responsibility of the Directors;
the work carried out by the Auditors does not involve consideration of these matters, and accordingly, the Auditors accept no responsibility for any changes that may have occurred to the financial statements since they were initially presented on the website.
b Legislation in the United Kingdom governing the preparation and dissemination of financial statements may differ from legislation in other jurisdictions.
72 Barclays Bank PLC Annual Report 2010 www.barclays.com/annualreport10

Independent Registered Public Accounting Firm’s report
Report of Independent Registered Public Accounting Firm To the Board of Directors and Shareholders of Barclays Bank PLC
In our opinion, the accompanying Consolidated income statement and the related Consolidated statement of comprehensive income, Consolidated balance sheets, Consolidated statements of changes in equity and Consolidated cash flow statements present fairly, in all material respects, the financial position of Barclays Bank PLC and its subsidiaries at 31 December 20010 and 31 December 2009, and the results of their operations and their cash flows for each of the three years in the period ended 31 December 2010 in conformity with International Financial Reporting Standards as issued by the International Accounting Standards Board. These financial statements are the responsibility of the Company’s management. Our responsibility is to express an opinion on these financial statements based on our audits. We conducted our audits of these statements in accordance with the standards of the Public Company Accounting Oversight Board (United States). Those standards require that we plan and perform the audit to obtain reasonable assurance about whether the financial statements are free of material misstatement. An audit includes examining, on a test basis, evidence supporting the amounts and disclosures in the financial statements, assessing the accounting principles used and significant estimates made by management, and evaluating the overall financial statement presentation. We believe that our audits provide a reasonable basis for our opinion.
PricewaterhouseCoopers LLPLondon, United Kingdom10th March 2011
Barclays Bank PLC Annual Report 2010 www.barclays.com/annualreport10 73

For the year ended 31st December The Group
Notes2010
£m2009
£m
Continuing operationsInterest income 2 20,035 21,236Interest expense 2 (7,517) (9,567)Net interest income 12,518 11,669Fee and commission income 3 10,368 9,946Fee and commission expense 3 (1,497) (1,528)Net fee and commission income 8,871 8,418Net trading income 4 8,080 6,994Net investment income 5 1,490 283Net premiums from insurance contracts 1,137 1,172Gains on debt buy backs and extinguishments – 1,249Other income 118 140Total income 32,214 29,925Net claims and benefits incurred on insurance contracts (764) (831)Total income net of insurance claims 31,450 29,094Impairment charges and other credit provisions 6 (5,672) (8,071)Net income 25,778 21,023Staff costs 7 (11,916) (9,948)Administration and general expenses 8 (6,581) (5,557)Depreciation of property, plant and equipment 19 (790) (759)Amortisation of intangible assets 18 (437) (447)Impairment of goodwill 18 (243) (1)Operating expenses (19,967) (16,712)Share of post-tax results of associates and joint ventures 58 34Profit on disposal of subsidiaries, associates and joint ventures 33 81 188Gain on Acquisitions 35 129 26Profit before tax from continuing operations 6,079 4,559Tax 9 (1,516) (1,047)Profit after tax from continuing operations 4,563 3,512Profit for the year from discontinued operations, including gain on disposal 34 – 6,777Profit after tax 4,563 10,289
Profit attributable to equity holders of the Parent from:Continuing operations 4,172 3,228Discontinued operations – 6,765Total 4,172 9,993Profit attributable to non-controlling interests 31 391 296
The Board of Directors approved the accounts set out on pages 74 to 166 on 10th March 2011.
Consolidated accounts Barclays Bank PLCConsolidated income statement
NoteAs permitted by section 408(3) of the Companies Act 2006 an income statement for the parent company has not been presented .
74 Barclays Bank PLC Annual Report 2010 www.barclays.com/annualreport10

For the year ended 31st December The Group
2010£m
2009£m
Profit after tax 4,563 10,289Other comprehensive income from continuing operations:Currency translation reserve- Currency translation differences 1,177 (853)- Tax – (2)Available for sale reserve- Net (losses)/gains from changes in fair value (152) 1,487- Net gains transferred to Net profit on disposal (1,020) (649)- Net losses transferred to net profit due to impairment 53 672- Changes in insurance liabilities 31 (67)- Net gains transferred to net profit due to fair value hedging (308) (123)- Tax 141 (177)Cash flow hedging reserve- Net gains from changes in fair value 601 285- Net gains transferred to net profit (684) (120)- Tax 39 (65)Other 59 217Other comprehensive income for the year, net of tax, from continuing operations (63) 605Other comprehensive income for the year, net of tax, from discontinued operations – (58)Total comprehensive income for the year 4,500 10,836
Attributable to:Equity holders of the Parent 3,609 10,286Non-controlling interests 891 550
4,500 10,836
Consolidated accounts Barclays BankPLCConsolidated statement of comprehensive income
Barclays Bank PLC Annual Report 2010 www.barclays.com/annualreport10 75

Consolidated accounts Barclays Bank PLCBalance sheet
As at 31st December The Group The Bank
Notes2010
£m2009
£m2010
£m2009
£m
Assets Cash and balances at central banks 97,630 81,483 92,686 78,447Items in the course of collection from other banks 1,384 1,593 1,268 1,373Trading portfolio assets 11 168,930 151,395 95,034 93,806Financial assets designated at fair value 12 41,485 42,568 29,181 27,645Derivative financial instruments 13 420,319 416,815 441,145 429,895Loans and advances to banks 14 37,799 41,135 40,390 42,963Loans and advances to customers 14 427,942 420,224 522,936 512,128Reverse repurchase agreements and other similar secured lending 16 205,772 143,431 227,343 145,433Available for sale financial investments 15 65,440 56,651 45,221 36,574Current tax assets 9 196 349 161 221Prepayments, accrued income and other assets 5,269 6,358 14,495 5,197Investments in associates and joint ventures 17 518 422 181 164Investments in subsidiaries 32 - - 19,033 18,796Goodwill and intangible assets 18 8,697 8,795 4,110 4,181Property, plant and equipment 19 6,140 5,626 1,878 1,832Deferred tax assets 9 2,517 2,303 1,228 773Total assets 1,490,038 1,379,148 1,536,290 1,399,428Liabilities Deposits from banks 77,975 76,446 97,526 90,253Items in the course of collection due to other banks 1,321 1,466 1,270 1,384Customer accounts 345,802 322,455 453,826 444,519Repurchase agreements and other similar secured borrowing 16 225,534 198,781 214,207 165,195Trading portfolio liabilities 11 72,693 51,252 44,352 33,534Financial liabilities designated at fair value 20 97,729 87,881 97,042 83,546Derivative financial instruments 13 405,516 403,416 426,243 418,354Debt securities in issue 156,623 135,902 106,267 82,141Accruals, deferred income and other liabilities 21 13,233 14,241 17,570 6,423Current tax liabilities 9 646 964 126 277Subordinated liabilities 22 28,499 25,816 26,994 24,893Deferred tax liabilities 9 514 470 3 38Provisions 23 947 590 651 464Retirement benefit liabilities 27 365 769 168 576Total liabilities 1,427,397 1,320,449 1,486,245 1,351,597Shareholders’ equity Shareholders’ equity excluding non-controlling interests 59,174 55,925 50,045 47,831Non-controlling interests 31 3,467 2,774 - - Total shareholders’ equity 62,641 58,699 50,045 47,831Total liabilities and shareholders’ equity 1,490,038 1,379,148 1,536,290 1,399,428
Marcus AgiusGroup Chairman
Bob DiamondGroup Chief Executive
Chris LucasGroup Finance Director
76 Barclays Bank PLC Annual Report 2010 www.barclays.com/annualreport10

The Group Called upshare
capital andshare
premiuma
£m
Availablefor sale
reserveb
£m
Cash flowhedgingreserveb
£m
Currencytranslation
reserveb
£m
Othershare-
holders'equityc
£m
Retainedearnings
£mTotal
£m
Non-controlling
interests£m
Totalequity
£m
Balance as at 1st January 2010 14,494 (84) 252 1,615 2,559 37,089 55,925 2,774 58,699Profit after tax - - - - - 4,172 4,172 391 4,563Other comprehensive income net of tax:Currency translation movements - - - 742 - - 742 435 1,177Available for sale investments - (1,264) - - - - (1,264) 9 (1,255)Cash flow hedges - - (100) - - - (100) 56 (44)Other - - - - 45 14 59 - 59Total comprehensive income for the year - (1,264) (100) 742 45 4,186 3,609 891 4,500Equity settled share schemes - - - - - 830 830 - 830Vesting of Barclays PLC shares under share-based payment schemes - - - - - (718) (718) - (718)Capital injection from Barclays PLC - - - - - 1,214 1,214 - 1,214Dividends paid - - - - - (235) (235) (158) (393)Dividends on preference shares and other shareholders' equity - - - - - (645) (645) - (645)Net decrease in other shareholders’ equity arising on acquisitions, disposals and capital issuances - - - - (487) - (487) - (487)Other reserve movements - - - - (48) (271) (319) (40) (359)Balance as at 31st December 2010 14,494 (1,348) 152 2,357 2,069 41,450 59,174 3,467 62,641
Balance as at 1st January 2009 14,458 (1,249) 132 2,840 2,564 22,457 41,202 2,372 43,574Profit after tax - - - - - 9,993 9,993 296 10,289Other comprehensive income net of tax from continuing operations: Currency translation movements - - - (1,140) - - (1,140) 285 (855)Available for sale investments - 1,155 - - - - 1,155 (12) 1,143Cash flow hedges - - 119 - - - 119 (19) 100Other - - - - 47 170 217 - 217Other comprehensive income net of tax from discontinued operations - 10 - (85) - 17 (58) - (58)Total comprehensive income for the year - 1,165 119 (1,225) 47 10,180 10,286 550 10,836Issue of new ordinary shares 25 - - - - - 25 - 25Equity settled share schemes - - - - - 298 298 - 298Vesting of Barclays PLC shares under share-based payment schemes - - - - - (80) (80) - (80)Capital injection from Barclays PLC - - - - - 4,850 4,850 - 4,850Dividends paid - - - - - (103) (103) (132) (235)Dividends on preference shares and other shareholders' equity - - - - - (599) (599) - (599)Net increase/decrease in non-controlling interests arising on acquisitions, disposals and capital issuances - - - - - - - (82) (82)Other reserve movements 11 - 1 - (52) 86 46 66 112Balance as at 31st December 2009 14,494 (84) 252 1,615 2,559 37,089 55,925 2,774 58,699
Consolidated accounts Barclays Bank PLCConsolidated statement of changes in equity
Notes a For further details refer to Note 28. b For further details refer to Note 29. c For further details refer to Note 30.
Barclays Bank PLC Annual Report 2010 www.barclays.com/annualreport10 77

The Bank Called upshare
capital andshare
premiuma
£m
Availablefor sale
reserveb
£m
Cash flowhedgingreserveb
£m
Currencytranslation
reserveb
£m
Other share-
holders'equityc
£m
Retainedearnings
£m
Total equity
£m
Balance as at 1st January 2010 14,494 (6) 209 (309) 2,623 30,820 47,831Profit after tax - - - - - 2,518 2,518Other comprehensive income net of tax: Currency translation movements - - - 435 - - 435Available for sale investments - (259) - - - - (259)Cash flow hedges - - (170) - - - (170)Other - - - - 45 4 49Total comprehensive income for the year - (259) (170) 435 45 2,522 2,573Equity settled share schemes - - - - - 174 174Vesting of Barclays PLC shares under share-based payment schemes - - - - - (99) (99)Capital injection from Barclays PLC - - - - - 1,214 1,214Dividends paid - - - - - (235) (235)Dividends on preference shares and other shareholders equity - - - - - (645) (645)Net decrease in other shareholders' equity arising on acquisitions, disposals and capital issuances - - - - (487) - (487)Other - - - - (48) (233) (281)Balance as at 31st December 2010 14,494 (265) 39 126 2,133 33,518 50,045
Balance as at 1 January 2009 14,458 (233) 312 292 2,628 16,422 33,879Profit after tax - - - - - 10,219 10,219Other comprehensive income net of tax from continuing operations: Currency translation movements - - - (601) - - (601)Available for sale investments - 227 - - - - 227Cash flow hedges - - (103) - - - (103)Other - - - - 47 9 56Total comprehensive income for the year - 227 (103) (601) 47 10,228 9,798Issue of new ordinary shares 25 - - - - - 25Equity settled share schemes - - - - - 98 98Vesting of Barclays PLC shares under share-based payment schemes - - - - - (59) (59)Capital injection from Barclays PLC - - - - - 4,850 4,850Dividends paid - - - - - (103) (103)Dividends on preference shares and other shareholders equity - - - - - (599) (599)Other 11 - - - (52) (17) (58)Balance as at 31st December 2009 14,494 (6) 209 (309) 2,623 30,820 47,831
Consolidated accounts Barclays Bank PLCConsolidated statement of changes in equity continued
Notes a For further details refer to Note 28. b For further details refer to Note 29. c For further details refer to Note 30.
78 Barclays Bank PLC Annual Report 2010 www.barclays.com/annualreport10

Consolidated accounts Barclays Bank PLCConsolidated cash flow statement
For the year ended 31st December The Group The Bank
2010£m
2009£m
2010£m
2009£m
Continuing operations Reconciliation of profit before tax to net cash flows from operating activities: Profit before tax 6,079 4,559 2,251 3,158 Adjustment for non-cash items: Allowance for impairment 5,672 8,071 3,512 5,707 Depreciation, amortisation and impairment of property, plant, equipment and intangibles 1,346 1,196 590 523 Other provisions, including pensions 914 428 678 254 Net profit on disposal of investments and property, plant and equipment (1,057) (610) (958) (314)Net profit from disposal of subsidiaries (77) (191) (365) (71)Net gains on acquisitions (129) (26) (118) (26)Other non-cash movementsa (6,680) 4,224 (5,817) (1,376)Changes in Operating assets and Liabilities Net (increase)/decrease in loans and advances to banks and customers (63,212) 25,482 (95,403) 10,574 Net increase/(decrease) in deposits and debt securities in issue 63,699 (49,014) 89,718 (20,086)Net (increase)/decrease in derivative financial instruments (1,298) 3,321 (3,361) 3,047 Net (increase)/decrease in trading assets (17,517) 34,292 (1,211) 22,757 Net increase/(decrease) in trading liabilities 21,441 (8,222) 10,818 (5,894)Net decrease in financial investments 11,126 20,459 11,960 19,341 Net decrease/(increase) in other assets 1,366 (465) (9,193) (675)Net (decrease)/increase in other liabilities (2,521) (907) 10,064 (9,867)Corporate income tax paid (1,430) (1,176) (90) (99)Net Cash from Operating activities 17,722 41,421 13,075 26,953 Purchase of available for sale investments (76,418) (78,420) (69,792) (62,829)Proceeds from sale or redemption of available for sale investments 71,251 88,931 64,587 81,518 Net addition of intangible assets (217) (226) (125) (235)Purchase of property, plant and equipment (1,767) (1,150) (732) (514)Proceeds from sale of property, plant and equipment 556 372 293 119 Acquisitions of subsidiaries, net of cash acquired 886 (28) - (8)Disposal of subsidiaries, net of cash disposed 81 339 - 92 Disposal of discontinued operation, net of cash disposed - 2,469 - 8,246 Other cash flows associated with investing activities 1 (27) (17) (49)Investment in subsidiaries - - 364 (2,053)Net Cash from investing activities (5,627) 12,260 (5,422) 24,287 Dividends paid (1,011) (590) (235) (103)Proceeds of borrowings and issuance of debt securities 2,131 3,549 2,038 2,882 Repayments of borrowings and redemption of debt securities (1,211) (4,383) (1,075) (4,137)Net issue of shares and other equity instruments - 14 - 25 Capital injection from Barclays PLC 1,214 800 1,214 800 Net Cash from financing activities 1,123 (610) 1,942 (533)Effect of exchange rates on cash and cash equivalents 3,842 (2,864) 3,057 (2,394)Net cash from discontinued operations - (376) - - Net increase in cash and cash equivalents 17,060 49,831 12,652 48,313 Cash and cash equivalents at beginning of year 114,340 64,509 96,357 48,044 Cash and cash equivalents at end of year 131,400 114,340 109,009 96,357 Cash and cash equivalents comprise: Cash and balances at central banks 97,630 81,483 92,686 78,447 Loans and advances to banks with original maturity less than three months 31,934 30,461 15,989 17,690 Available for sale treasury and other eligible bills with original maturity less than three months 1,667 2,244 165 68 Trading portfolio assets with original maturity less than three months 169 152 169 152 131,400 114,340 109,009 96,357
Interest received in 2010 was £28,631m (2009: £32,437m) and interest paid in 2010 was £20,759m (2009: £20,889m).
The Group is required to maintain balances with central banks and other regulatory authorities and these amounted to £2,310m at 31st December 2010 (2009: £2,470m).
Notea Other non-cash movements principally comprise movements in exchange rates and the fair value of available for sale investments less subordinated debt hedging.
Barclays Bank PLC Annual Report 2010 www.barclays.com/annualreport10 79

Notes to the financial statementsFor the year ended 31st December 2010 continued
1 Significant accounting policies1. Reporting entityThese financial statements are prepared for the Barclays Bank PLC Group under Section 399 of the Companies Act 2006. The Group is a major global financial services provider engaged in retail and commercial banking, credit cards, investment banking, wealth management and investment management services. In addition, individual financial statements have been prepared for the holding company, Barclays Bank PLC (the Bank). Barclays Bank PLC is a public limited company, incorporated and domiciled in England and Wales having a registered office in England and is the holding company of the Group.
2. Compliance with International Financial Reporting Standards
The consolidated financial statements of the Barclays Bank PLC Group, and the individual financial statements of Barclays Bank PLC, have been prepared in accordance with International Financial Reporting Standards (IFRS) and interpretations issued by the IFRS Interpretations Committee (IFRIC), as published by the International Accounting Standards Board (IASB). They are also in accordance with IFRS and IFRIC interpretations as adopted by the European Union. The principal accounting policies applied in the preparation of the consolidated and individual financial statements are set out below. These policies have been consistently applied. Changes in accounting policy are set out on page 91.
3. Basis of preparationThe consolidated and individual financial statements have been prepared under the historical cost convention modified to include the fair valuation of investment property, certain financial instruments and contracts to buy or sell non-financial items and trading inventories to the extent required or permitted under accounting standards and as set out in the relevant accounting policies. They are stated in millions of pounds Sterling (£m), the functional currency of Barclays Bank PLC.
Critical accounting estimates The preparation of financial statements in accordance with IFRS requires the use of estimates. It also requires management to exercise judgement in applying the accounting policies. Note 45 (Critical accounting estimates) sets out the key areas involving a higher degree of judgement or complexity, or areas where assumptions are significant to the consolidated and individual financial statements.
4. Consolidation SubsidiariesThe consolidated financial statements combine the financial statements of Barclays Bank PLC and all its subsidiaries, including certain special purpose entities (SPEs) where appropriate, made up to 31st December. Entities qualify as subsidiaries where the Group has the power to govern the financial and operating policies of the entity so as to obtain benefits from its activities, generally accompanying a shareholding of more than one half of the voting rights.
The existence and effect of potential voting rights that are currently exercisable or convertible are considered in assessing whether the Group controls another entity. Details of the principal subsidiaries are given in Note 32. SPEs are consolidated when the substance of the relationship between the Group and that entity indicates control. Potential indicators of control include, amongst others, an assessment of the Group’s exposure to the risks and benefits of the SPE. This assessment of risks and benefits is based on arrangements in place and the assessed risk exposures at inception. The initial assessment is reconsidered at a later date if:
a) the Group acquires additional interests in the entity;
b) the contractual arrangements of the entity are amended such that the relative exposure to risks and benefits change; or
c) if the Group acquires control over the main operating and financial decisions of the entity.
Subsidiaries are consolidated from the date on which control is transferred to the Group and cease to be consolidated from the date that control ceases.
The acquisition method of accounting is used to account for the purchase of subsidiaries. The consideration transferred for the acquisition of a subsidiary is measured at the fair value of the assets given, equity instruments issued and liabilities incurred or assumed.
The consideration transferred includes the fair value of any asset or liability resulting from a contingent consideration arrangement. Acquisition related costs are expensed as incurred.
The excess of the consideration paid in an acquisition over the Group’s share of the fair value of the identifiable net assets acquired is recorded as goodwill. See accounting policy 14 for the accounting policy for goodwill. A gain on acquisition is recognised in profit or loss if there is an excess of the Group’s share of the fair value of the identifiable net assets acquired over the cost of the consideration paid. Intra-group transactions and balances are eliminated on consolidation and consistent accounting policies are used throughout the Group for the purposes of the consolidation. Changes in ownership interests in subsidiaries are accounted for as equity transactions if they occur after control has already been obtained and they do not result in loss of control.
As the consolidated financial statements include partnerships where the Group member is a partner, advantage has been taken of the exemption under Regulation 7 of the Partnerships (Accounts) Regulations 2008 with regard to the preparation and filing of individual partnership financial statements.
In the individual financial statements, investments in subsidiaries are stated at cost less impairment, if any. Cost also includes directly attributable costs of the investment.
When the Group ceases to have control, any retained interests in the subsidiary is remeasured to its fair value, with the change in carrying amount recognised in profit or loss.
80 Barclays Bank PLC Annual Report 2010 www.barclays.com/annualreport10

1 Significant accounting policies continuedAssociates and joint venturesAn associate is an entity in which the Group has significant influence, but not control, over the operating and financial management policy decisions. This is generally demonstrated by the Group holding in excess of 20%, but no more than 50%, of the voting rights.
A joint venture exists where the Group has a contractual arrangement with one or more parties to undertake activities typically, though not necessarily, through entities which are subject to joint control.
Unless designated as at fair value through profit and loss as set out in policy 7, the Group’s investments in associates and joint ventures are initially recorded at cost and increased (or decreased) each year by the Group’s share of the post-acquisition profit (or loss), or other movements reflected directly in the other comprehensive income of the associated or jointly controlled entity. Goodwill arising on the acquisition of an associate or joint venture is included in the carrying amount of the investment (less any accumulated impairment loss). When the Group’s share of losses or other reductions in equity in an associate or joint venture equals or exceeds the recorded interest, including any other unsecured receivables, the Group does not recognise further losses, unless it has incurred obligations or made payments on behalf of the entity.
The Group’s share of the results of associates and joint ventures is based on financial statements made up to a date not earlier than 3 months before the balance sheet date, adjusted to conform with the accounting polices of the Group. Unrealised gains on transactions are eliminated to the extent of the Group’s interest in the investee. Unrealised losses are also eliminated unless the transaction provides evidence of impairment in the asset transferred.
In the individual financial statements, investments in associates and joint ventures are stated at cost less impairment, if any.
5. Foreign currency translationThe presentation currency of the Group financial statements is pounds sterling (£), which is also the functional currency of Barclays PLC and Barclays Bank PLC.
Items included in the financial statements of each of the Group’s foreign entities are measured using their functional currency, being the currency of the primary economic environment in which they operate.
Foreign currency transactions are translated into the appropriate functional currency using the exchange rates prevailing at the dates of the transactions. Monetary items denominated in foreign currencies are retranslated at the rate prevailing at the period end. Foreign exchange gains and losses resulting from the retranslation and settlement of these items are recognised in the income statement except for qualifying cash flow hedges or hedges of net investments. See policy 12 for the policies on hedge accounting. Non-monetary assets that are measured at fair value are translated using the exchange rate at the date that the fair value was determined. Exchange differences on equities and similar non-monetary items held at fair value through profit or loss, are reported as part of the fair value gain or loss. Translation differences on equities classified as available for sale financial assets and similar non-monetary items are included directly in equity. For the purposes of translation into the presentational currency of the Group financial statements, assets, liabilities and equity of foreign operations are translated at the closing rate, and items of income and expense are translated into Sterling at the rates prevailing on the dates of the transactions. The exchange differences arising on the translation of a foreign operation are included in cumulative translation reserves within shareholders’ equity and included in profit or loss when the Group loses control of, joint control of or significant influence over or on partial disposal of the operation. Goodwill and fair value adjustments arising on the acquisition of foreign subsidiaries are maintained in the functional currency of the foreign operation, translated at the closing rate and are included in hedges of net investments where appropriate.
6. Interest, fees and commissionsInterestInterest is recognised in interest income and interest expense in the income statement for all interest bearing financial instruments classified as held to maturity, available for sale or other loans and receivables using the effective interest method.
The effective interest method is a method of calculating the amortised cost of a financial asset or liability (or group of assets and liabilities) and of allocating the interest income or interest expense over the relevant period. The effective interest rate is the rate that exactly discounts the expected future cash payments or receipts through the expected life of the financial instrument or, when appropriate, a shorter period, to the net carrying amount of the instrument. The application of the method has the effect of recognising income (and expense) receivable (or payable) on the instrument evenly in proportion to the amount outstanding over the period to maturity or repayment.
In calculating effective interest the Group estimates cash flows (using projections based on its experience of customers’ behaviour) considering all contractual terms of the financial instrument but excluding future credit losses. Fees, including those for early redemption, are included in the calculation to the extent that they can be measured and are considered to be an integral part of the effective interest rate. Cash flows arising from the direct and incremental costs of issuing financial instruments are also taken into account in the calculation. Where it is not possible to otherwise estimate reliably the cash flows or the expected life of a financial instrument, effective interest is calculated by reference to the payments or receipts specified in the contract, and the full contractual term.
Barclays Bank PLC Annual Report 2010 www.barclays.com/annualreport10 81

Notes to the financial statementsFor the year ended 31st December 2010 continued
1 Significant accounting policies continuedFees and commissions Unless included in the effective interest calculation, fees and commissions are recognised as the service is provided. Fees and commissions not integral to effective interest arising from negotiating, or participating in the negotiation of a transaction from a third party, such as the acquisition of loans, shares or other securities or the purchase or sale of businesses, are recognised on completion of the underlying transaction. Portfolio and other management advisory and service fees are recognised based on the applicable service contracts. Asset management fees related to investment funds are recognised over the period the service is provided. The same principle is applied to the recognition of income from wealth management, financial planning and custody services that are continuously provided over an extended period of time.
Commitment fees, together with related direct costs, for loan facilities where draw down is probable are deferred and recognised as an adjustment to the effective interest on the loan once drawn. Commitment fees in relation to facilities where draw down is not probable are recognised over the term of the commitment.
Insurance premiumsInsurance premiums are recognised in the period earned.
Net trading incomeIncome arises from both the sale and purchase of trading positions, margins, which are achieved through market-making and customer business and from changes in fair value caused by movements in interest and exchange rates, equity prices and other market variables. Trading positions are held at fair value and the resulting gains and losses are included in the income statement, together with interest and dividends arising from long and short positions and funding costs relating to trading activities.
DividendsDividends are recognised when the right to receive payment is established. In the individual financial statements of Barclays Bank PLC, this is when the dividends are received or when the dividends are appropriately authorised by the subsidiary.
7. Financial assets and liabilities Financial assetsThe classifications of financial assets, and the accounting policies applicable to each classification, are as follows:
Financial instruments at fair value through profit or loss Financial instruments are classified in this category if they are held for trading, or if they are designated by management under the fair value option. Instruments are classified as held for trading if they are:a) acquired principally for the purposes of selling or repurchasing in the near term;b) part of a portfolio of identified financial instruments that are managed together and for which there is evidence of a recent actual pattern of short-term profit taking; orc) a derivative, except for a derivative that is a financial guarantee contract or a designated and effective hedging instrument.
It is not possible to transfer a financial instrument out of this category whilst it is held or issued with the exception, from 1st July 2008, of non-derivative financial assets held for trading which may be transferred out of this category after initial classification where:a) in rare circumstances, they are no longer held for the purpose of selling or repurchasing in the near term, orb) they are no longer held for the purpose of trading, and they would have met the definition of loans and receivables on initial classification and the Group has the intention and ability to hold them for the foreseeable future or until maturity.
Financial instruments included in this category are recognised initially at fair value and transaction costs are taken directly to the income statement. Gains and losses arising from changes in fair value are included directly in the income statement.
The fair value option is used in the following circumstances:a) financial assets backing insurance contracts and financial assets backing investment contracts are designated at fair value through profit or loss because the related liabilities have cash flows that are contractually based on the performance of the assets or the related liabilities are insurance contracts whose measurement incorporates current information. Fair valuing the assets through profit and loss significantly reduces the recognition inconsistencies that would arise if the financial assets were classified as available for sale;b) financial assets, loans to customers, financial liabilities, financial guarantees and structured notes may be designated at fair value through profit or loss if they contain substantive embedded derivatives;c) financial assets, loans to customers, financial liabilities, financial guarantees and structured notes may be designated at fair value through profit or loss where doing so significantly reduces measurement inconsistencies that would arise if the related derivatives were treated as held for trading and the underlying financial instruments were carried at amortised cost; andd) certain private equity and other investments that are managed, and evaluated on a fair value basis in accordance with a documented risk management or investment strategy and reported to key management personnel on that basis.
Regular way purchases and sales of financial instruments held for trading or designated under the fair value option are recognised on trade date, being the date on which the Group commits to purchase or sell the asset.
82 Barclays Bank PLC Annual Report 2010 www.barclays.com/annualreport10

1 Significant accounting policies continuedLoans and receivablesLoans and receivables are non-derivative financial assets with fixed or determinable payments that are not quoted in an active market and which are not classified as available for sale. Loans and receivables are initially recognised at fair value, including direct and incremental transaction costs. They are subsequently valued at amortised cost, using the effective interest method (see accounting policy 6).
Regular way purchases and sales of loans and receivables are recognised on contractual settlement.
Held to maturityHeld to maturity investments are non-derivative financial assets with fixed or determinable payments that the Group’s management has the intention and ability to hold to maturity. They are initially recognised at fair value including direct and incremental transaction costs. They are subsequently valued at amortised cost, using the effective interest method (see accounting policy 6).
Regular way purchases of held to maturity financial assets are recognised on trade date, being the date on which the Group commits to purchase the asset.
Available for saleAvailable for sale assets are non-derivative financial assets that are designated as available for sale and are not categorised into any of the other categories described above. They are initially recognised at fair value including direct and incremental transaction costs. They are subsequently held at fair value. Gains and losses arising from changes in fair value are included as a separate component of equity (the available for sale reserve) until sale when the cumulative gain or loss is transferred to the income statement. Interest on debt instruments, determined using the effective interest method (see accounting policy 6), dividends on equity instruments, impairment losses and translation differences on monetary items are recognised in the income statement.
Regular way purchases and sales of available for sale financial instruments are recognised on trade date, being the date on which the Group commits to purchase or sell the asset.
A financial asset classified as available for sale that would have met the definition of loans and receivables may only be transferred from the available for sale classification where the Group has the intention and the ability to hold the asset for the foreseeable future or until maturity.
Embedded derivativesSome contracts (‘hybrid contracts’) contain both a derivative (the ‘embedded derivative’)and a non-derivative (the ‘host contract’). Where the economic characteristics and risks of the embedded derivatives are not closely related to those of the host contract, and the host contract itself is not carried at fair value through profit or loss, the embedded derivative is bifurcated and reported at fair value and gains and losses are recognised in the income statement.
Derecognition of financial assetsThe Group derecognises a financial asset, or a portion of a financial asset, where the contractual rights to that asset have expired, or where the rights to further cash flows from the asset have been transferred to a third party and, with them, either:(i) substantially all the risks and rewards of the asset; or(ii) significant risks and rewards, along with the unconditional ability to sell or pledge the asset.Where significant risks and rewards have been transferred, but the transferee does not have the unconditional ability to sell or pledge the asset, the Group continues to account for the asset to the extent of its continuing involvement (‘continuing involvement accounting’).To assess the extent to which risks and rewards have been transferred, it is often necessary to perform a quantitative analysis. Such an analysis will compare the Group’s exposure to variability in asset cash flows before the transfer with its retained exposure after the transfer.Where neither derecognition nor continuing involvement accounting is appropriate, the Group continues to recognise the asset in its entirety and recognises any consideration received as a financial liability.
Loan commitmentsLoan commitments, where the Group has a past practice of selling the resulting assets shortly after origination, are held at fair value through profit or loss. Other loan commitments are accounted for in accordance with accounting policy 23.
Financial liabilitiesFinancial liabilities are measured at amortised cost, except for trading liabilities and liabilities designated at fair value, which are held at fair value through profit or loss. Financial liabilities are derecognised when extinguished.
An exchange of an existing debt instrument for a new instrument with the lender on substantially different terms is accounted for as an extinguishment of the original financial liability and the recognition of a new financial liability. An assessment is made as to whether the terms are substantially different considering qualitative and quantitive characteristics. For example, if the discounted present value calculated using the original effective interest rate of the cash flows under the new terms, including fees, is at least 10 % different from the discounted present value of the remaining cash flows of the original financial liability, or if the qualitative assessment concludes that the nature and risk profile of the original financial liability is materially different from that of the new financial liability based on the terms of the instruments including repayment terms, coupon terms and call options, the original financial liability is extinguished.
When an exchange is accounted for as an extinguishment, any costs or fees incurred are recognised as part of the gain or loss on the extinguishment. The difference between the carrying amount of a financial liability extinguished or transferred to another party and the consideration paid, including any non-cash assets transferred or liabilities assumed, is recognised in profit or loss.
Barclays Bank PLC Annual Report 2010 www.barclays.com/annualreport10 83

Notes to the financial statementsFor the year ended 31st December 2010 continued
1 Significant accounting policies continuedDetermining fair valueWhere the classification of a financial instrument requires it to be stated at fair value, fair value is determined by reference to a quoted market price for that instrument or by using a valuation model. Where the fair value is calculated using valuation models, the methodology is to calculate the expected cash flows under the terms of each specific contract and then discount these values back to a present value. These models use as their basis independently sourced market parameters including, for example, interest rate yield curves, equities and commodities prices, option volatilities and currency rates. For financial liabilities measured at fair value, the carrying amount reflects the effect on fair value of changes in own credit spreads derived from observable market data, such as spreads on Barclays issued bonds or credit default swaps. Most market parameters are either directly observable or are implied from instrument prices. The model may perform numerical procedures in the pricing such as interpolation when input values do not directly correspond to the most actively traded market trade parameters. However, where valuations include significant unobservable inputs, the transaction price is deemed to provide the best evidence of initial fair value for accounting purposes. As such, profits or losses are recognised upon trade inception only when such profits can be measured solely by reference to observable market data. For valuations that include significant unobservable inputs, the difference between the model valuation and the initial transaction price is recognised in profit or loss, either:
a) on a straight-line basis over the term of the transaction, or over the period until all model inputs will become observable where appropriate, or;b) released in full when previously unobservable inputs become observable.
Various factors influence the availability of observable inputs and these may vary from product to product and change over time. Factors include, for example, the depth of activity in the relevant market, the type of product, whether the product is new and not widely traded in the marketplace, thematurity of market modelling and the nature of the transaction (bespoke or generic). To the extent that valuation is based on models or inputs that are not observable in the market, the determination of fair value can be more subjective, dependant on the significance of the unobservable input to the overall valuation. Unobservable inputs are determined based on the best information available, for example by reference to similar assets, similar maturities or other analytical techniques.
8. Impairment of financial assetsThe Group assesses at each balance sheet date whether there is objective evidence that loans and receivables or available for sale financial investments are impaired. These are considered to be impaired and impairment losses are recognised if, and only if, there is objective evidence of impairment as a result of one or more loss events that occurred after the initial recognition of the asset and prior to the balance sheet date that have adversely impacted the estimated future cash flows of the financial asset or the portfolio. The criteria that the Group uses to determine that there is objective evidence of an impairment loss include:
a) significant financial difficulty of the issuer or obligor;b) a breach of contract, such as a default or delinquency in interest or principal payments;c) the lender, for economic or legal reasons relating to the borrower’s financial difficulty, granting to the borrower a concession that the lender would not otherwise consider;d) it becomes probable that the borrower will enter bankruptcy or other financial reorganisation;e) the disappearance of an active market for that financial asset because of financial difficulties; orf) observable data indicating that there is a measurable decrease in the estimated future cash flows from a portfolio of financial assets since the initial recognition of those assets, although the decrease cannot yet be identified with the individual financial assets in the portfolio, including:
(i) adverse changes in the payment status of borrowers in the portfolio; and(ii) national or local economic conditions that correlate with defaults on the assets in the portfolio.
For loans and receivables the Group first assesses whether objective evidence of impairment exists individually for loans and receivables that are individually significant, and individually or collectively for loans and receivables that are not individually significant. If the Group determines that no objective evidence of impairment exists for an individually assessed loan and receivable, whether significant or not, it then includes the asset in a group of loans and receivables with similar credit risk characteristics and collectively assesses them for impairment. Loans and receivables that are individually assessed for impairment and for which an impairment loss is or continues to be recognised are not included in a collective assessment of impairment. The amount of impairment loss is measured as the difference between the asset’s carrying amount and the present value of estimated future cash flows discounted at the asset’s original effective interest rate. The amount of the loss is recognised using an allowance account and recognised in the income statement.
Where appropriate, the calculation of the present value of the estimated future cash flows of a collateralised loan and receivable asset reflect the cash flows that may result from foreclosure costs for obtaining and selling the collateral, whether or not foreclosure is probable.
For the purposes of a collective evaluation of impairment, loans and receivables are grouped on the basis of similar risk characteristics, taking into account asset type, industry, geographical location, collateral type, past due status and other relevant factors. These characteristics are relevant to the estimation of future cash flows for groups of such assets by being indicative of the counterparty’s ability to pay all amounts due according to the contractual terms of the assets being evaluated.
Future cash flows in a group of loans and receivables that are collectively evaluated for impairment are estimated on the basis of the contractual cash flows of the assets in the group and historical loss experience for assets with credit risk characteristics similar to those in the group. Historical loss experience is adjusted based on current observable data to reflect the effects of current conditions that did not affect the period on which the historical loss experience is based and to remove the effects of conditions in the historical period that do not currently exist.
84 Barclays Bank PLC Annual Report 2010 www.barclays.com/annualreport10

1 Significant accounting policies continuedThe methodology and assumptions used for estimating future cash flows are reviewed regularly to reduce any differences between loss estimates and actual loss experience.
Following impairment, interest income is recognised using the effective rate of interest which was used to discount the future cash flows for the purpose of measuring the impairment loss.
When a loan is uncollectable, it is written off against the related allowance for loan impairment. Such loans are written off after all the necessary procedures have been completed and the amount of the loss has been determined. Subsequent recoveries of amounts previously written off are credited to the income statement.
If, in a subsequent period, the amount of the impairment loss decreases and the decrease can be related objectively to an event occurring after the impairment was recognised, the previously recognised impairment loss is reversed by adjusting the allowance account. The amount of the reversal is recognised in the income statement.
Equity securities or properties acquired in exchange for loans in order to achieve an orderly realisation are accounted for as a disposal of the loan and an acquisition of equity securities or investment properties. Where control is obtained over an entity as a result of the transaction, the entity is consolidated. Any further impairment of the assets or business acquired is treated as an impairment of the relevant asset or business and not as an impairment of the original instrument.
In the case of available for sale equity securities, a significant or prolonged decline in the fair value of the security below its cost is also considered in determining whether impairment exists. Where such evidence exists, the cumulative net loss that has been previously recognised directly in equity is removed from equity and recognised in the income statement. In the case of debt instruments classified as available for sale, impairment is assessed based on the same criteria as all other financial assets.
Reversals of impairment of debt instruments are recognised in the income statement. Reversals of impairment of equity shares are not recognised in the income statement, increases in the fair value of equity shares after impairment are recognised directly in equity.
9. Sale and repurchase agreements and other similar secured lending and borrowingSecurities may be sold subject to a commitment to repurchase them (a repo). Such securities are retained on the balance sheet when substantially all the risks and rewards of ownership remain with the Group. The transactions are treated as collateralised borrowing and the counterparty liability is presented separately on the balance sheet as repurchase agreements and other similar secured borrowing. Similar secured borrowing transactions including securities lending transactions and collateralized short-term notes are treated and presented in the same way.
Similarly, the Group borrows or purchases securities subject to a commitment to resell them (a reverse repo). Such securities are not included on balance sheet as the Group does not acquire the risks and rewards of ownership. The transactions are treated as collateralised loans and the counterparty asset is presented separately on the balance sheet as reverse repurchase agreements and other similar secured lending. Where the Group enters into similar secured lending transactions, such as securities borrowing, these are also treated and presented in the same way.
These secured financing transaction are initially recognised at fair value, and subsequently valued at amortised cost, using the effective interest method. Securities lent to counterparties are retained in the financial statements. Securities borrowed are not recognised in the financial statements, unless these are sold to third parties, at which point the obligation to repurchase the securities is recorded as a trading liability at fair value
10. Securitisation transactionsThe Group enters into securitisation transactions in respect of its own financial assets and to facilitate client transactions as described in Note 36 to the accounts.
All financial assets continue to be held on the Group balance sheet, and a liability recognised for the proceeds of the funding transaction, unless:
a) substantially all the risks and rewards associated with the financial instruments have been transferred, in which case, the assets are derecognised in full; or
b) if a significant portion, but not all, of the risks and rewards have been transferred, the asset is derecognised entirely if the transferee has the ability to sell the financial asset, otherwise the asset continues to be recognised only to the extent of the Group’s continuing involvement.
Where a) or b) above applies to a fully proportionate share of all or specifically identified cash flows, the relevant accounting treatment is applied to that proportion of the asset.
11. Collateral and nettingThe Group enters into master agreements with counterparties whenever possible and, when appropriate, obtains collateral. Master agreements provide that, if an event of default occurs, all outstanding transactions with the counterparty will fall due and all amounts outstanding will be settled on a net basis.
CollateralThe Group obtains collateral in respect of customer liabilities where this is considered appropriate. The collateral normally takes the form of a lien over the customer’s assets and gives the Group a claim on these assets for both existing and future customer liabilities.
Barclays Bank PLC Annual Report 2010 www.barclays.com/annualreport10 85

Notes to the financial statementsFor the year ended 31st December 2010 continued
1 Significant accounting policies continuedThe Group also receives collateral in the form of cash or securities in respect of other credit instruments, such as stock borrowing contracts, and derivative contracts in order to reduce credit risk. Collateral received in the form of securities is not recorded on the balance sheet. Cash collateral received is recorded on the balance sheet with a corresponding liability within deposits received from banks or customers. Any interest payable or receivable arising is recorded as interest expense or interest income respectively except for funding costs relating to trading activities which are recorded in net trading income.
NettingFinancial assets and liabilities are offset and the net amount reported on the balance sheet if, and only if, there is a legally enforceable right to set off the recognised amounts and there is an intention to settle on a net basis, or to realise an asset and settle the liability simultaneously. In many cases, even though master netting agreements are in place, the lack of an intention to settle on a net basis results in the related assets and liabilities being presented gross on the balance sheet.
12. Hedge accountingDerivatives are used to hedge interest rate, exchange rate, commodity, and equity exposures and exposures to certain indices such as house price indices and retail price indices related to non-trading positions. Where derivatives are held for risk management purposes, and when transactions meet the required criteria, the Group applies fair value hedge accounting, cash flow hedge accounting, or hedging of a net investment in a foreign operation as appropriate to the risks being hedged. When a financial instrument is designated as a hedge, the Group formally documents the relationship between the hedging instrument and hedged item as well as its risk management objectives and its strategy for undertaking the various hedging transactions. The Group also documents its assessment, both at hedge inception and on an ongoing basis, of whether the derivatives that are used in hedging transactions are highly effective in offsetting changes in fair values or cash flows of hedged items.
The Group discontinues hedge accounting when:a) it is determined that a derivative is not, or has ceased to be, highly effective as a hedge;
b) the derivative expires, or is sold, terminated, or exercised;
c) the hedged item matures or is sold or repaid; or
d) a forecast transaction is no longer deemed highly probable.
In certain circumstances, the Group may decide to cease hedge accounting even though the hedge relationship continues to be highly effective by no longer designating the financial instrument as a hedging instrument. To the extent that the changes in the fair value of the hedging derivative differ from changes in the fair value of the hedged risk in the hedged item, or the cumulative change in the fair value of the hedging derivative differs from the cumulative change in the fair value of expected future cash flows of the hedged item, the hedge is deemed to include ineffectiveness. The amount of ineffectiveness, provided it does not disqualify the hedge for hedge accounting, is recorded in the income statement.
Fair value hedge accountingChanges in fair value of derivatives that qualify and are designated as fair value hedges are recorded in the income statement, together with changes in the fair value of the hedged asset or liability that are attributable to the hedged risk.
If the hedge relationship no longer meets the criteria for hedge accounting, it is discontinued. For fair value hedges of interest rate risk, the fair value adjustment to the hedged item is amortised to the income statement over the period to maturity of the previously designated hedge relationship using the effective interest method.
If the hedged item is sold or repaid, the unamortised fair value adjustment is recognised immediately in the income statement.
Cash flow hedgesFor qualifying cash flow hedges, the fair value gain or loss associated with the effective portion of the cash flow hedge is recognised initially in shareholders’ equity, and recycled to the income statement in the periods when the hedged item will affect profit or loss. Any ineffective portion of the gain or loss on the hedging instrument is recognised in the income statement immediately.
When a hedging instrument expires or is sold, or when a hedge no longer meets the criteria for hedge accounting, any cumulative gain or loss existing in equity at that time remains in equity and is recognised when the hedged item is ultimately recognised in the income statement. When a forecast transaction is no longer expected to occur, the cumulative gain or loss that was recognised in equity is immediately transferred to the income statement.
Hedges of net investmentsHedges of net investments in foreign operations, including monetary items that are accounted for as part of the net investment, are accounted for similarly to cash flow hedges; the effective portion of the gain or loss on the hedging instrument is recognised directly in equity and the ineffective portion is recognised immediately in the income statement. The cumulative gain or loss previously recognised in equity is recognised in the income statement on the disposal or partial disposal of the foreign operation, or other reductions in the Group’s investment in the operation
Hedges of net investments may include non-derivative liabilities as well as derivative financial instruments.
Derivatives that do not qualify for hedge accountingDerivative contracts entered into as economic hedges that do not qualify for hedge accounting are held at fair value through profit or loss.
86 Barclays Bank PLC Annual Report 2010 www.barclays.com/annualreport10

1 Significant accounting policies continued13. Property, plant and equipmentProperty, plant and equipment is stated at cost less accumulated depreciation and provisions for impairment, if required. Cost includes the original purchase price of the asset and the costs directly attributable to bringing the asset to its working condition for its intended use. Additions and subsequent expenditures are capitalised only to the extent that they enhance the future economic benefits expected to be derived from the assets.
Depreciation is provided on the depreciable amount of items of property, plant and equipment on a straight-line basis over their estimated useful economic lives. The depreciable amount is the gross carrying amount, less the estimated residual value at the end of its useful economic life.
The Group uses the following annual rates in calculating depreciation:
Freehold buildings and long-leasehold property (more than 50 years to run) 2-3.3%Computers and similar equipment 20-33%Fixtures and fittings and other equipment 10-20%Leased assets:Leasehold property over the remaining life of the lease (less than 50 years to run) Over the remaining life of the leaseCost of adaptation of freehold and leasehold property a 7-10%Equipment installed in freehold and leasehold property a 7-10%
Depreciation rates, methods and the residual values underlying the calculation of depreciation of items of property, plant and equipment are kept under review to take account of any change in circumstances.
When deciding on depreciation rates and methods, the principal factors the Group takes into account are the expected rate of technological developments and expected market requirements for, and the expected pattern of usage of, the assets. When reviewing residual values, the Group estimates the amount that it would currently obtain for the disposal of the asset after deducting the estimated cost of disposal if the asset were already of the age and condition expected at the end of its useful economic life.
No depreciation is provided on freehold land, although, in common with all long-lived assets, it is subject to impairment testing, if deemed appropriate.
Gains and losses on disposals are determined by comparing the proceeds with the carrying amount and are recognised in the income statement.
Investment property is property held to earn rentals or for capital appreciation or for both rather than for sale or use in the business. The Group initially recognises investment properties at cost, and subsequently at their fair value at each balance sheet date reflecting market conditions at the reporting date. The fair value of investment property is determined by reference to current market prices for similar properties, adjusted as necessary for condition and location, or by reference to recent transactions updated to reflect current economic conditions. Discounted cash flow techniques may be employed to calculate fair value where there have been no recent transactions, using current external market inputs such as market rents and interest rates. Valuations are carried out by management with the support of appropriately qualified independent valuers.
Movements in fair value subsequent to initial recognition are included in the income statement. No depreciation is provided in respect of investment properties.
14. Intangible assetsGoodwillGoodwill arises on the acquisition of subsidiaries and associates and joint ventures, and represents the excess of the fair value of the purchase consideration over the fair value of the Group’s share of the assets acquired, and the liabilities and contingent liabilities assumed on the date of the acquisition.
For the purpose of calculating goodwill, fair values of acquired assets, liabilities and contingent liabilities are determined by reference to market values or other valuation methodologies including discounted cash flow techniques, using market rates or by using risk-free rates and risk-adjusted expected future cash flows. Goodwill is capitalised and reviewed annually for impairment, or more frequently when there are indications that impairment may have occurred. Goodwill is allocated to cash-generating units for the purpose of impairment testing. Goodwill on acquisitions of associates and joint ventures is included in the amount of the investment. Gains and losses on the disposal of an entity include the carrying amount of the goodwill relating to the entity sold.
Computer softwareComputer software is stated at cost, less amortisation and provisions for impairment, if required.
The identifiable and directly associated external and internal costs of acquiring and developing software are capitalised where the software is controlled by the Group, and where it is probable that future economic benefits that exceed its cost will flow from its use over more than one year. Costs associated with maintaining software are recognised as an expense when incurred.
Capitalised computer software is amortised over 3-5 years.
Notes a Where leasehold property has a remaining useful life of less than 15 years, costs of
adaptation and installed equipment are depreciated over the remaining life of the lease..
Barclays Bank PLC Annual Report 2010 www.barclays.com/annualreport10 87

Notes to the financial statementsFor the year ended 31st December 2010 continued
1 Significant accounting policies continuedOther intangible assetsOther intangible assets consist of brands, customer lists, licences and other contracts, core deposit intangibles and mortgage servicing rights. Other intangible assets are initially recognised when they are separable or arise from contractual or other legal rights, the cost can be measured reliably and, in the case of intangible assets not acquired in a business combination, where it is probable that future economic benefits attributable to the assets will flow from their use. The value of intangible assets which are acquired in a business combination is generally determined using income approach methodologies such as the discounted cash flow method and the relief from royalty method that estimate net cash flows attributable to an asset over its economic life and discount to present value using an appropriate rate of return based on the cost of equity adjusted for risk.
Other intangible assets are stated at cost less amortisation and provisions for impairment, if any, and are amortised over their useful lives in a manner that reflects the pattern to which they contribute to future cash flows, generally over 4-25 years.
15. Impairment of property, plant and equipment and intangible assetsAt each balance sheet date, or more frequently where events or changes in circumstances dictate, property, plant and equipment and intangible assets, are assessed for indications of impairment. If indications are present, these assets are subject to an impairment review. Goodwill is subject to an impairment review each year. The impairment review comprises a comparison of the carrying amount of the asset with its recoverable amount: the higher of the asset’s or the cash-generating unit’s fair value less costs to sell and its value in use. Fair value less costs to sell is calculated by reference to the amount at which the asset could be disposed of in a binding sale agreement in an arm’s length transaction evidenced by an active market or recent transactions for similar assets. Value in use is calculated by discounting the expected future cash flows obtainable as a result of the asset’s continued use, including those resulting from its ultimate disposal, at a market-based discount rate on a pre-tax basis.
The carrying values of fixed assets and goodwill are written down by the amount of any impairment and this loss is recognised in the income statement in the period in which it occurs. A previously recognised impairment loss relating to a fixed asset may be reversed in part or in full when a change in circumstances leads to a change in the estimates used to determine the fixed asset’s recoverable amount. The carrying amount of the fixed asset will only be increased up to the amount that it would have been had the original impairment not been recognised. Impairment losses on goodwill are not reversed. For the purpose of conducting impairment reviews, cash-generating units are the lowest level at which management monitors the return on investment on assets.
16. Financial guaranteesFinancial guarantee contracts are contracts that require the issuer to make specified payments to reimburse the holder for a loss it incurs because a specified debtor fails to make payments when due in accordance with the terms of a debt instrument.
Financial guarantees are initially recognised in the financial statements at fair value on the date that the guarantee was given. Other than where the fair value option is applied, subsequent to initial recognition, the Group’s liabilities under such guarantees are measured at the higher of the initial measurement, less amortisation calculated to recognise in the income statement any fee income earned over the period, and any financial obligation arising as a result of the guarantees at the balance sheet date, in accordance with policy 23.
Any increase in the liability relating to guarantees is taken to the income statement within the impairment charge. Any liability remaining is recognised in the income statement when the guarantee is discharged, cancelled or expires.
17. Issued debt and equity securitiesIssued financial instruments or their components are classified as liabilities where the contractual arrangement results in the Group having a present obligation to either deliver cash or another financial asset to the holder, to exchange financial instruments on terms that are potentially unfavourable or to satisfy the obligation otherwise than by the exchange of a fixed amount of cash or another financial asset for a fixed number of equity shares. Issued financial instruments, or their components, are classified as equity where they meet the definition of equity and confer on the holder a residual interest in the assets of the Group. The components of issued financial instruments that contain both liability and equity elements are accounted for separately with the equity component being assigned the residual amount after deducting from the instrument as a whole the amount separately determined as the fair value of the liability component. Financial liabilities, other than financial liabilities designated at fair value, are carried at amortised cost using the effective interest method as set out in policy 6. Derivatives embedded in financial liabilities that are not designated at fair value are accounted for as set out in policy 7. Equity instruments, including share capital, are initially recognised at net proceeds, after deducting transaction costs and any related income tax. Dividend and other payments to equity holders are deducted from equity, net of any related tax.
18. Share capitalShare issue costsIncremental costs directly attributable to the issue of new shares or options including those issued on the acquisition of a business are shown in equity as a deduction, net of tax, from the proceeds.
Dividends on ordinary sharesDividends on ordinary shares are recognised in equity in the period in which they are paid or, if earlier, approved by the Barclays PLC (the Company) shareholders.
88 Barclays Bank PLC Annual Report 2010 www.barclays.com/annualreport10

1 Significant accounting policies continued19. Insurance contracts and investment contractsThe Group offers wealth management, term assurance, annuity, property and payment protection insurance products to customers that take the form of long- and short-term insurance contracts. The Group classifies its wealth management and other products as insurance contracts where these transfer significant insurance risk, generally where the benefits payable on the occurrence of an insured event are at least 5% more than the benefits that would be payable if the insured event does not occur.
Contracts that do not contain significant insurance risk or discretionary participation features are classified as investment contracts. Financial assets and liabilities relating to investment contracts, and assets backing insurance contracts are classified and measured as appropriate under IAS 39, ‘Financial Instruments: Recognition and Measurement’ as set out in policy 7.
Premiums are recognised as revenue proportionally over the period of the coverage. Claims and claims handling costs are charged to income as incurred, based on the estimated liability for compensation owed to policyholders arising from events that have occurred up to the balance sheet date even if they have not yet been reported to the Group, based on assessments of individual cases reported to the Group and statistical analyses for the claims incurred but not reported.
Liabilities under unit-linked life insurance contracts (such as endowment policies) reflect the value of assets held within unitised investment pools.
Deferred acquisition costs (DAC)Commissions and other costs that are related to securing new insurance and investment contracts are capitalised and amortised over the estimated lives of the relevant contracts.
Liability adequacy testLiability adequacy tests are performed at each balance sheet date to ensure the adequacy of contract liabilities net of deferred acquisition costs (DAC) and value of business acquired assets (VOBA). Current best estimates of future contractual cash flows, claims handling and administration costs, and investment returns from the assets backing the liabilities are taken into account in the tests. Where a deficiency is highlighted by the test, DAC and VOBA assets are written off first, and insurance liabilities are increased if required. Any deficiency is immediately recognised in the income statement.
ReinsuranceShort and long-term insurance business is ceded to reinsurers under contracts to transfer part or all of one or more of the following risks: mortality, investment and expenses. All such contracts are dealt with as insurance contracts. The benefits to which the Group is entitled under its reinsurance contracts are recognised as reinsurance assets. The Group assesses reinsurance assets at each balance sheet date. If there is objective evidence of impairment, the carrying amount of the reinsurance asset is reduced accordingly, resulting in a charge to the income statement.
20. LeasesAs LessorAssets leased to customers under agreements which transfer substantially all the risks and rewards of ownership, with or without ultimate legal title, are classified as finance leases. When assets are transferred under a finance lease, the present value of the lease payments, discounted at the rate of interest implicit in the lease, is recognised as a receivable. The difference between the total payments receivable under the lease and the present value of the receivable is recognised as unearned finance income, which is allocated to accounting periods under the pre-tax net investment method to reflect a constant periodic rate of return.
Assets leased to customers under agreements which do not transfer substantially all the risks and rewards of ownership are classified as operating leases. The leased assets are included within property, plant and equipment on the Group’s balance sheet and depreciation is provided on the depreciable amount of these assets on a systematic basis over their estimated useful lives. Lease income is recognised on a straight-line basis over the period of the lease unless another systematic basis is more appropriate.
As LesseeLeases entered into by the Group are primarily operating leases. Operating lease rentals payable are recognised as an expense in the income statement on a straight-line basis over the lease term unless another systematic basis is more appropriate.
21. Employee benefitsShort-term employee benefits, such as salaries, paid absences, and other benefits include any estimated tax payable in respect of employee services rendered during the period and are accounted for on an accruals basis over the period in which the employees provide the related services. Bonuses are recognised to the extent that the Group has a present obligation to its employees that can be measured reliably.
The Group operates a number of pension schemes which may be funded or unfunded and of a defined contribution or defined benefit nature. In addition, the Group contributes, according to local law in the various countries in which it operates, to Governmental and other plans which have the characteristics of defined contribution plans.
For defined benefit schemes, actuarial valuation of each of the schemes’ obligations using the projected unit credit method and the fair valuation of each of the schemes’ assets are performed annually, using the assumptions set out in Note 27. The difference between the fair value of the plan assets and the present value of the defined benefit obligation at the balance sheet date, adjusted for any historic unrecognised actuarial gains or losses and past service cost, is recognised as an asset or a liability in the balance sheet.
Barclays Bank PLC Annual Report 2010 www.barclays.com/annualreport10 89

Notes to the financial statementsFor the year ended 31st December 2010 continued
1 Significant accounting policies continuedAn asset arising, for example, as a result of past over funding or the performance of the plan investments, is recognised to the extent that it does not exceed the present value of future contribution holidays or refunds of contributions.
Cumulative actuarial gains and losses in excess of the greater of 10% of the assets or 10% of the obligations of the plan (the corridor) are recognised in the income statement over the remaining average service lives of the employees of the related plan, on a straight-line basis.
Gains and losses on curtailments are recognised when the curtailment occurs which is when there is a demonstrable commitment to make a significant reduction in the number of employees covered by the plan or amendments have been made to the terms of the plan so that a significant element of future service will no longer qualify for benefits or will qualify only for reduced benefits. The gain or loss comprises any resulting change in the present value of the defined benefit obligation, any resulting change in the fair value of the plan assets and any related actuarial gain or loss that had not previously been recognised since they fell within the corridor.
For defined contribution schemes, the Group recognises contributions due in respect of the accounting period in the income statement. Any contributions unpaid at the balance sheet date are included as a liability.
The Group also provides health care benefits to certain retired employees, the cost of which is accrued as a liability in the financial statements over the period of employment, using a methodology similar to that for defined benefit pensions plans.
All expenses related to employee benefits are recognised in the income statement in staff costs, which is included within operating expenses.
22. Share-based payments to employeesThe Group makes equity settled share-based payments in respect of services received from its employees. The fair value of the services is measured by reference to the fair value of the shares or share options granted on the date of the grant.
The cost of the employee services received in respect of the shares or share options granted is recognised in the income statement over the period that employees provide services, which is generally the vesting period.
The fair value of the options granted is determined using option pricing models, which take into account the exercise price of the option, the current share price, the risk-free interest rate, the expected volatility of the share price over the life of the option and other relevant factors. Vesting conditions, service or performance conditions are not taken into account in estimating fair value, but may lead to adjustments to the number of shares or share options included in the measurement of the cost of employee services so that ultimately, the amount recognised in the income statement reflects the number of vested shares or options.
Vesting conditions that are related to market conditions are reflected in the fair value of the awards granted and charges for the services received are recognised regardless of whether or not the market-related vesting condition is met, provided that the non-market vesting conditions are met. Similarly, non-vesting conditions, which are other conditions not being service conditions or performance conditions, are taken into account in estimating the grant date fair value and share-based payment charges and are recognised when all non-market vesting conditions are satisfied irrespective of whether the non-vesting conditions are satisfied. If meeting a non-vesting condition is a matter of employee choice, failure to meet the non-vesting condition is treated as a cancellation, resulting in an acceleration of recognition of the cost of the employee services.
23. ProvisionsProvisions are recognised for present obligations arising as consequences of past events where it is more likely than not that a transfer of economic benefit will be necessary to settle the obligation, which can be reliably estimated.
When a leasehold property ceases to be used in the business or a demonstrable commitment has been made to cease to use a property, provision is made where the unavoidable costs of the future obligations relating to the lease are expected to exceed anticipated rental income and other benefits. The net costs are discounted using market rates of interest to reflect the long-term nature of the cash flows.
Provision is made for the anticipated cost of restructuring, including redundancy costs when an obligation exists. An obligation exists when the Group has a detailed formal plan for restructuring a business and has raised valid expectations in those affected by the restructuring by starting to implement the plan or announcing its main features. The provision raised is normally utilised within nine months.
Provision is made for undrawn loan commitments and similar facilities if it is probable that the facility will be drawn and result in the recognition of an asset at an amount less than the amount advanced.
Contingent liabilities are possible obligations whose existence will be confirmed only by uncertain future events or present obligations where the transfer of economic benefit is uncertain or cannot be reliably measured. Contingent liabilities are not recognised but are disclosed unless they are remote.
24. Taxes, including deferred taxesIncome tax payable on taxable profits (‘Current Tax’) is recognised as an expense in the period in which the profits arise. Withholding taxes are also treated as income taxes. Income tax recoverable on tax allowable losses is recognised as a current tax asset only to the extent that it is regarded as recoverable by offset against taxable profits.
Deferred income tax is provided in full, using the liability method, on temporary differences arising from the differences between the tax bases of assets and liabilities and their carrying amounts in the consolidated financial statements. Deferred income tax is determined using tax rates and legislation enacted or substantially enacted by the balance sheet date which are expected to apply when the deferred tax asset is realised or the deferred tax liability is settled. Deferred Tax assets and liabilities are only offset when they arise in the same tax reporting group and where there is both the legal right and the intention to settle on a net basis or to realise the asset and settle the liability simultaneously.
90 Barclays Bank PLC Annual Report 2010 www.barclays.com/annualreport10

1 Significant accounting policies continued25. Segment reportingOperating segments are reported in a manner consistent with the internal reporting provided to the Executive Committee. The Executive Committee, which is responsible for allocating resources and assessing performance of the operating segments, has been identified as the chief operating decision maker. All transactions between business segments are conducted on an arm’s length basis, with intra-segment revenue and costs being eliminated in Head Office. Income and expenses directly associated with each segment are included in determining business segment performance.
26. Cash and cash equivalentsFor the purposes of the cash flow statement, cash comprises cash on hand and demand deposits, and cash equivalents comprise highly liquid investments that are convertible into cash with an insignificant risk of changes in value with original maturities of three months or less. Repurchase and reverse repurchase agreements are not considered to be part of cash equivalents.
27. Trust activitiesThe Group commonly acts as trustees and in other fiduciary capacities that result in the holding or placing of assets on behalf of individuals, trusts, retirement benefit plans and other institutions. These assets and income arising thereon are excluded from these financial statements, as they are not assets of the Group.
Changes to Accounting PolicyThe Group has continued to apply the accounting policies used for the 2009 Annual Report and has adopted the following standards from 1st January 2010 (prior periods are not affected by these revised standards): – IFRS 3 Business Combinations. For the Group, the main change is that any costs directly related to the acquisition of a subsidiary are expensed as
incurred, and are not part of the cost of the business combination.
– IAS 27 Consolidated and Separate Financial Statements. Changes in ownership interests in subsidiaries are now accounted for as equity transactions if they occur after control has already been obtained and they do not result in loss of control. In addition, when the Group ceases to have control in a subsidiary, any retained interest in the subsidiary is re-measured to its fair value, with the change in carrying amount recognised in profit or loss.
Future accounting developments IFRS 9 Financial Instruments contains new requirements for accounting for financial assets and liabilities, which by 30th June 2011 will include new requirements for impairment and hedge accounting, replacing the corresponding requirements in IAS 39 Financial Instruments: Recognition and Measurement. It will introduce significant changes in the way that the Group accounts for financial instruments. The key changes issued and proposed relate to: – Financial assets. Financial assets will be held at either fair value or amortised cost, except for equity investments not held for trading which may be
held at fair value through equity.
– Financial liabilities. Gains and losses on own credit arising from financial liabilities designated at fair value through profit or loss will be excluded from the Income Statement and instead taken to Other Comprehensive Income.
– Impairment. Both expected losses and incurred losses will be reflected in impairment allowances for loans and advances.
– Hedge accounting. Hedge accounting will be more closely aligned with financial risk management.
– Offsetting. The conditions for offsetting financial assets and financial liabilities in the balance sheet will be clarified.
Adoption is not mandatory until accounting periods beginning on or after 1st January 2013. Earlier adoption is possible, subject to EU endorsement. At this stage, it is not possible to determine the potential financial impacts of adoption on the Group.
The International Accounting Standards Board is also undertaking a comprehensive review of other IFRSs which, in June 2010, it prioritised into those IFRSs that it expects to issue by 30th June 2011. In addition to IFRS 9, the 30th June 2011 standards which are expected to be more significant for the Group are as follows: – Leases. Under the proposals, lessees are required to recognise assets and liabilities arising from both operating and finance leases on the balance
sheet.
– Post employment benefits. The amendments to IAS 19 Employee Benefits require net pension liabilities arising from defined benefit pension schemes to be recognised in full.
In addition to the above, the IASB plans to issue new standards on Insurance Contracts, Consolidation, Fair Value Measurement, the Presentation of Other Comprehensive Income and Revenue recognition. The Group will consider the financial impacts of these new standards as they are finalised.
A number of other amendments and interpretations to IFRS have been issued that first apply from 1st January 2010 or later periods. These have not resulted in any material changes to the Group’s accounting policies.
Barclays Bank PLC Annual Report 2010 www.barclays.com/annualreport10 91

Notes to the financial statementsFor the year ended 31st December 2010 continued
2 Net interest income
2010£m
2009£m
Cash and balances with central banks 271 131Available for sale investments 1,483 1,937Loans and advances to banks 440 513Loans and advances to customers 17,677 18,456Other interest income 164 199Interest income 20,035 21,236Deposits from banks (370) (634)Customer accounts (1,415) (2,720)Debt securities in issue (3,632) (4,134)Subordinated liabilities (1,778) (1,718)Other interest expense (322) (361)Interest expense (7,517) (9,567)Net interest income 12,518 11,669
Interest income includes £213m (2009: £185m) accrued on impaired loans.
Other interest income principally includes interest income relating to reverse repurchase agreements. Similarly, other interest expense principally includes interest expense relating to repurchase agreements and hedging activity.
Included in net interest income is hedge ineffectiveness as detailed in Note 13.
3 Net fee and commission income
2010£m
2009£m
Banking and credit related fees and commissions 10,063 9,578Brokerage fees 77 88Investment management fees 79 133Foreign exchange commission 149 147Fee and commission income 10,368 9,946Fee and commission expense (1,497) (1,528)Net fee and commission income 8,871 8,418
4 Net trading income
2010£m
2009£m
Trading income 7,019 8,132Gain on foreign exchange dealings 670 682Own credit gain/(charge) 391 (1,820)Net trading income 8,080 6,994
Included within net trading income were gains of £32m (2009: £2,349m loss) on financial assets designated at fair value and losses of £903m (2009: £3,158m) on financial liabilities designated at fair value.
The own credit adjustment arose on £96bn of Barclays Capital’s financial liabilities designated at fair value (2009: £86bn).
5 Net investment income
2010£m
2009£m
Net gain from disposal of available for sale assets 1,027 576Dividend income 129 6Net gain/(loss) from financial instruments designated at fair value 274 (208)Other investment income/(losses) 60 (91)Net investment income 1,490 283
92 Barclays Bank PLC Annual Report 2010 www.barclays.com/annualreport10

6 Impairment Charges
The Group 2010£m
2009£m
Impairment charges on loans and advances New and increased impairment allowances 6,939 8,111 Releases (1,189) (631)Recoveries (201) (150)Impairment charges on loans and advances 5,549 7,330 Charges/(release) in respect of provision for undrawn contractually committed facilities and guarantees provided 76 28 Impairment charges on loans and advances and other credit provisions 5,625 7,358 Impairment charges on reverse repurchase agreements (4) 43 Impairment charges on available for sale assets 51 670 Impairment charges and other credit provisions 5,672 8,071
7 Staff costs
2010£m
2009£m
Salaries and accrued performance costs 8,809 7,795Share based payments (Note 39) 860 286Social security costs 719 606Bank payroll tax 96 225Post retirement benefits- defined contribution plans 297 224- defined benefit plans (Note 27) 213 (33)- other post-retirement benefits (Note 27) 18 16Other 904 829Staff costs 11,916 9,948
The UK Government applied a bank payroll tax of 50% to all discretionary bonuses over £25,000 awarded to UK bank employees between 9th December 2009 and 5th April 2010. The total bank payroll tax paid was £437m, of which £225m was recognised in 2009 in respect of 2009 cash awards and certain prior year deferrals distributed during the taxable period. For 2010 a charge of £96m has been recognised in relation to prior year deferrals, with the remaining £116m recognised over the period 2011 to 2013.
Staff costs above relate to continuing operations only. Staff costs arising on discontinued operations for 2009 totalled £735m, principally comprising £514m of salaries and accrued performance costs, social security costs of £15m, post-retirement benefits of £29m and other staff costs of £177m.
The average total number of persons employed by the Group including both continuing and discontinued operations was 151,300 (2009: 153,800).
8 Administration and general expenses
2010£m
2009£m
Property and equipment 1,813 1,641Outsourcing and professional services 1,704 1,495Operating lease rentals 637 639Marketing, advertising and sponsorship 631 492Subscriptions, publications and stationery 584 519Travel and accommodation 358 273Other administration and general expenses 729 437Impairment of property, equipment and intangible assets 125 61Administration and general expenses 6,581 5,557
In June 2010, the UK Government announced its intention to introduce a bank levy, which will apply to elements of the Group’s consolidated liabilities and equity held as at 31st December 2011. The draft legislation is expected to be enacted by the UK Parliament later this year. Based on the 31st December 2010 balance sheet position and the draft requirements, we estimate that the bank levy would result in an annual charge to the income statement of approximately £400m from 2011 onwards.
Barclays Bank PLC Annual Report 2010 www.barclays.com/annualreport10 93

Notes to the financial statementsFor the year ended 31st December 2010 continued
8 Administration and general expenses continuedAuditors’ remunerationAuditor's remuneration is included within outsourcing and professional services costs above and comprises:
NotesAudit
£m
Audit related
£m
Taxation services
£m
Other services
£mTotal
£m
2010Audit of the Group’s annual accounts 12 – – – 12Other services:Fees payable for the Company’s associates pursuant to legislation a) 26 – – – 26Other services supplied pursuant to such legislation b) – 3 – – 3Services relating to taxation– compliance services – – 7 – 7– advisory services c) – – 1 – 1Services relating to corporate finance transactions entered into or proposed to be entered into by or on behalf of the Company or any of its associates d) – – – 1 1Other – 4 – 2 6Total auditors’ remuneration 38 7 8 3 56
2009Audit of the Group’s annual accounts 12 – – – 12Other services:Fees payable for the Company’s associates pursuant to legislation a) 23 – – – 23Other services supplied pursuant to such legislation b) – 2 – – 2Services relating to taxation– compliance services – – 6 – 6– advisory services c) – – 1 – 1Services relating to corporate finance transactions entered into or proposed to be entered into by or on behalf of the Company or any of its associates d) – – – 3 3Other – 4 – 1 5Total auditors’ remuneration 35 6 7 4 52
The figures shown in the above table relate to fees paid to PricewaterhouseCoopers LLP and its associates for continuing operations of business. Fees paid to other auditors not associated with PricewaterhouseCoopers LLP in respect of the audit of the Company’s subsidiaries were £4m (2009: £3m).
a) Fees payable for the audit of the Company’s associates pursuant to legislation comprise the fees for the statutory audit of the subsidiaries and associated pension schemes both inside and outside Great Britain and fees for the work performed by the associates of PricewaterhouseCoopers LLP in respect of the consolidated financial statements of the Company. The fees relating to the audit of the associated pension schemes were £0.4m (2009: £0.5m).
b) Other services supplied pursuant to such legislation comprise services in relation to statutory and regulatory filings. These include audit services for the review of the interim financial information under the Listing Rules of the UK listing authority.
c) Advisory services relating to taxation include consultation on tax matters, tax advice relating to transactions and other tax planning and advice.
d) Services relating to corporate finance transactions comprise due diligence related to transactions and other work in connection with such transactions.
Excluded from the total auditors’ remuneration above are fees paid to PricewaterhouseCoopers LLP and associates relating to Barclays Global Investors, the Group’s discontinued operations, of £nil (2009: £4m).
94 Barclays Bank PLC Annual Report 2010 www.barclays.com/annualreport10

9 TaxTax charge
2010£m
2009£m
Current tax charge/(credit)Current year 1,413 1,235Adjustment for prior years (20) (131)
1,393 1,104Deferred tax charge/(credit)Current year 118 45Adjustment for prior years 5 (102)
123 (57)Tax charge 1,516 1,047
Tax relating to each component of other comprehensive income can be found in the consolidated statement of comprehensive income on page 75, including within Other, tax credits of £59m (2009: £218m) principally relating to share based payments.
Factors impacting income tax charge for the year The table below shows the reconciliation between the tax charge that would result from applying the standard UK corporation tax rate to the Group’s profit before tax and the actual tax charge.
2010£m
2009£m
Profit before tax from continuing operations 6,079 4,560Tax charge based on the standard UK corporation tax rate of 28% (2009:28%) 1,702 1,277Adjustments for prior years (15) (233)Effect of overseas tax rates different from the standard UK tax ratea (135) (27)Non-taxable gains and incomeb (156) (119)Impact of share price movements on share-based payments 41 (38)Deferred tax assets (previously not recognised)/not recognised (160) 27Change in tax ratesc 34 (12)Non-deductible expenses and other items 205 172Tax charge 1,516 1,047Effective tax rated 25% 23%
The introduction of the UK bank levy is expected to result in a charge to operating expenses in 2011 (see note 8).
Current tax assets and liabilitiesMovements on current tax assets and liabilities were as follows:
2010£m
2009£m
The GroupAssets 349 389Liabilities (964) (1,215)As at 1st January (615) (826)Income statement (1,393) (1,125)Equity 180 (109)Corporate income tax paid 1,430 1,282Acquisitions and disposals (4) (33)Exchange and other adjustments (48) 196
(450) (615)Assets 196 349Liabilities (646) (964)As at 31st December (450) (615)
Notes a Includes a deferred tax benefit of £205m in 2010 arising from the reorganisation of
Spanish securitisation financing.b Non-taxable gains and income is net of £42m relating to £58m witholding tax on the
intra-group return of capital. Revenue of £58m has been recognised in relation to related payments received.
c The UK has passed legislation to reduce the UK tax rate from 28% to 27% from 1st April 2011. This reduced the value of the net UK deferred tax asset at 31st December 2010 resulting in a tax charge of £14m (2009: £nil) included in the £34m for the impact of change in tax rates.
d The low effective tax rate of 9% in 2008 mainly resulted from the Lehman Brothers North American business acquisition.
Barclays Bank PLC Annual Report 2010 www.barclays.com/annualreport10 95

Notes to the financial statementsFor the year ended 31st December 2010 continued
9 Tax continued
2010£m
2009£m
The Bank Assets 221 234 Liabilities (277) (651)As at 1st January (56) (417)Income statement (161) 595 Equity 145 (89)Corporate income tax paid 91 99 Acquisitions and disposals (1) - Exchange and other adjustments 17 (244) 35 (56)Assets 161 221 Liabilities (126) (277)As at 31st December 35 (56)
Deferred tax assets and liabilitiesThe deferred tax amounts disclosed on the balance sheet are as follows:
The Group The Bank
2010£m
2009£m
2010£m
2009£m
Deferred tax asset 2,517 2,303 1,228 773 Deferred tax liability (514) (470) (3) (38)Net deferred tax 2,003 1,833 1,225 735
96 Barclays Bank PLC Annual Report 2010 www.barclays.com/annualreport10

9 Tax continuedDeferred taxes are calculated on all temporary differences under the liability method. Movements on deferred tax assets and liabilities during the year, without taking into consideration the offsetting of balances within the same tax jurisdiction, were as follows:
The GroupFixed asset
timingdifferences
£m
Availablefor sale
investments£m
Cash flowhedges
£m
Pensionsand other
retirementbenefits
£m
Allowancefor
impairmenton loans
£m
Otherprovisions
£m
Tax lossescarried
forward a£m
Sharebased
payments£m
Other£m
Total£m
Assets 117 28 139 219 379 294 1,038 336 472 3,022Liabilities (660) (54) (278) - - - - - (197) (1,189)As at 1st January 2010 (543) (26) (139) 219 379 294 1,038 336 275 1,833Income statement 42 12 (3) (101) (46) (151) 591 25 (492) (123)Equity - 53 38 - - - - 12 (44) 59Acquisitions and disposals 56 - - - - - - - 2 58Exchange and other adjustments 21 (6) (5) - 12 19 (71) (1) 207 176
(424) 33 (109) 118 345 162 1,558 372 (52) 2,003Assets 134 76 - 118 345 162 1,558 372 668 3,433Liabilities (558) (43) (109) - - - - - (720) (1,430)As at 31st December 2010 (424) 33 (109) 118 345 162 1,558 372 (52) 2,003
Assets 87 57 246 403 356 532 1,659 342 1,116 4,798Liabilities (945) (46) (368) - - - - - (1,075) (2,434)As at 1st January 2009 (858) 11 (122) 403 356 532 1,659 342 41 2,364Income statement 340 (8) 44 (189) 39 15 (785) 50 293 (201)Equity - (21) (59) - - - - 156 24 100Acquisitions and disposals 1 - - (5) (1) (8) 4 (41) (98) (148)Exchange and other adjustments (26) (8) (2) 10 (15) (245) 160 (171) 15 (282)
(543) (26) (139) 219 379 294 1,038 336 275 1,833Assets 117 28 139 219 379 294 1,038 336 472 3,022Liabilities (660) (54) (278) - - - - - (197) (1,189)As at 31st December 2009 (543) (26) (139) 219 379 294 1,038 336 275 1,833
NoteRefer to page 98 for notes.
Barclays Bank PLC Annual Report 2010 www.barclays.com/annualreport10 97

Notes to the financial statementsFor the year ended 31st December 2010 continued
9 Tax continued
The BankFixed asset
timingdifferences
£m
Availablefor sale
investments£m
Cash flowhedges
£m
Pensionsand other
retirementbenefits
£m
Allowancefor
impairmenton loans
£m
Otherprovisions
£m
Tax lossescarried
forwarda
£m
Sharebased
payments£m
Other£m
Total£m
Assets 36 - - 142 170 51 368 44 121 932 Liabilities - (19) (140) - - - - - (38) (197)As at 1st January 2010 36 (19) (140) 142 170 51 368 44 83 735 Income statement (45) 5 - (88) (43) (100) 684 (2) 17 428 Equity - 15 77 - - - - 4 (7) 89 Acquisitions and disposals (57) - - - - - - - 4 (53)Exchange and other adjustments 22 - (1) - 11 2 (69) (22) 83 26
(44) 1 (64) 54 138 (47) 983 24 180 1,225 Assets - 1 - 54 138 - 983 24 215 1,415 Liabilities (44) - (64) - - (47) - - (35) (190)As at 31st December 2010 (44) 1 (64) 54 138 (47) 983 24 180 1,225
Assets - - - 335 85 12 410 23 207 1,072 Liabilities (10) (2) (213) - - - - - - (225)As at 1st January 2009 (10) (2) (213) 335 85 12 410 23 207 847 Income statement 46 (12) 36 (193) 86 12 (257) 14 (111) (379)Equity - (4) 36 - - - - 7 (4) 35 Acquisitions and disposals - - - - - - - - (20) (20)Exchange and other adjustments - (1) 1 - (1) 27 215 - 11 252
36 (19) (140) 142 170 51 368 44 83 735 Assets 36 - - 142 170 51 368 44 121 932 Liabilities - (19) (140) - - - - - (38) (197)As at 31st December 2009 36 (19) (140) 142 170 51 368 44 83 735
Notesa The deferred tax asset arising from tax losses mainly relates to entities in the USA, the UK
and Spain.b The net deferred tax asset at 31st December 2010 for the Group includes £1,715m (2009:
£197m) in entities which have suffered a loss in either the current or prior year. Recognition is based on profit forecasts which indicate that it is probable that the relevant entities will have future taxable profits against which the temporary differences can be utilised.
c The amount of deferred tax liability expected to be settled after more than 12 months for the Group is £911m (2009: £955m) and for the Bank is £1,303m (2009: £167m). The amount of deferred tax asset expected to be recovered after more than 12 months for the Group is £1,645m (2009: £2,446m) and for the Bank is £165m (2009: £749m).
d Deferred tax assets have not been recognised for the Group in respect of deductible temporary differences (gross) of £506m (2009: £4m), and unused tax losses (gross) of £4,571m (2009: £8,542m) of which £70m (2009: £nil) expires within 5 years, £239m
(2009: £nil) expires within 6-10 years and £4,262m (2009: £8,542m) expires within 11-20 years. Deferred tax assets have not been recognised for the Bank in respect of deductible temporary differences (gross) of £436m (2009: £4m), and unused tax losses (gross) of £4,331m (2009: 8,505m) of which £70m (2009: £nil) expires within 6-10 years and £4,261m (2009: £8,505m) expires within 11-20 years. Deferred tax assets have not been recognised in respect of these items because it is not probable that future taxable profits will be available against which the Group can utilise benefits. The unused tax losses include amounts relating to the US branch of Barclays Bank PLC where the applicable tax rate for deferred tax purposes would be the excess of the US tax rate over the UK tax rate.
e Deferred tax is not recognised in respect of the Group’s investments in subsidiaries and branches where remittance is not contemplated and for those associates and interests in joint ventures where it has been determined that no additional tax will arise. The aggregate amount of temporary differences for which deferred tax liabilities have not been recognised in the Group is £530m (2009: £738m).
98 Barclays Bank PLC Annual Report 2010 www.barclays.com/annualreport10

10 DividendsDividends paid in the year were:
2010£m
2009£m
On ordinary shares Final dividend - - Interim dividend 235 103 Dividends 235 103
These dividends are paid to enable Barclays PLC to fund its dividends to its shareholders and in 2009, to fund the repurchase by Barclays PLC ordinary share capital.
Dividends per ordinary share for 2010 were 10p (2009: 4p). Dividends paid on the 4.75% €100 preference shares amounted to £433.27 per share (2009: £441.42). Dividends paid on the 4.875% €100 preference shares amounted to £408.11 per share (2009: £439.34). Dividends paid on the 6.0% £100 preference shares amounted to £600.00 per share (2009: £600.00). Dividends paid on the 6.278% US$100 preference shares amounted to £413.25 per share (2009: £385.59). Dividends paid on the 6.625% US$0.25 preference shares amounted to £1.09 per share (2009: £1.06). Dividends paid on the 7.1% US$0.25 preference shares amounted to £1.17 per share (2009: £1.13). Dividends paid on the 7.75% US$0.25 preference shares amounted to £1.28 per share (2009: £1.24). Dividends paid on the 8.125% US$0.25 preference shares amounted to £1.34 per share (2009: £1.30).
Dividends paid on preference shares amounted to £485m (2009: £477m). Dividends paid on other equity instruments amounted to £160m (2009: £122m).
11 Trading portfolio
The Group The Bank
2010£m
2009£m
2010£m
2009£m
Debt securities and other eligible bills 139,240 126,520 86,328 83,680 Equity securities 25,676 19,653 4,901 5,552 Traded loans 2,170 2,962 2,500 2,945 Commodities 1,844 2,260 1,305 1,629 Trading portfolio assets 168,930 151,395 95,034 93,806
Debt securities and other eligible bills (64,607) (44,708) (40,677) (30,993)Equity Securities (7,568) (6,468) (3,157) (2,465)Commodities (518) (76) (518) (76)Trading portfolio liabilities (72,693) (51,252) (44,352) (33,534)
12 Financial assets designated at fair value
The Group The Bank
2010£m
2009£m
2010£m
2009£m
Loans and advances 22,352 22,390 25,093 21,636 Debt securities 1,918 4,007 783 3,338 Equity securities 5,685 6,256 11 66 Customers’ assets held under investment contracts 1,429 1,257 - - Other financial assets 10,101 8,658 3,294 2,605 Financial assets designated at fair value 41,485 42,568 29,181 27,645
The total portfolio of assets held in respect of linked liabilities to customers under investment contracts also includes £518m (2009: £422m) of cash and bank balances included within cash and balances at central banks. The carrying value of the total assets is always the same as the carrying value of the liabilities to customers under investment contracts as shown in note 20. Any change in the value of the assets results in an equal but opposite change in the value of the amounts due to the policyholders. Therefore, the Group is not exposed to the financial risks inherent in the investments.
Barclays Bank PLC Annual Report 2010 www.barclays.com/annualreport10 99

Notes to the financial statementsFor the year ended 31st December 2010 continued
12 Financial assets designated at fair value continuedCredit risk of loans and advances held at fair value and related credit derivativesThe following table shows the maximum exposure to credit risk, the changes in fair value due to credit risk and the cumulative changes in fair value since initial recognition on loans and advances designated at fair value together with the amount by which related credit derivatives mitigate this risk:
The Group The Bank
Maximum Exposureas at 31st December
Changes in fair value during the year ended
Cumulative changes in fair value from
inceptionMaximum Exposureas at 31st December
Changes in fair value during the year ended
Cumulative changes in fair value from
inception
2010 2009 2010 2009 2010 2009 2010 2009 2010 2009 2010 2009
Loans and advances designated at fair value, attributable to credit risk 22,352 22,390 326 (2,370) (4,995) (5,321) 25,093 21,636 298 (1,298) (3,398) (3,696)Fair value of related credit derivatives 2,206 1,416 (481) 229 263 744 1,977 1,224 (481) 229 246 727
13 Derivative financial instruments The Group’s objectives and policies on managing the risks that arise in connection with derivatives, including the policies for hedging, are discussed in the Risk Management section on pages 11 to 65.
The use of derivatives and their sale to customers as risk management products are an integral part of the Group’s trading activities. These instruments are also used to manage the Group’s own exposure to fluctuations in interest, exchange rates and commodity and equity prices as part of its asset and liability management activities.
Barclays Capital manages the trading derivatives book as part of the market risk book. This includes foreign exchange, interest rate, equity, commodity and credit derivatives.
Derivative instruments are contracts whose value is derived from one or more underlying financial instruments or indices defined in the contract. They include swaps, forward rate agreements, futures, options and combinations of these instruments and primarily affect the Group’s net interest income, net trading income, net fee and commission income and derivative assets and liabilities. Notional amounts of the contracts are not recorded on the balance sheet.
Foreign exchange derivatives The Group’s principal exchange rate related contracts are forward foreign exchange contracts, currency swaps and currency options. Forward foreign exchange contracts are agreements to buy or sell a specified quantity of foreign currency, usually on a specified future date at an agreed rate. A currency swap generally involves the exchange, or notional exchange, of equivalent amounts of two currencies and a commitment to exchange interest periodically until the principal amounts are re-exchanged on a future date.
Currency options provide the buyer with the right, but not the obligation, either to purchase or sell a fixed amount of a currency at a specified exchange rate on or before a future date. As compensation for assuming the option risk, the option writer generally receives a premium at the start of the option period.
Interest rate derivatives The Group’s principal interest rate related contracts are interest rate swaps, forward rate agreements, basis swaps, caps, floors and swaptions. Included in this product category are transactions that include combinations of these features. An interest rate swap is an agreement between two parties to exchange fixed rate and floating rate interest by means of periodic payments based upon a notional principal amount and the interest rates defined in the contract. Certain agreements combine interest rate and foreign currency swap transactions, which may or may not include the exchange of principal amounts. A basis swap is a form of interest rate swap, in which both parties exchange interest payments based on floating rates, where the floating rates are based upon different underlying reference indices. In a forward rate agreement, two parties agree a future settlement of the difference between an agreed rate and a future interest rate, applied to a notional principal amount. The settlement, which generally occurs at the start of the contract period, is the discounted present value of the payment that would otherwise be made at the end of that period.
Credit derivatives The Group’s principal credit derivative-related contracts include credit default swaps and total return swaps. A credit derivative is an arrangement whereby the credit risk of an asset (the reference asset) is transferred to the seller of protection.
A credit default swap is a contract where the protection seller receives premium or interest-related payments in return for contracting to make payments to the protection buyer upon a defined credit event. Credit events normally include bankruptcy, payment default on a reference asset or assets, or downgrades by a rating agency.
100 Barclays Bank PLC Annual Report 2010 www.barclays.com/annualreport10

13 Derivative financial instruments continuedA total return swap is an instrument whereby the seller of protection receives the full return of the asset, including both the income and change in the capital value of the asset. The buyer of the protection in return receives a predetermined amount.
Equity derivatives The Group’s principal equity-related contracts are equity and stock index swaps and options (including warrants, which are equity options listed on an exchange). An equity swap is an agreement between two parties to exchange periodic payments, based upon a notional principal amount, with one side paying fixed or floating interest and the other side paying based on the actual return of the stock or stock index. An equity option provides the buyer with the right, but not the obligation, either to purchase or sell a specified stock, basket of stocks or stock index at a specified price or level on or before a specified date. The Group also enters into fund-linked derivatives, being swaps and options whose underlyings include mutual funds, hedge funds, indices and multi-asset portfolios.
Commodity derivatives The Group’s principal commodity-related derivative contracts are swaps, options, forwards and futures. The main commodities transacted are base metals, precious metals, oil and oil-related products, power and natural gas.
The Group's total derivative and liability position as reported on the balance sheet is as follows:
The Group The Bank
Fair value Fair value
Notional contract amount
£mAssets
£mLiabilities
£m
Notional contract amount
£mAssets
£mLiabilities
£m
Year ended 31st December 2010 Total derivative assets/(liabilities) held for trading 48,517,204 418,586 (403,163) 48,268,152 439,763 (423,938)Total derivative assets/(liabilities) held for risk management 240,353 1,733 (2,353) 222,403 1,382 (2,305)Derivative assets/(liabilities) 48,757,557 420,319 (405,516) 48,490,555 441,145 (426,243) Year ended 31st December 2009 Total derivative assets/(liabilities) held for trading 39,131,979 415,638 (402,019) 39,325,860 428,976 (417,055)Total derivative assets/(liabilities) held for risk management 180,018 1,177 (1,397) 149,114 919 (1,299)Derivative assets/(liabilities) 39,311,997 416,815 (403,416) 39,474,974 429,895 (418,354)
Derivate movements on the balance sheet were broadly flat compared to prior year with assets of £420bn as at 31 December 2010 (2009:£417bn) and liabilities of £406bn (2009:£403bn). Movements in derivatives during the year were mainly the result of decreases in forward interest rates in major currencies and new and increased business activity, partly offset by initiatives to reduce balance sheet usage such as the placement of existing derivative postions with clearing houses and the compression of OTC derivative contracts via Tri-Optima, a third party intermediary.
Derivative asset exposures would be £378bn (2009: £374bn) lower than reported under IFRS if netting were permitted for assets and liabilities with the same counterparty or for which we hold cash collateral. Derivative liabilities would be £362bn (2009: £363bn) lower reflecting counterparty netting and collateral placed.
Barclays Bank PLC Annual Report 2010 www.barclays.com/annualreport10 101

Notes to the financial statementsFor the year ended 31st December 2010 continued
13 Derivative financial instruments continuedThe fair values and notional amounts of derivative instruments held for trading are set out in the following table:
Derivatives held for trading The Group The Bank
Fair value Fair value
Notional contract amount
£mAssets
£mLiabilities
£m
Notional contract amount
£mAssets
£mLiabilities
£m
Year ended 31st December 2010Foreign exchange derivativesForward foreign exchange 1,823,186 22,882 (22,674) 1,794,499 22,481 (22,248)Currency swaps 935,420 29,802 (32,433) 913,494 28,040 (30,647)OTC options bought and sold 739,949 7,736 (7,034) 738,583 7,681 (7,008)OTC derivatives 3,498,555 60,420 (62,141) 3,446,576 58,202 (59,903)Exchange traded futures – bought and sold 8,149 – – 8,149 – – Exchange traded options – bought and sold 7,207 – – 7,207 – – Foreign exchange derivatives 3,513,911 60,420 (62,141) 3,461,932 58,202 (59,903)Interest rate derivatives Interest rate swaps 10,316,455 202,050 (183,665) 10,124,429 199,367 (181,432)Forward rate agreements 4,711,960 2,625 (2,881) 4,393,227 1,596 (1,686)OTC options bought and sold 4,551,516 66,055 (65,395) 4,535,975 66,008 (65,360)OTC derivatives 19,579,931 270,730 (251,941) 19,053,631 266,971 (248,478)Exchange traded futures – bought and sold 706,678 – – 686,913 – – Exchange traded options – bought and sold 268,855 – – 240,232 – – Exchange traded swaps 21,209,173 – – 21,209,145 – – Interest rate derivatives 41,764,637 270,730 (251,941) 41,189,921 266,971 (248,478)Credit derivativesOTC swaps 1,780,264 45,977 (44,068) 1,778,812 46,054 (44,078)Exchange traded credit default swaps 172,211 1,040 (976) 172,211 1,040 (976)Credit derivatives 1,952,475 47,017 (45,044) 1,951,023 47,094 (45,054)Equity and stock index derivativesOTC options bought and sold 118,363 9,340 (13,424) 106,796 9,137 (12,959)Equity swaps and forwards 56,478 2,226 (2,359) 45,186 1,566 (1,519)OTC derivatives 174,841 11,566 (15,783) 151,982 10,703 (14,478)Exchange traded futures – bought and sold 96,582 1 (4) 87,239 – (4)Exchange traded options – bought and sold 206,881 3,016 (2,812) 34,731 – – Equity and stock index derivatives 478,304 14,583 (18,599) 273,952 10,703 (14,482)Commodity derivativesOTC options bought and sold 93,937 3,778 (3,751) 92,220 3,764 (3,746)Commodity swaps and forwards 326,336 18,743 (19,133) 325,448 18,567 (18,989)OTC derivatives 420,273 22,521 (22,884) 417,668 22,331 (22,735)Exchange traded futures – bought and sold 358,550 3,240 (2,326) 358,090 3,240 (2,326)Exchange traded options – bought and sold 29,054 75 (228) 29,054 75 (228)Commodity derivatives 807,877 25,836 (25,438) 804,812 25,646 (25,289)Derivatives with subsidiaries 586,512 31,147 (30,732)Derivative assets/(liabilities) held for trading 48,517,204 418,586 (403,163) 48,268,152 439,763 (423,938)
102 Barclays Bank PLC Annual Report 2010 www.barclays.com/annualreport10

13 Derivative financial instruments continuedThe fair values and notional amounts of derivative instruments held for trading are set out in the following table:
Derivatives held for trading The Group The Bank
Fair value Fair value
Notional contract amount
£mAssets
£mLiabilities
£m
Notional contract amount
£mAssets
£mLiabilities
£m
Year ended 31st December 2009Foreign exchange derivatives Forward foreign exchange 1,457,271 18,148 (18,019) 1,435,729 17,581 (17,407)Currency swaps 810,666 26,008 (32,357) 805,118 25,372 (31,648)OTC options bought and sold 539,976 7,332 (7,321) 537,623 7,292 (7,321)OTC derivatives 2,807,913 51,488 (57,697) 2,778,470 50,245 (56,376)Exchange traded futures – bought and sold 2,035 – – 2,035 – – Exchange traded options – bought and sold 28,220 – – 28,220 – – Foreign exchange derivatives 2,838,168 51,488 (57,697) 2,808,725 50,245 (56,376)Interest rate derivatives Interest rate swaps 9,408,811 193,133 (179,744) 9,276,271 191,651 (178,300)Forward rate agreements 4,436,628 3,595 (3,289) 4,270,839 2,266 (2,105)OTC options bought and sold 5,113,613 63,647 (61,304) 5,090,650 63,608 (61,272)OTC derivatives 18,959,052 260,375 (244,337) 18,637,760 257,525 (241,677)Exchange traded futures – bought and sold 547,685 – – 543,428 – – Exchange traded options – bought and sold 272,960 – – 272,953 – – Exchange traded swaps 13,424,261 – – 13,424,261 – – Interest rate derivatives 33,203,958 260,375 (244,337) 32,878,402 257,525 (241,677)Credit derivatives OTC swaps 1,932,635 55,302 (51,000) 1,931,919 55,247 (50,891)Exchange traded credit default swaps 84,161 993 (780) 84,161 993 (780)Credit derivatives 2,016,796 56,295 (51,780) 2,016,080 56,240 (51,671)Equity and stock index derivatives OTC options bought and sold 124,944 13,042 (15,681) 117,431 12,500 (14,797)Equity swaps and forwards 45,922 2,057 (1,718) 40,977 1,372 (1,059)OTC derivatives 170,866 15,099 (17,399) 158,408 13,872 (15,856)Exchange traded futures – bought and sold 57,565 – – 44,787 – – Exchange traded options – bought and sold 130,885 2,631 (2,371) 32,593 – – Equity and stock index derivatives 359,316 17,730 (19,770) 235,788 13,872 (15,856)Commodity derivatives OTC options bought and sold 92,508 4,262 (4,215) 91,987 4,068 (4,162)Commodity swaps and forwards 252,621 22,872 (22,012) 251,803 22,832 (21,925)OTC derivatives 345,129 27,134 (26,227) 343,790 26,900 (26,087)Exchange traded futures – bought and sold 312,883 2,436 (2,008) 311,459 2,436 (2,007)Exchange traded options – bought and sold 55,729 180 (200) 54,876 179 (200)Commodity derivatives 713,741 29,750 (28,435) 710,125 29,515 (28,294)Derivatives with subsidiaries 676,740 21,579 (23,181)Derivative assets/(liabilities) held for trading 39,131,979 415,638 (402,019) 39,325,860 428,976 (417,055)
Barclays Bank PLC Annual Report 2010 www.barclays.com/annualreport10 103

Notes to the financial statementsFor the year ended 31st December 2010 continued
13 Derivative financial instruments continuedThe fair values and notional amounts of derivative instruments held for risk management are set out in the following table:
Derivatives held for risk management The Group The Bank
Fair value Fair value
Notional contract amount
£mAssets
£mLiabilities
£m
Notional contract amount
£mAssets
£mLiabilities
£m
Year ended 31st December 2010Derivatives designated as cash flow hedgesInterest rate swaps 126,904 760 (882) 102,655 393 (866)Forward foreign exchange 581 – (43) 581 – (43)Exchange traded interest rate swaps 22,278 – – 22,278 – – Derivatives designated as cash flow hedges 149,763 760 (925) 125,514 393 (909)Derivatives designated as fair value hedges Currency swaps 679 – (54) – – – Interest rate swaps 42,301 905 (872) 39,324 826 (754)Equity options – – – – – (1)Forward foreign exchange 4,561 19 (86) 14,516 135 (225)Exchange traded interest rate swaps 36,427 – – 36,427 – – Derivatives designated as fair value hedges 83,968 924 (1,012) 90,267 961 (980)Derivatives designated as hedges of net investments Forward foreign exchange 5,870 28 (199) 5,870 28 (199)Currency swaps 752 21 (217) 752 – (217)Derivatives designated as hedges of net investment 6,622 49 (416) 6,622 28 (416)Derivative assets/(liabilities) held for risk management 240,353 1,733 (2,353) 222,403 1,382 (2,305)
Year ended 31st December 2009Derivatives designated as cash flow hedgesInterest rate swaps 79,241 478 (494) 56,675 324 (483)OTC options bought and sold 673 2 – 673 2 – Forward foreign exchange 2,224 237 (51) 2,215 236 (55)Exchange traded interest rate swaps 33,534 – – 33,534 – – Derivatives designated as cash flow hedges 115,672 717 (545) 93,097 562 (538)Derivatives designated as fair value hedges Currency swaps 502 10 – – – – Interest rate swaps 12,199 357 (459) 11,948 317 (423)Equity options 7,710 53 (56) 134 – (1)Forward foreign exchange 5,386 18 (103) 5,386 18 (103)Exchange traded interest rate swaps 32,257 – – 32,257 – – Derivatives designated as fair value hedges 58,054 438 (618) 49,725 335 (527)Derivatives designated as hedges of net investments Forward foreign exchange 5,321 22 (97) 5,321 22 (97)Currency swaps 971 – (137) 971 – (137)Derivatives designated as hedges of net investment 6,292 22 (234) 6,292 22 (234)Derivative assets/(liabilities) held for risk management 180,018 1,177 (1,397) 149,114 919 (1,299)
Interest rate derivatives, designated as cash flow hedges, primarily hedge the exposure to cash flow variability from interest rates of variable rate loans to banks and customers, variable rate debt securities held and highly probable forecast financing transactions and reinvestments.
Interest rate derivatives designated as fair value hedges primarily hedge the interest rate risk of fixed rate borrowings in issue, fixed rate loans to banks and customers and investments in fixed rate debt securities held.
Currency derivatives are primarily designated as hedges of the foreign currency risk of net investments in foreign operations.
104 Barclays Bank PLC Annual Report 2010 www.barclays.com/annualreport10

13 Derivative financial instruments continuedThe Group has hedged the following forecast cash flows, which primarily vary with interest rates. These cash flows are expected to impact the income statement in the following periods, excluding any hedge adjustments that may be applied:
Total£m
Up to one year£m
Between one to two years
£m
Between two to three years
£m
Between three to four years
£m
Between four to five years
£m
More than five years
£m
2010 The Group Forecast receivable cash flows 2,861 440 570 625 526 291 409 Forecast payable cash flows 307 69 52 76 82 22 6 The Bank Forecast receivable cash flows 2,530 289 469 574 505 285 408 Forecast payable cash flows 293 65 51 74 81 22 – 2009 The Group Forecast receivable cash flows 3,304 467 838 837 700 370 92 Forecast payable cash flows 558 51 96 122 145 116 28 The Bank Forecast receivable cash flows 3,147 393 792 811 691 368 92 Forecast payable cash flows 547 49 95 121 144 115 23
The maximum length of time over which the Group hedges exposure to the variability in future cash flows for forecast transactions, excluding those forecast transactions related to the payment of variable interest on existing financial instruments, is fourteen years (2009: nine years), and for the Bank, eight years (2009: nine years).
Amounts recognised in net interest income The Group£m
The Bank£m
Year ended 31st December 2010Fair value hedging: Losses on the hedged items attributable to the hedged risk (1,172) (1,171)Gains on the hedging instruments 1,286 1,310 Fair value ineffectiveness 114 139 Cash flow hedging ineffectiveness 138 136 Net investment hedging ineffectiveness (10) (10)
Year ended 31st December 2009 Fair value hedging: Gains on the hedged items attributable to the hedged risk 1,604 1,624 Losses on the hedging instruments (1,478) (1,513)Fair value ineffectiveness 126 111 Cash flow hedging ineffectiveness 21 22 Net investment hedging ineffectiveness (5) (5)
All gains or losses on hedging derivatives relating to forecast transactions, which are no longer expected to occur, have been recycled to the income statement.
Transfers from cash flow hedging reserveGains and losses transferred from the cash flow hedging reserve in the current year were to: Interest income: £88m gain (2009: £22m loss), interest expense: £515m gain (2009: £272m gain), net trading income: £148m loss (2009: £165m loss), administration and general expenses: £99m gain (2009: £7m gain), and for the Bank, interest income: £nil (2009: £nil), interest expense: 518m gain (2009: £245m gain), net trading income: £73m loss (2009: £11m loss), and administration and general expenses: £99m gain (2009: £7m gain).
14 Loans and advances to banks and customers
The Group The Bank
2010£m
2009£m
2010£m
2009£m
Gross loans and advances to banks 37,847 41,196 40,438 43,024 Less: Allowance for impairment (48) (61) (48) (61)Loans and advances to banks 37,799 41,135 40,390 42,963 Gross loans and advances to customers 440,326 430,959 531,012 519,469 Less: Allowance for impairment (12,384) (10,735) (8,076) (7,341)Loans and advances to customers 427,942 420,224 522,936 512,128
Barclays Bank PLC Annual Report 2010 www.barclays.com/annualreport10 105

Notes to the financial statementsFor the year ended 31st December 2010 continued
15 Available for sale financial investments
The Group The Bank
2010£m
2009£m
2010£m
2009£m
Debt securities and other eligible bills 59,629 49,807 45,076 35,984 Equity securities 5,811 6,844 145 590 Available for sale financial investments 65,440 56,651 45,221 36,574
16 Securities borrowing, securities lending, repurchase and reverse repurchase agreementsAmounts included in the balance sheet and reported on a net basis where the Group has the intention and the legal ability to settle net or realise simultaneously were as follows:
(a) Reverse repurchase agreements and other similar secured lendingAmounts advanced to counterparties under reverse repurchase agreements and cash collateral provided under stock borrowing agreements are treated as collateralised loans receivable. The related securities purchased or borrowed subject to an agreement with the counterparty to repurchase them are not recognised on-balance sheet where the risks and rewards of ownership remain with the counterparty.
The Group The Bank
2010£m
2009£m
2010£m
2009£m
Banks 104,233 67,872 72,997 47,108 Customers 101,539 75,559 154,346 98,325 Reverse repurchase agreements and cash collateral held on securities borrowed 205,772 143,431 227,343 145,433
b) Repurchase agreements and other similar secured borrowing Securities that are not recorded on the balance sheet (for example, securities that have been obtained as a result of reverse repurchase and stock borrowing transactions) may also be lent or sold subject to a commitment to repurchase – such securities remain off-balance sheet. In both instances, amounts received from counterparty are treated as liabilities, which at 31st December were as follows:
The Group The Bank
2010£m
2009£m
2010£m
2009£m
Banks 99,997 93,692 61,692 53,791 Customers 125,537 105,089 152,515 111,404 Repurchase agreements and cash collateral on securities lent 225,534 198,781 214,207 165,195
17 Investments in associates and joint ventures
2010£m
2009£m
Investment in associates 261 250 Investment in joint ventures 257 172 Total 518 422
Summarised financial information for the Group’s associates and joint ventures is set out below. The amounts shown are assets, liabilities and net income of the investees, not just the Group’s share, as at and for the year ended 31st December 2010 with the exception of certain undertakings for which the amounts are based on accounts made up to dates not earlier than three months before the balance sheet date.
2010 2009
Associates£m
Joint Ventures
£mAssociates
£m
JointVentures
£m
Total assets 4,819 3,452 4,939 3,521 Total liabilities 4,089 3,024 4,236 3,238 (Loss)/Profit after tax (167) 93 (96) 30
The Group’s share of commitments and contingencies of its associates and joint ventures is comprised of insurance guarantees of £nil (2009: £5m) and unutilised credit facilities provided to customers of £1,237m (2009: £1,126m).
106 Barclays Bank PLC Annual Report 2010 www.barclays.com/annualreport10

18 Goodwill and intangible assets
Goodwill£m
Internally generated
software£m
Other software
£m
Core deposit
intangibles£m
Brands£m
Customer lists£m
Mortgage servicing
rights£m
Licences and other
£mTotal
£m
The Group Cost As at 1st January 2010 7,058 963 237 301 175 1,521 164 462 10,881 Acquisitions and disposals of subsidiaries 12 – – – – 28 – 25 65 Additions and disposals – 88 3 – – – (168) (3) (80)Exchange and other adjustments 189 40 (6) 46 27 137 4 (11) 426 As at 31st December 2010 7,259 1,091 234 347 202 1,686 – 473 11,292 Accumulated amortisation and impairmentAs at 1st January 2010 (826) (465) (58) (82) (84) (318) (117) (136) (2,086)Disposals – 100 – – – 2 144 11 257 Amortisation charge – (178) (36) (19) (18) (141) (7) (38) (437)Impairment charge (243) (14) – (7) – (15) (19) (17) (315)Exchange and other adjustments 29 5 8 (13) (7) (21) (1) (14) (14)As at 31st December 2010 (1,040) (552) (86) (121) (109) (493) – (194) (2,595)Net book value 6,219 539 148 226 93 1,193 – 279 8,697 The Bank Cost As at 1st January 2010 4,281 675 136 7 4 17 164 117 5,401 Acquisitions and disposals of subsidiaries – – – – – 28 – 2 30 Additions and disposals – 32 (18) – – – (168) – (154)Exchange and other adjustments (2) – – – (4) (29) 4 (2) (33)As at 31st December 2010 4,279 707 118 7 – 16 – 117 5,244 Accumulated amortisation and impairmentAs at 1st January 2010 (727) (320) (21) (3) (6) (7) (115) (21) (1,220)Disposals – 94 – – – – 144 11 249 Amortisation charge – (111) (13) (1) – (5) (7) (11) (148)Impairment charge – (13) – – – (10) (19) 9 (33)Exchange and other adjustments – 11 – – 6 14 (3) (10) 18 As at 31st December 2010 (727) (339) (34) (4) – (8) – (22) (1,134)Net book value 3,552 368 84 3 – 8 – 95 4,110 The Group Cost As at 1st January 2009 8,551 721 328 261 155 1,565 173 426 12,180 Acquisitions and disposals of subsidiaries 63 – – – – 1 – 109 173 Disposal of discontinued operations (1,587) (66) – – (2) – – (32) (1,687)Additions and disposals – 264 (36) – – – – 11 239 Exchange and other adjustments 31 44 (55) 40 22 (45) (9) (52) (24)As at 31st December 2009 7,058 963 237 301 175 1,521 164 462 10,881 Accumulated amortisation and impairment As at 1st January 2009 (926) (284) (69) (52) (55) (172) (116) (104) (1,778)Disposal of discontinued operations 84 25 – – 2 – – 8 119 Disposals – 12 4 – – – – – 16 Amortisation charge – (190) (29) (22) (17) (136) (13) (54) (461)Impairment charge (1) (11) – – (6) – – (10) (28)Exchange and other adjustments 17 (17) 36 (8) (8) (10) 12 24 46 As at 31st December 2009 (826) (465) (58) (82) (84) (318) (117) (136) (2,086)Net book value 6,232 498 179 219 91 1,203 47 326 8,795 The Bank Cost As at 1st January 2009 4,303 560 110 7 4 16 173 38 5,211 Acquisitions and disposals of subsidiaries – – – – – 2 – 75 77 Additions and disposals (17) 116 38 – – – – 4 141 Exchange and other adjustments (5) (1) (12) – – (1) (9) – (28)As at 31st December 2009 4,281 675 136 7 4 17 164 117 5,401 Accumulated amortisation and impairment As at 1st January 2009 (729) (204) (22) (3) – (5) (115) (13) (1,091)Disposals 2 9 – – – – – – 11Amortisation charge – (116) (11) – – (2) (13) 1 (141)Impairment charge – (9) – – (6) – – (10) (25)Exchange and other adjustments – – 12 – – – 13 1 26 As at 31st December 2009 (727) (320) (21) (3) (6) (7) (115) (21) (1,220)Net book value 3,554 355 115 4 (2) 10 49 96 4,181
Barclays Bank PLC Annual Report 2010 www.barclays.com/annualreport10 107

Notes to the financial statementsFor the year ended 31st December 2010 continued
18 Goodwill and intangible assets continuedOf the intangibles amortisation charge for 2009 £447m related to continuing operations.
GoodwillGoodwill is allocated to business operations according to business segments as follows:
The Group The Bank
2010£m
2009£m
2010£m
2009£m
UK Retail Banking 3,148 3,146 3,130 3,130 Barclaycard 585 552 220 220 Western Europe Retail Banking 505 520 108 110 Barclays Africa 36 39 – – Barclays Capital 133 105 – – Barclays Corporate 150 389 – – Barclays Wealth 391 391 94 94 Absa 1,271 1,090 – – Total Goodwill 6,219 6,232 3,552 3,554
Goodwill has been allocated to the revised business segments in line with the resegmentation communicated to the market in March 2010. This means that the £243m of goodwill in Barclays Bank Russia was allocated to Barclays Corporate and goodwill in Spain of £565m was allocated between Western Europe Retail Banking (£439m) and Barclays Corporate (£126m). The comparative figures for 2009 have been updated to reflect this resegmentation.
Impairment testing of goodwill Goodwill is reviewed annually for impairment, or more frequently when there are indicators that impairment may have occurred, by comparing the carrying value to its recoverable amount.
The recoverable amount of each operation’s goodwill is based on value-in-use calculations. The calculations are based upon discounting expected pre-tax cash flows at a risk-adjusted interest rate appropriate to the cash generating unit, the determination of both of which requires the exercise of judgement. The estimation of pre-tax cash flows is sensitive to the periods for which forecasts are available and to assumptions regarding the long-term sustainable cash flows. While forecasts are compared with actual performance and external economic data, expected cash flows naturally reflect management’s view of future performance.
Key assumptionsThe key assumptions used for impairment testing are set out below for each significant goodwill balance. Other goodwill of £1,253m (2009: £1,986m) was allocated to multiple cash-generating units which are not considered individually significant.
UK Retail BankingThe recoverable amount of UK Retail Banking has been determined using cash flow predictions based on financial budgets approved by management and covering a five-year period, with a terminal growth rate of 2% (2009: 3%) applied thereafter. The forecast cashflows have been discounted at a pre-tax rate of 13% (2009: 14%). Based on the above assumptions, the recoverable amount exceeded the carrying amount including goodwill by £4.0bn (2009: £1.2bn). A one percentage point change in the discount rate or the terminal growth rate would reduce the recoverable amount by £1.0bn (2009: £0.7bn) and £0.8bn (2009: £0.5bn) respectively. A reduction in the forecast cash flows of 10% per annum would reduce the recoverable amount by £1.1bn (2009: £0.8bn).
AbsaThe recoverable amount of Absa has been determined using cash flow predictions based on financial budgets approved by management and covering a five year period, with a terminal growth rate of 6% (2009: 6%) applied thereafter. The forecast cashflows have been discounted at a pre-tax rate of 14% (2009: 14%). The recoverable amount calculated based on value in use exceeded the carrying amount including goodwill by £5.0bn (2009: £4.7bn). The result of the impairment test would not be materially different if alternative reasonably possible changes in key assumptions were applied.
SpainThe recoverable amount of the Spanish business has been determined using cash flow predictions based on financial budgets approved by management covering a five-year period, with a terminal growth rate of 2% (2009: 2%) applied thereafter. The forecast cash flows have been discounted at a pre-tax rate of 12% (2009: 13%). The recoverable amount calculated based on value in use exceeded the carrying amount including goodwill by £383m. The cash flow projections include the estimated benefits from changes in product mix, improved product pricing and impairment levels coming back into line with historic loan loss rates. There is no impact from any cost restructuring or any future planned investments included within the forecasts. An increase in the discount rate to 15%, a decrease in the terminal growth rate to negative 1.3%, or a reduction in the forecast cash flows of 26% per annum would reduce the headroom over the carrying amount to nil.
Barclays Corporate- RussiaAt 31 December 2010, Barclays recognised an impairment charge of £243 million (2009: nil) in respect of all of the goodwill held by Barclays Corporate in Barclays Bank Russia (BBR), which arose from the Expo bank acquisition in 2008. The impairment principally reflects changes in expected future cash flows arising from BBR as our activities there have been refocused. The recoverable amount of BBR was calculated based on the value in use approach using a pre-tax rate of 17%.
108 Barclays Bank PLC Annual Report 2010 www.barclays.com/annualreport10

19 Property, plant and equipment
The Group The Bank
Investmentproperty
£mProperty
£mEquipment
£m
Leasedassets
£mTotal
£m
Investmentproperty
£mProperty
£mEquipment
£mTotal
£m
2010 Cost As at 1st January 2010 1,207 3,830 4,197 66 9,300 – 1,956 2,073 4,029 Acquisitions and disposals of subsidiaries 46 2 4 – 52 – – 2 2 Additions and disposals 353 283 120 9 765 4 172 (22) 154 Change in fair value of investment properties (54) – – – (54) – – – – Fully depreciated assets written off – (2) (1) – (3) – (2) (1) (3)Exchange and other adjustments 18 116 429 – 563 – (11) 12 1 As at 31st December 2010 1,570 4,229 4,749 75 10,623 4 2,115 2,064 4,183 Accumulated depreciation and impairment As at 1st January 2010 – (1,128) (2,529) (17) (3,674) – (881) (1,316) (2,197)Acquisitions and disposals of subsidiaries – 6 – – 6 – 5 – 5 Depreciation charge – (231) (555) (4) (790) – (129) (256) (385)Impairment charge – (28) (25) – (53) – (10) (19) (29)Disposals – 86 341 (3) 424 – 58 221 279 Fully depreciated assets written off – 2 1 – 3 – 2 1 3 Exchange and other adjustments – (33) (366) – (399) – 20 (1) 19 As at 31st December 2010 – (1,326) (3,133) (24) (4,483) – (935) (1,370) (2,305)Net book value 1,570 2,903 1,616 51 6,140 4 1,180 694 1,878
2009 Cost As at 1st January 2009 – 3,624 3,944 304 7,872 – 1,840 1,915 3,755 Acquisitions and disposals of subsidiaries 978 171 5 – 1,154 – – – – Disposal of discontinued operations – (120) (99) – (219) – – – – Additions and disposals 137 233 387 (37) 720 – 131 169 300 Change in fair value of investment properties 6 – – – 6 – – – – Fully depreciated assets written off – (6) (17) – (23) – – – – Exchange and other adjustments 86 (72) (23) (201) (210) – (15) (11) (26)As at 31st December 2009 1,207 3,830 4,197 66 9,300 – 1,956 2,073 4,029 Accumulated depreciation and impairment As at 1st January 2009 – (1,011) (2,144) (43) (3,198) – (830) (1,135) (1,965)Acquisitions and disposals of subsidiaries – – 2 – 2 – – – – Disposal of discontinued operations – 33 64 – 97 – – – – Depreciation charge – (201) (565) (20) (786) – (91) (253) (344)Impairment charge – (32) (2) – (34) – (12) (1) (13)Disposals – 46 97 1 144 – 37 60 97 Fully depreciated assets written off – 6 17 – 23 – – – – Exchange and other adjustments – 31 2 45 78 – 15 13 28 As at 31st December 2009 – (1,128) (2,529) (17) (3,674) – (881) (1,316) (2,197)Net book value 1,207 2,702 1,668 49 5,626 – 1,075 757 1,832
Of the depreciation charge for 2009, £759m relates to continuing operations.
The fair value of Barclays investment property is based on valuations supported by appropriately qualified independent valuers.
Property rentals of £48m (2009: £64m) have been included in other income and gains on property disposals of £29m (2009: £29m) have been included in administration and general expenses.
Barclays Bank PLC Annual Report 2010 www.barclays.com/annualreport10 109

Notes to the financial statementsFor the year ended 31st December 2010 continued
20 Financial liabilities designated at fair value
The Group The Bank The Group The Bank
2010 2009
Fair Value£m
Contractualamount dueon maturity
£mFair Value
£m
Contractualamount dueon maturity
£mFair Value
£m
Contractualamount dueon maturity
£mFair Value
£m
Contractualamount dueon maturity
£m
Debt securities 76,907 81,589 80,227 83,139 72,191 77,636 71,303 76,372 Deposits 10,243 10,950 8,607 8,784 6,275 6,544 4,581 4,849 Liabilities to customers under investment contracts 1,947 – – – 1,679 – – – Other financial assets 8,632 9,533 8,208 8,897 7,736 8,811 7,662 8,692 Financial liabilities designated at fair value 97,729 102,072 97,042 100,820 87,881 92,991 83,546 89,913
The own credit adjustment arose from on £96bn of Barclays Capital’s financial liabilities designated at fair value (2009: £86bn). The cumulative own credit net gain that has been recognised is £892m at 31st December 2010 (2009: £501m).
21 Accruals, deferred income and other liabilities
The Group The Bank
2010£m
2009£m
2010£m
2009£m
Accruals and deferred income 5,539 6,007 2,353 4,854 Other creditors 5,198 5,972 15,217 1,565 Obligations under finance leases (Note 37) 87 122 – 4 Insurance contract liabilities, including unit-linked liabilities 2,409 2,140 – – Accruals, deferred income and other liabilities 13,233 14,241 17,570 6,423
Insurance liabilities relate principally to the Group's long-term business. Insurance contract liabilities associated with the Group's short-term non-life business are £131m (2009: £132m).
The maximum amounts payable under all of the Group's insurance products, ignoring the probability of insured events occurring and the contribution from investments backing the insurance policies were £71bn (2009: £63bn) or £67bn (2009: £57bn) after reinsurance. Of this insured risk £56bn (2009: £49bn) was concentrated in short-term insurance contracts and £65bn (2009: £55bn) was concentrated in Africa.
The maximum impact to profit or loss and equity under any reasonably possible change in the assumptions used to calculate the insurance liabilities would be £12m (2009: £14m).
22 Subordinated liabilitiesSubordinated liabilities, which are all issued by Barclays Bank PLC ('The Bank') or other subsidiaries of the Group, include accrued interest and comprise dated and undated loan capital as follows:
The Group The Bank
2010£m
2009£m
2010£m
2009£m
Undated loan capital 9,094 8,148 8,923 8,207 Dated loan capital 19,405 17,668 18,071 16,686 28,499 25,816 26,994 24,893
110 Barclays Bank PLC Annual Report 2010 www.barclays.com/annualreport10

22 Subordinated liabilities continued
Undated loan capital The Group The Bank
Initial call date2010
£m2009
£m2010
£m2009
£m
Non-convertible Barclays Bank PLC Tier One Notes (TONs) 6% Callable Perpetual Core Tier One Notes 2032 453 424 453 424 6.86% Callable Perpetual Core Tier One Notes (US$1,000m) 2032 866 784 866 784 Reserve Capital Instruments (RCIs) 5.926% Step-up Callable Perpetual Reserve Capital Instruments (US$1,350m) 2016 1,010 928 1,010 928 6.3688% Step-up Callable Perpetual Reserve Capital Instruments 2019 608 567 608 567 7.434% Step-up Callable Perpetual Reserve Capital Instruments (US$1,250m) 2017 950 866 950 866 14% Step-up Callable Perpetual Reserve Capital Instruments 2019 2,887 2,608 2,887 2,608 5.3304% Step-up Callable Perpetual Reserve Capital Instruments 2036 599 560 599 560 Undated notes 6.875% Undated Subordinated Notes 2015 156 151 156 151 6.375% Undated Subordinated Notes 2017 150 147 150 147 7.7% Undated Subordinated Notes (US$99m) 2018 69 65 69 65 8.25% Undated Subordinated Notes 2018 156 152 156 152 7.125% Undated Subordinated Notes 2020 190 180 190 180 6.125% Undated Subordinated Notes 2027 234 220 234 220 Junior Undated Floating Rate Notes (US$121m) Any interest payment date 78 75 139 134 Undated Floating Rate Primary Capital Notes Series 3 Any interest payment date 145 145 145 145 Bonds 9.25% Perpetual Subordinated Bonds (ex-Woolwich PLC) 2021 96 95 96 95 9% Permanent Interest Bearing Capital Bonds At any time 41 43 41 43 Loans 5.03% Reverse Dual Currency Undated Subordinated Loan (Yen 8,000m) 2028 70 55 70 55 5% Reverse Dual Currency Undated Subordinated Loan (Yen 12,000m) 2028 104 83 104 83 Barclays SLCSM Funding B.V. guaranteed by the Bank 6.140% Fixed Rate Guaranteed Perpetual Subordinated Notes 2015 232 – – – Undated loan capital – non-convertible 9,094 8,148 8,923 8,207
The principal terms of the undated loan capital are described below:
Security None of the undated loan capital is secured.
SubordinationAll undated loan capital ranks behind the claims against the bank of depositors and other unsecured unsubordinated creditors and holders of dated loan capital in the following order: Junior Undated Floating Rate Notes; other issues of Undated Notes, Bonds and Loans-ranking pari passu with each other; followed by TONs and RCIs-ranking pari passu with each other.
InterestAll undated loan capital bears a fixed rate of interest until the initial call date, with the exception of the 9% Bonds which are fixed for the life of the issue, and the Junior and Series 3 Undated Notes which are floating rate.
After the initial call date, in the event that they are not redeemed, the 6.875%, 6.375%, 7.125%, 6.125% Undated Notes, the 9.25% Bonds and the 6.140% Perpetual Notes will bear interest at rates fixed periodically in advance for five year periods based on market rates. All other undated loan capital except the two floating rate Undated Notes will bear interest, and the two floating rate Undated Notes currently bear interest, at rates fixed periodically in advance based on London interbank rates.
Barclays Bank PLC Annual Report 2010 www.barclays.com/annualreport10 111

Notes to the financial statementsFor the year ended 31st December 2010 continued
22 Subordinated liabilities continuedPayment of interestBarclays Bank PLC is not obliged to make a payment of interest on its Undated Notes, Bonds and Loans excluding the 7.7% Undated Notes, 8.25% Undated Notes, 9.25% Bonds and 6.140% Perpetual Notes if, in the preceding six months, a dividend has not been declared or paid on any class of shares of Barclays PLC or, in certain cases, any class of preference shares of the Bank. The Bank is not obliged to make a payment of interest on its 9.25% Perpetual Subordinated Bonds if, in the immediately preceding 12 months’ interest period, a dividend has not been paid on any class of its share capital. Interest not so paid becomes payable in each case if such a dividend is subsequently paid or in certain other circumstances. During the year, the Bank declared and paid dividends on its ordinary shares and on all classes of preference shares.
No payment of principal or any interest may be made unless the Bank satisfies a specified solvency test.
The Bank may elect to defer any payment of interest on the 7.7% Undated Notes and 8.25% Undated Notes. Until such time as any deferred interest has been paid in full, neither the Bank nor Barclays PLC may declare or pay a dividend, subject to certain exceptions, on any of its ordinary shares, preference shares, or other share capital or satisfy any payments of interest or coupons on certain other junior obligations.
The Issuer and the Bank may elect to defer any payment of interest on the 6.140% Perpetual Notes. However, any deferred interest will automatically become immediately due and payable on the earlier of: (i) the date on which any dividend or other distribution or interest or other payment is made in respect of any pari passu or any junior obligations or on which any pari passu or any junior obligations are purchased, (ii) the date of redemption or purchase of the 6.140% Perpetual Notes and (iii) certain other events including bankruptcy, liquidation or winding up of the Issuer or the Bank.
The Bank may elect to defer any payment of interest on the RCIs. Any such deferred payment of interest must be paid on the earlier of: (i) the date of redemption of the RCIs, (ii) the coupon payment date falling on or nearest to the tenth anniversary of the date of deferral of such payment, and (iii) in respect of the 14% RCIs only, substitution. Whilst such deferral is continuing, neither the Bank nor Barclays PLC may declare or pay a dividend, subject to certain exceptions, on any of its ordinary shares or preference shares.
The Bank may elect to defer any payment of interest on the TONs if it determines that it is, or such payment would result in it being, in non-compliance with capital adequacy requirements and policies of the FSA. Any such deferred payment of interest will only be payable on a redemption of the TONs. Until such time as the Bank next makes a payment of interest on the TONs, neither the Bank nor Barclays PLC may (i) declare or pay a dividend, subject to certain exceptions, on any of their respective ordinary shares or Preference Shares, or make payments of interest in respect of the Bank’s Reserve Capital Instruments and (ii) certain restrictions on the redemption, purchase or reduction of their respective share capital and certain other securities also apply.
RepaymentAll undated loan capital is repayable, at the option of the Bank generally in whole at the initial call date and on any subsequent coupon or interest payment date or in the case of the 6.875%, 6.375%, 7.125%, 6.125% Undated Notes, the 9.25% Bonds and the 6.140% Perpetual Notes on any fifth anniversary after the initial call date. In addition, each issue of undated loan capital is repayable, at the option of the Bank, in whole for certain tax reasons, either at any time, or on an interest payment date. There are no events of default except non-payment of principal or mandatory interest. Any repayments require the prior notification to the FSA.
All issues of undated loan capital have been made in the euro currency market and/or under Rule 144A, and no issues have been registered under the US Securities Act of 1933.
112 Barclays Bank PLC Annual Report 2010 www.barclays.com/annualreport10

22 Subordinated liabilities continued
Dated loan capital The Group The Bank
Initial call date Maturity date2010
£m2009
£m2010
£m2009
£m
Non-convertible Barclays Bank PLC 12% Unsecured Capital Loan Stock 2010 – 27 – 27 5.75% Subordinated Notes (€1,000m) 2011 836 853 836 853 5.25% Subordinated Notes(€250m) (ex-Woolwich plc) 2011 221 246 221 246 5.015% Subordinated Notes (US$150m) 2013 104 99 104 99 4.875% Subordinated Notes (€750m) 2013 670 693 670 693 Callable Floating Rate Subordinated Notes (US$1,500m) 2010 2015 – 927 – 927 4.38% Fixed Rate Subordinated Notes (US$75m) 2015 55 51 55 51 4.75% Fixed Rate Subordinated Notes (US$150m) 2015 111 103 111 103 Floating Rate Subordinated Step-up Callable Notes (US$750m) 2011 2016 484 463 484 463 Callable Floating Rate Subordinated Notes (€1,250m) 2011 2016 1,082 1,115 1,082 1,115 Callable Floating Rate Subordinated Notes (US$500m) 2012 2017 323 309 323 309 10.125% Subordinated Notes (ex-Woolwich plc) 2012 2017 105 107 105 107 Floating Rate Subordinated Step-up Callable Notes (US$1,500m) 2012 2017 969 926 969 926 Floating Rate Subordinated Step-up Callable Notes (€1,500m) 2012 2017 1,296 1,337 1,296 1,337 6.05% Fixed Rate Subordinated Notes (US$2,250m) 2017 1,662 1,505 1,662 1,505 Floating Rate Subordinated Notes(€40m) 2018 35 36 35 36 6% Fixed Rate Subordinated Notes (€1,750m) 2018 1,596 1,641 1,596 1,641 CMS-Linked Subordinated Notes (€100m) 2018 90 92 90 92 CMS-Linked Subordinated Notes (€135m) 2018 121 124 121 124 Floating Rate Subordinated Notes (€50m) 2019 42 43 42 43 Callable Fixed/Floating Rate Subordinated Notes (€1,000m) 2014 2019 904 915 904 915 5.14% Lower Tier 2 Notes (US$1,250m) 2015 2020 791 – 791 – 6% Fixed Rate Subordinated Notes (€1,500m) 2021 1,316 – 1,316 – 9.5% Subordinated Bonds (ex-Woolwich plc) 2021 292 276 292 276 Subordinated Floating Rate Notes (€100m) 2021 85 87 85 87 10% Fixed Rate Subordinated Notes 2021 2,160 2,022 2,160 2,022 10.179% Fixed Rate Subordinated Notes (US$1,521m) 2021 1,040 942 1,040 942 Subordinated Floating Rate Notes (€50m) 2022 43 45 43 45 Subordinated Floating Rate Notes (€50m) 2023 43 45 43 45 Fixed/Floating Rate Subordinated Callable Notes 2018 2023 590 568 590 568 5.75% Fixed Rate Subordinated Notes 2026 675 631 675 631 5.4% Reverse Dual Currency Subordinated Loan (Yen 15,000m) 2027 132 105 132 105 6.33% Subordinated Notes 2032 53 52 53 52 Subordinated Floating Rate Notes (€100m) 2040 86 89 86 89 Other loans from subsidiaries – – 59 212 Absa 10.75% Subordinated Callable Notes (ZAR 1,100m) 2010 2015 – 95 – – Subordinated Callable Notes (ZAR 400m) 2010 2015 – 36 – – 8.75% Subordinated Callable Notes (ZAR 1,500m) 2012 2017 154 129 – – Subordinated Callable Notes (ZAR 1,886m) 2013 2018 210 173 – – 8.8% Subordinated Fixed Rate Callable Notes (ZAR 1,725m) 2014 2019 178 143 – – Subordinated Callable Notes (ZAR 3,000m) 2014 2019 331 268 – – 8.1% Subordinated Callable Notes (ZAR 2,000m) 2015 2020 200 160 – – 10.28% Subordinated Callable Notes (ZAR 600m) 2017 2022 60 – – – Subordinated Callable Notes (ZAR 400m) 2017 2022 41 – – – Subordinated Callable Notes (ZAR 1,500m) 2023 2028 156 127 – – Other capital issued by Barclays Spain, Ghana, Kenya and Zambia 2011-2016 37 38 – – Dated loan capital – non-convertible 19,379 17,643 18,071 16,686 Dated loan capital – convertible issued by Barclays Botswana and Zambia 2014-2015 26 25 – – Total dated loan capital 19,405 17,668 18,071 16,686
Barclays Bank PLC Annual Report 2010 www.barclays.com/annualreport10 113

Notes to the financial statementsFor the year ended 31st December 2010 continued
22 Subordinated liabilities continuedDated loan capitalDated loan capital is issued by the Bank for the development and expansion of the Group’s business and to strengthen its capital base, by Barclays Bank Spain SA (Barclays Spain), Barclays Bank of Botswana Ltd (Barclays Botswana), Barclays Bank Zambia PLC (Barclays Zambia) and Barclays Bank of Kenya (Barclays Kenya) to enhance their respective capital bases and by Absa and Barclays Bank of Ghana Ltd (Barclays Ghana) for general corporate purposes.
The principal terms of the dated loan capital are described below:
Security None of the Groups dated loan capital is secured.
SubordinationAll dated loan capital ranks behind the claims against the bank of depositors and other unsecured unsubordinated creditors but before the claims of the undated loan capital and the holders of their equity. The dated loan capital issued by subsidiaries, are similarly subordinated.
InterestInterest on the floating rate Notes are fixed periodically in advance, based on the related interbank or local central bank rates.
All other non-convertible Notes except the 10.125% Subordinated Notes 2017 are generally fixed interest for the life of the issue, but some are reset to a floating rate after a fixed period, with varying interest rate terms. The 10.125% Subordinated Notes 2017, if not called in 2012, will bear interest at a rate fixed in advance for a further period of 5 years.
The 5.14% Lower Tier 2 Notes were registered under the US Securities Act of 1933. All other issues of dated loan capital have been made in the euro currency market, local markets and/or under Rule 144A.
Repayment termsThose Notes with a call date are repayable at the option of the issuer, on conditions governing the respective debt obligations, some in whole or in part, and some only in whole. The remaining dated loan capital outstanding at 31st December 2010 is redeemable only on maturity, subject in particular cases, to provisions allowing an early redemption in the event of certain changes in tax law or, in the case of Barclays Botswana and Barclays Zambia, to certain changes in legislation or regulations.
Any repayments prior to maturity require, in the case of the Bank, the prior notification to the FSA, or in the case of the overseas issues, the approval of the local regulator for that jurisdiction.
There are no committed facilities in existence at the balance sheet date which permit the refinancing of debt beyond the date of maturity.
114 Barclays Bank PLC Annual Report 2010 www.barclays.com/annualreport10

23 Provisions
Onerouscontracts
£m
Redundancyand re-
structuring£m
Undrawncontractually
committedfacilities and
guaranteesprovided
£m
Sundryprovisions
£mTotal
£m
The Group At 1st January 2010 68 162 162 198 590 Acquisitions and disposals of subsidiaries – – 1 6 7 Exchange and other adjustments – – 6 12 18 Additions 36 139 118 533 826 Amounts utilised (28) (68) (8) (229) (333)Unused amounts reversed (4) (56) (50) (53) (163)Amortisation of discount 2 – – – 2 At 31st December 2010 74 177 229 467 947 The Bank At 1st January 2010 58 148 196 62 464 Acquisitions and disposals of subsidiaries – – 1 6 7 Exchange and other adjustments – – 9 (1) 8 Additions 36 132 34 391 593 Amounts utilised (24) (59) (8) (209) (300)Unused amounts reversed (4) (55) (48) (16) (123)Amortisation of discount 2 – – – 2 At 31st December 2010 68 166 184 233 651
The Group At 1st January 2009 50 118 109 258 535 Acquisitions and disposals of subsidiaries – (2) 1 (6) (7)Exchange and other adjustments – 4 2 – 6 Additions 51 269 119 125 564 Amounts utilised (27) (201) (21) (142) (391)Unused amounts reversed (8) (26) (48) (37) (119)Amortisation of discount 2 – – – 2 At 31st December 2009 68 162 162 198 590 The Bank At 1st January 2009 48 110 100 132 390 Acquisitions and disposals of subsidiaries 2 (1) – (3) (2)Exchange and other adjustments – 3 2 2 7 Additions 41 216 159 16 432 Amounts utilised (27) (155) (21) (76) (279)Unused amounts reversed (8) (25) (44) (9) (86)Amortisation of discount 2 – – – 2 At 31st December 2009 58 148 196 62 464
Provisions expected to be recovered or settled within no more than 12 months after 31st December 2010 for the Group were £658m (2009: £466m) and for the Bank were £468m (2009: £408m).
Provisions in respect of litigation included in sundry provisions for the Group were £151m (2009: £27m) and for the Bank were £116m (2009: £nil).
Barclays Bank PLC Annual Report 2010 www.barclays.com/annualreport10 115

Notes to the financial statementsFor the year ended 31st December 2010 continued
24 Contingent liabilities and commitmentsThe following table summarises the nominal principal amount of contingent liabilities and commitments with off-balance sheet risk:
The Group The Bank
2010£m
2009£m
2010£m
2009£m
Securities lending arrangements 27,672 27,406 27,672 27,406Guarantees and letters of credit pledged as collateral security 13,783 15,406 11,823 13,150 Performance guarantees, acceptances and endorsements 9,175 9,962 7,301 7,752 Contingent liabilities 50,630 52,774 46,796 48,308 Documentary credits and other short-term trade related transactions 1,194 762 924 535 Standby facilities, credit lines and other commitments 222,963 206,513 173,795 159,281
In common with other banks, the Group conducts business involving acceptances, performance bonds and indemnities. The majority of these facilities are offset by corresponding obligations of third parties.
Contingent liabilities Up to the disposal of Barclays Global Investors on 1st December 2009, the Group facilitated securities lending arrangements for its managed investment funds whereby securities held by funds under management were lent to third parties. Borrowers provided cash or investment grade assets as collateral equal to 100% of the market value of the securities lent plus a margin of 2%-10%. The Group agreed with BlackRock, Inc. to continue to provide indemnities to support these arrangements for three years following the sale of the business. As at 31st December 2010, the fair value of the collateral held was £28,465m (2009: £28,248m) and that of the stock lent was £27,672m (2009: £27,406m).
Guarantees and letters of credit are given as security to support the performance of a customer to third parties. As the Group will only be required to meet these obligations in the event of the customer’s default, the cash requirements of these instruments are expected to be considerably below their nominal amounts.
Performance guarantees are generally, short-term commitments to third parties which are not directly dependent on the customer’s creditworthiness. An acceptance is an undertaking by a bank to pay a bill of exchange drawn on a customer. The Group expects most acceptances to be presented, but reimbursement by the customer is normally immediate. Endorsements are residual liabilities of the Group in respect of bills of exchange, which have been paid and subsequently rediscounted.
Documentary credits and other short-term trade related transactionsDocumentary credits commit the Group to make payments to third parties, on production of documents, which are usually reimbursed immediately by customers.
Standby facilities, credit lines and other commitmentsCommitments to lend are agreements to lend to a customer in the future, subject to certain conditions. Such commitments are either made for a fixed period, or have no specific maturity but are cancellable by the lender subject to notice requirements.
Financial Services Compensation SchemeThe Financial Services Compensation Scheme (FSCS) is the UK’s compensation fund for customers of authorised financial services firms that are unable to pay claims. The FSCS raises levies on all UK deposit taking institutions. Previously compensation has been paid out by facilities provided by HM Treasury to FSCS in support of FSCS’s obligations to the depositors of banks declared in default. The total of these facilities is understood to be approximately £20bn. While it is anticipated that the substantial majority of these facilities will be repaid wholly from recoveries from the institutions concerned, there is the risk of a shortfall, such that the FSCS may place additional levies on all FSCS participants. Barclays has included an accrual of £63m in other liabilities as at 31st December 2010 (2009: £108m) in respect of levies raised by the FSCS.
Barclays Capital US mortgage activitiesBarclays activities within the US mortgage sector during the period 2005 through 2008 included: sponsoring and underwriting of approximately $39bn of private-label securitisations; underwriting of approximately $34bn of other private-label securitisations; sales of approximately $150m of loans to government sponsored enterprises (GSEs); and sales of approximately $7bn of loans to others - including loans sold in 2009. Some of the loans sold were originated by a Barclays subsidiary. Barclays also performed servicing activities through its US residential mortgage servicing business which Barclays acquired in Q4 2006 and subsequently sold in Q3 2010.
In connection with certain Barclays whole loan sales and sponsored private-label securitisations, Barclays made certain loan level representations and warranties (R&Ws) generally relating to the underlying borrower, property and/or mortgage documentation. Under certain circumstances, Barclays may be required to repurchase the related loans or make other payments related to such loans if the R&Ws were breached. The $7bn of loans sold to others were generally priced at significant discounts and contained more limited R&Ws than loans sold to GSEs. Third party originators provided loan level R&Ws directly to the securitisation trusts for approximately $34bn of the $39bn in Barclays sponsored securitisations. Barclays or a subsidiary provided loan level R&Ws to the securitisation trusts for approximately $5bn of the Barclays sponsored securitisations. Total unresolved repurchase requests associated with all loans sold to others and private-label activities were $21m at 31st December 2010. Current provisions are adequate to cover estimated losses associated with outstanding repurchase claims. However, based upon the large number of defaults occurring in US residential mortgages, there is a potential for additional claims for repurchases.
Claims against Barclays as an underwriter of RMBS offerings have been brought in certain civil actions. Additionally, Barclays has received inquiries from various regulatory and governmental authorities regarding its mortgage-related activities and is cooperating with such inquiries.
It is not possible to provide a meaningful estimate of the financial impact of the potential exposure relating to all of the foregoing matters at this time.
116 Barclays Bank PLC Annual Report 2010 www.barclays.com/annualreport10

24 Contingent liabilities and commitments continuedAssets pledgedAssets are pledged as collateral to secure liabilities under repurchase agreements, securitisations and stock lending agreements or as security deposits relating to derivatives. The disclosure includes any asset transfers associated with liabilities under repurchase agreements and securities lending transactions.
The following table summarises the nature and carrying amount of the assets pledged as security against these liabilities:
The Group The Bank
2010£m
2009£m
2010£m
2009£m
Trading portfolio assets 111,703 96,176 54,716 53,208 Loans and advances 30,584 48,846 27,550 46,433Available for sale investments 22,941 24,264 18,907 17,452 Other 45 77 – 10 Assets pledged 165,273 169,363 101,173 117,103
Collateral held as security for assetsUnder certain transactions, including reverse repurchase agreements and stock borrowing transactions, the Group is allowed to resell or repledge the collateral held. The fair value at the balance sheet date of collateral accepted and repledged to others was as follows:
The Group The Bank
2010£m
2009£m
2010£m
2009£m
Fair value of securities accepted as collateral 422,890 357,159 394,851 339,995 Of which fair value of securities repledged/transferred to others 347,557 283,334 358,593 275,387
25 Legal proceedingsLehman Brothers Holdings Inc.On 15th September 2009, motions were filed in the United States Bankruptcy Court for the Southern District of New York (the Court) by Lehman Brothers Holdings Inc. (LBHI), the SIPA Trustee for Lehman Brothers Inc. (the Trustee) and the Official Committee of Unsecured Creditors of Lehman Brothers Holdings Inc. (the Committee). All three motions challenge certain aspects of the transaction pursuant to which Barclays Capital Inc. (BCI) and other companies in the Group acquired most of the assets of Lehman Brothers Inc. (LBI) in September 2008 and the court order approving such sale. The claimants seek an order voiding the transfer of certain assets to BCI; requiring BCI to return to the LBI estate alleged excess value BCI received; and declaring that BCI is not entitled to certain assets that it claims pursuant to the sale documents and order approving the sale. On 16th November 2009, LBHI, the Trustee and the Committee filed separate complaints in the Court asserting claims against BCI based on the same underlying allegations as the pending motions and seeking relief similar to that which is requested in the motions. On 29th January 2010, BCI filed its response to the motions. Barclays considers that the motions and claims against BCI are without merit and BCI is vigorously defending its position. On 29th January 2010, BCI also filed a motion seeking delivery of certain assets that LBHI and LBI have failed to deliver as required by the sale documents and the court order approving the sale. Approximately £2.6bn of the assets acquired as part of the acquisition had not been received by 31st December 2010, approximately £2.0bn of which were recognised as part of the accounting for the acquisition and are included in the balance sheet as at 31st December 2010. This results in an effective provision of £0.6bn against the uncertainty inherent in the litigation.
On 22nd February 2011, the Court issued its Opinion in relation to these matters. The Opinion calls for the parties to submit proposed Orders that will implement the Opinion, and anticipates a possible status conference to resolve any potential differences between the parties regarding the final Order that should be entered. Any such Order should clarify the precise impact of the Opinion, and may include specific guidance regarding the treatment of specific types of assets. Such an Order may be the subject of further proceedings or appeals by one or more of the parties.
Barclays has considered the Opinion and the decisions contained therein and its possible actions with respect thereto. If the Opinion were to be unaffected by future proceedings, Barclays estimates that its maximum possible loss, based on its worst case reading of the Opinion, would be approximately £2.6bn, after taking into account the effective provision of £0.6bn. Any such loss, however, is not considered probable and Barclays is satisfied with the current level of provision.
American Depositary SharesBarclays Bank PLC, Barclays PLC and various current and former members of Barclays PLC's Board of Directors have been named as defendants in five proposed securities class actions (which have been consolidated) pending in the United States District Court for the Southern District of New York. The consolidated amended complaint, dated 12th February 2010, alleges that the registration statements relating to American Depositary Shares representing Preferred Stock, Series 2, 3, 4 and 5 (ADS) offered by Barclays Bank PLC at various times between 2006 and 2008 contained misstatements and omissions concerning (amongst other things) Barclays portfolio of mortgage-related (including US subprime-related) securities, Barclays exposure to mortgage and credit market risk and Barclays financial condition. The consolidated amended complaint asserts claims under Sections 11, 12(a)(2) and 15 of the Securities Act of 1933. On 5th January 2011, the Court issued an order, and on 7th January 2011, judgment was entered, granting the defendants' motion to dismiss the complaint in its entirety and closing the case. On 4th February 2011, the plaintiffs filed a motion asking the Court to reconsider in part its dismissal order, and that motion is pending. Barclays considers that these ADS-related claims against it are without merit and is defending them vigorously. It is not possible to estimate any possible loss in relation to these claims or any effect that they might have upon operating results in any particular financial period.
Barclays Bank PLC Annual Report 2010 www.barclays.com/annualreport10 117

Notes to the financial statementsFor the year ended 31st December 2010 continued
25 Legal proceedings continuedOther Barclays is engaged in various other litigation proceedings both in the United Kingdom and a number of overseas jurisdictions, including the United States, involving claims by and against it which arise in the ordinary course of business. Barclays does not expect the ultimate resolution of any of the proceedings to which Barclays is party to have a significant adverse effect on the financial statements of the Group and Barclays has not disclosed the contingent liabilities associated with these claims either because they cannot reasonably be estimated or because such disclosure could be prejudicial to the conduct of the claims.
26 Competition and regulatory mattersThis note highlights some of the key competition and regulatory challenges facing Barclays, many of which are beyond our control. The extent of the impact of these matters on Barclays cannot always be predicted but may materially impact our businesses and earnings.
Regulatory changeThe scale of regulatory change remains challenging with a significant tightening of regulation and changes to regulatory structures globally, especially for banks that are deemed to be of systemic importance. Concurrently, there is continuing political and regulatory scrutiny of the operation of the banking and consumer credit industries which, in some cases, is leading to increased or changing regulation which is likely to have a significant effect on the industry.
In the UK, the FSA’s current responsibilities are to be reallocated between the Prudential Regulatory Authority (a subsidiary of the Bank of England) and a new Consumer Protection and Markets Authority by the end of 2012. The Independent Commission on Banking has been charged by the UK Government with reviewing the UK banking system. Its remit includes looking at reducing systemic risk, mitigating moral hazard, reducing the likelihood and impact of bank failure and competition issues. Its findings and recommendations are expected by September 2011.
In the United States, the Dodd-Frank Wall Street Reform and Consumer Protection Act contains far reaching regulatory reform although the full impact will not be known until implementing rules are made by governmental authorities, a process which is currently ongoing.
Payment Protection Insurance (PPI)PPI has been under scrutiny by the UK competition authorities and financial services regulators. The UK Competition Commission (CC) has undertaken an in-depth enquiry into the PPI market which has resulted in the CC introducing a number of remedies including a prohibition on sale of PPI at the point of sale.
On 10th August 2010, the FSA issued a Policy Statement which amends the DISP (Dispute Resolution: Complaints) rules in the FSA Sourcebook for the handling of such complaints. In October 2010 the British Bankers’ Association launched a judicial review of the FSA on the basis that the Policy Statement applies incorrect standards for the management of PPI sales complaints, including retrospective application of rules with higher standards than those that were in place at the time of sale. These proceedings are also against the Financial Services Ombudsman Service (FOS) which seeks to implement the same standards for the resolution of complaints referred to it. The hearing took place in January 2011. There is currently no indication of the timetable for judgment.
The final conclusion of the Judicial Review could result in a range of outcomes with the consequence that complaints relating to the sale of PPI fall to be determined in different ways with varying financial impacts for customers and Barclays. These outcomes depend on the extent to which the Policy Statement is upheld, whether the Court holds that the Policy Statement imposes requirements in addition to the DISP rules in force at the time of sale, and the impact of such matters on banks’ complaints handling and remediation practices. It is therefore not practicable to provide a reliable estimate or range of estimates of the potential financial impact of any Court decision on this matter.
InterchangeThe Office of Fair Trading (OFT), as well as other competition authorities elsewhere in Europe, continues to carry out investigations into Visa and MasterCard credit and debit interchange rates. These investigations may have an impact on the consumer credit industry as well as having the potential for the imposition of fines. Timing of these cases is uncertain but outcomes may be known within the next 2-4 years.
SanctionsUS laws and regulations require compliance with US economic sanctions, administered by the Office of Foreign Assets Control, against designated foreign countries, nationals and others. HM Treasury regulations similarly require compliance with sanctions adopted by the UK Government. Barclays conducted an internal review of its conduct with respect to US Dollar payments involving countries, persons and entities subject to US economic sanctions and reported the results of that review to various governmental authorities, including the US Department of Justice, the Manhattan District Attorney’s Office and the US Department Of Treasury’s Office of Foreign Assets Control (together the US Authorities), which conducted investigations of the matter.
On 18th August 2010, Barclays announced that it had reached settlements with the US Authorities in relation to the investigation by those agencies into compliance with US sanctions and US Dollar payment practices. In addition, an Order to Cease and Desist was issued upon consent by the Federal Reserve Bank of New York and the New York State Banking Department. Barclays agreed to pay a total penalty of $298m and entered into Deferred Prosecution Agreements covering a period of 24 months. Barclays fully briefed other relevant regulators on this settlement. The Deferred Prosecution Agreements mean that no further action will be taken against Barclays by the US Authorities if, as is Barclays intention, for the duration of the defined period Barclays meets the conditions set down in its agreements with the US Authorities. Barclays does not anticipate any further regulatory actions relating to these issues.
27 Retirement benefit obligationsPension schemes The Group has in place a number of defined benefit and defined contribution schemes in the UK and overseas.
118 Barclays Bank PLC Annual Report 2010 www.barclays.com/annualreport10

27 Retirement benefit obligations continuedThe UK Retirement Fund (UKRF) is the Group’s main scheme, representing 93% of the Group’s total retirement benefit obligations. The UKRF comprises ten sections, the most significant of which are:
– Afterwork: combines a contributory cash balance element with a voluntary defined contribution element. The majority of new employees outside of Barclays Capital since 1st October 2003 have been eligible to join Afterwork. In addition, the large majority of active members who joined the Group between July 1997 and September 2003 were transferred to Afterwork in respect of future benefits accruing from 1st January 2004.
– The 1964 Pension Scheme: most employees recruited before July 1997 built up benefits in this non-contributory defined benefit scheme in respect of service up to 31st March 2010. Pensions were calculated by reference to service and pensionable salary.
– The Pension Investment Plan (PIP): a defined contribution plan created from 1st July 2001 to provide benefits for employees of Barclays Capital.
The costs of ill-health retirements and death in service benefits are generally borne by the UKRF.
Governance The UKRF operates under trust law and is managed and administered on behalf of the members in accordance with the terms of the Trust Deed and Rules and all relevant legislation. The Corporate Trustee is Barclays Pension Funds Trustees Limited (BPFTL), a private limited company incorporated on 20th December 1990 and a wholly owned subsidiary of Barclays Bank PLC. The Trustee is the legal owner of the assets of the UKRF which are held separately from the assets of the Group.
The Trustee Board comprises six Management Directors selected by Barclays, of whom three are independent Directors with no relationship with Barclays or the UKRF, plus three Member Nominated Directors. Member Nominated Directors are selected from those eligible active staff and pensioner members who apply to be considered for the role.
The same principles of pension governance apply to the Group’s other pension schemes, although different legislation covers overseas schemes where, in most cases, the Group has the power to determine the funding rate.
The following tables present an analysis of: defined benefit obligations, the fair value of plan assets and the amounts recognised in the income statement for all Group pension schemes and unfunded post-retirement benefits.
2010 2009
Post-retirement Post-retirementPensions benefits Total Pensions benefits Total
The GroupUK£m
Overseas£m
UK£m
Overseas£m £m
UK£m
Overseas£m
UK£m
Overseas£m £m
Benefit obligation at beginning of the year (19,209) (1,277) (65) (95) (20,646) (14,395) (1,220) (43) (125) (15,783)Current service cost (293) (50) – (6) (349) (254) (27) (1) (9) (291)Interest cost (1,049) (88) (3) (6) (1,146) (941) (51) (3) (6) (1,001)Past service cost 240 (2) – – 238 (1) – – – (1)Curtailments or settlements (16) 6 – – (10) 482 (7) – 1 476 Actuarial (loss)/gain (522) (64) (2) (2) (590) (4,757) (33) (3) 7 (4,786)Contributions by plan participants (2) (7) – – (9) (2) (5) – – (7)Benefits paid 678 94 1 6 779 659 58 1 6 724 Business disposals – 2 – – 2 – 9 – 6 15 Exchange and other adjustments – (84) 17 (3) (70) – (1) (16) 25 8 Benefit obligation at end of the year (20,173) (1,470) (52) (106) (21,801) (19,209) (1,277) (65) (95) (20,646)Fair value of plan assets at beginning of the year 15,675 1,025 – – 16,700 13,537 959 – – 14,496 Expected return on plan assets 1,031 91 – – 1,122 904 31 – – 935 Employer contribution 666 55 1 6 728 525 76 1 6 608 Settlements – (2) – – (2) – (2) – – (2)Contributions by plan participants 2 7 – – 9 2 5 – – 7 Actuarial gain/(loss) 995 17 – – 1,012 1,424 (8) – – 1,416 Benefits paid (678) (94) (1) (6) (779) (659) (58) (1) (6) (724)Business disposals – – – – – – (6) – – (6)Exchange and other adjustments (70) 185 – – 115 (58) 28 – – (30)Fair value of plan assets at the end of the year 17,621 1,284 – – 18,905 15,675 1,025 – – 16,700 Net deficit (2,552) (186) (52) (106) (2,896) (3,534) (252) (65) (95) (3,946)Unrecognised actuarial losses/(gains) 2,501 150 (6) 12 2,657 3,087 158 (7) 10 3,248 Net recognised liability (51) (36) (58) (94) (239) (447) (94) (72) (85) (698)Recognised assetsa – 126 – – 126 – 71 – – 71 Recognised liability (51) (162) (58) (94) (365) (447) (165) (72) (85) (769)Net recognised liability (51) (36) (58) (94) (239) (447) (94) (72) (85) (698)
Notea Included within other assets.
Barclays Bank PLC Annual Report 2010 www.barclays.com/annualreport10 119

Notes to the financial statementsFor the year ended 31st December 2010 continued
27 Retirement benefit obligations continued
2010 2009
Post-retirement Post-retirementPensions benefits Total Pensions benefits Total
The BankUK£m
Overseas£m
UK£m
Overseas£m £m
UK£m
Overseas£m
UK£m
Overseas£m £m
Benefit obligation at beginning of the year (19,209) (245) (59) (11) (19,524) (14,395) (269) (54) (17) (14,735)Current service cost (293) (11) – – (304) (254) (6) – – (260)Interest cost (1,049) (16) (2) (1) (1,068) (941) (14) (2) (1) (958)Past service cost 240 (2) – – 238 (1) – – – (1)Curtailments or settlements (16) – – – (16) 482 – – 1 483 Actuarial (loss)/gain (522) (10) (2) – (534) (4,757) (5) (3) 4 (4,761)Contributions by plan participants (2) (1) – – (3) (2) (1) – – (3)Benefits paid 678 8 1 1 688 659 10 1 1 671 Business disposals – 2 – – 2 – – – – – Exchange and other adjustments – (19) 16 (11) (14) – 40 (1) 1 40 Benefit obligation at end of the year (20,173) (294) (46) (22) (20,535) (19,209) (245) (59) (11) (19,524)Fair value of plan assets at beginning of the year 15,675 135 – – 15,810 13,537 160 – – 13,697 Expected return on plan assets 1,031 11 – – 1,042 904 6 – – 910 Employer contribution 666 8 1 1 676 525 24 1 1 551 Contributions by plan participants 2 1 – – 3 2 1 – – 3 Actuarial gain/(loss) 995 4 – – 999 1,424 (13) – – 1,411 Benefits paid (678) (8) (1) (1) (688) (659) (10) (1) (1) (671)Exchange and other adjustments (70) 11 – – (59) (58) (33) – – (91)Fair value of plan assets at the end of the year 17,621 162 – – 17,783 15,675 135 – – 15,810 Net deficit (2,552) (132) (46) (22) (2,752) (3,534) (110) (59) (11) (3,714)Unrecognised actuarial losses/(gains) 2,501 92 (5) 5 2,593 3,087 71 (7) 2 3,153 Net recognised liability (51) (40) (51) (17) (159) (447) (39) (66) (9) (561)Recognised assetsa – 9 – – 9 – 15 – – 15 Recognised liability (51) (49) (51) (17) (168) (447) (54) (66) (9) (576)Net recognised liability (51) (40) (51) (17) (159) (447) (39) (66) (9) (561)
2010 2009 2008
Pensions£m
Other post-retirement
benefits£m
Total£m
Pensions£m
Other post-retirement
benefitsb
£mTotal
£mPensions
£m
Other post-retirement
benefits£m
Total£m
Current service cost 343 6 349 281 10 291 299 2 301 Interest cost 1,137 9 1,146 992 9 1,001 991 8 999 Expected return on scheme assets (1,122) – (1,122) (935) – (935) (1,175) – (1,175)Recognised actuarial (gain)/loss 72 3 75 96 – 96 (23) (1) (24)Past service cost (233) – (233) 6 – 6 2 (8) (6)Curtailment or settlements 16 – 16 (473) – (473) (5) – (5)Total income statement charge 213 18 231 (33) 19 (14) 89 1 90
The Group’s IAS 19 pension deficit in respect of UKRF as at 31st December 2010 was £2,552m (2009: £3,534m). The reduction in the deficit resulted principally from better than expected asset performance, contributions paid in excess of the pension expense and a credit to past service costs following amendments to the treatment of minimum defined benefits.
During 2009, the Trust Deed was amended such that with effect from 1st April 2010, the defined benefit sections within the UKRF were closed to the accrual of future pension benefits. From that date members were eligible to accrue future service pension benefits in either Afterwork or PIP. This gave rise to the recognition in 2009 of a curtailment gain of £487m, actuarial losses of £79m and an additional cost of £37m included in other staff costs.
Out of the benefit obligations of £21,801m (2009: £20,646m), £258m (2009: £288m) were wholly unfunded. Out of the Bank’s benefit obligations of £20,535m (2009: £19,524m), £88m (2009: £100m) were wholly unfunded.
Notesa Included within other assets.b Includes £3m relating to discontinued operations.
120 Barclays Bank PLC Annual Report 2010 www.barclays.com/annualreport10

27 Retirement benefit obligations continuedAssumptions The benefit obligations arising under the defined benefit schemes are actuarially valued using the projected unit credit method.
Principal assumptions UK schemes Overseas schemes
2010% p.a.
2009% p.a.
2010% p.a.
2009% p.a.
The Group Discount rate 5.31 5.61 6.94 7.53 Rate of increase in salaries 4.00 4.26 5.26 5.49 Inflation rate 3.50 3.76 3.63 3.78 Rate of increase for pensions in payment 3.35 3.56 3.08 3.27 Rate of increase for pensions in deferment 3.50 3.76 2.86 2.81 Afterwork revaluation rate 3.97 4.17 n/a n/aInitial health care inflation 6.50 7.00 8.00 8.50 Long-term health care inflation 5.00 5.00 5.00 5.00 Expected return on plan assets 6.30 6.70 6.79 7.44 The Bank Discount rate 5.31 5.61 5.47 5.91 Rate of increase in salaries 4.00 4.26 4.00 4.07 Inflation rate 3.50 3.76 2.10 2.20 Rate of increase for pensions in payment 3.35 3.56 1.18 1.27 Rate of increase for pensions in deferment 3.50 3.76 2.00 1.27 Afterwork revaluation rate 3.97 4.17 n/a n/aInitial health care inflation 6.50 7.00 8.00 8.50 Long-term health care inflation 5.00 5.00 5.00 5.00 Expected return on plan assets 6.30 6.70 5.60 6.11
The expected return on plan assets assumption is weighted on the basis of the fair value of these assets. Health care inflation assumptions are weighted on the basis of the health care cost for the period. All other assumptions are weighted on the basis of the defined benefit obligation at the end of the period.
The UK scheme discount rate assumption is based on a liability-weighted rate derived from an AA corporate bond yield curve. The overseas health care inflation assumptions relate to the US.
Mortality assumptions The UKRF’s post-retirement mortality assumptions were based on the standard 2000 series tables published by the Institute and Faculty of Actuaries as they are considered to be most relevant. These tables were adjusted in line with the UKRF’s actual experience and an allowance has been made for future mortality improvements based on the medium cohort projections published by the Continuous Mortality Investigation Bureau subject to a floor of 1% pa on future improvements. On this basis the post-retirement mortality assumptions for the UKRF are as follows:
2010 2009 2008 2007 2006
Longevity at 60 for current pensioners (years)– Males 27.6 27.5 27.4 26.7 25.8 – Females 28.7 28.7 28.5 27.9 29.5 Longevity at 60 for future pensioners currently aged 40 (years)– Males 29.7 29.6 29.5 28.0 27.1 – Females 30.7 30.6 30.5 29.1 30.7
Sensitivity analysis on principal assumptions
UKRF sensitivityImpact on UKRF benefit
obligation
(Decrease)/Increase
%
(Decrease)/Increase
£bn
0.5% increase in:– Discount rate ( 9.4) ( 1.9)– Rate of inflation 8.4 1.71 year increase to longevity at 60 2.5 0.5
Barclays Bank PLC Annual Report 2010 www.barclays.com/annualreport10 121

Notes to the financial statementsFor the year ended 31st December 2010 continued
27 Retirement benefit obligations continuedAssetsA long-term strategy has been set for the asset allocation of the UKRF which comprises a mixture of equities, bonds, property and other appropriate assets. This recognises that different asset classes are likely to produce different long-term returns and some asset classes may be more volatile than others.
The long-term strategy ensures that investments are adequately diversified. Asset managers are permitted some flexibility to vary the asset allocation from the long-term strategy within control ranges agreed with the Trustee from time to time.
The UKRF also employs derivative instruments, where appropriate, to achieve a desired exposure or return, or to match assets more closely to liabilities. The value of assets shown reflects the actual physical assets held by the scheme, with any derivative holdings reflected on a mark to market basis. The expected return on asset assumptions overall have been based on the portfolio of assets created after allowing for the net impact of the derivatives on the risk and return profile of the holdings.
The value of the assets of the schemes, their percentage in relation to total scheme assets, and their expected rate of return at 31st December 2010 and 31st December 2009 were as follows:
The Group UK schemes Overseas schemes Total
Analysis of scheme assetsValue
£m
% of total fair value of
scheme assets
Expected rate of return
%Value
£m
% of total fair value of
scheme assets
Expected rate of return
%Value
£m
% of total fair value of
scheme assets
Expected rate of return
%
2010Equities 5,349 30.4 8.4 516 40.2 7.4 5,865 31.0 8.3 Bonds 9,164 52.0 4.6 477 37.1 6.0 9,641 51.0 4.7 Property 1,277 7.2 6.8 20 1.6 10.3 1,297 6.9 6.9 Derivatives 410 2.3 – – – – 410 2.2 –Cash 1,057 6.0 0.5 158 12.3 5.8 1,215 6.4 1.2 Other 364 2.1 4.3 113 8.8 9.9 477 2.5 5.6 Fair value of plan assetsa 17,621 100 6.3 1,284 100 7.0 18,905 100 6.3
2009Equities 4,236 27.0 8.6 400 39.0 7.8 4,636 27.7 8.5 Bonds 8,787 56.0 4.9 387 37.7 6.0 9,174 54.9 4.9 Property 1,186 7.5 7.0 20 2.0 12.6 1,206 7.2 7.1 Derivatives (37) – – – – – (37) – – Cash 1,157 7.3 0.5 139 13.6 3.2 1,296 7.7 0.8 Other 346 2.2 5.0 79 7.7 8.1 425 2.5 5.6 Fair value of plan assetsa 15,675 100 6.7 1,025 100 6.6 16,700 100 6.7
Notea Excludes £1,004m (2009: £890m) representing the defined contribution assets of the UKRF.
122 Barclays Bank PLC Annual Report 2010 www.barclays.com/annualreport10

27 Retirement benefit obligations continued
The Bank UK schemes Overseas schemes Total
Analysis of scheme assetsValue
£m
% of total fair value of
scheme assets
Expected rate of return
%Value
£m
% of total fair value of
scheme assets
Expected rate of return
%Value
£m
% of total fair value of
scheme assets
Expected rate of return
%
2010Equities 5,349 30.4 8.4 60 37.0 6.8 5,409 30.4 8.4 Bonds 9,164 52.0 4.6 73 45.1 4.3 9,237 51.9 4.6 Property 1,277 7.2 6.8 – – 5.5 1,277 7.2 6.8 Derivatives 410 2.3 – – – – 410 2.3 –Cash 1,057 6.0 0.5 3 1.9 2.3 1,060 6.0 0.5 Other 364 2.1 4.3 26 16.0 9.9 390 2.2 4.7 Fair value of plan assetsa 17,621 100 6.3 162 100 6.1 17,783 100 6.3
2009Equities 4,236 27.0 8.6 48 35.6 6.9 4,284 27.0 8.6 Bonds 8,787 56.0 4.9 59 43.7 5.0 8,846 55.9 4.9 Property 1,186 7.5 7.0 – – 3.1 1,186 7.5 7.0 Derivatives (37) – – – – – (37) – – Cash 1,157 7.3 0.5 15 11.1 3.2 1,172 7.4 0.5 Other 346 2.2 5.0 13 9.6 10.0 359 2.2 5.2 Fair value of plan assetsa 15,675 100 6.7 135 100 5.9 15,810 100 6.7
The UKRF plan assets include £58m relating to UK private equity investments (2009: £58m) and £1,128m relating to overseas private equity investments (2009: £921m). These are disclosed within Equities.
Amounts included in the fair value of plan assets include £14m (2009: £4m) relating to shares in Barclays Group, £13m (2009: £5m) relating to bonds issued by the Barclays Group, and £10m (2009: £10m) relating to property occupied by Group companies. The UKRF also invests in pooled investment vehicles which may, or may not hold shares/bonds of Barclays Group.
Amounts included in the Bank fair value of plan assets include £nil (2009: £1m) relating to property occupied by Bank companies.
The expected return on assets is determined by calculating a total return estimate based on weighted average estimated returns for each asset class. Asset class returns are estimated using current and projected economic and market factors such as inflation, credit spreads and equity risk premiums.
The Group actual return on plan assets was an increase of £2,134m (2009: £2,351m increase). The Bank actual return on plan assets was an increase of £2,041m (2009: £2,321m increase).
Notea Excludes £1,004m (2009: £890m) representing the defined contribution assets of the UKRF.
Barclays Bank PLC Annual Report 2010 www.barclays.com/annualreport10 123

Notes to the financial statementsFor the year ended 31st December 2010 continued
27 Retirement benefit obligations continuedActuarial gains and lossesThe actuarial gains and losses arising on plan liabilities and plan assets are as follows:
The Group 2010£m
2009£m
2008£m
2007£m
2006£m
UK schemesPresent value of obligations (20,225) (19,274) (14,438) (16,623) (17,353)Fair value of plan assets 17,621 15,675 13,537 17,231 16,761 Net (deficit)/surplus in the plans (2,604) (3,599) (901) 608 (592)Experience (losses) and gains on plan liabilities – amount (207) 107 (81) (297) 48 – as percentage of plan liabilities (1%) 1% (1%) (2%) – Difference between actual and expected return on plan assets– amount 995 1,424 (4,534) (332) 423 – as percentage of plan assets 6% 9% (33%) (2%) 3%
Overseas schemesPresent value of obligations (1,576) (1,372) (1,345) (1,011) (970)Fair value of plan assets 1,284 1,025 959 796 745 Net deficit in the plans (292) (347) (386) (215) (225)Experience losses on plan liabilities– amount (9) (45) (96) (79) (54)– as percentage of plan liabilities (1%) (3%) (7%) (8%) (6%)Difference between actual and expected return on plan assets– amount 17 (8) (121) (11) 25 – as percentage of plan assets 1% (1%) (13%) – 3%
Total UK and Overseas schemesPresent value of obligations (21,801) (20,646) (15,783) (17,634) (18,323)Fair value of plan assets 18,905 16,700 14,496 18,027 17,506 Net (deficit)/surplus in the plans (2,896) (3,946) (1,287) 393 (817)Experience (losses) and gains on plan liabilities– amount (216) 62 (177) (376) (6)– as percentage of plan liabilities (1%) – (1%) (2%) – Difference between actual and expected return on plan assets– amount 1,012 1,416 (4,655) (343) 448 – as percentage of plan assets 5% 8% (32%) (2%) 3%
124 Barclays Bank PLC Annual Report 2010 www.barclays.com/annualreport10

27 Retirement benefit obligations continued
The Bank 2010£m
2009£m
2008£m
2007£m
2006£m
UK schemes Present value of obligations (20,219) (19,268) (14,449) (16,638) (17,000)Fair value of plan assets 17,621 15,675 13,537 17,231 16,460 Net (deficit)/surplus in the plans (2,598) (3,593) (912) 593 (540)Experience (losses) and gains on plan liabilities – amount (207) 107 (81) (299) 47 – as percentage of plan liabilities (1%) 1% (1%) (2%) – Difference between actual and expected return on plan assets – amount 995 1,424 (4,534) (332) 417 – as percentage of plan assets 6% 9% (33%) (2%) 3% Overseas schemes Present value of obligations (316) (256) (286) (213) (209)Fair value of plan assets 162 135 160 141 135 Net deficit in the plans (154) (121) (126) (72) (74)Experience losses on plan liabilities – amount (2) (5) (96) (9) (15)– as percentage of plan liabilities (1%) (2%) (34%) (4%) (7%)Difference between actual and expected return on plan assets – amount 4 (13) (65) (2) 4 – as percentage of plan assets 2% (10%) (41%) (1%) 3% Total UK and Overseas schemes Present value of obligations (20,535) (19,524) (14,735) (16,851) (17,209)Fair value of plan assets 17,783 15,810 13,697 17,372 16,595 Net (deficit)/surplus in the plans (2,752) (3,714) (1,038) 521 (614)Experience (losses) and gains on plan liabilities – amount (209) 102 (177) (308) 32 – as percentage of plan liabilities (1%) 1% (1%) (2%) – Difference between actual and expected return on plan assets – amount 999 1,411 (4,599) (334) 421 – as percentage of plan assets 6% 9% (34%) (2%) 3%
FundingThe triennial funding valuation of the UKRF is currently in progress with an effective date of 30th September 2010. The last triennial funding valuation of the UKRF was performed with an effective date of 30th September 2007 which showed a surplus of £0.2bn. In compliance with the Pensions Act 2004, the Bank and Trustee agreed a scheme-specific funding target, statement of funding principles, and a schedule of contributions. This agreement forms the basis of the Group’s commitment that the UKRF has sufficient assets to make payments to members in respect of their accrued benefits as and when they fall due. This funding valuation used a discount rate that reflected a prudent expectation of long-term future investment returns from the current and assumed future investment strategy.
The Scheme Actuary prepares an annual update of the funding position as at 30th September. The latest annual update was carried out as at 30th September 2010 and showed a deficit of £4.8bn.
The Group has agreed funding contributions which, in aggregate, are no less than those which are sufficient to meet the Group’s share of the cost of benefits accruing over each year. The Group has, in the recent past, chosen to make funding contributions in excess of this, and in 2010 made an additional voluntary contribution of £300m (2009: £150m). Defined benefit contributions paid with respect to the UKRF were as follows:
£m
Contributions paid2010 6662009 5252008 336
Based on the current schedule of contributions, the Group is committed to making estimated contributions to the UKRF in 2011 of £285m. The 30th September 2010 UKRF valuation is due to be finalised by the end of 2011. Excluding the UKRF, the Group is expected to pay contributions of approximately £1m to UK schemes and £60m to overseas schemes in 2011 and the Bank is expected to pay contributions of approximately £1m to UK schemes and £10m to overseas schemes.
Barclays Bank PLC Annual Report 2010 www.barclays.com/annualreport10 125

Notes to the financial statementsFor the year ended 31st December 2010 continued
28 Called up share capitalOrdinary SharesThe issued ordinary share capital of Barclays Bank PLC, as at 31st December 2010, comprised 2,342 million ordinary shares of £1 each (2009: 2,342 million).
Preference SharesThe issued preference share capital of Barclays Bank PLC, as at 31st December 2010, comprised 1,000 Sterling Preference Shares of £1 each (2009: 1,000); 240,000 Euro Preference Shares of €100 each (2009: 240,000); 75,000 Sterling Preference Shares of £100 each (2009: 75,000); 100,000 US Dollar Preference Shares of US$100 each (2009: 100,000); 237 million US Dollar Preference Shares of US$0.25 each (2009: 237 million).
Share Capital 2010 £m
2009 £m
Called up ordinaryshare capital, alloted and fully paid As at 1st January 2,342 2,338 Issued for cash – 4 As at 31st December 2,342 2,342 Called up preference share capital, allotted and fully paid as at 1st January and 31st December 60 60Called up share capital 2,402 2,402
Share premium 2010 £m
2009 £m
As at 1st January 12,092 12,060 Ordinary shares issued for cash – 21 Preference shares – other movement – 11 As at 31st December 12,092 12,092
Sterling £1 Preference Shares1,000 Sterling cumulative callable preference shares of £1 each (the £1 Preference Shares) were issued on 31st December 2004 at nil premium.
The £1 Preference Shares entitle the holders thereof to receive Sterling cumulative cash dividends out of distributable profits of Barclays Bank PLC, semi-annually at a rate reset semi-annually equal to the Sterling interbank offered rate for six-month Sterling deposits.
Barclays Bank PLC shall be obliged to pay such dividends if: (1) it has profits available for the purpose of distribution under the Companies Act 2006 as at each dividend payment date; and (2) it is solvent on the relevant dividend payment date, provided that a capital regulations condition is satisfied on such dividend payment date. The dividends shall not be due and payable on the relevant dividend payment date except to the extent that Barclays Bank PLC could make such payment and still be solvent immediately thereafter. Barclays Bank PLC shall be considered solvent on any date if: (1) it is able to pay its debts to senior creditors as they fall due; and (2) its auditors have reported within the previous six months that its assets exceed its liabilities. If Barclays Bank PLC shall not pay, or shall pay only in part, a dividend for a period of seven days or more after the due date for payment, the holders of the £1 Preference Shares may institute proceedings for the winding-up of Barclays Bank PLC. No remedy against Barclays Bank PLC shall be available to the holder of any £1 Preference Shares for the recovery of amounts owing in respect of £1 Preference Shares other than the institution of proceedings for the winding-up of Barclays Bank PLC and/or proving in such winding-up.
On a winding-up or other return of capital (other than a redemption or purchase by Barclays Bank PLC of any of its issued shares, or a reduction of share capital, permitted by the Articles of Barclays Bank PLC and under applicable law), the assets of Barclays Bank PLC available to shareholders shall be applied in priority to any payment to the holders of ordinary shares and any other class of shares in the capital of Barclays Bank PLC then in issue ranking junior to the £1 Preference Shares on such a return of capital and pari passu on such a return of capital with the holders of any other class of shares in the capital of Barclays Bank PLC then in issue (other than any class of shares in the capital of Barclays Bank PLC then in issue ranking in priority to the £1 Preference Shares on a winding-up or other such return of capital), in payment to the holders of the £1 Preference Shares of a sum equal to the aggregate of: (1) an amount equal to the dividends accrued thereon for the then current dividend period (and any accumulated arrears thereof) to the date of the commencement of the winding-up or other such return of capital; and (2) an amount equal to £1 per £1 Preference Share. After payment of the full amount of the liquidating distributions to which they are entitled, the holders of the £1 Preference Shares will have no right or claim to any of the remaining assets of Barclays Bank PLC and will not be entitled to any further participation in such return of capital.
The £1 Preference Shares are redeemable at the option of Barclays Bank PLC, in whole but not in part only, subject to the Companies Act 2006 and its Articles. Holders of the £1 Preference Shares are not entitled to receive notice of, or to attend, or vote at, any general meeting of Barclays Bank PLC.
Euro Preference Shares100,000 Euro 4.875% non-cumulative callable preference shares of €100 each (the 4.875% Preference Shares) were issued on 8th December 2004 for a consideration of €993.6m (£688.4m), of which the nominal value was €10m and the balance was share premium. The 4.875% Preference Shares entitle the holders thereof to receive Euro non-cumulative cash dividends out of distributable profits of Barclays Bank PLC, annually at a fixed rate of 4.875% per annum on the amount of €10,000 per preference share until 15th December 2014, and thereafter quarterly at a rate reset quarterly equal to 1.05% per annum above the Euro interbank offered rate for three-month Euro deposits.
The 4.875% Preference Shares are redeemable at the option of Barclays Bank PLC, in whole but not in part only, on 15th December 2014, and on each dividend payment date thereafter at €10,000 per share plus any dividends accrued for the then current dividend period to the date fixed for redemption.
126 Barclays Bank PLC Annual Report 2010 www.barclays.com/annualreport10

28 Called up share capital continued140,000 Euro 4.75% non-cumulative callable preference shares of €100 each (the 4.75% Preference Shares) were issued on 15th March 2005 for a consideration of €1,383.3m (£966.7m), of which the nominal value was €14m and the balance was share premium. The 4.75% Preference Shares entitle the holders thereof to receive Euro non-cumulative cash dividends out of distributable profits of Barclays Bank PLC, annually at a fixed rate of 4.75% per annum on the amount of €10,000 per preference share until 15th March 2020, and thereafter quarterly at a rate reset quarterly equal to 0.71% per annum above the Euro interbank offered rate for three-month Euro deposits.
The 4.75% Preference Shares are redeemable at the option of Barclays Bank PLC, in whole but not in part only, on 15th March 2020, and on each dividend payment date thereafter at €10,000 per share plus any dividends accrued for the then current dividend period to the date fixed for redemption.
Sterling Preference Shares75,000 Sterling 6.0% non-cumulative callable preference shares of £100 each (the 6.0% Preference Shares) were issued on 22nd June 2005 for a consideration of £743.7m, of which the nominal value was £7.5m and the balance was share premium. The 6.0% Preference Shares entitle the holders thereof to receive Sterling non-cumulative cash dividends out of distributable profits of Barclays Bank PLC, annually at a fixed rate of 6.0% per annum on the amount of £10,000 per preference share until 15th December 2017, and thereafter quarterly at a rate reset quarterly equal to 1.42% per annum above the London interbank offered rate for three-month Sterling deposits.
The 6.0% Preference Shares are redeemable at the option of Barclays Bank PLC, in whole but not in part only, on 15th December 2017, and on each dividend payment date thereafter at £10,000 per share plus any dividends accrued for the then current dividend period to the date fixed for redemption.
US Dollar Preference Shares100,000 US Dollar 6.278% non-cumulative callable preference shares of US$100 each (the 6.278% Preference Shares), represented by 100,000 American Depositary Shares, Series 1, were issued on 8th June 2005 for a consideration of US$995.4m (£548.1m), of which the nominal value was US$10m and the balance was share premium. The 6.278% Preference Shares entitle the holders thereof to receive US Dollar non-cumulative cash dividends out of distributable profits of Barclays Bank PLC, semi-annually at a fixed rate of 6.278% per annum on the amount of US$10,000 per preference share until 15th December 2034, and thereafter quarterly at a rate reset quarterly equal to 1.55% per annum above the London interbank offered rate for three-month US Dollar deposits.
The 6.278% Preference Shares are redeemable at the option of Barclays Bank PLC, in whole but not in part only, on 15th December 2034, and on each dividend payment date thereafter at US$10,000 per share plus any dividends accrued for the then current dividend period to the date fixed for redemption.
30 million US Dollar 6.625% non-cumulative callable preference shares of US$0.25 each (the 6.625% Preference Shares), represented by 30 million American Depositary Shares, Series 2, were issued on 25th and 28th April 2006 for a consideration of US$727m (£406m), of which the nominal value was US$7.5m and the balance was share premium. The 6.625% Preference Shares entitle the holders thereof to receive US Dollar non-cumulative cash dividends out of distributable profits of Barclays Bank PLC, quarterly at a fixed rate of 6.625% per annum on the amount of US$25 per preference share.
The 6.625% Preference Shares are redeemable at the option of Barclays Bank PLC, in whole but not in part only, on 15th September 2011, and on each dividend payment date thereafter at US$25 per share plus any dividends accrued for the then current dividend period to the date fixed for redemption.
55 million US Dollar 7.1% non-cumulative callable preference shares of US$0.25 each (the 7.1% Preference Shares), represented by 55 million American Depositary Shares, Series 3, were issued on 13th September 2007 for a consideration of US$1,335m (£657m), of which the nominal value was US$13.75m and the balance was share premium. The 7.1% Preference Shares entitle the holders thereof to receive US Dollar non-cumulative cash dividends out of distributable profits of Barclays Bank PLC, quarterly at a fixed rate of 7.1% per annum on the amount of US$25 per preference share.
The 7.1% Preference Shares are redeemable at the option of Barclays Bank PLC, in whole or in part, on 15th December 2012, and on each dividend payment date thereafter at US$25 per share plus any dividends accrued for the then current dividend period to the date fixed for redemption.
46 million US Dollar 7.75% non-cumulative callable preference shares of US$0.25 each (the 7.75% Preference Shares), represented by 46 million American Depositary Shares, Series 4, were issued on 7th December 2007 for a consideration of US$1,116m (£550m), of which the nominal value was US$11.5m and the balance was share premium. The 7.75% Preference Shares entitle the holders thereof to receive US Dollar non-cumulative cash dividends out of distributable profits of Barclays Bank PLC, quarterly at a fixed rate of 7.75% per annum on the amount of US$25 per preference share.
The 7.75% Preference Shares are redeemable at the option of Barclays Bank PLC, in whole or in part, on 15th December 2013, and on each dividend payment date thereafter at US$25 per share plus any dividends accrued for the then current dividend period to the date fixed for redemption.
106 million US Dollar 8.125% non-cumulative callable preference shares of US$0.25 each (the 8.125% Preference Shares), represented by 106 million American Depositary Shares, Series 5, were issued on 11th April 2008 and 25th April 2008 for a total consideration of US$2,650m (£1,345m), of which the nominal value was US$26.5m and the balance was share premium. The 8.125% Preference Shares entitle the holders thereof to receive US Dollar non-cumulative cash dividends out of distributable profits of Barclays Bank PLC, quarterly at a fixed rate of 8.125% per annum on the amount of US$25 per preference share.
The 8.125% Preference Shares are redeemable at the option of Barclays Bank PLC, in whole or in part, on 15th June 2013, and on each dividend payment date thereafter at US$25 per share plus any dividends accrued for the then current dividend period to the date fixed for redemption.
No redemption or purchase of any 4.875% Preference Shares, the 4.75% Preference Shares, the 6.0% Preference Shares, the 6.278% Preference Shares, the 6.625% Preference Shares, the 7.1% Preference Shares, the 7.75% Preference Shares and the 8.125% Preference Shares (together, the Preference Shares) may be made by Barclays Bank PLC without the prior notification to the UK FSA and any such redemption will be subject to the Companies Act 2006 and the Articles of Barclays Bank PLC.
Barclays Bank PLC Annual Report 2010 www.barclays.com/annualreport10 127
Notes to the financial statementsFor the year ended 31st December 2010 continued
28 Called up share capital continuedOn a winding-up of Barclays Bank PLC or other return of capital (other than a redemption or purchase of shares of Barclays Bank PLC, or a reduction of share capital), a holder of Preference Shares will rank in the application of assets of Barclays Bank PLC available to shareholders: (1) junior to the holder of any shares of Barclays Bank PLC in issue ranking in priority to the Preference Shares; (2) equally in all respects with holders of other preference shares and any other shares of Barclays Bank PLC in issue ranking pari passu with the Preference Shares; and (3) in priority to the holders of ordinary shares and any other shares of Barclays Bank PLC in issue ranking junior to the Preference Shares.
The holders of the £400m 6% Callable Perpetual Core Tier One Notes and the US$1,000m 6.86% Callable Perpetual Core Tier One Notes of Barclays Bank PLC (together, the TONs) and the holders of the US$1,250m 8.55% Step-up Callable Perpetual Reserve Capital Instruments, the US$750m 7.375% Step-up Callable Perpetual Reserve Capital Instruments, the €850m 7.50% Step-up Callable Perpetual Reserve Capital Instruments, the £500m 5.3304% Step-up Callable Perpetual Reserve Capital Instruments, the US$1,350m 5.926% Step-up Callable Perpetual Reserve Capital Instruments, the £500m 6.3688% Step-up Callable Perpetual Reserve Capital Instruments, the US$1,250m 7.434% Step-up Callable Perpetual Reserve Capital Instruments and the £3,000m 14% Step-up Callable Perpetual Reserve Capital Instruments of Barclays Bank PLC (together, the RCIs) would, for the purposes only of calculating the amounts payable in respect of such securities on a winding-up of Barclays Bank PLC, subject to limited exceptions and to the extent that the TONs and the RCIs are then in issue, rank pari passu with the holders of the most senior class or classes of preference shares then in issue in the capital of Barclays Bank PLC. Accordingly, the holders of the preference shares would rank equally with the holders of such TONs and RCIs on such a winding-up of Barclays Bank PLC (unless one or more classes of shares of Barclays Bank PLC ranking in priority to the preference shares are in issue at the time of such winding-up, in which event the holders of such TONs and RCIs would rank equally with the holders of such shares and in priority to the holders of the preference shares).
Subject to such ranking, in such event, holders of the preference shares will be entitled to receive out of assets of Barclays Bank PLC available for distributions to shareholders, liquidating distributions in the amount of €10,000 per 4.875% Preference Share, €10,000 per 4.75% Preference Share, £10,000 per 6.0% Preference Share, US$10,000 per 6.278% Preference Share, US$25 per 6.625% Preference Share, US$25 per 7.1% Preference Share, US$25 per 7.75% Preference Share and US$0.25 per 8.125% Preference Share, plus, in each case, an amount equal to the accrued dividend for the then current dividend period to the date of the commencement of the winding-up or other such return of capital. If a dividend is not paid in full on any preference shares on any dividend payment date, then a dividend restriction shall apply.
This dividend restriction will mean that neither Barclays Bank PLC nor Barclays PLC may (a) declare or pay a dividend (other than payment by Barclays PLC of a final dividend declared by its shareholders prior to the relevant dividend payment date, or a dividend paid by Barclays Bank PLC to Barclays PLC or to a wholly owned subsidiary) on any of their respective ordinary shares, other preference shares or other share capital or (b) redeem, purchase, reduce or otherwise acquire any of their respective share capital, other than shares of Barclays Bank PLC held by Barclays PLC or a wholly owned subsidiary, until the earlier of: (1) the date on which Barclays Bank PLC next declares and pays in full a preference dividend; and (2) the date on or by which all the preference shares are redeemed in full or purchased by Barclays Bank PLC.
Holders of the preference shares are not entitled to receive notice of, or to attend, or vote at, any general meeting of Barclays Bank PLC. Barclays Bank PLC is not permitted to create a class of shares ranking as regards participation in the profits or assets of Barclays Bank PLC in priority to the preference shares, save with the sanction of a special resolution of a separate general meeting of the holders of the preference shares (requiring a majority of not less than three-fourths of the holders of the preference shares voting at the separate general meeting) or with the consent in writing of the holders of three-fourths of the preference shares.
Except as described above, the holders of the preference shares have no right to participate in the surplus assets of Barclays Bank PLC.
29 Reserves Available for Sale ReserveThe available for sale reserve represents the unrealised change in the fair value of available for sale investments since initial recognition.
The available for sale reserve movement of £1,255m was driven by the decrease in the fair value of the Group’s investment in BlackRock Inc. of £764m, partially offset by increases in the fair value of other available for sale assets as markets recovered.
The movement also includes the net gains transferred to net profit on disposal that arose on the disposal of the structural hedge portfolio, sovereign positions that were no longer eligible for liquidity purposes and excess Euro, US Dollar and Japanese Yen government securities.
Cash Flow Hedge ReserveThe cash flow hedging reserve represents the cumulative gains and losses on effective cash flow hedging instruments that will be recycled to the income statement when the hedged transactions affect profit or loss.
Movements in the cash flow hedge reserve principally reflected increases in the fair value of interest rate swaps held for hedging purposes more than offset by related gains transferred to net profit.
Currency Translation ReserveThe currency translation reserve represents the cumulative gains and losses on the retranslation of the Group’s net investment in foreign operations, net of the effects of hedging. Currency translation differences of £1,177m, including £435m associated with non-controlling interests, is largely due to the appreciation in the Rand and US Dollar, offset by the depreciation in the Euro.
During the year, £279m of the currency translation reserve was recognised in the income statement, principally as a result of the restructuring of group entities based in the US and repatriation of capital from overseas.
128 Barclays Bank PLC Annual Report 2010 www.barclays.com/annualreport10
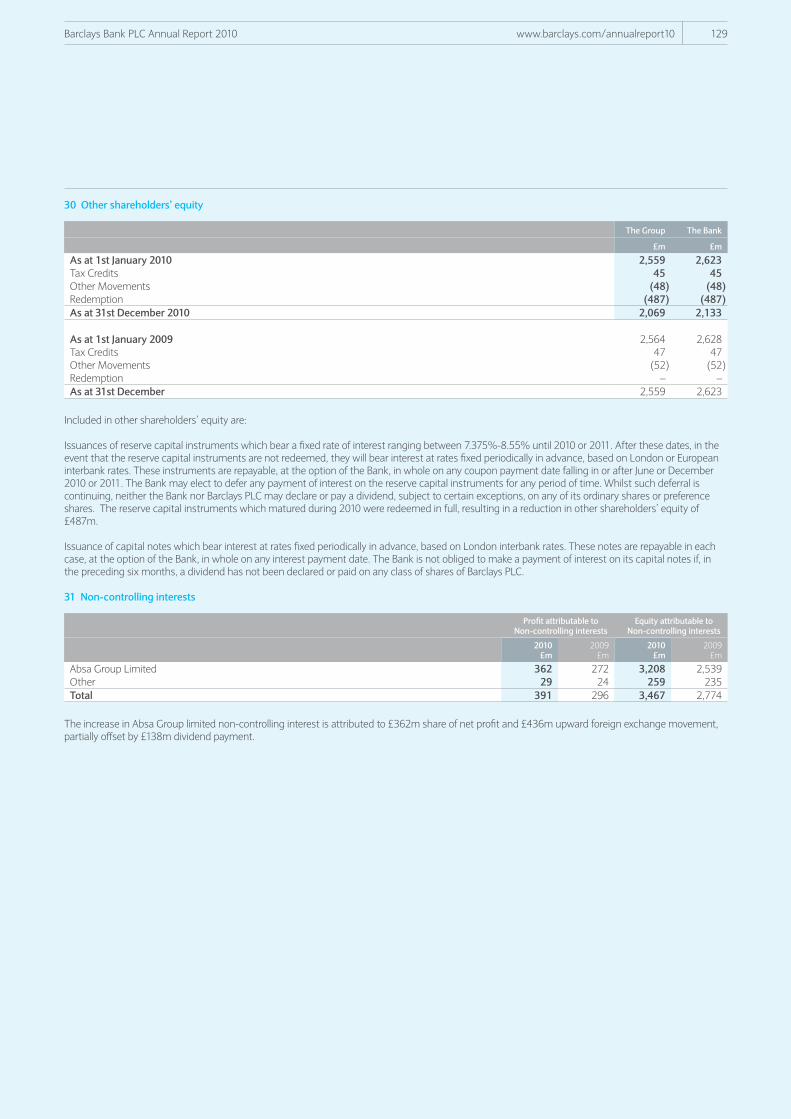
30 Other shareholders’ equity
The Group The Bank
£m £m
As at 1st January 2010 2,559 2,623 Tax Credits 45 45 Other Movements (48) (48)Redemption (487) (487)As at 31st December 2010 2,069 2,133 As at 1st January 2009 2,564 2,628 Tax Credits 47 47 Other Movements (52) (52)Redemption – – As at 31st December 2,559 2,623
Included in other shareholders’ equity are:
Issuances of reserve capital instruments which bear a fixed rate of interest ranging between 7.375%-8.55% until 2010 or 2011. After these dates, in the event that the reserve capital instruments are not redeemed, they will bear interest at rates fixed periodically in advance, based on London or European interbank rates. These instruments are repayable, at the option of the Bank, in whole on any coupon payment date falling in or after June or December 2010 or 2011. The Bank may elect to defer any payment of interest on the reserve capital instruments for any period of time. Whilst such deferral is continuing, neither the Bank nor Barclays PLC may declare or pay a dividend, subject to certain exceptions, on any of its ordinary shares or preference shares. The reserve capital instruments which matured during 2010 were redeemed in full, resulting in a reduction in other shareholders’ equity of £487m.
Issuance of capital notes which bear interest at rates fixed periodically in advance, based on London interbank rates. These notes are repayable in each case, at the option of the Bank, in whole on any interest payment date. The Bank is not obliged to make a payment of interest on its capital notes if, in the preceding six months, a dividend has not been declared or paid on any class of shares of Barclays PLC.
31 Non-controlling interests
Profit attributable to Non-controlling interests
Equity attributable to Non-controlling interests
2010£m
2009£m
2010£m
2009£m
Absa Group Limited 362 272 3,208 2,539 Other 29 24 259 235 Total 391 296 3,467 2,774
The increase in Absa Group limited non-controlling interest is attributed to £362m share of net profit and £436m upward foreign exchange movement, partially offset by £138m dividend payment.
Barclays Bank PLC Annual Report 2010 www.barclays.com/annualreport10 129

Notes to the financial statementsFor the year ended 31st December 2010 continued
32 Investment in subsidiariesInvestments in subsidiaries, the principal of which are engaged in banking related activities, are recorded on the balance sheet at historical cost less any impairment. At 31st December 2010 the historical cost of investments in subsidiaries was £20,858m (2009: £20,178m), and allowances recognised against these investments was £1,825m (2009: £1,382m) of impairment. Details of the principal subsidiaries are shown below.
Country of registration orincorporation Company name Nature of business
Percentage of equity capital
held (%)
Botswana Barclays Bank of Botswana Limited Banking 67.8*Egypt Barclays Bank Egypt SAE Banking 100*England Barclays Mercantile Business Finance Limited Loans and advances including leases to customers 100 England Barclays Bank Trust Company Limited Banking, securities industries and trust services 100 England Barclays Stockbrokers Limited Stockbroking 100 England Barclays Capital Securities Limited Securities dealing 100 England FIRSTPLUS Financial Group PLC Secured loan provider 100*England Gerrard Investment Management Limited Investment management 100 Ghana Barclays Bank of Ghana Limited Banking 100*Ireland Barclays Insurance (Dublin) Limited Insurance provider 100 Ireland Barclays Assurance (Dublin) Limited Insurance provider 100 Isle of Man Barclays Private Clients International Limited Banking 100*Japan Barclays Capital Japan Limited Securities dealing 100 Jersey Barclays Private Bank & Trust Limited Banking, trust company 100 Kenya Barclays Bank of Kenya Limited Banking 68.5*Russia Barclays Bank LLC Banking 100 South Africa Absa Group Limited Banking 55.5*Spain Barclays Bank SA Banking 99.7*Switzerland Barclays Bank (Suisse) S.A. Banking and trust services 100*USA Barclays Capital Inc. Securities dealing 100 USA Barclays Delaware Holdings LLC Holding company for US credit card issuer 100*USA Barclays Group US Inc. Holding company 100*Zimbabwe Barclays Bank of Zimbabwe Limited Banking 67.7
In accordance with Section 410(2)(a) of the Companies Act 2006, the above information is provided solely in relation to principal subsidiaries.
The country of registration or incorporation is also the principal area of operation of each of the above subsidiaries. Investments in subsidiaries held directly by Barclays Bank PLC are marked *.
Following the restructuring of Group operations in the US during the year, Barclays Group US Inc. is no longer a US Bank Holding Company.
Full information of all subsidiaries will be included in the Annual Return to be filed at UK Companies House.
Entities in which the Group holds less than half the voting rights There are a number of entities in which the Group holds less than half the voting rights which are consolidated when the substance of the relationship between the Group and the entity indicates that the entity is controlled by the Group. Such entities are deemed to be controlled by the Group when relationships with such entities give rise to benefits that are in substance no different from those that would arise were the entity a subsidiary.
The consolidation of such entities may be appropriate in a number of situations, but primarily when:
– the operating and financial policies of the entity are closely defined from the outset (i.e. it operates on an ‘autopilot’ basis) with such policies being largely determined by the Group;
– the Group has rights to obtain the majority of the benefits of the entity and/or retains the majority of the residual or ownership risks related to the entity; or
– the activities of the entity are being conducted largely on behalf of the Group according to its specific business objectives.
Such entities are created for a variety of purposes including securitisation, structuring, asset realisation, intermediation and management.
Subsidiaries with a different reporting date from that of the Parent of 31st December Entities may have a different reporting date from that of the Parent of 31st December. Dates may differ for a variety of reasons including local reporting regulations or tax laws. In accordance with our accounting policies, for the purpose of inclusion in the consolidated financial statements of Barclays PLC, entities with different reporting dates are made up until 31st December.
Entities where the Group’s interest exceeds 50% which are excluded from consolidation Although the Group’s interest in the equity voting rights in certain entities exceeds 50%, or it may have the power to appoint a majority of their Boards of Directors, they are excluded from consolidation because the Group either does not direct the financial and operating policies of these entities, or on the grounds that another entity has a controlling interest in them. Consequently, these entities are not deemed to be controlled by Barclays.
130 Barclays Bank PLC Annual Report 2010 www.barclays.com/annualreport10

32 Investment in subsidiaries continuedThe table below includes information in relation to such entities as required by the Companies Act 2006 Section 410(2)(b).
Country of registrationor incorporation Name
Percentage ofordinary share
capital held%
Equityshareholders’
funds £m
Retained profitfor the year
£m
UK Fitzroy Finance Limited 100 – –Cayman Islands Palomino Limited 100 1 –
33 Profit on disposal of subsidiaries, associates and joint venturesDuring the year, profit on disposal of subsidiaries, associates and joint ventures was £81m (2009: £188m), principally relating to the disposal of Barclays Africa custody business to Standard Chartered Bank for a consideration of £81m generating a gain on disposal before tax of £77m. During 2009, the Group disposed of 50% of Barclays Vida y Pensiones Compañía de Seguros and the 7% of Barclays Africa Botswana business for consideration of £276m generating a gain on disposal before tax of £184m.
34 Discontinued operations On 1st December 2009 the Group completed the sale of BGI to BlackRock, Inc. (BlackRock) recognising a profit on disposal before tax of £6,331m. The tax charge of £43m reflects the application of UK substantial shareholdings relief in accordance with UK tax law.
The consideration at completion was $15.2bn (£9.5bn), including 37.567 million new BlackRock shares, giving an economic interest of 19.9% of the enlarged BlackRock group. Barclays Group holds 4.9% of the voting rights and under the terms of the transaction may not acquire additional voting rights and will vote in accordance with the recommendations of the BlackRock Board of Directors. John Varley and Bob Diamond were appointed to the BlackRock Board, which comprises 18 Directors. The Group is not deemed to exercise significant influence and the investment has been accounted for as an available for sale equity investment.
The Group has provided BlackRock with customary warranties and indemnities in connection with the sale. Barclays will also continue to indemnify securities lending arrangements until 30th November 2012 (included within contingent liabilities in Note 24) and provide support to certain BGI cash funds until December 2013 in the form of credit derivatives (included within derivative liabilities in Note 13) and financial guarantees (included within provisions in Note 23).
In addition, Barclays, BlackRock and their respective affiliates also enter into agreements and transactions with one another in the ordinary course of their respective businesses and on an arm’s length commercial basis, subject to applicable regulation and agreements with relevant regulators.
In connection with its financing of its acquisition of BGI, BlackRock entered into a 364-day revolving credit facility with a group of lenders including Barclays, who is also acting as revolving agent. Of the $2bn credit facility, $0.8bn was committed by other lenders and following completion BlackRock had borrowed or notified to be borrowed $1.5bn under the facility. All amounts borrowed under this facility were repaid and the facility was terminated prior to 31st December 2009.
The disposed BGI business has been treated as a discontinued operation, the results of which are set out below. For the year ended 31st December 2009 the results are for the 11 month period up to the date of disposal (1 December 2009). There were no discontinued operations in 2010.
2010£m
2009£m
2008£m
Net interest income – 33 –Net fee and commission income – 1,759 1,916Net trading income/(loss) – 67 (10)Other income – 4 10Total income – 1,863 1,916Operating expenses excluding amortisation of intangible assets – (1,123) (960)Amortisation of intangible assets – (14) (15)Operating expenses – (1,137) (975)Profit before tax from discontinued operations – 726 941Tax on discontinued operations – (237) (337)Profit after tax from discontinued operations – 489 604Profit on disposal of discontinued operations – 6,331 –Tax on disposal – (43) –Net profit on the disposal of the discontinued operation – 6,288 –Profit after tax from discontinued operations, including gain on disposal – 6,777 604
Other comprehensive income relating to discontinued operations is as follows:
2010£m
2009£m
2008£m
Available for sale assets – 10 (9)Currency translation reserve – (85) 133Tax relating to components of other comprehensive income – 17 (10)Other comprehensive income, net of tax from discontinued operations – (58) 114
Barclays Bank PLC Annual Report 2010 www.barclays.com/annualreport10 131

Notes to the financial statementsFor the year ended 31st December 2010 continued
34 Discontinued operations continuedThe cash flows attributable to the discontinued operations were as follows:
2010£m
2009£m
2008£m
Cash Flows from discontinued operationsNet cash flows from operating activities – 333 524Net cash flows from investing activities – (25) (93)Net cash flows from financing activities – (550) (362)Effect of exchange rates on cash and cash equivalents – (134) 217Net cash flows from discontinued operations – (376) 286
35 Acquisition of subsidiaries
Acquisition % Acquired
Goodwill/(Gain on sale)
£m Date
Standard Life Bank PLC 100% (100) 1st January 2010Citibank International PLC – Italian credit card business 100% (29) 31st March 2010Tricorona 86% 13 26th July 2010
None of these acquisitions were individually material. Details of the net assets acquired and the consideration paid are set out in aggregate below. The operating results of these acquisitions have been included from the dates acquired and, since acquisition, have contributed £142m to consolidated income and £86m to consolidated profit before tax.
CarryingValue pre-
Acquisition£m
Fair ValueAdjustmentsa
£mFair Values
£m
AssetsCash and balances at central banks 1,358 – 1,358Financial assets designated at fair value held on own account 195 – 195Derivative financial instruments 145 76 221Loans and advances to banks 165 – 165Loans and advances to customers 7,709 (96) 7,613Other assets 83 10 93Total assets 9,655 (10) 9,645LiabilitiesDeposits from banks (80) – (80)Customer accounts (5,853) – (5,853)Derivative financial instruments (104) (11) (115)Debt securities in issue (2,782) 64 (2,718)Subordinated liabilities (279) 53 (226)Other liabilities (16) (36) (52)Total liabilities (9,114) 70 (9,044)Net assets acquired 541 60 601Group share of assets acquired 535 53 588Total consideration paid in cash 472Goodwill 13Gain on acquisitions 129
Acquisition related costs of £7m have been included in operating expenses.
Cashflows in respect of acquisitionsThe aggregate net inflow of cash from the acquisition of the above Group entities was as follows:
2010£m
Cash consideration on acquisitions (472)Cash and cash equivalent acquired 1,358Cash inflow on acquisition 886
Notea Fair value adjustments include revaluations and accounting policy re-alignments.
132 Barclays Bank PLC Annual Report 2010 www.barclays.com/annualreport10

36 SecuritisationsThe Group was party to securitisation transactions involving its residential mortgage loans, business loans and credit card balances. In addition, the Group acts as a conduit for commercial paper, whereby it acquires static pools of residential mortgage loans from other lending institutions for securitisation transactions.
In these transactions, the assets, or interests in the assets, or beneficial interests in the cash flows arising from the assets, are transferred to a special purpose entity, or to a trust which then transfers its beneficial interests to a special purpose entity, which then issues floating rate debt securities to third-party investors.
Securitisations may, depending on the individual arrangement, result in continued recognition of the securitised assets and the recognition of the debt securities issued in the transaction; lead to partial continued recognition of the assets to the extent of the Group’s continuing involvement in those assets or to derecognition of the assets and the separate recognition, as assets or liabilities, of any rights and obligations created or retained in the transfer. Full derecognition only occurs when the Group transfers both its contractual right to receive cash flows from the financial assets, or retains the contractual rights to receive the cash flows, but assumes a contractual obligation to pay the cash flows to another party without material delay or reinvestment, and also transfers substantially all the risks and rewards of ownership, including credit risk, prepayment risk and interest rate risk.
The following table shows the carrying amount of securitised assets, stated at the amount of the Group’s continuing involvement where appropriate, together with the associated liabilities, for each category of asset on the balance sheet:
2010 2009
Carryingamount of
assets£m
Associatedliabilities
£m
Carryingamount of
assets£m
Associatedliabilities
£m
The Group Loans and advances to customers Residential mortgage loans 9,709 (10,674) 10,374 (10,738)Credit card receivables 801 (723) 1,288 (1,288)Other personal lending – – 94 (124)Wholesale and corporate loans and advances 2,560 (2,878) 4,835 (5,999)Total 13,070 (14,275) 16,591 (18,149)Assets designated at fair value through profit or loss Retained interest in residential mortgage loans 5 26 The Bank Loans and advances to customers Residential mortgage loans 6,700 (7,789) 7,128 (7,524)Credit card receivables 362 (315) 1,299 (1,299)Wholesale and corporate loans and advances 2,974 (3,355) 5,751 (7,147)Total 10,036 (11,459) 14,178 (15,970)Assets designated at fair value through profit or loss Retained interest in residential mortgage loans 5 26
Balances included within loans and advances to customers represent securitisations where substantially all the risks and rewards of the asset have been retained by the Group.
The excess of total associated liabilities over the carrying amount of assets primarily reflects timing differences in the receipt and payment of cash flows, and foreign exchange movements where the assets and associated liabilities are denominated in different currencies. Foreign exchange movements and associated risks are hedged economically through the use of cross currency swap derivative contracts.
Balances included within loans and advances to customers include securitisations where the Bank has repurchased liabilities originally issued by its subsidiaries to third-party investors.
Retained interests in residential mortgage loans are securities which represent a continuing exposure to the prepayment and credit risk in the underlying securitised assets. The total amount of the loans was £15,458m (2009: £14,795m) for the Group and £15,458m (2009: £14,795m) for the Bank. The retained interest is initially recorded as an allocation of the original carrying amount based on the relative fair values of the portion derecognised and the portion retained.
Barclays Bank PLC Annual Report 2010 www.barclays.com/annualreport10 133

Notes to the financial statementsFor the year ended 31st December 2010 continued
37 LeasingThe Group and the Bank are both lessor and lessee under finance and operating leases, providing asset financing for its customers and leasing assets for its own use. In addition, assets leased by the Group may be sublet to other parties. An analysis of the impact of these transactions on the Group and the Bank balance sheet and income statement is as follows:
a) As LessorFinance lease receivablesThe Group and the Bank specialise in asset-based lending and works with a broad range of international technology, industrial equipment and commercial companies to provide customised finance programmes to assist manufacturers, dealers and distributors of assets. Finance lease receivables are included within loans and advances to customers.
2010 2009
Grossinvestment
in financelease
receivables£m
Futurefinanceincome
£m
Presentvalue of
minimumlease
paymentsreceivable
£m
Unguaranteedresidual
values£m
Grossinvestment
in financelease
receivables£m
Futurefinanceincome
£m
Presentvalue of
minimumlease
paymentsreceivable
£m
Unguaranteedresidual
values£m
The Group Not more than one year 3,440 (479) 2,961 60 3,513 (456) 3,057 55Over one year but not more than five years 7,200 (1,058) 6,142 123 7,597 (1,117) 6,480 154Over five years 1,591 (340) 1,251 560 2,084 (427) 1,657 407Total 12,231 (1,877) 10,354 743 13,194 (2,000) 11,194 616 The Bank Not more than one year – – – – 7 – 7 – Over one year but not more than five years 132 – 132 – 211 – 211 – Over five years 92 – 92 – 144 – 144 – Total 224 – 224 – 362 – 362 –
The allowance for uncollectable finance lease receivables included in the allowance for impairment for the Group amounted to £351m at 31st December 2010 (2009: £321m).
Operating lease receivablesThe Group and the Bank acts as lessor, whereby items of plant and equipment are purchased and then leased to third parties under arrangements qualifying as operating leases. The items purchased to satisfy these leases are included within leased assets (see Note 19) and are generally disposed of at the end of the lease term.
The future minimum lease payments expected to be received under non-cancellable operating leases as at 31st December 2010 was £43m (2009: £39m) for the Group and none (2009: £nil) for the Bank.
b) As LesseeFinance lease commitmentsThe Group and the Bank lease items of property, plant and equipment on terms that meet the definition of finance leases. Finance lease commitments are included within Accruals. deferred income and other liabilities (see Note 21).
As at 31st December 2010, the total future minimum payments under finance leases for the Group were £87m (2009: £122m), of which £16m (2009:16m) was due within one year and the total future minimum payments under finance leases for the Bank were £nil (2009: £4m).
As at 31st December 2010, the carrying amount of assets held under finance leases was £29m (2009: £43m) for the Group and £nil (2009: £nil) for the Bank.
134 Barclays Bank PLC Annual Report 2010 www.barclays.com/annualreport10

37 Leasing continuedOperating lease commitmentsThe Group and the Bank lease various offices, branches and other premises under non-cancellable operating lease arrangements. With such operating lease arrangements, the asset is kept on the lessor’s balance sheet and the Group and the Bank report the future minimum lease payments as an expense over the lease term.
The leases have various terms, escalation and renewal rights. There are no contingent rents payable. The Group and the Bank also lease equipment under non-cancellable lease arrangements.
Operating lease rentals of £637m (2009: £639m) for the Group have been included in administration and general expenses.
Where the Group and the Bank are the lessees the future minimum lease payment under non-cancellable operating leases are as follows:
The Group The Bank
2010 2009 2010 2009
Property£m
Equipment£m
Property£m
Equipment£m
Property£m
Equipment£m
Property£m
Equipment£m
Not more than one year 628 7 459 9 245 3 215 2 Over one year but not more than five years 1,477 2 1,477 6 877 2 780 – Over five years 3,146 – 2,933 3 1,505 – 1,645 3 Total 5,251 9 4,869 18 2,627 5 2,640 5
The total of future minimum sublease payments to be received under non-cancellable subleases at the balance sheet date is £111m (2009: £147m) for the Group and £108m (2009: £123m) for the Bank.
38 Off-balance sheet arrangementsIn the ordinary course of business and primarily to facilitate client transactions, the Group enters into transactions which may involve the use of off-balance sheet arrangements and special purpose entities (SPEs). These arrangements include the provision of guarantees, loan commitments, retained interests in assets which have been transferred to an unconsolidated SPE or obligations arising from the Group’s involvements with such SPEs.
GuaranteesThe Group issues guarantees on behalf of its customers. In the majority of cases, the Group will hold collateral against the exposure, have a right of recourse to the customer or both. In addition, the Group issues guarantees on its own behalf. The main types of guarantees provided are: financial guarantees given to banks and financial institutions on behalf of customers to secure loans; overdrafts; and other banking facilities, including stock borrowing indemnities and standby letters of credit. Other guarantees provided include performance guarantees, advance payment guarantees, tender guarantees, guarantees to Her Majesty’s Revenue and Customs and retention guarantees. The nominal principal amount of contingent liabilities with off-balance sheet risk is set out in Note 24.
Loan commitmentsThe Group enters into commitments to lend to its customers subject to certain conditions. Such loan commitments are made either for a fixed period or are cancellable by the Group subject to notice conditions. Information on loan commitments and similar facilities is set out in Note 24.
LeasingThe Group leases various offices, branches, other premises and equipment under non-cancellable operating lease arrangements. With such operating lease arrangements, the asset is kept on the lessor’s balance sheet and the Group reports the future minimum lease payments as an expense over the lease term. Information on leasing can be found in Note 37.
Special purpose entitiesSPEs are entities that are created to accomplish a narrow and well defined objective. There are often specific restrictions or limits around their ongoing activities. The Group’s transactions with SPEs take a number of forms, including:
– The provision of financing to fund asset purchases, or commitments to provide finance for future purchases.
– Derivative transactions to provide investors in the SPE with a specified exposure.
– The provision of liquidity or backstop facilities which may be drawn upon if the SPE experiences future funding difficulties.
– Direct investment in the notes issued by SPEs.
Depending on the nature of the Group’s resulting exposure, it may consolidate the SPE on to the Group’s balance sheet. The consolidation of SPEs is considered at inception, based on the arrangements in place and the assessed risk exposures at that time. In accordance with IFRS, SPEs are consolidated when the substance of the relationship between the Group and the entity indicates control. Potential indicators of control include, amongst others, an assessment of the Group’s exposure to the risks and benefits of the SPE. The initial consolidation analysis is revisited at a later date if:
i) the Group acquires additional interests in the entity; ii) the contractual arrangements of the entity are amended such that the relative exposures to risks and rewards change; or iii) the Group acquires control over the main operating and financial decisions of the entity.
Barclays Bank PLC Annual Report 2010 www.barclays.com/annualreport10 135

Notes to the financial statementsFor the year ended 31st December 2010 continued
38 Off-balance sheet arrangements continuedA number of the Group’s transactions have recourse only to the assets of unconsolidated SPEs. Typically, the majority of the exposure to these assets is borne by third parties and the Group’s risk is mitigated through over-collateralisation, unwind features and other protective measures.
The business activities within the Group where SPEs are used include multi-seller conduit programmes, asset securitisations, client intermediation, credit structuring, asset realisations and fund management. These activities are described below. In addition, later sections provide quantitative information on the Group’s involvements with CDOs, SIVs SIV-Lites and conduits.
Multi-seller conduit programmesBarclays creates, administers and provides liquidity and credit enhancements to several commercial paper conduit programmes, primarily in the United States. These conduits provide clients access to liquidity in the commercial paper markets by allowing them to sell consumer or trade receivables to the conduit, which then issues commercial paper to investors to fund the purchase. The conduits have sufficient collateral, credit enhancements and liquidity support to maintain an investment grade rating for the commercial paper.
Asset securitisationsThe Group has assisted its customers with the formation of asset securitisations, some of which are effected through the use of SPEs. These entities have minimal equity and rely on funding in the form of notes to purchase the assets for securitisation. As these SPEs are created for other companies, the Group does not usually control these entities and therefore does not consolidate them. The Group may provide financing in the form of senior notes or junior notes and may also provide derivatives to the SPE. These transactions are included on the balance sheet.
The Group has also used SPEs to securitise part of its originated and purchased retail and commercial lending portfolios and credit card receivables. These SPEs are usually consolidated and derecognition only occurs when the Group transfers its contractual right to receive cash flows from the financial assets, or retains the contractual rights to receive the cash flows, but assumes a contractual obligation to pay the cash flows to another party without material delay or reinvestment, and also transfers substantially all the risks and rewards of ownership, including credit risk, prepayment risk and interest rate risk. The carrying amount of securitised assets together with the associated liabilities are set out in Note 36.
Client intermediationThe Group has structured transactions as a financial intermediary to meet investor and client needs. These transactions involve entities structured by either the Group or the client and they are used to modify cash flows of third party assets to create investments with specific risk or return profiles or to assist clients in the efficient management of other risks. Such transactions will typically result in a derivative being shown on the balance sheet, representing the Group’s exposure to the relevant asset. The Group also invests in lessor entities specifically to acquire assets for leasing. Client intermediation also includes arrangements to fund the purchase or construction of specific assets (most common in the property industry).
Credit structuringThe Group structures investments to provide specific risk profiles to investors. This may involve the sale of credit exposures, often by way of derivatives, to an entity which subsequently funds those exposures by issuing securities. These securities may initially be held by Barclays prior to sale outside of the Group.
Asset realisationsThe Group establishes SPEs to facilitate the recovery of loans in circumstances where the borrower has suffered financial loss.
To the extent that there are guarantees and commitments in relation to SPEs the details are included in Note 24.
Collateralised debt obligations (CDOs)The Group has structured and underwritten CDOs. At inception, the Group’s exposure principally takes the form of a liquidity facility provided to support future funding difficulties or cash shortfalls in the vehicles. If required by the vehicle, the facility is drawn with the amount advanced included within loans and advances on the balance sheet. Upon an event of default or other triggering event, the Group may acquire control of a CDO and, therefore, be required to fully consolidate the vehicle for accounting purposes. The potential for transactions to hit default triggers before the end of 2010 has been assessed and is included in the determination of a £137m impairment release and other credit provisions in relation to ABS CDO Super Senior and other credit market exposures for the year ended 31st December 2010.
The Group’s exposure to ABS CDO Super Senior positions before hedging was £1,992m as at 31st December 2010, equivalent to an aggregate 50.97% decline in value on average for all investors. This represents the Group’s exposure to High Grade CDOs, stated net of write-downs and charges. These facilities are fully drawn and included within loans and advances on the balance sheet.
CollateralThe collateral underlying unconsolidated CDOs comprised 78% residential mortgage-backed securities, 3% non-residential asset-backed securities and 19% in other categories (a proportion of which will be backed by residential mortgage collateral).
The remaining Weighted Average Life (WAL) of all collateral is 6.3 years. The combined Net Asset Value (NAV) for all of the CDOs was £1bn.
FundingThe CDOs were funded with senior unrated notes and rated notes up to AAA. The capital structure senior to the AAA notes on cash CDOs was supported by a liquidity facility provided by the Group. The senior portion covered by liquidity facilities is on average 86% of the capital structure.
The initial WAL of the notes in issue averaged 6.7 years. The full contractual maturity is 38.2 years.
136 Barclays Bank PLC Annual Report 2010 www.barclays.com/annualreport10

38 Off-balance sheet arrangements continuedInterests in third party CDOsThe Group has purchased securities in and entered into derivative instruments with third party CDOs. These interests are held as trading assets or liabilities on the Group’s balance sheet and measured at fair value. The Group has not provided liquidity facilities or similar agreements to third party CDOs.
Structured investment vehicles (SIVs)The Group does not structure or manage SIVs. Group exposure to third party SIVs comprised:
– £nil (2009: £16m) of senior liquidity facilities;
– Derivative exposures included on the balance sheet at their net fair value of £46m (2009: £53m).
SIV-LitesThe Group has exposure to a SIV-Lite transaction. The Group is not involved in its ongoing management. Exposures have decreased to £345m (2009: £461m) representing assets designated at fair value.
Commercial paper and medium-term note conduits The Group provided £17bn in undrawn backstop liquidity facilities to its own sponsored CP conduits. The Group fully consolidates these entities such that the underlying assets are reflected on the Group balance sheet.
These consolidated entities in turn provide facilities of £740m to third party conduits containing prime UK buy-to-let RMBS. As at 31st December 2010, the entire facility had been drawn and is included in available for sale financial investments.
The Group provided backstop facilities to support the paper issued by one third party conduit. This facility totalled £129m, with underlying collateral comprising 100% auto loans. There were no drawings on this facility as at 31st December 2010.
The Group provided backstop facilities to six third party SPEs that fund themselves with medium-term notes. These notes are sold to investors as a series of 12-month securities and remarketed to investors annually. If investors decline to renew their holdings at a price below a pre-agreed spread, the backstop facility requires the Group to purchase the outstanding notes at scheduled maturity. The Group has provided facilities of £1.2bn to SPEs holding prime UK and Australian owner-occupied RMBS assets. As at the balance sheet date these facilities had been drawn and were included in loans and advances.
39 Share-based payments The Group operates share schemes for employees throughout the world. The share based payment charge represents 7.2% (2009: 3.0%) of employee costs and unvested share awards, including options, amount to 6.6% (2009: 6.0%) of issued share capital.
The charge for the year arising from share based payment schemes was as follows:
Charge for the year
2010£m
2009£m
2008£m
Share Value Plan 361 – –Performance share Plan 58 33 14Incentive share Plan 50 18 7Executive Share Award Scheme 304 178 216Sharesave 20 29 (7)Others 44 20 (8)Total Equity Settled 837 278 222Cash Settled 23 8 3Total Continuing operation 860 286 225Discontinued operations – 12 35Total share based payments 860 298 260
The terms of the main current plans are as follows:
Share value plan (SVP)The Share Value Plan (SVP) was introduced in March 2010. SVP awards are granted to participants in the form of a provisional allocation of Barclays shares which vest over a period of three years in equal annual tranches. Participants do not pay to receive an award or to receive a release of shares. Awards under the SVP qualify for dividends.
Performance Share Plan (PSP)The Performance Share Plan (PSP) was approved by shareholders at the 2005 AGM to replace the ISOP scheme. Performance shares are ‘free’ Barclays shares for which no exercise price is payable and which qualify for dividends. Performance share awards are communicated to participants as an initial allocation. Barclays performance over a three-year period determines the final number of shares that may be released to participants.
Barclays Bank PLC Annual Report 2010 www.barclays.com/annualreport10 137

Notes to the financial statementsFor the year ended 31st December 2010 continued
39 Share-based payments continuedIncentive Share Plan (ISP)The Incentive Share Plan (Incentive Shares) was introduced in March 2008. Incentive Shares are granted to participants in the form of a provisional allocation of Barclays shares which vest upon achieving continued service after three years. Participants do not pay to receive an award or to receive a release of shares. Incentive Shares qualify for dividends.
Executive Share Award Scheme (ESAS)For certain employees of the Group an element of their annual bonus is in the form of a deferred award of a provisional allocation of Barclays PLC shares under ESAS. The total value of the bonus made to the employee, of which ESAS is an element, is dependent upon the business unit, Group and individual employee performance. The ESAS element of the annual bonus must normally be held for at least three years. Additional bonus shares are subsequently awarded to recipients of the provisional allocation and vest upon achieving continued service for three and five years from the date of award. ESAS awards are also made to eligible employees for recruitment purposes under JSAP (Joiners Share Award Plan). All awards are subject to potential forfeiture if the individual resigns and commences work with a competitor business. LTIP plans are cash and equity performance plans which after 3 years (dependant on performance) pay half in cash and the remaining half in shares which are placed into ESAS for a further 1 or 2 years.
SharesaveEligible employees in the UK, Spain and Ireland may participate in the Barclays Sharesave scheme. Under this scheme, employees may enter into contracts to save up to £250 per month (Ireland: €300, Spain: €225) and at the expiry of a fixed term of three, five or seven years (Spain: three years) have the option to use these savings to acquire shares in the Company at a discount, calculated in accordance with the rules of the scheme. The discount is currently 20% of the market price at the date the options are granted. Participants in the scheme have six months from the date of vest in which the option can be exercised.
UK Sharepurchase Sharepurchase was introduced in January 2002. It is an HM Revenue & Customs approved all-employee share plan. The plan is open to all eligible UK employees, including executive Directors. Under the plan, participants are able to purchase up to £1,500 worth of Barclays PLC ordinary shares per tax year, which if kept in trust for five years can be withdrawn from the plan tax-free. Matching shares were introduced to the scheme during 2005 where the purchase of Barclays shares by the participant are matched equally by the Company up to a maximum value of £600 per tax year. Shares in the plan will earn dividends in the form of additional shares, which must normally be held by the trustee for three years before being eligible for release.
Other schemes In addition to the above schemes, the Group operates a number of other schemes including schemes operated by and settled in the shares of subsidiary undertakings, none of which are individually or in aggregate material in relation to the charge for the year or the numbers of issued shares.
Share option plansAs noted above, the Group’s schemes include a number of share option schemes – including grants of nil cost options.
The weighted average fair value per option granted during the year is as follows:
2010£m
2009£m
SVP 3.54 –ESAS 2.88 1.08PSP 3.55 2.81ISP 3.55 2.58Sharepurchase 3.07 1.82Sharesave 1.29 1.43
Sharepurchase, ISP, SVP and ESAS are nil cost awards on which the performance conditions are substantially completed at the date of grant. Consequently the fair value of these awards is based on the market value at that date.
As described above, the terms of the ESAS scheme require shares to be held for a set number of years from the date of vest. The calculation of the vest date fair value of such awards includes a reduction for this post-vesting restriction. This discount is determined by calculating how much a willing market participant would rationally pay to remove the restriction using a Black-Scholes option pricing model. The total discount required in 2010 is £22m (2009: £10m, 2008: £10m).
Fair values for Sharesave and PSP are calculated at the date of grant using either a Black-Scholes model or Monte Carlo simulation.
138 Barclays Bank PLC Annual Report 2010 www.barclays.com/annualreport10

39 Share-based payments continuedThe significant weighted average assumptions used to estimate the fair value of the options granted from 2007 to 2010 under the Group’s major share schemes are as follows:
Weighted average
share price
Weighted average
exercise priceExpected volatility
Expected option life
2010PSP 3.55 3.46 45% 2 yearsSharesave 3.21 2.67 45% 4 years2009PSP 2.34 1.77 45% 2 yearsSharesave 3.51 2.70 45% 4 years2008PSP 5.45 2.07 37% 3 yearsSharesave 3.11 2.51 37% 4 years2007PSP 7.07 – 25% 3 yearsSharesave 5.82 4.81 25% 4 years
Expected VolatilityExpected volatility and dividend yield on the date of grant have been used as inputs into the respective valuation models for Sharesave and PSP.
The assumed dividend yield for Barclays PLC is the average annual dividend yield on the date of grant of 2% (2009: 2%).
Discount RateThe yield on UK government bonds with a commensurate life has been used to determine the risk-free discount rate of 2% (2009: 3%) for Sharesave and PSP. Option life is estimated based upon historical data for the holding period of options between grant and exercise dates.
Expected option life and number expected to vestFor the purposes of determining the expected life and number of options to vest, historical exercise patterns have been used, together with an assumption that a certain percentage of options will lapse due to leavers.
Barclays Bank PLC Annual Report 2010 www.barclays.com/annualreport10 139

Notes to the financial statementsFor the year ended 31st December 2010 continued
39 Share-based payments continuedMovements in optionsAnalysis of the movement in the number and weighted average exercise price of options for the major schemes is set out below:
ESASa,b PSPa
Number(000s)
Weighted averageex. price (£)
Number(000s)
Weighted averageex. price (£)
2010 2009 2010 2009 2010 2009 2010 2009
Outstanding at beginning of year/acquisition date 464,511 267,937 – – 31,262 50,729 – –Granted in the year 85,489 311,977 – – 6,491 4,794 – –Exercised/released in the year (139,220) (90,296) – – (8,355) (6,496) – –Less: forfeited in the year (27,297) (25,107) – – (10,749) (17,765) – –Outstanding at end of year 383,483 464,511 – – 18,649 31,262 – –Of which exercisable: 5,220 12,714 – – 40 – – –
ISPa,b SVPa,b
Number(000s)
Weighted averageex. price (£)
Number(000s)
Weighted averageex. price (£)
2010 2009 2010 2009 2010 2009 2010 2009
Outstanding at beginning of year/acquisition date 54,978 7,100 – – – – – –Granted in the year 800 50,652 – – 241,931 – – –Exercised/released in the year (587) (19) – – (4,932) – – –Less: forfeited in the year (5,208) (2,755) – – (10,157) – – –Outstanding at end of year 49,983 54,978 – – 226,842 – – –Of which exercisable: - - – – – – – –
Sharesavea Sharepurchasea,b
Number(000s)
Weighted averageex. price (£)
Number(000s)
Weighted averageex. price (£)
2010 2009 2010 2009 2010 2009 2010 2009
Outstanding at beginning of year/acquisition date 91,311 94,131 3.01 1.83 12,320 6,961 – –Granted in the year 21,296 28,005 2.46 2.70 4,176 6,832 – –Exercised/released in the year (1,079) (153) 2.67 2.83 (1,190) (952) – –Less: forfeited in the year (19,368) (30,672) 3.42 3.58 (845) (521) – –Outstanding at end of year 92,160 91,311 2.80 3.01 14,461 12,320 – –Of which exercisable: 5,814 7,537 4.35 4.19 2,529 1,621 – –
Notesa Options/award granted over Barclays PLC shares.b Nil cost award.
140 Barclays Bank PLC Annual Report 2010 www.barclays.com/annualreport10

39 Share-based payments continuedThe table below shows the weighted average share price at the date of exercise/release of shares:
2010 £
2009 £
Sharesavea 3.17 3.21Sharepurchasea,b 3.02 2.64SVPa,b 3.10 –ESASa,b 3.39 2.02PSPa,b 3.46 1.77ISPa,b 3.10 3.43
Certain of the Groups share option plans enable certain directors and members of staff employees the option to subscribe for new ordinary shares of Barclays PLC between 2010 and 2018.
The exercise price range, the weighted average contractual remaining life and number of options outstanding (including those exercisable) at the balance sheet date are as follows:
Exercise price range 2010 2009
Weightedaverage
remainingcontractuallife in years
Number ofoptions
Outstanding(000s)
Weightedaverage
remainingcontractuallife in years
Number ofoptions
Outstanding(000s)
Sharesavea
£1.44-£2.49 4 22,345 2 1,818£2.50-£3.49 2 58,046 3 69,543£3.50-£4.49 – 4,828 1 9,058£4.50-£5.49 1 6,940 2 10,892Sharepurchasea,b 1 14,461 2 12,320SVPa,b 2 226,842 – –ESASa,b 3 383,483 3 464,511ISPa,b 1 49,983 2 54,978PSPa,b 1 18,649 1 31,262
There were no modifications to the share-based payment arrangements in the years 2010, 2009 and 2008.
As at 31st December 2010, the total liability arising from cash-settled share-based payment transactions was £23m (2009: £13m; 2008: £23m).
Treasury SharesThe Group, through various employee benefit trusts, holds shares in Barclays PLC (“treasury shares”) to meet its obligations under its share based payment schemes.
The total number of Barclays shares held in Group employee benefit trusts at 31st December 2010 was 259.0m (2009: 125.1m). No dividend rights have been waived on these shares. The total market value of the shares held in trust, based on the year-end share price of £2.61 (2009: £2.75), was £676m (2009: £344m). As at 31st December 2010, options over 5.2 million (2009: 15.6 million) of the total shares held in the trusts were exercisable. Further details on the treatment of treasury shares are provided on page 128.
Notesa Options/award granted over Barclays PLC shares.b Nil cost award.
Barclays Bank PLC Annual Report 2010 www.barclays.com/annualreport10 141

Notes to the financial statementsFor the year ended 31st December 2010 continued
40 Related party transactions and Directors’ remunerationa) Related party transactionsParties are considered to be related if one party has the ability to control the other party or exercise significant influence over the other party in making financial or operation decisions, or one other party controls both. The definition includes subsidiaries, associates, joint ventures and the Group’s pension schemes, as well as other persons.
(i) The GroupParent companyThe parent company, which is also the ultimate parent company, is Barclays PLC, which holds 100% of the issued ordinary shares of Barclays Bank PLC.
SubsidiariesTransactions between Barclays Bank PLC and subsidiaries also meet the definition of related party transactions. Where these are eliminated on consolidation, they are not disclosed in the Group financial statements. A list of the Group’s principal subsidiaries is shown in Note 35.
Associates, joint ventures and other entitiesThe Group provides banking services to its associates, joint ventures, the Group pension funds (principally the UK Retirement Fund) and to entities under common directorships, providing loans, overdrafts, interest and non-interest bearing deposits and current accounts to these entities as well as other services. Group companies also provide investment management and custodian services to the Group pension schemes. The Group also provides banking services for unit trusts and investment funds managed by Group companies and are not individually material. All of these transactions are conducted on the same terms as third-party transactions.
Entities under common directorshipsThe Group enters into normal commercial relationships with entities for which members of the Group’s Board also serve as Directors. The amounts included in the Group’s financial statements relating to such entities that are not publicly listed are shown in the table opposite under Entities under common directorships.
Amounts included in the accounts, in aggregate, by category of related party entity are as follows:
Associates£m
Joint ventures£m
Entities undercommon
directorships£m
Pension funds,unit trusts and
investmentfunds
£m
For the year ended and as at 31st December 2010Income 19 (15) 10 –Impairment (5) (9) – –Total Assets 135 2,113 45 –Total Liabilities 28 477 110 19
For the year ended and as at 31st December 2009a
Income (57) (55) (64) 6Impairment (2) (5) – –Total Assets 155 2,080 43 –Total Liabilities 4 503 27 46
No guarantees, pledges or commitments have been given or received in respect of these transactions in 2010 or 2009.
There were no derivatives transacted on behalf of the Pensions Funds Unit Trusts and Investment funds (2009: £192m).
(ii) The BankSubsidiariesDetails of principal subsidiaries are shown in Note 35.
The Bank provides certain banking and financial services to subsidiaries as well as a number of normal current and interest bearing cash accounts to the Group pension funds (principally the UK Retirement Fund) in order to facilitate the day to day financial administration of the funds.
Group companies also provide investment management and custodian services. The Bank also provides normal banking services for unit trusts and investment funds managed by Group companies. These transactions are conducted on similar terms to third-party transactions and are not individually material.
Notea Comparatives have been restated to reflect entities identified as related parties.
142 Barclays Bank PLC Annual Report 2010 www.barclays.com/annualreport10

40 Related party transactions and Directors’ remuneration continuedIn aggregate, amounts included in the accounts are as follows:
Subsidiaries£m
Associates£m
Joint ventures
£m
Entities under
commondirectorships
£m
Pension funds,
unit trusts and
investment £m
For the year ended and as at 31st December 2010 Total Assets 377,797 135 2,113 45 – Total Liabilities 392,770 28 477 110 19For the year ended and as at 31st December 2009a Total Assets 314,753 155 2,080 43 – Total Liabilities 333,595 4 503 27 46
It is the normal practice of the Bank to provide its subsidiaries with support and assistance by way of guarantees, indemnities, letters of comfort and commitments, as may be appropriate, with a view to enabling them to meet their obligations and to maintain their good standing, including commitment of capital and facilities.
For dividends paid to Barclays PLC see Note 10.
Key Management PersonnelThe Group’s Key Management Personnel, and persons connected with them, are also considered to be related parties for disclosure purposes. Key Management Personnel are defined as those persons having authority and responsibility for planning, directing and controlling the activities of Barclays Bank PLC (directly or indirectly) and comprise the Directors of Barclays Bank PLC and the Officers of the Group, certain direct reports of the Group Chief Executive and the heads of major business units.
There were no material related party transactions with Entities under common directorship where a Director or other member of Key Management Personnel (or any connected person) is also a Director or other member of Key Management Personnel (or any connected person) of Barclays.
The Group provides banking services to Directors and other Key Management Personnel and persons connected to them. Transactions during the year and the balances outstanding at 31st December 2010 were as follows:
Directors, other Key Management Personnel and connected persons2010
£m2009
£m
Loans outstanding at 1st January 7.0 7.4Loans issued during the year 0.5 1.9Loan repayments during the year (2.2) (1.6)Loans outstanding at 31st December 5.3 7.7
Interest income earned – 0.1
No allowances for impairment were recognised in respect of loans to Directors or other members of Key Management Personnel (or any connected person) in 2010 or 2009.
2010£m
2009£m
Deposits outstanding at 1st January 30.3 28.7Deposits received during the year 104.9 160.0Deposits repaid during the year (99.3) (158.0)Deposits outstanding at 31st December 35.9 30.7
Interest expense on deposits – –
Of the loans outstanding above, £0.5m (2009: £0.1m) relates to Directors and other Key Management Personnel (and persons connected to them) who left during the year. Of the deposits outstanding above, £0.2m (2009: £3.7m) relates to Directors and other Key Management Personnel (and persons connected to them) who left the Group during the year. The amounts disclosed as at 1st January includes deposits outstanding for those who became Directors or Key Management Personnel during the year.
All loans to Directors and other Key Management Personnel (and persons connected to them) (a) were made in the ordinary course of business, (b) were made on substantially the same terms, including interest rates and collateral, as those prevailing at the same time for comparable transactions with other persons and (c) did not involve more than a normal risk of collectability or present other unfavourable features; with the exception of £2,120 (2009: £2,130) provided on an interest free basis.
Notea Comparatives have been restated to reflect entities identified as related parties.
Barclays Bank PLC Annual Report 2010 www.barclays.com/annualreport10 143

Notes to the financial statementsFor the year ended 31st December 2010 continued
40 Related party transactions and Directors’ remuneration continuedThe loan of £2,120 (2009: £2,130) provided on an interest free basis was granted to a non-Director member of Barclays key management to purchase commuter rail tickets. The maximum loan outstanding during the year was £4,240 (2009: £4,260). Commuter rail ticket loans are provided to all Barclays staff members upon request on the same terms.
Remuneration of Directors and other Key Management Personnel
Directors, other Key Management Personnel and connected persons2010
£m2009
£m
Salaries and other short-term benefits 28.3 8.8Employer social security charges on emoluments 12.5 2.9Pension costs 1.0 0.7Other long-term benefits 41.9 2.6Share-based payments 39.3 15.8Costs recognised for accounting purposes 123.0 30.8Employer social security charges on emoluments (12.5) (2.9)Other long term benefits - difference between awards granted and costs recognised (9.2) 15.1Share-based payments - difference between awards granted and costs recognised (20.9) 32.7Total remuneration awarded 80.4 75.7
The population of Directors and other Key Management Personnel increased as a result of the formation of the Executive Committee in November 2009. Figures are provided for the period that individuals met the definition of Directors and other Key Management Personnel.
Total remuneration awarded to Directors and other Key Management Personnel represents the awards made to individuals that have been approved by the Board Remuneration Committee as part of the latest payround decisions. Costs recognised in the income statement reflect the accounting charge for the year included within operating expenses. The difference between the values awarded and the recognised income statement charge principally relates to the recognition of deferred costs for prior year awards.
b) Disclosure required by the Companies Act 2006
The following information is presented in accordance with the Companies Act 2006:
Directors’ remuneration
2010£m
2009£m
Aggregate emoluments 15.8 8.8 Gains made on the exercise of share options – 8.9 Amounts paid under long-term incentive schemes 7.0 –
22.8 17.7
Actual pension contributions of £13,588 were paid to defined contribution schemes on behalf of one Director (2009: £18,786, one Director). Notional pension contributions to defined contribution schemes were £nil (2009: £nil).
As at 31st December 2010, one Director was accruing retirement benefits under a defined benefit scheme (2009: two Directors).
Of the figures in the table above, the amounts attributable to the highest paid Director are as follows:
2010£m
2009£m
Aggregate emoluments 7.0 2.8 Amounts paid under long-term incentive schemes 5.6 – Accrued pension 0.1 –
Actual pension contributions of £13,588 were paid to defined contribution schemes (2009: £nil). There were no notional pension contributions to defined contribution schemes in 2010 or 2009.
Advances and credit to Directors and guarantees on behalf of DirectorsIn accordance with Section 413 of the Companies Act 2006 and in relation to those who served as Directors of the Company at any time in the financial year, the total amount of advances and credits at 31st December 2010 was £nil (2009: £1.8m). The total amount of guarantees on behalf of Directors at 31st December 2010 was £nil (2009: £nil).
.
144 Barclays Bank PLC Annual Report 2010 www.barclays.com/annualreport10

41 Fair value of financial instrumentsThe fair value of a financial instrument is the amount for which an asset could be exchanged, or a liability settled, in an arm’s length transaction between knowledgeable willing parties.
Comparison of carrying amounts and fair valuesThe following table summarises the carrying amounts of financial assets and liabilities presented on the Group’s balance sheet, and their fair values differentiating between financial assets and liabilities subsequently measured at fair value and those subsequently measured at amortised cost:
The Group 2010 2009
Notes
Carryingamount
£m
FairValue
£m
Carryingamount
£m
FairValue
£m
Financial assets:Cash and balances at central banks a 97,630 97,630 81,483 81,483Items in the course of collection from other banks a 1,384 1,384 1,593 1,593Trading portfolio assets:– Debt securities and other eligible bills b 139,240 139,240 126,520 126,520– Equity securities b 25,676 25,676 19,653 19,653– Traded Loans b 2,170 2,170 2,962 2,962– Commodities b 1,844 1,844 2,260 2,260Financial assets designated at fair value:– Equity securities b 5,685 5,685 6,256 6,256– Loans and advances b 22,352 22,352 22,390 22,390– Debt securities b 1,918 1,918 4,007 4,007– Other financial assets designated at fair value b 10,101 10,101 8,658 8,658– Held in respect of linked liabilities under investment contracts b 1,429 1,429 1,257 1,257Derivative financial instruments b 420,319 420,319 416,815 416,815Loans and advances to banks b 37,799 37,768 41,135 41,135Loans and advances to customers:– Residential mortgage loans c 168,055 161,439 149,099 142,726– Credit card receivables c 22,658 22,658 21,889 21,889– Other personal lending c 26,608 26,240 25,435 25,430– Wholesale and corporate loans and advances c 200,618 196,124 212,928 207,648– Finance lease receivables c 10,003 10,046 10,873 10,898Available for sale financial investments:– Debt securities and other eligible bills b 59,629 59,629 49,807 49,807– Equity securities b 5,811 5,811 6,844 6,844Reverse repurchase agreements and other similar secured lending c 205,772 205,527 143,431 142,524Financial liabilities:Deposits from banks d 77,975 77,949 76,446 76,457Items in the course of collection due to other banks a 1,321 1,321 1,466 1,466Customer accounts:– Current and demand accounts d 110,443 110,443 100,710 100,710– Savings accounts d 91,928 91,928 81,188 81,188– Other time deposits d 143,431 143,593 140,557 140,570Trading portfolio liabilities:– Debt securities and other eligible bills b 64,607 64,607 44,708 44,708– Equity securities b 7,568 7,568 6,468 6,468– Commodities b 518 518 76 76Financial liabilities designated at fair value:– Debt securities b 76,907 76,907 72,191 72,191– Deposits b 10,243 10,243 6,275 6,275– Other financial assets designated at fair value b 8,632 8,632 7,736 7,736– Liabilities to customers under investment contracts b 1,947 1,947 1,679 1,679Derivative financial instruments b 405,516 405,516 403,416 403,416Debt securities in issue d 156,623 155,974 135,902 135,405Repurchase agreements and other similar secured lending d 225,534 225,511 198,781 198,781Subordinated liabilities d 28,499 27,183 25,816 25,299
Notesa Fair value approximates carrying value due to the short-term nature of these financial
assets and liabilities. b The carrying value of financial instruments measured at fair value (including those held
for trading, designated at fair value, derivatives and available for sale) is determined in accordance with the accounting policy noted on pages 82 and 83. Further description and analysis of these fair values are set out below.
c The carrying value of financial assets measured at amortised cost (including loans and advances, and other lending such as reverse repurchase agreements and cash collateral on securities borrowed) is determined in accordance with the accounting policy as noted on page 83. In many cases the fair value disclosed approximates the carrying value because the instruments are short-term in nature or have interest rates that reprice frequently. In other cases, fair value is determined using discounted cash flows, applying market derived interest rates. Alternatively, fair value is determined by applying an
average of available regional and industry segmental credit spreads to the loan portfolio, taking the contractual maturity of the loan facilities into consideration.
d The carrying value of financial liabilities measured at amortised cost (including customer accounts and other deposits such as repurchase agreements and cash collateral on securities lent, debt securities in issue, and subordinated liabilities) is determined in accordance with the accounting policy as noted on page 83. In many cases, the fair value disclosed approximates the carrying value because the instruments are short-term in nature or have interest rates that reprice frequently such as customer accounts and other deposits and short-term debt securities. Fair values of other debt securities in issue are based on quoted prices where available, or where these are unavailable, are estimated using a valuation model. Fair values for dated and undated convertible and non convertible loan capital are based on quoted market rates for the issue concerned or similar issues with terms and conditions.
Barclays Bank PLC Annual Report 2010 www.barclays.com/annualreport10 145

Notes to the financial statementsFor the year ended 31st December 2010 continued
41 Fair value of financial instruments continued
The Bank 2010 2009
Notes
Carryingamount
£m
FairValue
£m
Carryingamount
£m
FairValue
£m
Financial assets: Cash and balances at central banks a 92,686 92,686 78,447 78,447 Items in the course of collection from other banks a 1,268 1,268 1,373 1,373 Trading portfolio assets: – Debt securities and other eligible bills b 86,328 86,328 83,680 83,680– Equity securities b 4,901 4,901 5,552 5,552 – Traded Loans b 2,500 2,500 2,945 2,945 – Commodities b 1,305 1,305 1,629 1,629 Financial assets designated at fair value: – Equity securities b 11 11 66 66 – Loans and advances b 25,093 25,093 21,636 21,636 – Debt securities b 783 783 3,338 3,338 – Other financial assets designated at fair value b 3,294 3,294 2,605 2,605 – Held in respect of linked liabilities under investment contracts b – – – – Derivative financial instruments b 441,145 441,145 429,895 429,895 Loans and advances to banks c 40,390 40,216 42,963 42,963Loans and advances to customers: – Residential mortgage loans c 123,995 117,361 110,605 104,227 – Credit card receivables c 12,184 12,184 11,523 11,523 – Other personal lending c 14,230 14,378 14,125 14,125 – Wholesale and corporate loans and advances c 372,301 366,632 375,513 370,198 – Finance lease receivables c 226 226 362 362 Available for sale financial investments: – Debt securities and other eligible bills b 45,076 45,076 35,984 35,984 – Equity securities b 145 145 590 590 Reverse repurchase agreements and other similar secured lending c 227,343 227,132 145,433 144,526 Financial liabilities: Deposits from banks d 97,526 97,530 90,253 90,265 Items in the course of collection due to other banks a 1,270 1,270 1,384 1,384 Customer accounts: – Current and demand accounts d 73,623 73,623 65,734 65,734 – Savings accounts d 80,616 80,616 71,703 71,703 – Other time deposits d 299,758 299,758 307,082 307,073 Trading portfolio liabilities: – Debt securities and other eligible bills b 40,677 40,677 30,993 30,993 – Equity securities b 3,157 3,157 2,465 2,465 – Commodities b 518 518 76 76 Financial liabilities designated at fair value: – Debt securities b 80,227 80,227 71,303 71,303 – Deposits b 8,607 8,607 4,581 4,581 – Other financial assets designated at fair value b 8,208 8,208 7,662 7,662 – Liabilities to customers under investment contracts b – – – – Derivative financial instruments b 426,243 426,243 418,354 418,354 Debt securities in issue d 106,267 105,839 82,141 82,569 Repurchase agreements and other similar secured lending d 214,207 214,207 165,195 165,195 Subordinated liabilities d 26,994 25,601 24,893 24,120
Notesa See page 145.
146 Barclays Bank PLC Annual Report 2010 www.barclays.com/annualreport10

41 Fair value of financial instruments continuedValuation inputs'IFRS 7 – Financial Instruments: Disclosures' requires an entity to classify its financial instruments held at fair value according to a hierarchy that reflects the significance of observable market inputs.
The classification of a financial instrument is based on the lowest level input that is significant to the fair value measurement in its entirety. The three levels of the fair value hierarchy are defined below.
Quoted market prices – Level 1Financial instruments are classified as Level 1 if their value is observable in an active market. Such instruments are valued by reference to unadjusted quoted prices for identical assets or liabilities in active markets where the quoted price is readily available, and the price represents actual and regularly occurring market transactions on an arm’s length basis. An active market is one in which transactions occur with sufficient volume and frequency to provide pricing information on an ongoing basis.
This category includes exchange traded government bonds, actively traded listed equities and actively exchange-traded derivatives.
Valuation technique using observable inputs – Level 2 Financial instruments classified as Level 2 have been valued using models whose inputs are observable in an active market. Valuations based on observable inputs include financial instruments such as swaps and forwards which are valued using market standard pricing techniques, and options that are commonly traded in markets where all the inputs to the market standard pricing models are observable.
This category includes most investment grade and liquid high yield bonds, certain asset backed securities, US agency securities, government bonds, less actively traded listed equities, bank, corporate and municipal obligations, certain OTC derivatives, certain convertible bonds, certificates of deposit, commercial paper, certain collateralised debt obligations (CDOs) (cash and synthetic underlyings), collateralised loan obligations (CLOs), most commodities based derivatives, credit derivatives, certain credit default swaps (CDSs), most fund units, certain loans, foreign exchange spot and forward transactions and certain issued notes.
Valuation technique using significant unobservable inputs – Level 3Financial instruments are classified as Level 3 if their valuation incorporates significant inputs that are not based on observable market data (unobservable inputs). Such inputs are generally determined based on observable inputs of a similar nature, historical observations on the level of the input or other analytical techniques.
This category includes certain corporate debt securities, distressed debt, private equity investments, commercial real estate loans, certain OTC derivatives (requiring complex and unobservable inputs such as correlations and long dated volatilities), certain convertible bonds, some CDOs (cash and synthetic underlyings), credit default swaps, derivative exposures to Monoline insurers, fund units, certain asset backed securities, certain issued notes, certain collateralised loan obligations (CLOs) and certain loans.
Barclays Bank PLC Annual Report 2010 www.barclays.com/annualreport10 147

Notes to the financial statementsFor the year ended 31st December 2010 continued
41 Fair value of financial instruments continuedThe following table shows the Group’s financial assets and liabilities that are measured at fair value analysed by level within the fair value hierarchy.
Financial assets and liabilities measured at fair value Valuation technique using
The Group
Quotedmarketprices
(Level 1)£m
Observableinputs
(Level 2)£m
Significantunobservable
inputs(Level 3)
£mTotal
£m
31st December 2010Trading portfolio assets 48,466 114,723 5,741 168,930Financial assets designated at fair value 5,406 25,175 10,904 41,485Derivative financial assets 3,023 408,214 9,082 420,319Available for sale financial investments 25,949 36,201 3,290 65,440Total assets 82,844 584,313 29,017 696,174
Trading portfolio liabilities (30,247) (42,345) (101) (72,693)Financial liabilities designated at fair value (4) (94,088) (3,637) (97,729)Derivative financial liabilities (2,567) (396,695) (6,254) (405,516)Total Liabilities (32,818) (533,128) (9,992) (575,938)
31st December 2009Trading portfolio assets 76,256 69,061 6,078 151,395Financial assets designated at fair value 6,975 24,893 10,700 42,568Derivative financial assets 3,163 401,451 12,201 416,815Available for sale financial investments 20,087 35,287 1,277 56,651Total assets 106,481 530,692 30,256 667,429
Trading portfolio liabilities (42,238) (8,936) (78) (51,252)Financial liabilities designated at fair value (109) (83,944) (3,828) (87,881)Derivative financial liabilities (2,386) (391,916) (9,114) (403,416)Total Liabilities (44,733) (484,796) (13,020) (542,549)
Financial assets and liabilities measured at fair value Valuation technique using
The Bank
Quotedmarketprices
(Level 1)£m
Observableinputs
(Level 2)£m
Significantunobservable
inputs(Level 3)
£mTotal
£m
31st December 2010 Trading portfolio assets 19,611 69,654 5,769 95,034Financial assets designated at fair value 8 22,486 6,687 29,181Derivative financial assets – 431,643 9,502 441,145Available for sale financial investments: 12,567 30,306 2,348 45,221Total assets 32,186 554,089 24,306 610,581
Trading portfolio liabilities (11,235) (33,115) (2) (44,352)Financial liabilities designated at fair value (3) (94,331) (2,708) (97,042)Derivative financial liabilities (8) (420,014) (6,221) (426,243)Total Liabilities (11,246) (547,460) (8,931) (567,637)
31st December 2009 Trading portfolio assets 46,803 42,559 4,444 93,806 Financial assets designated at fair value 9 21,656 5,980 27,645 Derivative financial assets 13 416,016 13,866 429,895 Available for sale financial investments 7,739 27,968 867 36,574 Total assets 54,564 508,199 25,157 587,920
Trading portfolio liabilities (27,967) (5,558) (9) (33,534)Financial liabilities designated at fair value (80,924) (2,622) (83,546)Derivative financial liabilities (13) (408,487) (9,854) (418,354)Total Liabilities (27,980) (494,969) (12,485) (535,434)
Transfers between level 1 and level 2 primarily comprised government bonds that had less observable market prices.
148 Barclays Bank PLC Annual Report 2010 www.barclays.com/annualreport10

41 Fair value of financial instruments continuedThe following table shows the Group’s financial assets and liabilities that are measured at fair value disaggregated by valuation technique and product type.
Assets LiabilitiesFinancial assets and liabilities measured at fair value by product type Valuation technique using Valuation technique using
The Group
Quotedmarket prices
(Level 1)£m
Observableinputs
(Level 2)£m
Significantunobservable
inputs(Level 3)
£m
Quotedmarket prices
(Level 1)£m
Observableinputs
(Level 2)£m
Significantunobservable
inputs(Level 3)
£m
31st December 2010Commercial real estate loans – – 5,424 – – –Asset backed products – 39,649 4,628 – (6,287) (1,912)Other credit products – 50,230 1,097 – (42,216) (1,318)Derivative exposure to Monoline insurers – – 1,449 – – –Non-asset backed debt instruments 47,108 99,688 2,956 (23,008) (105,481) (2,719)Equity products 33,384 9,708 1,478 (9,292) (14,342) (1,895)Private equity – 27 2,844 – – –Funds and fund-linked products 591 3,674 1,084 – (1,827) –Foreigh exchange products – 29,883 506 – (30,349) (241)Interest rate products – 305,235 2,407 – (291,420) (1,079)Commodity products 1,378 28,520 493 (518) (36,191) (629)Other 383 17,699 4,651 – (5,015) (199)Total 82,844 584,313 29,017 (32,818) (533,128) (9,992)
31st December 2009Commercial real estate loans – – 7,170 – – –Asset backed products – 34,779 5,840 – (6,165) (2,334)Other credit products 1 47,202 2,020 – (47,904) (2,827)Derivative exposure to Monoline insurers – – 2,027 – – –Non-asset backed debt instruments 72,578 66,936 3,127 (35,760) (73,371) (3,202)Equity products 28,221 11,772 1,536 (8,788) (13,737) (1,922)Private equity 73 176 1,978 – – –Funds and fund-linked products 3,856 5,387 1,241 – (2,049) –Foreign exchange products – 24,885 761 – (25,159) (379)Interest rate products 176 288,718 2,357 – (275,684) (1,775)Commodity products 1,414 31,562 748 (76) (37,091) (581)Other 162 19,275 1,451 (109) (3,636) –Total 106,481 530,692 30,256 (44,733) (484,796) (13,020)
Barclays Bank PLC Annual Report 2010 www.barclays.com/annualreport10 149

Notes to the financial statementsFor the year ended 31st December 2010 continued
41 Fair value of financial instruments continuedLevel 3 classificationThe following table shows level three financial assets and liabilities disaggregated by balance sheet classification and product type.
Level 3 financial assets and liabilities by balance sheet classification and product type Non-derivative assets Non-derivative liabilities Derivatives
The Group
Tradingportfolio
assets£m
Financialassets
designated atfair value
£m
Available forsale assets
£m
Tradingportfolioliabilities
£m
Financialliabilities
designated atfair value
£m
Net derivativefinancial
instrumentsa
£m
31st December 2010Commercial real estate loans – 5,424 – – – –Asset backed products 1,720 364 312 (5) (17) 342Other credit products – 237 – (4) (716) 262Derivative exposure to Monoline insurers – – – – – 1,449Non-asset backed debt instruments 2,460 325 168 (1) (2,690) (25)Equity products 135 – 27 – – (579)Private equity 50 1,995 799 – – –Funds and fund-linked products 1,084 – – – – –Foreign exchange products – – – – – 265Interest rate products – 61 – – (27) 1,294Commodity products – 14 4 – (161) 7Other 292 2,484 1,980 (91) (26) (187)Total 5,741 10,904 3,290 (101) (3,637) 2,828
31st December 2009Commercial real estate loans – 7,170 – – – –Asset backed products 1,840 423 205 (5) (63) 1,106Other credit products – 92 – – (595) (304)Derivative exposure to Monoline insurers – – – – – 2,027Non-asset backed debt instruments 2,461 438 166 (73) (3,081) 14Equity products 190 – 157 – – (733)Private equity 104 1,237 637 – – –Funds and fund-linked products 1,128 8 105 – – –Foreign exchange products – – – – – 382Interest rate products – 64 – – (25) 543Commodity products – 12 4 – (64) 215Other 355 1,256 3 – – (163)Total 6,078 10,700 1,277 (78) (3,828) 3,087
Notea The derivative financial instruments in the table above are represented on a net basis
of £2,828m (2009: £3,087m). On a gross basis derivative financial assets are £9,082m (2009: £12,201m), derivative financial liabilities are £6,254 (2009: £9,114m).
150 Barclays Bank PLC Annual Report 2010 www.barclays.com/annualreport10

41 Fair value of financial instruments continuedLevel 3 movement analysisThe following table summarises the movements in the level 3 balance during the year. The table shows gains and losses and includes amounts for all financial assets and liabilities transferred to and from level 3 during the year. Transfers have been reflected as if they had taken place at the beginning of the year.
Analysis of movements in level 3 financial assets and liabilities Trading
portfolioassets
£m
Financialassets
designated atfair value
£m
Available forsale assets
£m
Tradingportfolioliabilities
£m
Financialliabilities
designated atfair value
£m
Net derivativefinancial
instrumentsa/
£mb Total
£m
The GroupAs at 1st January 2010 6,078 10,700 1,277 (78) (3,828) 3,087 17,236 Purchases 2,830 890 234 (96) (12) 762 4,608 Sales (3,334) (1,117) (121) – 39 147 (4,386)Issues – – – – (243) (555) (798)Settlements (455) (924) (206) 63 601 (94) (1,015)Total gains and losses in the period recognised in the income statement: – trading income 683 203 – – (730) (5) 151 – other income – 173 (94) – – – 79 Total gains or losses recognised in other comprehensive income – – 208 – – – 208 Transfers in/(transfers out) (61) 979 1,992 10 536 (514) 2,942 As at 31st December 2010 5,741 10,904 3,290 (101) (3,637) 2,828 19,025
The Bank As at 1st January 2010 4,444 5,980 867 (9) (2,622) 4,012 12,672 Purchases 1,141 285 165 – (12) 738 2,317 Sales (1,856) (157) – – 24 147 (1,842)Issues – – – – (176) (566) (742)Settlements (345) (570) (126) 3 293 (135) (880)Total gains and losses in the period recognised in the income statement – trading income 1,068 (23) – 2 (465) (421) 161 – other income – 19 (135) – – – (116)Total gains or losses recognised in other comprehensive income – – 93 – – – 93 Transfers in/(transfers out) 1,317 1,153 1,484 2 250 (494) 3,712 As at 31st December 2010 5,769 6,687 2,348 (2) (2,708) 3,281 15,375
The significant movements in level 3 positions during the year are explained below:
– purchases of £4.6bn were primarily composed of £2.3bn of asset backed products, £0.6bn of equity products, £0.4bn of non-asset backed debt instruments and £0.4bn of private equity assets;
– sales of £4.4bn included the sale of £2.4bn of asset backed products, £0.6bn of non-asset backed debt instruments, £0.6bn of private equity assets and £0.4bn of commercial real estate loans;
– net Issuances and Settlements of £1.8bn were primarily driven by £0.6bn of commercial real estate settlements, and £0.5bn of equity product issuances; and
– transfers into Level 3 primarily reflected a £2.0bn receivable arising as part of the acquisition of the North American businesses of Lehman Brothers. This resulted from a change in the accounting treatment from loans and advances to available for sale financial instruments. This classification is due to the uncertainty inherent in any litigation, rather than uncertainty relating to the valuation of the assets themselves. In addition, a further £1.0bn was transferred from level 2 to level 3 due to unobservable valuation inputs becoming significant to the overall valuation of certain fixed rate loans.
Notea The Group’s derivative financial instruments in the table above are represented on a net
basis of £2,828m (2009: £3,087m). On a gross basis derivative financial assets are £9,082m (2009: £12,201m), derivative financial liabilities are £6,254 (2009: £9,114m).
b The Bank’s derivative financial instruments in the table above are represented on a net basis of £3,281m (2009: £4,012m). On a gross basis derivative financial assets are £9,502m (2009: £13,866m), derivative financial liabilities are £6,221 (2009: £9,854m).
Barclays Bank PLC Annual Report 2010 www.barclays.com/annualreport10 151

Notes to the financial statementsFor the year ended 31st December 2010 continued
41 Fair value of financial instruments continued
Analysis of movements in level 3 financial assets and liabilities Trading
portfolioassets
£m
Financialassets
designated atfair value
£m
Available forsale assets
£m
Tradingportfolioliabilities
£m
Financialliabilities
designated atfair value
£m
Net derivativefinancial
instruments£m
Total£m
The Group As at 1st January 2009 14,625 17,681 3,137 (258) (3,779) 7,493 38,899 Purchases 2,021 700 459 (70) (313) 2,334 5,131 Sales (7,018) (4,875) (9) 172 690 (3,548) (14,588)Issues – – – – (1,343) (1,718) (3,061)Settlements (410) (804) (347) – 763 (100) (898)Total gains and losses in the period recognised in the income statement – trading income (2,290) (3,356) – 27 1,574 (3,516) (7,561)– other income – (434) (131) – – – (565)Total gains or losses recognised in other comprehensive income – – (103) – – – (103)Transfers in/(transfers out) (850) 1,788 (1,729) 51 (1,420) 2,142 (18)As at 31st December 2009 6,078 10,700 1,277 (78) (3,828) 3,087 17,236
The Bank As at 1st January 2009 12,541 7,965 1,162 (256) (2,817) 10,386 28,981 Purchases 751 414 251 (2) (110) 1,767 3,071 Sales (5,875) (1,207) – 171 79 (3,503) (10,335)Issues – – – – (1,132) (1,074) (2,206)Settlements (159) (465) (114) – 352 (220) (606)Total gains and losses in the period recognised in the income statement: – trading income (2,384) (1,277) – 26 1,609 (5,267) (7,293)– other income – 21 (21) – – – – Total gains or losses recognised in other comprehensive income – – (271) – – – (271)Transfers in/(transfers out) (430) 529 (140) 52 (603) 1,923 1,331 As at 31st December 2009 4,444 5,980 867 (9) (2,622) 4,012 12,672
Gains and losses on level 3 financial assets and liabilitiesThe following table discloses the gains and losses recognised in the year arising on level 3 financial assets and liabilities held at year end.
Gains and losses recognised during the period on level 3 financial assets and liabilities held Trading
portfolioassets
£m
Financialassets
designated atfair value
£m
Available forsale assets
£m
Tradingportfolioliabilities
£m
Financialliabilities
designated atfair value
£m
Net derivativefinancial
instruments£m
Total£m
The Group As at 31st December 2010 Recognised in the income statement: – trading income 345 215 – (1) (528) (66) (35)– other income – 115 (166) – – – (51)Total gains or losses recognised in other comprehensive income – – 133 – – – 133 Total 345 330 (33) (1) (528) (66) 47
The Bank As at 31st December 2010 Recognised in the income statement: – trading income 339 142 – 2 (434) (449) (400)– other income – 18 (301) – – – (283)Total gains or losses recognised in other comprehensive income – – (3) – – – (3)Total 339 160 (304) 2 (434) (449) (686)
152 Barclays Bank PLC Annual Report 2010 www.barclays.com/annualreport10

41 Fair value of financial instruments continued
Gains and losses reognised during the period on level 3 financial assets and liabilities held Trading
portfolioassets
£m
Financialassets
designated atfair value
£m
Available forsale assets
£m
Tradingportfolioliabilities
£m
Financialliabilities
designated atfair value
£m
Net derivativefinancial
instruments£m
Total£m
The Group As at 31st December 2009 Recognised in the income statement: – trading income (736) (3,034) – 8 (269) (2,817) (6,848)– other income – (452) (140) – – – (592)Total gains or losses recognised in other comprehensive income – – (65) – – – (65)Total (736) (3,486) (205) 8 (269) (2,817) (7,505)
The Bank As at 31st December 2009 Recognised in the income statement: – trading income (855) (3,026) – 8 (235) (2,725) (6,833)– other income – (405) (16) – – – (421)Total gains or losses recognised in other comprehensive income – – (279) – – – (279)Total (855) (3,431) (295) 8 (235) (2,725) (7,533)
Valuation techniques Current year valuation methodologies were consistent with the prior year unless otherwise noted below. These methodologies are commonly used by market participants.
The valuation techniques used for the main products that are not determined by reference to unadjusted quoted prices (Level 1), are described below.
Commercial real estate loansThis category includes lending on a range of commercial property types including retail, hotels, office and development properties.
Fair value is calculated using a risk adjusted spread based methodology performed on a loan by loan basis with consideration of characteristics such as property type, geographic location, yields, credit quality and property performance reviews.
The valuation inputs are reviewed with reference to published bond indices. Initial spreads are sourced from market quoted origination spreads by property type and classified into Loan-to-Value (LTV) buckets which are adjusted for internal credit rating and subordination of the loans. The internal credit ratings used in the valuation model are subject to a monthly review process. The model is calibrated monthly based on external quotes of new origination property type spreads and the latest internal credit ratings.
The valuations are considered unobservable due to the bespoke nature of the instruments.
Asset backed productsThese are debt and derivative products that are linked to the cash flows of a pool of referenced assets. This category includes asset backed loans, CDOs (cash underlyings), CLOs, asset backed credit derivatives, asset and mortgage backed securities.
Valuations are determined using industry standard cash flow models that calculate fair value based on loss projections, prepayment, recovery and discount rates. These parameters are determined by reference to underlying collateral performance, independent research, ABX indices, broker quotes, observable trades on similar securities and third party pricing sources.
Within this population, certain valuation inputs are unobservable for non-investment grade ABS, non-agency residential mortgage backed securities (RMBS) and asset backed credit derivatives. Where unobservable, a parameter will be set with reference to an observable proxy. The determination of parameter levels takes account of a range of factors such as deal vintage, underlying asset composition (historical losses, borrower characteristics, various loan attributes such as loan-to-value and debt-to-income ratios and geographic concentration), credit ratings (original and current), home price changes and interest rates.
Other credit productsThese products are linked to the credit spread of a referenced entity, index or basket of referenced entities. This category includes synthetic CDOs, single name and index CDS and Nth to default basket swaps. Within this population, valuation inputs are unobservable for CDS with illiquid reference assets and certain synthetic CDOs.
A market standard model is used in the valuation of CDS whereby the credit curve is the significant input in the overall valuation. Credit spreads are observed directly from broker data, third party vendors or priced to proxies. Where credit spreads are unobservable, they are determined with reference to recent transactions or bond spreads from observable issuances of the same issuer or other similar entities as a proxy.
Barclays Bank PLC Annual Report 2010 www.barclays.com/annualreport10 153

Notes to the financial statementsFor the year ended 31st December 2010 continued
41 Fair value of financial instruments continuedSynthetic CDOs are valued using a model that calculates fair value based on observable and unobservable parameters including credit spreads, recovery rates, correlations and interest rates and is calibrated daily. For index and bespoke synthetic CDOs with unobservable inputs, correlation is set with reference to index tranche market.
Derivative exposure to Monoline insurersThese products are derivatives through which default protection has been purchased as securities, primarily CLOs.
The credit spreads of the counterparty providing protection are unobservable at the required maturity. The derivative positions are valued with reference to the price of the underlying security. As the security and derivative are hedged, the net present value of the derivative increases as the net present value of the security decreases. The derivative valuation is then adjusted to reflect the credit quality of the counterparty.
Non-asset backed debt instrumentsThese are government bonds, US agency bonds, corporate bonds, commercial paper, certificates of deposit, convertible bonds, notes and other non-asset backed bonds. Within this population, valuation inputs are unobservable for certain convertible bonds, corporate bonds and issued notes.
Exchanged traded government bonds are classified as Level 1. Less liquid, government bonds, US agency bonds, corporate bonds, commercial paper and certificates of deposit are valued using observable market prices which are sourced from broker quotes, inter-dealer prices or other reliable pricing services . Where there are not observable market prices, fair value is determined by reference to either issuances or CDS spreads of the same issuer as proxy inputs to obtain discounted cash flows to value the bond. In the absence of observable bond or CDS spreads for the respective issuer, similar reference assets or sector averages are applied as a proxy.
Convertible bonds are valued using prices observed through broker sources, market data services and trading activity. Prices are validated against liquid external sources. Where liquid external sources are not available, fair value is determined using a spread to the equity conversion value or the value of the bond without the additional equity conversion. The spread level is determined with reference to similar proxy assets.
Most fixed and floating rate notes issued are valued using models that discount expected future cash flows. These models calculate fair value based on observable interest rates and funding or credit spreads. The interest rates are derived from broker and bank notes rates. In certain emerging markets, funding spreads may be unobservable. Funding spreads up to five years are sourced from negotiable commercial deposit rates in the market as a proxy. Funding spreads greater than five years are determined by applying extrapolation techniques.
Equity Linked Notes valuations are determined using industry standard models. The models calculate fair value based on input parameters such as stock prices, dividends, volatilities, interest rates, equity repo curves and, for multi-asset products, correlations. In general, input parameters are observable, with unobservable inputs having an insignificant impact on the valuation.
The valuation for fund linked notes is consistent with the valuation of the underlying (see the ‘Funds and fund–linked products’ section below).
Equity productsThis category includes listed equities; exchange traded derivatives; OTC equity derivatives; preference shares and contracts for difference.
OTC equity derivatives valuations are determined using industry standard models. The models calculate fair value based on input parameters such as stock prices, dividends, volatilities, interest rates, equity repo curves and, for multi-asset products, correlations. In general, input parameters are deemed observable up to liquid maturities which are determined separately for each parameter and underlying instrument. Unobservable model inputs are set by reference to liquid market instruments and applying extrapolation techniques to match the risk profile of the trading portfolio. These are validated against consensus market data services for the same or similar underlying instrument.
Private equityPrivate equity investments are valued in accordance with the ‘International Private Equity and Venture Capital Valuation Guidelines’. This requires the use of a number of individual pricing benchmarks such as the prices of recent transactions in the same or similar instruments, discounted cashflow analysis, and comparison with the earnings multiples of listed comparative companies. Unobservable inputs include earnings estimates, multiples of comparative companies, marketability discounts and discount rates. Model inputs are based on market conditions at the reporting date. The valuation of unquoted equity instruments is subjective by nature. However, the relevant methodologies are commonly applied by other market participants and have been consistently applied over time. Full valuations are performed bi-annually, with the portfolio reviewed on a monthly basis for material events that might impact upon fair value.
Fund and fund-linked productsThis category includes holdings in hedge funds, funds of funds, and fund derivatives. Fund derivatives are derivatives whose underlyings include mutual funds, hedge funds, fund indices and multi-asset portfolios. They are valued using underlying fund prices, yield curves and other available market information.
In general fund holdings are valued based on the latest available valuation received from the fund administrator. Funds are deemed unobservable where the fund is either suspended, in wind-down, has a redemption restriction that severely affects liquidity, or where the latest net asset value from the fund administrators is more than three months old. In the case of illiquid fund holdings the valuation will take account of all available information in relation to the underlying fund or collection of funds and maybe adjusted relative to the performance of relevant index benchmarks.
Foreign exchange productsThese products are derivatives linked to the foreign exchange market. This category includes forward contracts, FX swaps and FX options. Exotic derivatives are valued using industry standard and bespoke models.
154 Barclays Bank PLC Annual Report 2010 www.barclays.com/annualreport10

41 Fair value of financial instruments continuedFair value is based on input parameters that include FX rates, interest rates, FX volatilities, interest rate volatilities, FX interest rate correlations and other model parameters. Certain correlations and long dated forward and volatilities are unobservable. Unobservable model inputs are set by referencing liquid market instruments and applying extrapolation techniques to match the risk profile of the trading portfolio. These are validated against consensus market data services.
Interest rate productsThese are products linked to interest rates or inflation indices. This category includes interest rate and inflation swaps, swaptions, caps, floors, inflation options, balance guaranteed swaps and other exotic interest rate derivatives. Interest rate products are valued using standard discounted cash flow techniques.
Interest rate derivative cash flows are valued using interest rates yield curves whereby observable market data is used to construct the term structure of forward rates. This is then used to project and discount future cash flows based on the parameters of the trade. An instrument with optionality is valued using a volatility surface constructed from market observable inputs. Exotic interest rate derivatives are valued using industry standard and bespoke models based on observable market parameters which are determined separately for each parameter and underlying instrument. Where unobservable, a parameter will be set with reference to an observable proxy.
For inflation swaps, the inflation adjusted yield curve is the most significant input in the overall valuation. In an inflation swap, an inflation based cash flow is swapped for either a fixed or floating interest rate cash flow. Flows on the inflation leg of the trades are projected using the relevant inflation forward curve and discounted. Any floating rates will be projected using the relevant interest rate yield curve and discounted. Inflation forward curves and interest rate yield curves are extrapolated beyond observable tenors and verified against any available market data.
Balance guaranteed swaps are valued using industry standard cash flow models that calculate fair value based on loss projections, prepayment, recovery and discount rates. These parameters are determined by reference to underlying asset performance, independent research, ABX indices, broker quotes, observable trades on similar securities and third party pricing sources. Prepayment is projected based on observing historic prepayment.
During 2010, in line with changes in market practice, the methodology for valuing certain collateralised interest rate products was updated to make use of more relevant interest rate yield curves to discount cash flows. For certain collateralised vanilla swaps, inflation derivatives and other linear fixed income derivatives Overnight Indexed Swap (OIS) rates were used rather than other market reference rates such as LIBOR.
Commodity productsThese products are exchange traded and OTC derivatives based on an underlying commodity such as metals, oil and oil related, agriculturals, power and natural gas.
Valuation inputs of certain commodity swaps and options are determined using models incorporating discounting of cash flows and other industry standard modeling techniques. Fair value is calculated using inputs such as forward curves, volatility surfaces and tenor correlation. Unobservable inputs are set with reference to similar observable products or by applying extrapolation techniques from the observable market.
Other This category is primarily made up of fixed rate loans, which are valued using models that discount expected future cash flows. These models calculate the fair value based on observable interest rates and unobservable funding or credit spreads. Unobservable funding or credit spreads are determined by applying extrapolation of observable spreads.
The receivables resulting from the acquisition of the North American businesses of Lehman Brothers is included witin ‘Other’. For more details, refer to Note 25 Legal Proceedings.
Fair value adjustments The main adjustments to model or system balances to arrive at a fair value are described below:
Bid-Offer valuation adjustmentsPortfolios are valued to reflect the most advantageous market price to which Barclays has immediate access. For assets and liabilities where the firm is not a market maker, mid prices are adjusted to bid and offer prices respectively. The bid-offer adjustment factors reflect the expected close out strategy and, for derivatives, that they are managed on a portfolio basis. The methodology for determining the bid-offer adjustment for a derivative portfolio will generally involve netting between long and short positions and the bucketing of risk by strike and term in accordance with hedging strategy. Bid-offer levels are derived from market sources, such as broker data, and are reviewed periodically. For those assets and liabilities where the firm is a market maker (which is the case for certain equity, bond and vanilla derivative markets), since the bid-offer spread does not represent a transaction cost, mid prices are used.
Uncertainty adjustmentsMarket data input for exotic derivatives may not have a directly observable bid offer spread. In such instances, an uncertainty adjustment is applied as a proxy for the bid offer adjustment. An example of this is correlation risk where an adjustment is required to reflect the possible range of values that market participants apply. The uncertainty adjustment may be determined by calibrating to derivative prices, or by scenario analysis or historical analysis.
Model valuation adjustments New valuation models are reviewed under the firm’s Trade Approval Procedures and Model Validation Policy. This process identifies the assumptions used and any model limitations (for example, if the model does not incorporate volatility skew). Where necessary, fair value adjustments will be applied to take these factors into account. Model valuation adjustments are dependant on the size of portfolio, complexity of the model, whether the model is market standard and to what extent it incorporates all known risk factors. All models and model valuation adjustments are subject to review on at least an annual basis.
Barclays Bank PLC Annual Report 2010 www.barclays.com/annualreport10 155

Notes to the financial statementsFor the year ended 31st December 2010 continued
41 Fair value of financial instruments continuedCredit and debit valuation adjustmentsCredit valuation adjustments (CVAs) and Debit valuation adjustments (DVAs) are incorporated into derivative valuations to reflect the impact on the fair value of counterparty risk and Barclays own credit quality respectively. These adjustments are modelled for OTC derivatives across all asset classes.
Probability of Default (PD) and Loss Given Default (LGD) are applied to expected exposures at a counterparty level to arrive at a CVA and DVA adjustment.
Monoline credit valuation adjustmentsBarclays determines its internal credit ratings for Monolines based upon its independent, fundamental credit analysis in conjunction with a cross reference to external ratings where available. These internal credit ratings can, and at times do, differ from the publicly available ratings.
For Monolines where a default has either occurred, is imminent or there is a possibility of regulatory intervention, an adjustment may be made to the internal credit rating. This will be based on the estimated recovery from a range of potential scenarios.
The PD used to calculate the CVA is derived from the relevant internal credit rating and is based on internal simulations of credit factor indices by region and industry designations, calibrated to historical time-series and forecast on the basis of current values. The LGD used is a function of available historical data, the Monoline’s credit quality and risk concentration, and recovery values observed in executed commutation settlements.
The CVA for all Monolines is based upon an expected exposure methodology. Expected exposure is calculated by simulating default losses on the underlying assets, calibrated to market observable parameters and forward looking market research. This exposure is then further adjusted for any spread between prices derived from observable proxies. Barclays will then apply the PD of the Monoline to this expected exposure and multiply the result by the LGD to determine the CVA for each Monoline.
Other credit and debit valuation adjustmentsDerivative CVAs and DVAs for non Monoline exposures are calculated using Monte-Carlo simulation to generate an expected exposure profile. The expected exposure is calculated at a counterparty level after netting and collateral are applied. The PD and LGD are derived from a combination of single name credit default swap prices where observable, industry curves, indices, and loan/note pricing taking into account geographic factors, internal credit ratings, loss assumptions and ratings agency data.
For counterparties with an observable credit market, the PD and LGD are derived from single name credit default swap prices. For counterparties with no observable credit market, the PD and LGD are derived from either a generic or a specific curve. The PD and LGD is derived from internal credit ratings and the appropriate geographic index. Specific curves will incorporate any relevant additional factors into the generic curve.
Where the curve is unobservable and the CVA is significant to the overall value of the underlying derivative, the full value of the derivative and its associated credit valuation adjustment is deemed unobservable.
CVAs are not incorporated into the fair value of certain counterparties where it has been observed that the market does not apply a credit charge. The categories of counterparties excluded are as follows:
– Strongly collateralised counterparties – this is any counterparty with a collateral agreement with minimum weekly calls and the collateral threshold plus minimum transfer amount below a defined level;
– Certain highly-rated sovereigns, supra-nationals and government agencies; and
– Liquidity providers – when trading on the interbank market with certain collateralised market making counterparties no counterparty spreads are applied.
Where counterparty credit quality and exposure to that counterparty are linked, wrong way risk may arise. In these instances, wrong way risk suggests that exposure to the counterparty is likely to increase as counterparty credit quality deteriorates. Exposure to wrong way risk is limited via internal governance processes and deal pricing.
Barclays Capital uses credit default swap spreads to determine the impact of Barclays own credit quality on the fair value of derivative liabilities. At 31st December 2010, cumulative adjustments of £352m (31st December 2009: £307m) were recorded against derivative liabilities. The impact of these adjustments in both periods was more than offset by the impact of the credit valuation adjustments to reflect counterparty creditworthiness that were netted against derivative assets.
Own credit adjustmentsThe carrying amount of issued notes that are designated under the IAS 39 fair value option is adjusted to reflect the effect of changes in own credit spreads. The resulting gain or loss is recognised in the income statement.
For funded instruments such as issued notes, credit spreads on Barclays issued bonds represent the most appropriate basis for this adjustment.
At 31st December 2010, the own credit adjustment arose from the fair valuation of £96.0bn (31st December 2009: £86.0bn) of Barclays Capital’s financial liabilities designated at fair value. Barclays credit spreads widened during 2010, leading to a profit of £391m (2009: loss £1,820m) from the fair value of changes primarily in own credit but also from the effects of foreign exchange rates, time decay and trade activity.
156 Barclays Bank PLC Annual Report 2010 www.barclays.com/annualreport10

41 Fair value of financial instruments continuedUnrecognised gains as a result of the use of valuation models using unobservable inputsThe amount that has yet to be recognised in income that relates to the difference between the transaction price (the fair value at initial recognition) and the amount that would have arisen had valuation models using unobservable inputs been used on initial recognition, less amounts subsequently recognised, was as follows:
The Group The Bank
2010£m
2009£m
2010£m
2009£m
Opening balance 99 128 70 113 Additions 56 39 41 19 Amortisation and releases (18) (68) (12) (62)Closing balance 137 99 99 70
Sensitivity analysis of valuations using unobservable inputs
Fair value Favourable changes Unfavourable changes
The GroupProduct type
Total assets£m
Totalliabilities
£m
Profit andloss£m
Equity£m
Profit andloss£m
Equity£m
At 31st December 2010Commercial real estate loans 5,424 – 183 – (167) – Asset backed products 4,628 (1,912) 317 11 (289) (11)Other credit products 1,097 (1,318) 38 – (66) – Derivative exposure to Monoline insurers 1,449 – 78 – (230) – Non-asset backed debt instruments 2,956 (2,719) 56 – (55) – Equity products 1,478 (1,895) 156 8 (154) (8)Private equity 2,844 – 279 111 (280) (69)Funds and fund-linked products 1,084 – 275 – (275) – Foreign exchange products 506 (241) 51 – (52) – Interest rate products 2,407 (1,079) 38 – (52) – Commodity products 493 (629) 30 – (55) – Other 4,651 (199) 51 – (55) – Total 29,017 (9,992) 1,552 130 (1,730) (88)
At 31st December 2009 Commercial real estate loans 7,170 – 429 – (437) – Asset backed products 5,840 (2,334) 175 4 (175) (4)Other credit products 2,020 (2,827) 171 – (152) – Derivative exposure to Monoline insurers 2,027 – 336 – (532) – Non-asset backed debt instruments 3,127 (3,202) 145 2 (141) (2)Equity products 1,536 (1,922) 28 15 (28) (15)Private equity 1,978 – 267 73 (339) (95)Funds and fund-linked products 1,241 – 100 – (100) – Foreign exchange products 761 (379) 33 – (33) – Interest rate products 2,357 (1,775) 78 – (78) – Commodity products 748 (581) 36 – (36) – Other 1,451 – 52 – (52) – Total 30,256 (13,020) 1,850 94 (2,103) (116)
As part of risk management processes, an analysis is performed on products with significant unobservable parameters (Level 3) to generate a range of reasonably possible alternative valuations.
The effect of stressing unobservable inputs to a range of reasonably possible alternatives would be to increase fair values by up to £1.7bn (2009: £1.9bn) or to decrease fair values by up to £1.8bn (2009: £2.2bn) with substantially all the potential effect impacting profit and loss rather than equity.
The stresses applied take account of the nature of valuation techniques used, as well as the availability and reliability of observable proxy and historic data.
Sensitivity methodologies are based on a range, standard deviation or spread data of a reliable reference source or a scenario based on alternative market views. The level of shift or scenarios applied is considered for each product and varied according to the quality of the data and variability of underlying market. The approach adopted in determining these sensitivities has continued to evolve during the year, in the context of changing market conditions.
Commercial real estate loansUnobservable inputs, include but are not limited to, market quoted origination spreads, internal credit ratings and loan subordination. The sensitivity is determined by applying a +/- 3% shift for each underlying position based on the largest upward and downward price movement of observable published indices of a similar nature in the preceding 12-month period.
Barclays Bank PLC Annual Report 2010 www.barclays.com/annualreport10 157

Notes to the financial statementsFor the year ended 31st December 2010 continued
41 Fair value of financial instruments continuedAsset backed productsFor non-agency RMBS, non-investment grade MBS, mortgage related asset backed credit derivatives and other ABS, the price movements on appropriate indices are used. Sensitivity is based on the average of the largest upward and downward price movement in the preceding 12-month period.
Other credit productsThe sensitivity of valuations of the illiquid CDS portfolio is determined by applying a +/- 0.2% stress to the DV01 for each underlying reference asset. The stress is based upon the average bid offer spreads observed in the market for similar CDS.
Derivative exposure to Monoline insurersThe main unobservable input for these exposures is the credit quality of the relevant Monoline insurers. The approach to determine sensitivity is dependent on the credit quality of the Monoline insurer. Sensitivity is computed by shifting the internal credit rating of the Monoline insurer based on scenario analysis determined by evaluating estimated counterparty ratings in the event of a decline in the market environment.
Non-asset backed debt instrumentsThe sensitivity for convertible bonds, is determined by applying a +/- 1% shift to each underlying position. The shift is based upon the bid offer spreads observed in the market for similar bonds.
The sensitivity on corporate bonds portfolio is determined by applying a +/- 1% shift for each underlying position. The shift is based upon the bid offer spreads observed in the market for similar bonds.
The sensitivity for fixed and floating rate notes is calculated using a +/- 1% shift in credit spreads.
Equity productsThe sensitivity is estimated based on the dispersion of consensus data services either directly or through proxies.
Private equityThe relevant valuation models are sensitive to each of a number of key assumptions, such as projected future earnings, comparator multiples, marketability discounts and discount rates. Valuation sensitivity is estimated by flexing such assumptions to reasonable alternative levels and determining the impact on the resulting valuation.
Fund and fund-linked productsThe sensitivity is calculated on an individual fund basis using a loss based scenario approach which factors in the underlying assets of the specific fund and assumed recovery rates.
Foreign exchange productsThe sensitivity is based on the statistical spread of consensus data services, calculated using 2 standard deviations of the mid correlation dispersion.
Interest rate productsUncertainty relating to the valuation of the products is mainly driven from the range and the standard deviation of the consensus data used for price testing.
For base rate derivatives, the sensitivity is based on bid offer spreads of base rates swaps. The sensitivity was determined by applying a +/-0.12% shift on the net PV01.
Commodity productsSensitivity is determined primarily by measuring historical variability over two years. The estimate has been calculated using data for short dated parameter curves to generate best and worst case scenarios. Where historical data is unavailable or uncertainty is due to volumetric risk, sensitivity is measured by applying appropriate stress scenarios or using proxy bid-offer spread levels.
Other The sensitivity for fixed rate loans is calculated using a +/- 1% shift in credit spreads, except for certain loans within Barclays Corporate where the sensitivity is calculated using a shift in credit spreads of +/- 0.02% -0.11%.
No stress has been applied to the receivables relating to the Lehman acquisition. As outlined in Note 25, it is possible to identify a maximum loss. However, due to the uncertainty inherent in such legal proceedings, it is not possible to identify reasonable upside and downside stresses on a basis comparable with the other assets analysed.
Valuation control frameworkThe Independent Valuation Control function is responsible for independent price verification, oversight of fair value adjustments and escalation of valuation issues. This process covers all fair value positions and is a key control in ensuring the material accuracy of valuations.
Price verification uses independently sourced data that is deemed most representative of the market. The reliability of the data source is assessed in determining the independent valuation. The characteristics against which the data source is assessed are independence, reliability, consistency with other sources and evidence that the data represents an executable price. The most current data available at balance sheet date is used. Where significant variances are noted in the independent price verification process, an adjustment is taken to the fair value position. Additional fair value adjustments may be taken to reflect such factors as bid-offer spreads, market data uncertainty, model limitations and counterparty risk.
158 Barclays Bank PLC Annual Report 2010 www.barclays.com/annualreport10

41 Fair value of financial instruments continuedIndependent price verification results and fair value adjustments are reported on a monthly basis to the Valuation Committee. This committee is responsible for overseeing valuation and fair value adjustment policy within Barclays Capital and this is the forum to which valuation issues are escalated.
The Valuation Committee delegates more detailed review to the following five Sub-Committees: Independent Valuations, Primary Commercial Real Estate, Available for Sale and Other Assets, Models and Governance.
The Independent Valuations sub-committee reviews the results of the independent price verification and fair value adjustment process on a monthly basis. This includes, but is not limited to, reviewing fair value adjustments and methodologies, independent price verification results, limits and valuation uncertainty. The Primary Commercial Real Estate and Available for Sale and Other Assets sub-committees focus on independent price verification results specific to the asset classes. The Available for Sale and Other Assets sub-committee also assesses contingent risks and examines counterparty related issues.
The Models sub-committee is responsible for overseeing policies and controls related to the use of valuation models. This includes but is not limited to reviewing (i) global model risk reports and defining associated procedures and controls (ii) output from pipeline meetings and approximate booking meetings, and the trade approval process (iii) issues arising from model review (iv) population of valuation adjustments (v) defining policies and procedures relating to valuation models and (vi) instances of independent price verification variances or collateral disputes relating to model usage.
The Governance sub-committee is responsible for the governance of valuation processes, policies and procedures. This sub-committee oversees each sub-committee to ensure that the objectives set out in each committee’s terms of reference are being achieved. Regulatory and accounting issues related to fair value are also assessed by the Governance sub-committee.
42 Reclassification of financial assets held for tradingPrior to 2010, the Group reclassified certain financial assets, originally classified as held for trading that were deemed to be not held for trading purposes, and thus considered as loans and receivables.
There were no additional reclassifications of financial assets during 2010.
The carrying value of the securities previously reclassified into loans and receivables has decreased from £9,378m to £8,625m as a result of sales, paydowns and maturities of the underlying securities, offset by foreign exchange movements and increases due to reversal of the discount on reclassification.
Sales of securities from the 16th December 2008 reclassification totalled £390m (2009: £1,280m) and sales of securities from the 25th November 2009 reclassification totalled £178m (2009: £nil).
The following table provides a summary of the assets reclassified from held for trading to loans and receivables.
As at 31st December 2010 As at 31st December 2009
Carryingvalue
£m
Fairvalue
£m
Carryingvalue
£m
Fairvalue
£m
Trading assets reclassified to loans and receivablesReclassification 25th November 2009 8,081 7,842 8,099 7,994Reclassification 16th December 2008 544 545 1,279 1,335Total financial assets reclassified to loans and receivables 8,625 8,387 9,378 9,329
The reclassified financial assets contributed £359m (2009: £192m) to interest income. If the reclassifications had not been made, the Group’s income statement for 2010 would have additional losses on the reclassified trading assets of £189m (2009: loss of £49m).
Barclays Bank PLC Annual Report 2010 www.barclays.com/annualreport10 159

Notes to the financial statementsFor the year ended 31st December 2010 continued
43 Segmental reportingSince 1st January 2010, for management reporting purposes, we have reorganised our activities under the following business structure:
– UK Retail Banking is a leading UK high street bank providing current account and savings products and Woolwich branded mortgages. UK Retail Banking also provides unsecured loans, protection products and general insurance as well as banking and money transmission services to small and medium enterprises.
– Barclaycard is an international payments services provider for consumer and business customers including credit cards and consumer lending.
– Western Europe Retail Banking provides retail banking and credit card services in Spain, Italy, Portugal and France.
– Barclays Africa provides retail, corporate and credit card services across Africa and the Indian Ocean as well as tailored banking services (including mobile banking and Sharia-compliant products).
– Absa provides a full range of retail banking services and insurance products through a variety of distribution channels. It also offers customised business solutions for commercial and large corporate customers.
– Barclays Capital is the investment banking division of Barclays. It provides large corporate, government and institutional clients with a full spectrum of solutions to meet their strategic advisory, financing and risk management needs.
– Barclays Corporate provides intergrated banking solutions to large corporates, financial institutions and multinationals in the UK & Ireland, Continental Europe and New Markets.
– Barclays Wealth is the wealth management division of Barclays. It focuses on private and intermediary clients worldwide, providing international and private banking, investment management, fiduciary services and brokerage.
– Investment Management manages the Group’s 19.9% economic interest in BlackRock, Inc. and the residual elements relating to Barclays Global Investors, which was sold on 1st December 2009.
– Head Office Functions and Other Operations comprise head office and central support functions, businesses in transition and consolidation adjustments.
Comparatives have been restated to reflect this new Group structure, as detailed in our announcement on 22nd March 2010.
Products and services offered to customers are organised by business segment as described above.
This segmental presentation is consistent with the information provided to Barclays chief operating decision-maker to make decisions about allocating resources to, and assessing the performance of, operating segments and is measured in accordance with IFRSs. The financial information shown below includes the effects of intra-Barclays transactions between operating segments which are conducted on an arm’s length basis and eliminated in a separate row. Shared costs are included in operating segments on the basis of the actual recharges made.
160 Barclays Bank PLC Annual Report 2010 www.barclays.com/annualreport10

43 Segmental reporting continued
As at 31st December2010 UK
RetailBanking
£mBarclaycard
£m
WesternEurope
RetailBanking
£m
BarclaysAfrica
£mAbsa
£m
BarclaysCapital
£m
BarclaysCorporate
£m
BarclaysWealth
£m
InvestmentManage-
ment£m
Head OfficeFunctionsand Other
Operations£m
TotalContinuingOperations
£m
Interest income from external customers 2,949 2,653 591 534 1,554 684 1,749 668 (56) 1,192 12,518 Other income from external customers 1,617 1,337 573 265 1,366 12,414 1,276 947 134 (997) 18,932 Income from external customers, net of insurance claims 4,566 3,990 1,164 799 2,920 13,098 3,025 1,615 78 195 31,450 Inter-segment income (48) 34 – 2 (21) 502 (51) (55) – (363) – Total income net of insurance claims 4,518 4,024 1,164 801 2,899 13,600 2,974 1,560 78 (168) 31,450 Impairment charges and other credit provisions (819) (1,688) (314) (82) (480) (543) (1,696) (48) – (2) (5,672)Segment expenses – external (2,682) (1,609) (1,265) (718) (1,902) (8,330) (1,560) (1,160) – (741) (19,967)Inter-segment expenses (127) 39 232 110 92 35 (347) (189) (11) 166 – Total expenses (2,809) (1,570) (1,033) (608) (1,810) (8,295) (1,907) (1,349) (11) (575) (19,967)Share of post-tax results of associates and joint ventures (1) 25 15 – 3 18 (2) – – – 58 Profit on disposal of subsidiaries, associates and joint ventures – – – 77 4 – – – – – 81 Gain on acquisitions 100 – 29 – – – – – – – 129 Business segment profit before tax 989 791 (139) 188 616 4,780 (631) 163 67 (745) 6,079 Additional information Depreciation and amortisation 176 171 98 70 145 415 87 52 – 13 1,227 Impairment loss – intangible assets 7 5 1 – – 21 39 – – – 73 Impairment of goodwill – – – – – – 243 – – – 243 Investments in associates and joint ventures 3 58 88 1 56 199 (6) – – 119 518 Total assets 121,661 30,368 53,626 7,908 52,380 1,094,887 85,762 17,878 4,611 20,957 1,490,038 Total liabilities 118,799 5,960 31,078 7,551 29,938 1,032,758 79,558 48,743 263 72,749 1,427,397
Barclays Bank PLC Annual Report 2010 www.barclays.com/annualreport10 161

Notes to the financial statementsFor the year ended 31st December 2010 continued
43 Segmental reporting continued
As at 31st December 2009 UK
RetailBanking
£mBarclaycard
£m
WesternEurope
RetailBanking
£m
BarclaysAfrica
£mAbsa
£m
BarclaysCapital
£m
BarclaysCorporate
£m
BarclaysWealth
£m
InvestmentManage-
ment£m
Head OfficeFunctionsand Other
Operations£m
TotalContinuingOperations
£m
Interest income from external customers 2,623 2,573 800 523 1,385 1,002 1,891 470 (37) 439 11,669 Other income from external customers 1,638 1,455 518 216 1,170 10,097 1,219 955 76 81 17,425 Income from external customers, net of insurance claims 4,261 4,028 1,318 739 2,555 11,099 3,110 1,425 39 520 29,094 Inter-segment income 15 13 – – (2) 526 71 (103) 1 (521) – Total income net of insurance claims 4,276 4,041 1,318 739 2,553 11,625 3,181 1,322 40 (1) 29,094 Impairment charges and other credit provisions (1,031) (1,798) (338) (121) (567) (2,591) (1,558) (51) – (16) (8,071)Segment expenses – external (2,324) (1,522) (1,224) (775) (1,520) (6,559) (1,094) (1,016) 2 (680) (16,712)Inter-segment expenses (214) (5) 337 237 69 (33) (372) (113) (19) 113 – Total expenses (2,538) (1,527) (887) (538) (1,451) (6,592) (1,466) (1,129) (17) (567) (16,712)Share of post-tax results of associates and joint ventures 3 8 4 – (4) 22 – – – 1 34 Profit on disposal of subsidiaries, associates and joint ventures – 3 157 24 (3) – – 1 (1) 7 188 Gain on acquisitions – – 26 – – – – – – – 26 Business segment profit before tax 710 727 280 104 528 2,464 157 143 22 (576) 4,559 Additional information Depreciation and amortisation 157 143 95 71 122 452 90 51 – 25 1,206 Impairment loss – intangible assets 4 17 1 1 2 – 1 – – 1 27 Impairment of goodwill – – – – – – 1 – – – 1 Investments in associates and joint ventures 2 (5) 92 – 34 170 (5) – – 134 422 Total assets 109,443 30,340 51,042 7,908 45,787 1,019,259 88,856 14,940 5,404 6,169 1,379,148 Total liabilities 107,351 5,573 42,426 7,476 25,698 951,192 78,245 41,458 416 60,614 1,320,449
162 Barclays Bank PLC Annual Report 2010 www.barclays.com/annualreport10

43 Segmental reporting continuedGeographical information(i) A geographical analysis of revenues from external customers is presented below:
2010£m
2009£m
Continuing operationsUK and Ireland 12,817 12,917Europe region 4,735 4,359Americas 7,742 6,531Africa 4,697 4,016Asia 1,459 1,271Total 31,450 29,094
Individual countries which represent more than 5% of income from external customers are as follows:
2010£m
2009£m
UK 12,724 12,821 US 7,172 5,547 South Africa 3,684 2,980
In 2009, discontinued operations of the Barclays Global Investors business included £432m (2008: £319m) relating to UK and Ireland, £1,084m (2008: £1,181m) relating to Americas and £347m (2008: £416m) relating to Rest of the World.
44 Financial risks, liquidity and capital management The disclosures required under IFRS relating to financial risks and capital resources have been included within the Risk management and governance section on pages 11 to 65.
This move has been to improve transparency and ease of reference, by concentrating related information in one place, and to reduce duplication. The relevant disclosures have been marked as audited and can be found as follows:
– credit risk, on pages 21 to 46;
– market risk, on pages 47 to 52;
– liquidity risk pages 54 to 62; and
– capital resources, on page 53.
Barclays Bank PLC Annual Report 2010 www.barclays.com/annualreport10 163
Notes to the financial statementsFor the year ended 31st December 2010 continued
45 Critical accounting estimates The Group’s accounting policies are set out on pages 80 to 91. Certain of these policies, as well as estimates made by management, are considered to be important to an understanding of the Group’s financial condition since they require management to make difficult, complex or subjective judgements and estimates, some of which may relate to matters that are inherently uncertain. The following accounting policies include estimates which are particularly sensitive in terms of judgements and the extent to which estimates are used. Other accounting policies involve significant amounts of judgements and estimates, but the total amounts involved are not significant to the financial statements. Management has discussed the accounting policies and critical accounting estimates with the Board Audit Committee.
Fair value of financial instruments Some of the Group’s financial instruments are carried at fair value through profit or loss, such as those held for trading, designated by management under the fair value option and non-cash flow hedging derivatives.
Other non-derivative financial assets may be designated as available for sale. Available for sale financial investments are initially recognised at fair value and are subsequently held at fair value. Gains and losses arising from changes in fair value of such assets are included as a separate component of equity.
An analysis of financial instruments carried at fair value by valuation hierarchy, particulars of the valuation techniques used and a sensitivity analysis of valuations using unobservable inputs is included in Note 41. This note also includes a discussion of the more judgemental aspects of valuation in the period, including: credit valuation adjustments on monoline exposures, commercial real estate loans, private equity investments, and fair value loans to government and business and other services.
Approximately £2.6bn of the assets acquired as part of a 2008 aquisition of the North American business of Lehman Brothers had not been received by 31st December 2010. Approximately £2.0bn of this amount was recognised as part of the acquisition accounting and is included as an available for sale asset in the balance sheet. As discussed in Note 25, on 22nd February 2011 the court issued its Opinion in relation to the related legal proceedings. This Opinion holds that Barclays is not entitled to receive approximately £1.3bn, and is only conditionally entitled to receive approximately £0.5bn, of the undelivered assets. In addition, the Opinion holds that Barclays is not entitled to approximately £1.3bn of assets it has already received.
The anticipated final Order, referred to in Note 25, should clarify the precise impact of the decision set forth in the Opinion, and may be the subject of further proceedings or appeal by one or more of the parties concerned. Barclays has considered the Opinion, the decisions contained therein and its possible actions with respect thereto. As a result, there is significant judgement involved in the valuation of this asset. There is uncertainty relating to the interpretation of the Opinion and also the potential for further proceedings or appeals by the parties involved. The Group takes the view that the effective allowance of £0.6bn that is reflected in its estimate of fair value is appropriate. If the Opinion were to be unaffected by future proceedings and appeals, Barclays estimates that its maximum possible loss, based on its worst case reading of the Opinion, would be approximately £2.6bn, after taking into account the £0.6bn effective provision. The appropriate valuation of this asset will be kept under review as legal proceedings progress.
Allowances for impairment Allowances for loan impairment represent management’s estimate of the losses incurred in the loan portfolios as at the balance sheet date. Changes to the allowances for loan impairment and changes to the provisions for undrawn contractually committed facilities and guarantees provided are reported in the consolidated income statement as part of the impairment charge. Provision is made for undrawn loan commitments and similar facilities if it is probable that the facility will be drawn and result in recognition of an asset at an amount less than the amount advanced.
Within the retail and small businesses portfolios, which comprise large numbers of small homogeneous assets with similar risk characteristics where credit scoring techniques are generally used, statistical techniques are used to calculate impairment allowances on a portfolio basis, based on historical recovery rates and assumed emergence periods. These statistical analyses use as primary inputs the extent to which accounts in the portfolio are in arrears and historical information on the eventual losses encountered from such delinquent portfolios. There are many such models in use, each tailored to a product, line of business or customer category. Judgement and knowledge is needed in selecting the statistical methods to use when the models are developed or revised. The impairment allowance reflected in the financial statements for these portfolios is therefore considered to be reasonable and supportable. The impairment charge reflected in the income statement for these retail portfolios is £3,296m (2009: £3,919m) and amounts to 59% (2009: 53%) of the total impairment charge on loans and advances in 2010.
For individually significant assets, impairment allowances are calculated on an individual basis and all relevant considerations that have a bearing on the expected future cash flows are taken into account, for example, the business prospects for the customer, the realisable value of collateral, the Group’s position relative to other claimants, the reliability of customer information and the likely cost and duration of the work-out process. The level of the impairment allowance is the difference between the value of the discounted expected future cash flows (discounted at the loan’s original effective interest rate), and its carrying amount. Subjective judgements are made in the calculation of future cash flows. Furthermore, judgements change with time as new information becomes available or as work-out strategies evolve, resulting in frequent revisions to the impairment allowance as individual decisions are taken. Changes in these estimates would result in a change in the allowances and have a direct impact on the impairment charge. The impairment charge reflected in the financial statements in relation to whole sale portfolios is £2,329m (2009: £3,439m) and amounts to 41% (2009: 47%) of the total impairment charge on loans and advances. Further information on impairment allowances and related credit information is set out within the credit risk management section on page 38.
The fair value of the Group’s 19.9% holding in BlackRock Inc. was £4.6bn as at 31 December 2010, as compared to £5.4bn as at 31 December 2009 and £5.1bn at original acquisition date (1 December 2009). For an available-for-sale equity instrument, impairment should be recognised if any decline in fair value is significant or prolonged. The observed decline is not considered either significant or prolonged, in light of an increase in share price through the second half of the year and ongoing price volatility.
The Group’s loan to Protium Finance LP, as detailed on pages 43 to 45, is collateralised by underlying financial assets of the borrower. The cash flow expected to be generated by Protium’s assets over their contractual term would be sufficient to enable loan repayment. However, following a reassessment of the period over which the loan is expected to be realised, it is considered appropriate to record an impairment calculated by reference to the fair value of these assets. This has resulted in the recognition of an impairment charge of £532m as at 31 December 2010.
164 Barclays Bank PLC Annual Report 2010 www.barclays.com/annualreport10

45 Critical accounting estimates continuedGoodwill Management have to consider at least annually whether the current carrying value of goodwill is impaired. The first step of the process requires the identification of independent cash generating units and the allocation of goodwill to these units. This allocation is based on the areas of the business expected to benefit from the synergies derived from the acquisition. The allocation is reviewed following business reorganisation. The carrying value of the unit, including the allocated goodwill, is compared to its fair value to determine whether any impairment exists. If the fair value of a unit is less than its carrying value, goodwill will be impaired. Detailed calculations may need to be carried out taking into consideration changes in the market in which a business operates (e.g. competitive activity, regulatory change). In the absence of readily available market price data this calculation is based upon discounting expected pre-tax cash flows at a risk adjusted interest rate appropriate to the operating unit, the determination of both of which requires the exercise of judgement. The estimation of pre-tax cash flows is sensitive to the periods for which detailed forecasts are available and to assumptions regarding the long-term sustainable cash flows. While forecasts are compared with actual performance and external economic data, expected cash flows naturally reflect management’s view of future performance. The most significant amounts of goodwill relate to UK Retail Banking and Absa, where goodwill impairment testing performed in 2010 indicated that this goodwill was not impaired. An analysis of goodwill by cluster, together with key assumptions underlying the impairment testing, is included in Note 18 on page 108.
Intangible assetsIntangible assets that derive their value from contractual customer relationships or that can be separated and sold and have a finite useful life are amortised over their estimated useful life. Determining the estimated useful life of these finite life intangible assets requires an analysis of circumstances, and judgement by the Group’s management. At each balance sheet date, or more frequently when events or changes in circumstances dictate, intangible assets are assessed for indications of impairment. If indications are present, these assets are subject to an impairment review. The impairment review comprises a comparison of the carrying amount of the asset with its recoverable amount: the higher of the asset’s or the cash-generating unit’s net selling price and its value in use. Net selling price is calculated by reference to the amount at which the asset could be disposed of in a binding sale agreement in an arm’s length transaction evidenced by an active market or recent transactions for similar assets. Value in use is calculated by discounting the expected future cash flows obtainable as a result of the asset’s continued use, including those resulting from its ultimate disposal, at a market-based discount rate on a pre-tax basis. The most significant amounts of intangible assets relate to Absa and Lehman Brothers North American businesses.
Retirement benefit obligations The Group provides pension plans for employees in most parts of the world. Arrangements for staff retirement benefits vary from country to country and are made in accordance with local regulations and customs. For defined contribution schemes, the pension cost recognised in the income statement represents the contributions payable to the scheme. For defined benefit schemes, actuarial valuation of each of the scheme’s obligations using the projected unit credit method and the fair valuation of each of the scheme’s assets are performed annually in accordance with the requirements of IAS 19.
The actuarial valuation is dependent upon a series of assumptions, the key ones being interest rates, mortality, investment returns and inflation. Mortality estimates are based on standard industry and national mortality tables, adjusted where appropriate to reflect the Group’s own experience. The returns on fixed interest investments are set to market yields at the valuation date (less an allowance for risk) to ensure consistency with the asset valuation. The returns on UK and overseas equities are based on the long-term outlook for global equities at the calculation date having regard to current market yields and dividend growth expectations. The inflation assumption reflects long-term expectation of retail price inflation.
The Group’s IAS 19 pension deficit across all schemes as at 31st December 2010 was £2,896m (2009: £3,946m). There are net recognised liabilities of £239m (2009: £698m) and unrecognised actuarial losses of £2,657m (2009: £3,248m). The net recognised liabilities comprised retirement benefit liabilities of £365m (2009: £769m) and assets of £126m (2009: £71m).
The Group’s IAS 19 pension deficit in respect of the main UK scheme as at 31st December 2010 was £2,552m (2009: £3,534m). The reduction in the deficit resulted principally from better than expected asset performance, contributions paid in excess of the pension expense and a credit to past service costs following amendments to the treatment of minimum defined benefits.
Further information on retirement benefit obligations, including the sensitivity of principal assumptions, is included in Note 27 on pages 118 to 125.
Derecognition of financial assetsThe Group derecognises a financial asset, or a portion of a financial asset, where the contractual rights to that asset have expired. Derecognition is also appropriate where the rights to further cash flows from the asset have been transferred to a third party and, with them, either:
(i) substantially all the risks and rewards of the asset; or
(ii) significant risks and rewards, along with the unconditional ability to sell or pledge the asset.
Where significant risks and rewards have been transferred, but the transferee does not have the unconditional ability to sell or pledge the asset, the Group continues to account for the asset to the extent of its continuing involvement (‘continuing involvement accounting’).
To assess the extent to which risks and rewards have been transferred, it is often necessary to perform a quantitative analysis. Such an analysis will compare the Group’s exposure to variability in asset cash flows before the transfer with its retained exposure after the transfer.
A cash flow analysis of this nature typically involves significant judgement. In particular, it is necessary to estimate the asset’s expected future cash flows as well as potential variability around this expectation. The method of estimating expected future cash flows depends on the nature of the asset, with market and market-implied data used to the greatest extent possible. The potential variability around this expectation is typically determined by stressing underlying parameters to create reasonable alternative upside and downside scenarios. Probabilities are then assigned to each scenario. Stressed parameters may include default rates, loss severity or prepayment rates.
Where neither derecognition nor continuing involvement accounting is appropriate, the Group continues to recognise the asset in its entirety and recognises any consideration received as a financial liability.
Barclays Bank PLC Annual Report 2010 www.barclays.com/annualreport10 165

Notes to the financial statementsFor the year ended 31st December 2010 continued
45 Critical accounting estimates continuedIncome taxes The Group is subject to income taxes in numerous jurisdictions and the calculation of the Group’s tax charge and worldwide provisions for income taxes necessarily involves a degree of estimation and judgement. There are many transactions and calculations for which the ultimate tax treatment is uncertain and cannot be determined until resolution has been reached with the relevant tax authority. The Group recognises liabilities for anticipated tax audit issues based on estimates of whether additional taxes will be due after taking into account external advice where appropriate. Where the final tax outcome of these matters is different from the amounts that were initially recorded, such differences will impact the current and deferred income tax assets and liabilities in the period in which such determination is made. These risks are managed in accordance with the Group’s Tax Principal Risk Framework.
46 Events after the balance sheet dateOn 22 February 2011, the US Bankruptcy Court for the Southern District of New York issued its opinion in relation to Lehman Brothers Holdings Inc.. Further information is provided on page 117.
On 1 March 2011, Barclays agreed to acquire Egg’s UK credit card assets. Under the terms of the transaction, Barclays will purchase Egg’s UK credit card accounts, consisting of approximately 1.15 million credit card accounts with approximately £2.3bn of gross receivables. Completion is subject to competition clearance, and is expected to occur during the first half of 2011.
166 Barclays Bank PLC Annual Report 2010 www.barclays.com/annualreport10