delivering sustainable solutions in a more competitive world cecil county comprehensive plan...
TRANSCRIPT

Delivering sustainable solutions in a more competitive world www.erm.com
Cecil County Comprehensive
Plan Oversight Committee Meeting
October 15, 2008
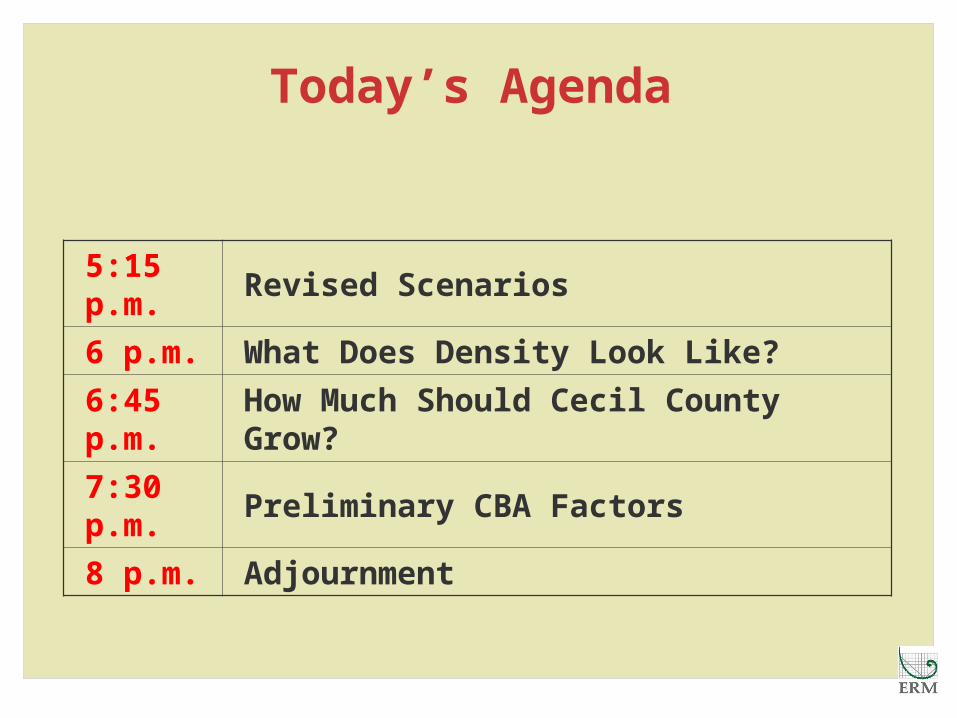
Today’s Agenda
5:15 p.m.
Revised Scenarios
6 p.m. What Does Density Look Like?
6:45 p.m.
How Much Should Cecil County Grow?
7:30 p.m.
Preliminary CBA Factors
8 p.m. Adjournment
Proposed Scenarios

Input from the Oversight Committee
• Let’s see the numbers!– Is this a “build out” plan or a “management” plan for
2030?
– How much should Cecil County grow in the future?
– What densities do we need to support future growth?
– What do these densities look like?
– Do the towns support the framework of the scenarios?
» If so, how do we implement?
• Let’s see the details!– How do we translate these general ideas to specific
areas?
– What about the towns? (COG meeting in September)
Revising the Scenarios
• Some concern that there was not enough difference between the scenarios, and that elements of the Growth Centers scenario were unrealistic (urban open space)
• Changed the Growth Corridor and Greenbelts scenarios to reflect input from the Oversight Committee
• Added Protected Lands

Changes to Greenbelt Scenario
The Resource Lands in the Greenbelt Scenario are larger than anything we've previously shown. These expanded Resource Lands are drawn in a way that is intended to cover contiguous natural resources such as agriculture, forest, and environmentally sensitive areas, using the following information:
• Productive agricultural soils, as shown in the County's soil layer, cross-referenced with information provided by the APM subcommittee
• Sensitive areas, as described above, plus Forest Interior Dwelling Species and Sensitive Species Review Areas
• Developed or committed lands (including "pipeline" development, as well as some land zoned for development) was used to exclude areas from the Resource Lands category
• 12-digit watersheds, used as boundaries in some cases
• Roads, -used as boundaries in some cases

Land Use Categories
• Development: Areas that would be developed on land served by public water and sewer.
• Rural (olive green): New development would be permitted, at relatively low densities, with NO extension of public water and sewer (except for health emergencies). No change from before.
• Resource Land: Zoning would permit only very low density development (likely at 1/20 or less). The eventual PPA(s) would be drawn within these areas, although every piece of Resource Land would not necessarily fall within a PPA.
• Protected Land: Land that is already protected from development by virtue of having sensitive areas (floodplain/wetland), public or private ownership, or easement. This includes federal, state, and county owned land; MALPF, MET, ESLC, and other easements, etc.
• Employment Centers
• Mixed Development: Areas that would be developed as mixed-use centers of residential, commercial, employment, and institutional uses. The specific mix of use types has not been defined.
• Towns
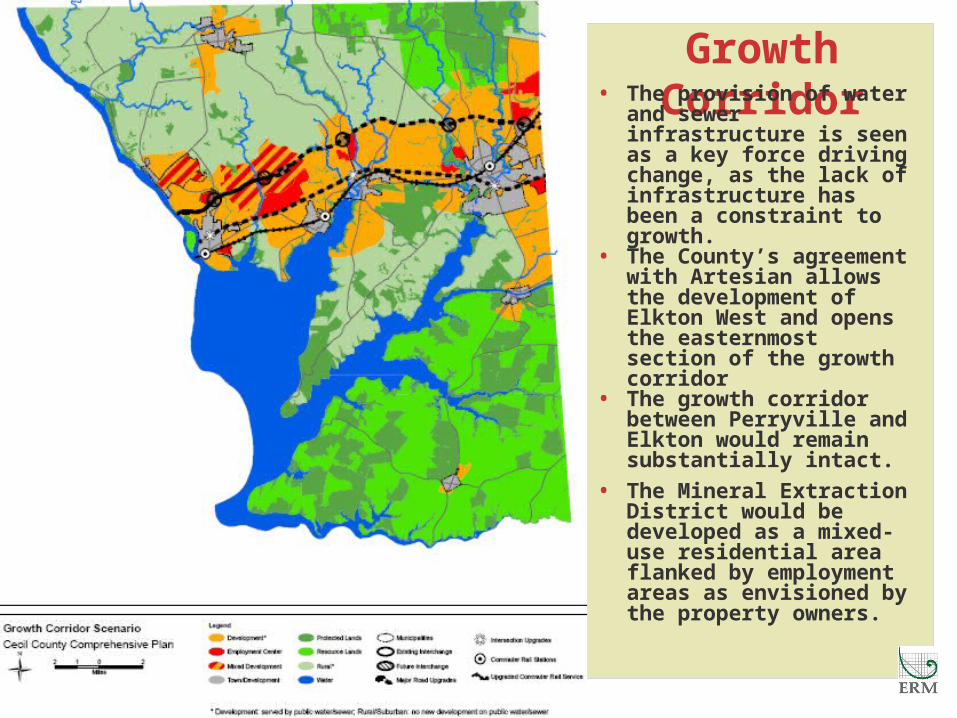
Growth Corridor• The provision of water
and sewer infrastructure is seen as a key force driving change, as the lack of infrastructure has been a constraint to growth.
• The County’s agreement with Artesian allows the development of Elkton West and opens the easternmost section of the growth corridor
• The growth corridor between Perryville and Elkton would remain substantially intact.
• The Mineral Extraction District would be developed as a mixed-use residential area flanked by employment areas as envisioned by the property owners.
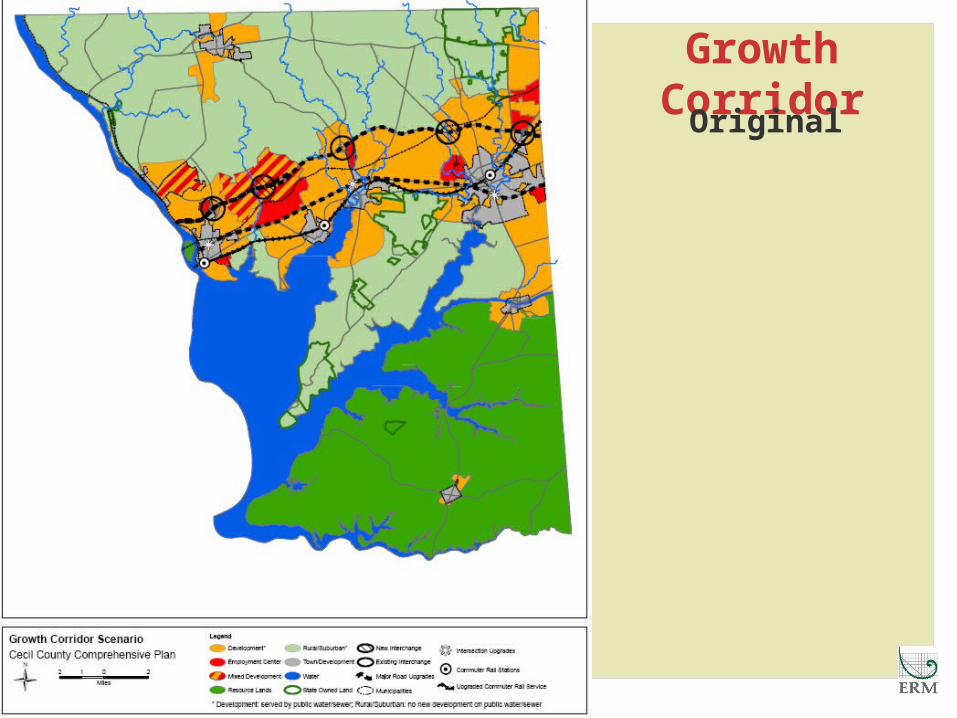
Growth CorridorOriginal
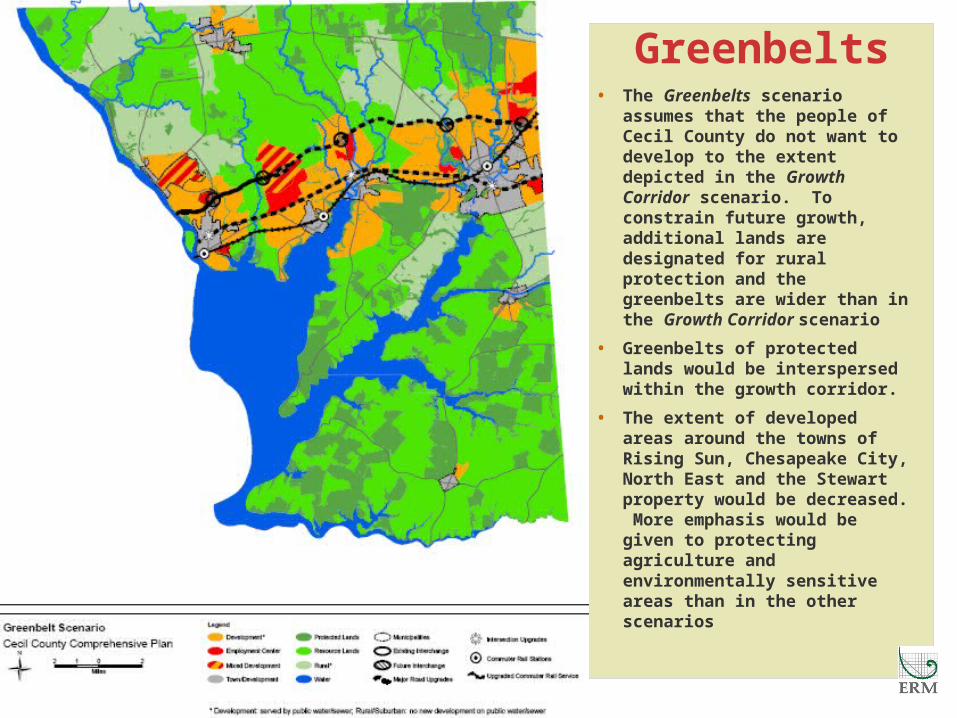
Greenbelts• The Greenbelts scenario
assumes that the people of Cecil County do not want to develop to the extent depicted in the Growth Corridor scenario. To constrain future growth, additional lands are designated for rural protection and the greenbelts are wider than in the Growth Corridor scenario
• Greenbelts of protected lands would be interspersed within the growth corridor.
• The extent of developed areas around the towns of Rising Sun, Chesapeake City, North East and the Stewart property would be decreased. More emphasis would be given to protecting agriculture and environmentally sensitive areas than in the other scenarios

Greenbelts
Original

Capacity AnalysisZoningDistrict
Current New Household Capacity
BG 0
BI 0
BL 0
DR 14,919
M1 0
M2 0
MB 0
MEA 0
MH 3,664
NAR 3,985
OS 0
RM 12,742
RR 2,298
SAR 1,645
SR 18,695
TR 3,840
VR 496
Municipalities 5,228
Total 67,512
• Our planning assumption: Let’s start with the County’s capacity
• Based on current zoning, Cecil County has capacity for 67,512 additional housing units.
• Of this, 35,600 new housing units could be accommodated within the County’s Priority Funding Areas
• This is more than the 26,000 housing units identified in the 2030 projections.

Modeling the Scenarios
• Build-out versus 2030:– We are developing “build-out” scenarios so we
can evaluate plausible futures for the County that assume a different land use pattern than we have today, and to consider areas like the Mineral Extraction Districts (which have no capacity assigned to them)
• Key question: What should the buildout number be?
• Our planning recommendation: Use Buildout plus an increment for the Mineral Extraction District

Housing Units for Model Runs
Existing Housing Units
(2005, including vacancy rate)
38,351
Capacity Analysis
(from MDP build-out)67,512
Mineral Extraction District
(Stewart property)5,000
Growth Increment
(for Model Runs)72,512
TOTAL110,863
CORRIDOR61,887

Projected/Potential Growth
Projected/Potential Growth
31,223
39,88236,500
61,16450,914
110,863
0
20,000
40,000
60,000
80,000
100,000
120,000
140,000
2000 2010 2020 2030 2040 2050 2060 2070 2080
Year
Ho
usi
ng
Un
its MDP Projections
2000 US Census
Buildout (including MEA)
Existing

What Does DensityLook Like?
Scenario Land UseResidential Zoning
District AcresExisting Density
(units/acre)
Resource Lands
MH, RM 1,347 2.00
VR, DR, TR 878 1.00
All others 86,690
Rural
NAR 49,061 0.10
RR 11,095 0.20
SR, MH 5,018 2.00
DR, TR 232 1.00
VR 155 3.00
RM 17 2.00
Development
RR 1,097 0.20
SR 13,702 2.00
MH, VR 1,259 3.00
NAR 3,421 0.10
MEA 396
DR, TR 7,814 3.75
RM 1,284 10.50
Urban Open Space All districts n/a n/a
Employment/ Development
All districts 9,626
Town Development All Towns 8,4253.5 (unless
specified by town) G
row
th C
orr
idor
Scen
ari
o

Scenario Land UseResidential Zoning District Acres
Existing Density (units/acre)
Resource Lands
MH, RM 1,611 2.00
VR, DR, TR 1,551 1.00
All others 134,377
Rural
NAR 15,044 0.10
OS 37 0.00
RR 5,208 0.20
SR, MH, RM 6,336 2.00
DR 232 1.00
Development
RR 578 0.20
SR 11,107 2.00
MH, VR 1,217 3.00
NAR 605 0.10
MEA 136
DR, TR 7,296 3.75
RM 1,283 10.50
Urban Open Space
All districts n/a n/a
Employment/ Development
All districts 6,784
Town Development
All Towns 9,9183.5 (unless specified
by town)
Gre
en
belt
s S
cen
ari
o

What Does Density Look Like in Cecil
County?

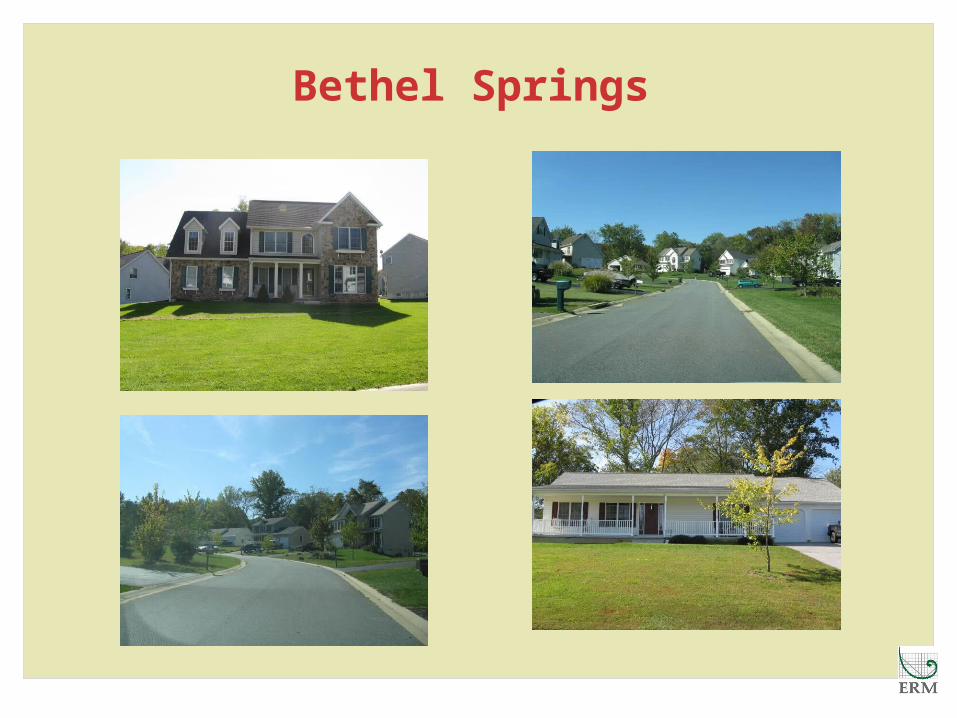
Bethel Springs
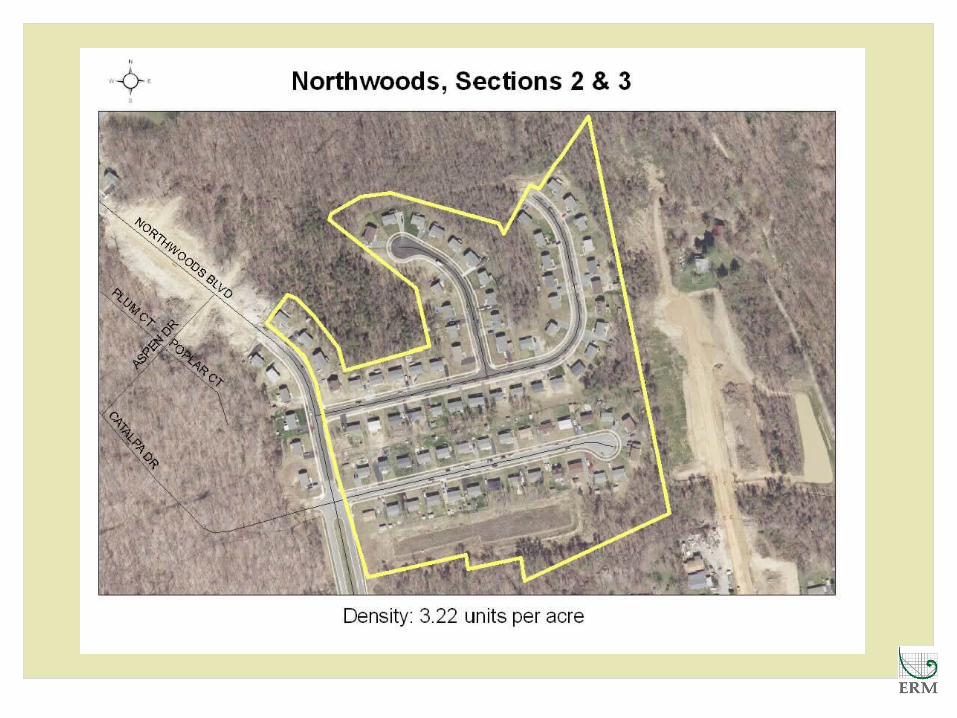

Northwoods

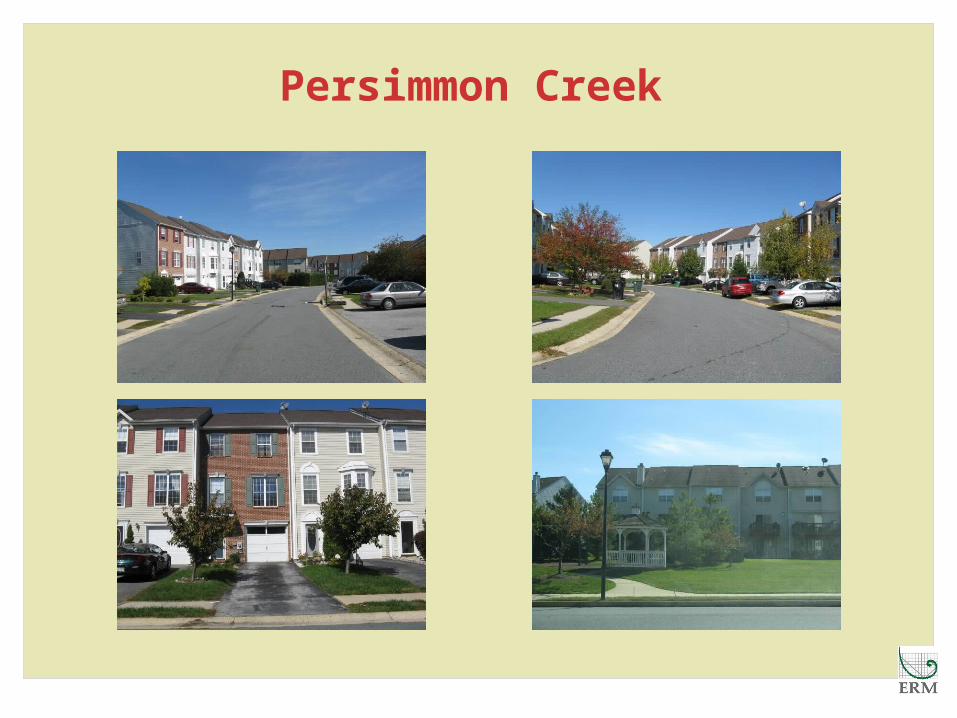
Persimmon Creek
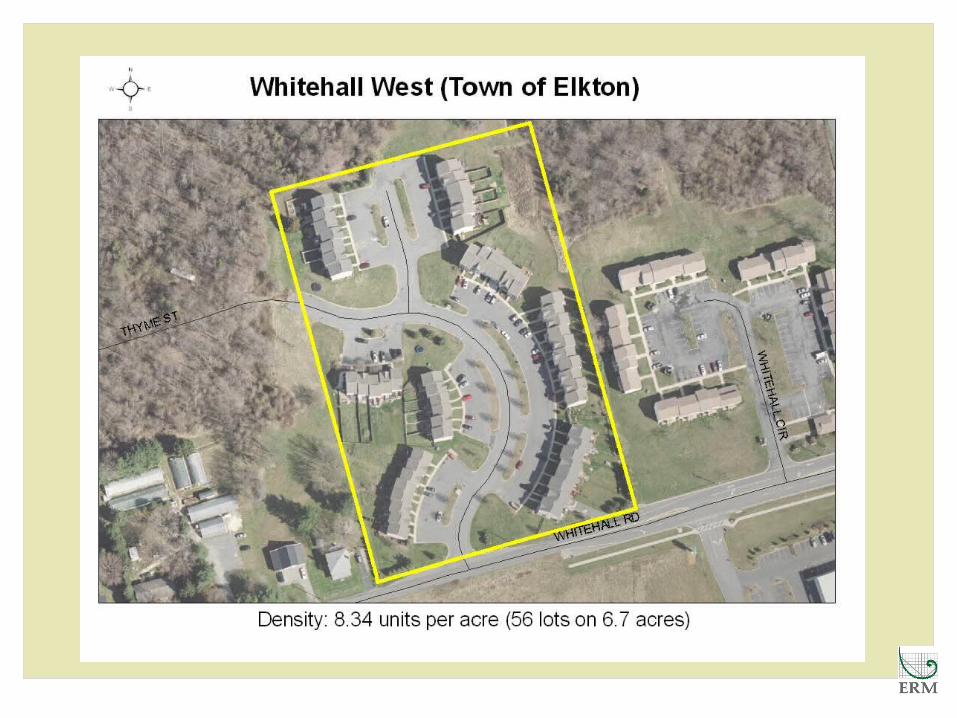
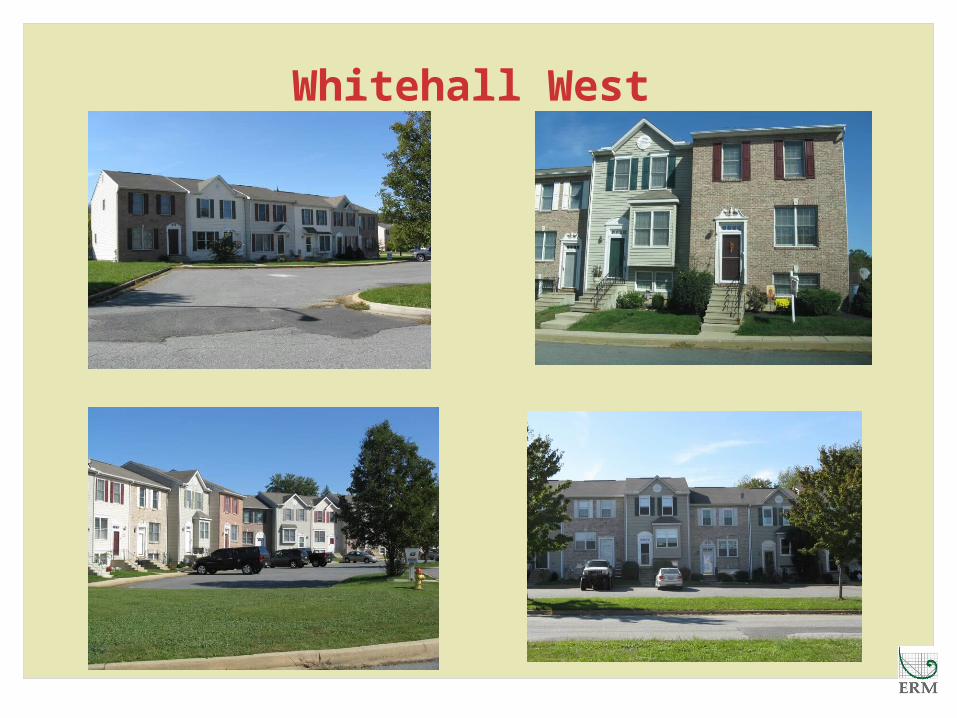
Whitehall West

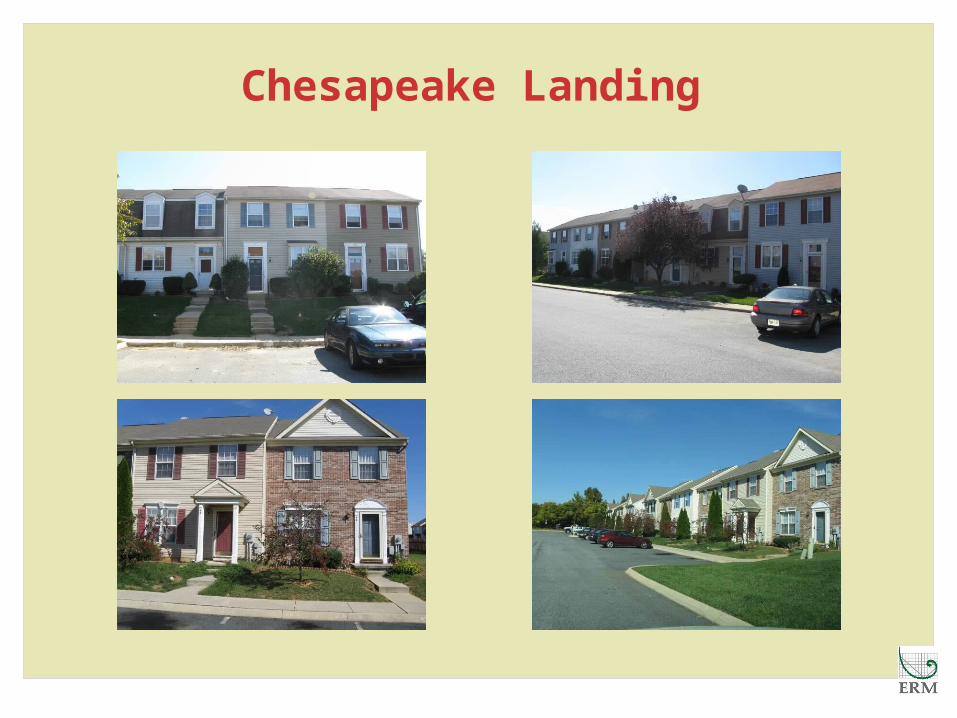
Chesapeake Landing
How Much Should the County Grow?

Housing Densities in Comparable Corridors
2000 Data
CountySize (mi²)
Size (acres)
Population
Pop/mi²
Housing Units HU/mi² HU/ acre
Cecil 83 53,410 40,231 482 15,622 187 0.29
Harford A 19 12,160 49,584 2,610 19,261 1,014 1.58
Harford B 64 40,960 59,703 933 24,814 388 0.61
Howard 49 31,360 77,413 1,580 28,921 590 0.92
Newcastle A 34 21,760 66,544 1,957 26,043 766 1.20
Newcastle B 47 30,080 109,612 2,332 41,978 893 1.40
Average 49 31,622 67,181 1,649 26,106 640 1.00

Housing Units per Square Mile, 2000
0
200
400
600
800
1,000
1,200
Cecil Harford A Harford B Howard NewcastleA
NewcastleB
Hou
sing
Uni
ts

Cecil County Buildout and Projections
Year Population Pop/mi² Housing Units HU/ mi²HU/ acre
2030 77,956 934 33,065 396 0.62
Buildout* 61,887 742 1.16
*Adding In the Mineral Extraction District
2005 Housing Units 17,922
New Housing Capacity in Growth Area 38,965
NHC on Stewart Property 5,000
TOTAL 61,887

Comparable Corridors

Cecil Growth Corridor

Harford Corridor A
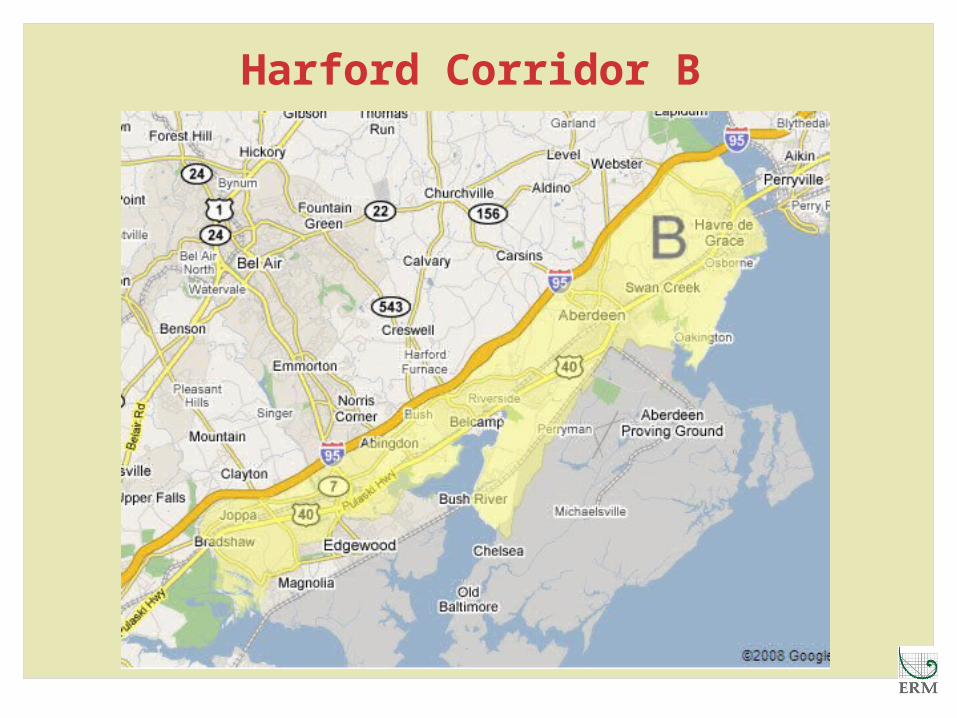
Harford Corridor B

Howard Corridor
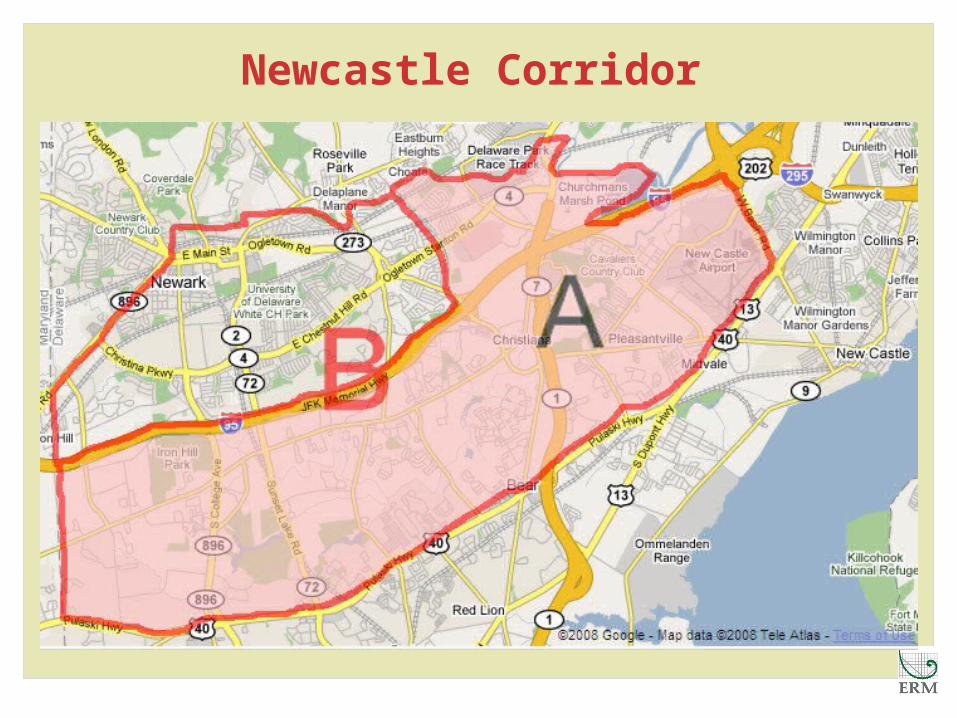
Newcastle Corridor
Preliminary CBA Factors

Choosing By Advantages
The Fundamental Rule of Sound Decision-making:
Decisions must be based on the importance of advantages.
Choosing a Preferred Scenario

To illustrate the logic and simplicity of the CBA vocabulary, following are the CBA definitions of the
terms attribute and advantage:
• An attribute is a characteristic, quality, or consequence of ONE alternative.
• An advantage is a beneficial difference between the attributes of TWO alternatives.
Choosing by Advantages
For this project, the scenarios are our alternatives.

Purpose of the CBA Group
• To give the Oversight Committee a role in determining the factors
• To learn and understand the CBA process
• To help the other members of the Oversight Committee understand and participate fully in the CBA workshop
• To review and refine the factors that we will use to evaluate the scenarios
• To identify the advantages of each attribute
• To generate a draft CBA matrix we will use in November
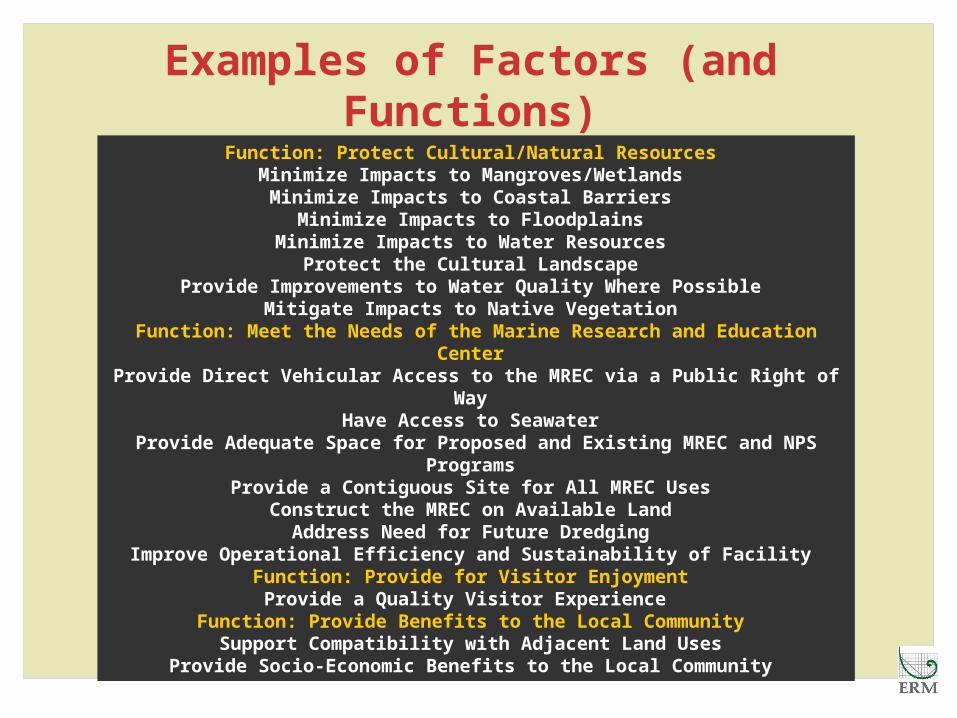
Function: Protect Cultural/Natural Resources Minimize Impacts to Mangroves/Wetlands
Minimize Impacts to Coastal Barriers Minimize Impacts to Floodplains
Minimize Impacts to Water Resources Protect the Cultural Landscape
Provide Improvements to Water Quality Where Possible Mitigate Impacts to Native Vegetation
Function: Meet the Needs of the Marine Research and Education Center Provide Direct Vehicular Access to the MREC via a Public Right of Way
Have Access to Seawater Provide Adequate Space for Proposed and Existing MREC and NPS Programs
Provide a Contiguous Site for All MREC Uses Construct the MREC on Available Land
Address Need for Future Dredging Improve Operational Efficiency and Sustainability of Facility
Function: Provide for Visitor Enjoyment Provide a Quality Visitor Experience
Function: Provide Benefits to the Local Community Support Compatibility with Adjacent Land Uses
Provide Socio-Economic Benefits to the Local Community
Examples of Factors (and Functions)

FactorsAlternatives
East Site South Site West Site
Function: Protect Cultural/Natural Resources
Minimize Impacts to Coastal Barriers
Attributes
Advantages
Minimize Impacts to Floodplains
Attributes
Advantages
Minimize Impacts to Water Resources
Attributes
Advantages
Protect the Cultural Landscape
Attributes
Advantages
Sample CBA Matrix
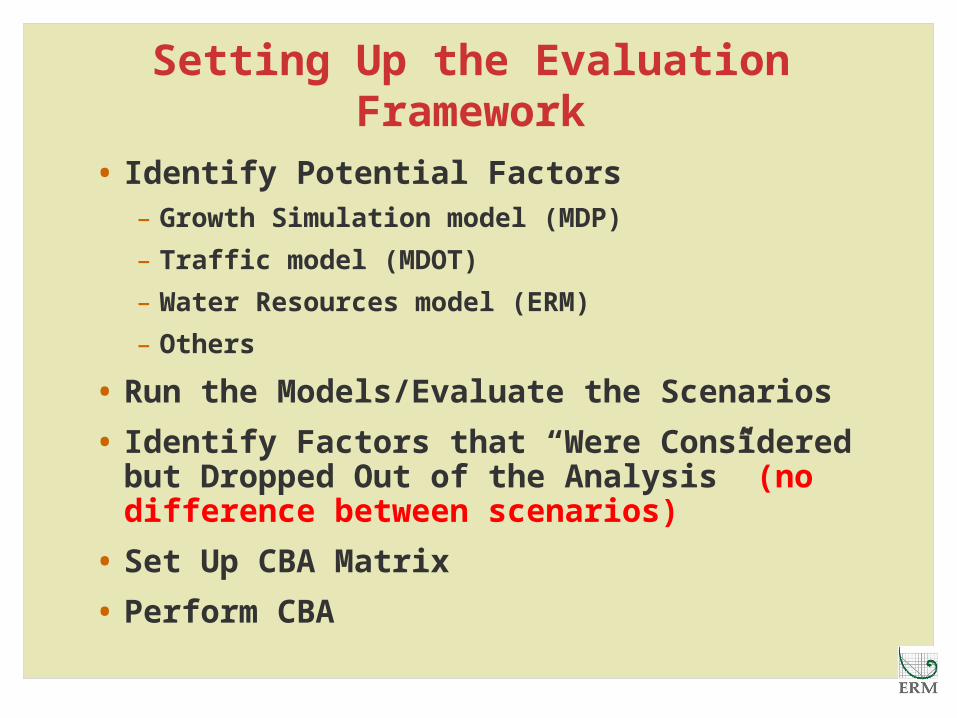
Setting Up the Evaluation Framework
• Identify Potential Factors– Growth Simulation model (MDP)
– Traffic model (MDOT)
– Water Resources model (ERM)
– Others
• Run the Models/Evaluate the Scenarios
• Identify Factors that “Were Considered but Dropped Out of the Analysis” (no difference between scenarios)
• Set Up CBA Matrix
• Perform CBA

Start with Model Outputs
• Total Developed Acres
• New Developed Acres
• Development Capacity PDA
• Agricultural and Forest Land Lost
• Number of Residential Parcels Developed
– Percentage within PFA
• Number of Acres Developed Inside PFA
• Number of Acres Developed Outside PFA
• Percent of County Preserved
• Number of Acres Preserved
• Level of Protection in Agricultural Zoning
• Total Lane Miles (principal arterials)
• Vehicle Miles Traveled (VMT)
• Vehicle Hours Traveled (allows us to calculate the percentage of time motorists will drive in congestion)
• Average Free Flow Speed
• Average Congested Speed
• Impervious surface, by watershed
• Public drinking water system demand, by system
• Point source (WWTP) wastewater discharge, by watershed
• Number of septic systems, by watershed

How Do We Organize the Factors?
The Fundamental Rule of Sound Decision-making:
Decisions must be based on the importance of advantages.
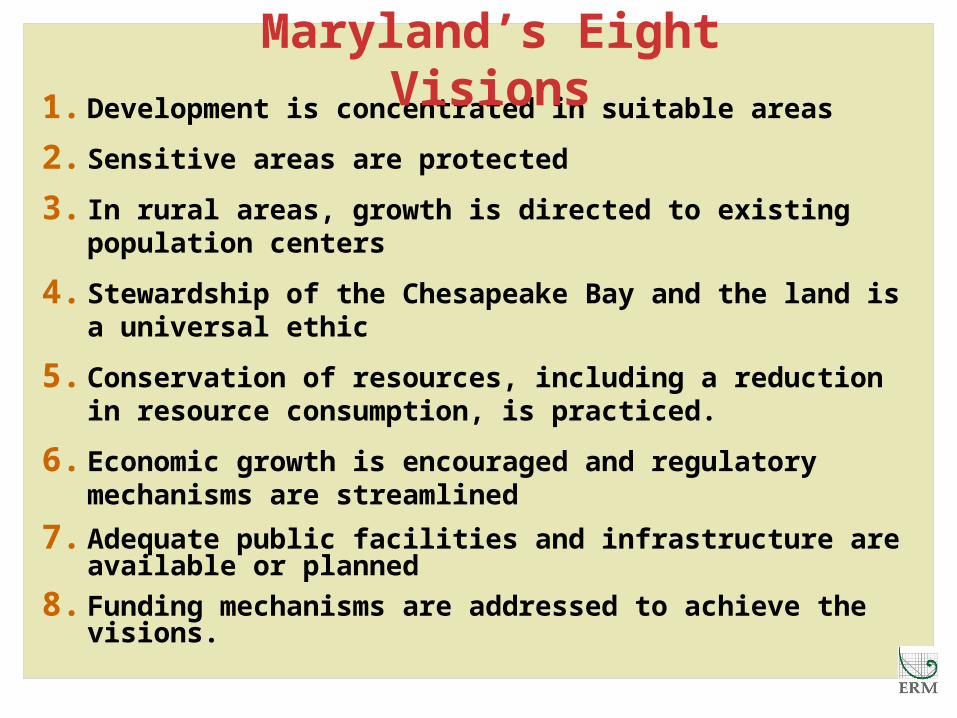
1. Development is concentrated in suitable areas
2. Sensitive areas are protected
3. In rural areas, growth is directed to existing population centers
4. Stewardship of the Chesapeake Bay and the land is a universal ethic
5. Conservation of resources, including a reduction in resource consumption, is practiced.
6. Economic growth is encouraged and regulatory mechanisms are streamlined
7. Adequate public facilities and infrastructure are available or planned
8. Funding mechanisms are addressed to achieve the visions.
Maryland’s Eight Visions
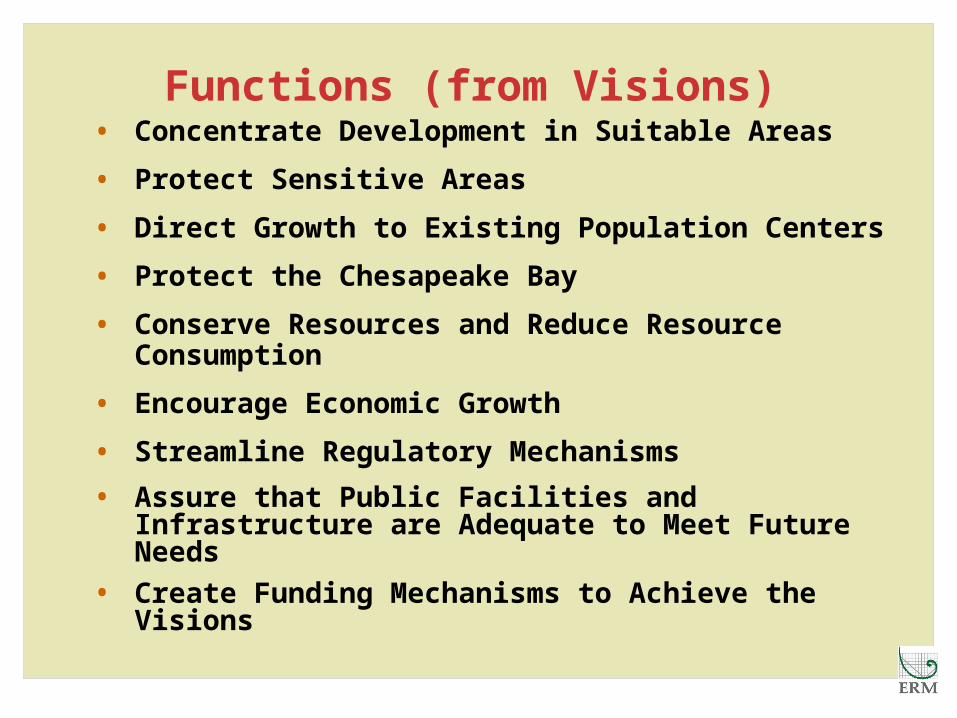
Functions (from Visions)• Concentrate Development in Suitable Areas
• Protect Sensitive Areas
• Direct Growth to Existing Population Centers
• Protect the Chesapeake Bay
• Conserve Resources and Reduce Resource Consumption
• Encourage Economic Growth
• Streamline Regulatory Mechanisms
• Assure that Public Facilities and Infrastructure are Adequate to Meet Future Needs
• Create Funding Mechanisms to Achieve the Visions
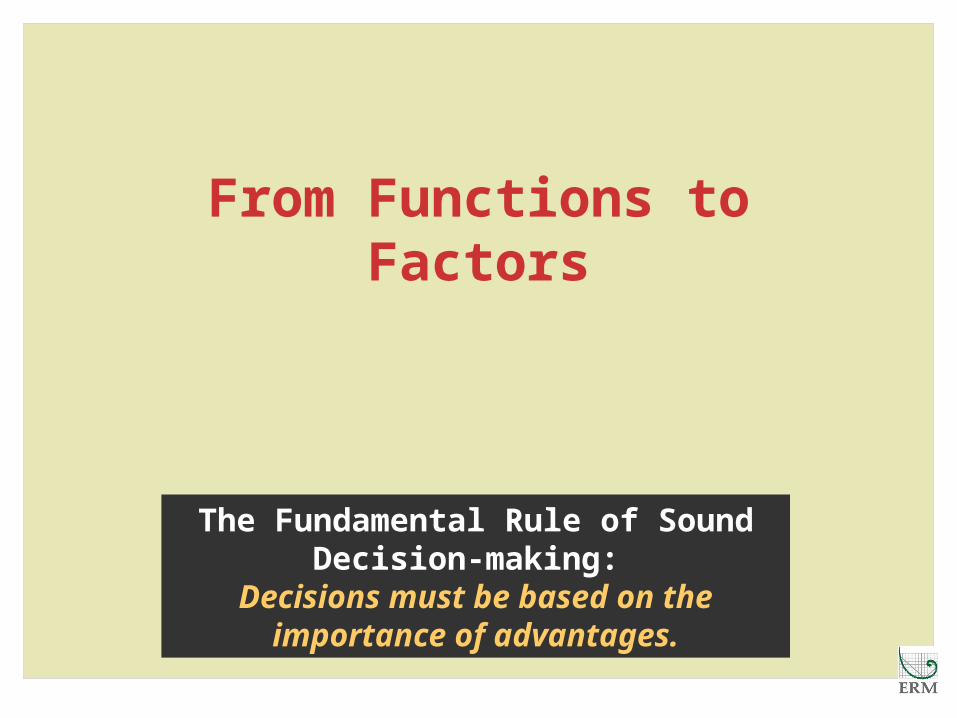
From Functions to Factors
The Fundamental Rule of Sound Decision-making:
Decisions must be based on the importance of advantages.
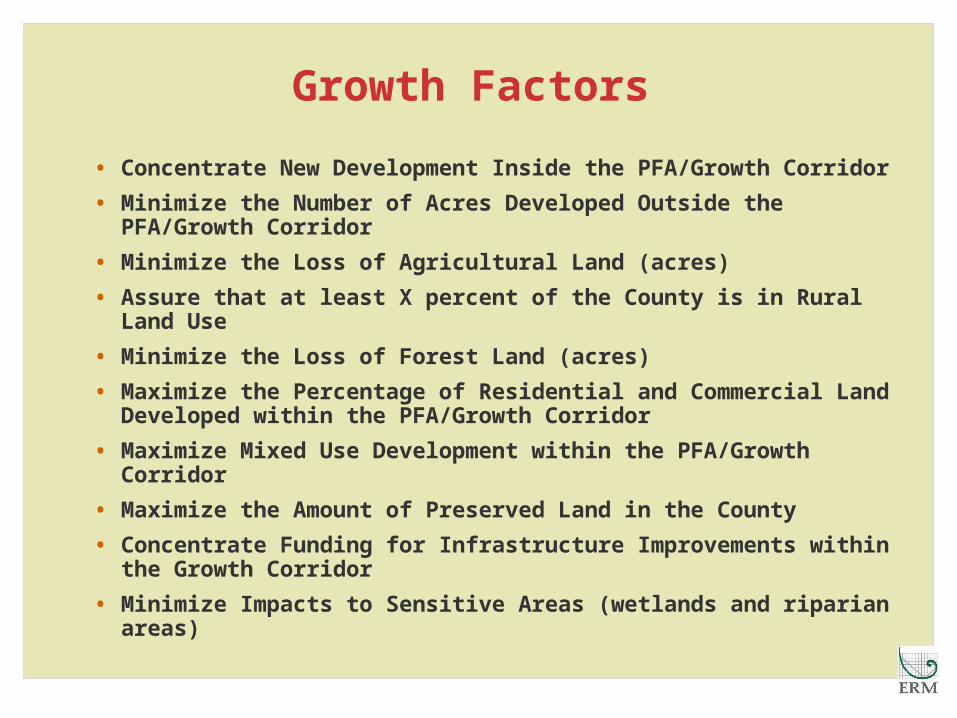
Growth Factors
• Concentrate New Development Inside the PFA/Growth Corridor
• Minimize the Number of Acres Developed Outside the PFA/Growth Corridor
• Minimize the Loss of Agricultural Land (acres)
• Assure that at least X percent of the County is in Rural Land Use
• Minimize the Loss of Forest Land (acres)
• Maximize the Percentage of Residential and Commercial Land Developed within the PFA/Growth Corridor
• Maximize Mixed Use Development within the PFA/Growth Corridor
• Maximize the Amount of Preserved Land in the County
• Concentrate Funding for Infrastructure Improvements within the Growth Corridor
• Minimize Impacts to Sensitive Areas (wetlands and riparian areas)
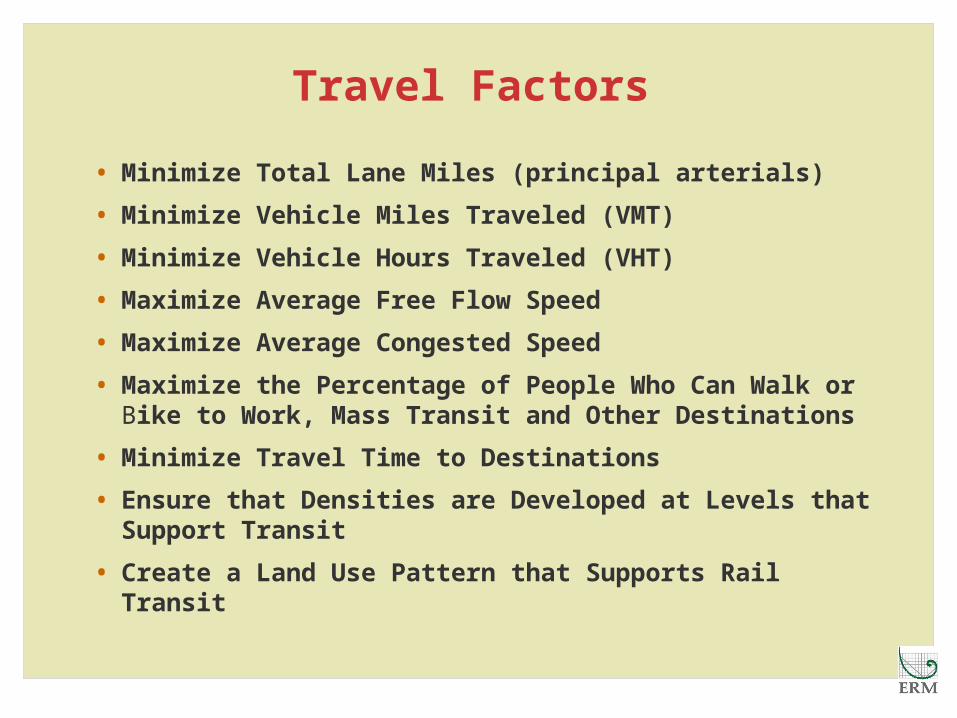
Travel Factors
• Minimize Total Lane Miles (principal arterials)
• Minimize Vehicle Miles Traveled (VMT)
• Minimize Vehicle Hours Traveled (VHT)
• Maximize Average Free Flow Speed
• Maximize Average Congested Speed
• Maximize the Percentage of People Who Can Walk or Bike to Work, Mass Transit and Other Destinations
• Minimize Travel Time to Destinations
• Ensure that Densities are Developed at Levels that Support Transit
• Create a Land Use Pattern that Supports Rail Transit

Water Resource Factors
• Minimize Impervious Surface (by watershed)
• Assure Adequate Public Drinking Water System Supply (by system)
• Minimize Point Source Nutrient Discharge (by watershed)
• Minimize Septic Systems Nutrient Load (by watershed)
• Assure Wastewater Treatment Plant Capacity
• Maximize Groundwater Recharge (by watershed)
• Minimize Stormwater Loads (by watershed)
• Improve Overall Water Quality (measured by discharge into the bay)

Other Factors
• Ensure that employment land served by public infrastructure is adequate to meet future demand (buildout employment)
• Ensure that the County Has the Capability to Implement the Plan
• Ensure that the Towns Have the Capability to Implement the Plan
• Measure impacts on public facilities and infrastructure, including schools and roads
Delivering sustainable solutions in a more competitive world www.erm.com
Cecil County Comprehensive
Plan Oversight Committee Meeting
October 15, 2008

Scenario Land UseResidential Zoning
District Acres Existing Density (units/acre)
Resource Lands
MH, RM 1,347 2.00
VR, DR, TR 878 1.00
All others 86,690
Rural
NAR 49,061 0.10
RR 11,095 0.20
SR, MH 5,018 2.00
DR, TR 232 1.00
VR 155 3.00
RM 17 2.00
Development
RR 1,097 0.20
SR 13,702 2.00
MH, VR 1,259 3.00
NAR 3,421 0.10
MEA 396
DR, TR 7,814 3.75
RM 1,284 10.50
Urban Open Space All districts n/a n/a
Employment/ Development
All districts 9,626
Town Development All Towns 8,425 3.5 (unless specified by town)
Gro
wth
Corr
idor
Scen
ari
o

Scenario Land UseResidential Zoning District Acres Existing Density (units/acre)
Resource Lands
MH, RM 1,611 2.00
VR, DR, TR 1,551 1.00
All others 134,377
Rural
NAR 15,044 0.10
OS 37 0.00
RR 5,208 0.20
SR, MH, RM 6,336 2.00
DR 232 1.00
Development
RR 578 0.20
SR 11,107 2.00
MH, VR 1,217 3.00
NAR 605 0.10
MEA 136
DR, TR 7,296 3.75
RM 1,283 10.50
Urban Open Space
All districts n/a n/a
Employment/ Development
All districts 6,784
Town Development
All Towns 9,918 3.5 (unless specified by town) Gre
en
belt
s S
cen
ari
o