delivery infrastructure planning - pse
TRANSCRIPT

8 - 1
Chapter 8: Delivery Infrastructure
PSE 2017 IRP
2017 PSE Integrated Resource Plan
Delivery Infrastructure Planning
This chapter describes the planning process for PSE-owned gas and electric delivery infrastructure and outlines the challenges and opportunities that confront the delivery system at this time.
Contents
1. OVERVIEW 8-3
2. SYSTEM OVERVIEW 8-4
• Responsibilities
• Existing System
3. WHAT DRIVES INFRASTRUCTURE INVESTMENT? 8-8
• Load Growth
• Reliability and Resiliency
• Regulatory Compliance
• Public Improvement Projects
• Aging Infrastructure
• Integration of Resources
4. PLANNING PROCESS 8-12
• System Evaluation
• System Needs, Modeling and Analysis
• System Alternatives
• Evaluating Alternatives and Recommended Solutions
• Public Outreach (continued next page)
8

8 - 2
Chapter 8: Delivery Infrastructure
PSE 2017 IRP
5. 10-YEAR INFRASTRUCTURE PLANS 8-23
• Electric Infrastructure Plan
• Energize Eastside Transmission Capacity Project
• Gas Infrastructure Plan
6. CHALLENGES AND OPPORTUNITIES 8-57
• New Regulations
• Maturing System Alternatives

8 - 3
Chapter 8: Delivery Infrastructure
PSE 2017 IRP
1. OVERVIEW Delivery system infrastructure planning is done on a 10-year basis, and those plans are updated continually as conditions, technologies and customer behavior change. This chapter reviews PSE’s responsibilities and existing system, what drives infrastructure investment, the planning process, 10-year infrastructure plans, and current challenges and opportunities. It also describes the process for determining the system need, clarifying alternatives, and preliminary solutions or solutions funding approval. System planning is a complex process that involves evaluation of system needs and alternatives to address those needs. External input is a major component of the planning process. For large projects, stakeholder engagement throughout project development is extensive. In addition to a general description of those steps, this chapter includes a detailed description of the Energize Eastside Transmission Capacity Project to illustrate the evaluation, analysis and community involvement PSE performs in the process of making system improvement decisions. Currently, PSE is in the process of upgrading its delivery system infrastructure to support smart grid enhancements; this will enable us to achieve cost-effective efficiencies and expand customer offerings. Replacement of legacy analog networks and obsolete remote telemetry unit equipment began in 2010 and is expected to be completed within the next five years. This includes modern, IP-based SCADA networks that will be used to control and monitor substation, transmission and generation assets and replacement of aging Automated Meter Reading (AMR) communications system and electric customer meters with Advanced Metering Infrastructure (AMI) that enables two-way communication. These steps are necessary to build the foundation to efficiently integrate maturing technologies. Among those we are integrating and studying are distributed generation, energy storage, conservation voltage reduction and demand response. While PSE expands integration of these alternatives, we will need to be mindful of the dependability of the technology under all conditions such that customer reliability and rates are not harmed by technologies and applications that are not effectively scalable. Additionally, the technologies and integration must be compatible with existing grid standards and tariffs. This makes informing customers and stakeholders about the capability and viability of these technologies an important priority for PSE.

8 - 4
Chapter 8: Delivery Infrastructure
PSE 2017 IRP
2. SYSTEM OVERVIEW Responsibilities PSE’s delivery system is responsible for delivering natural gas and electricity through pipes and wires safely, reliably and on demand. We are also responsible for meeting all regulatory requirements that govern the systems. To accomplish this, we must do the following1.
• Operate and maintain the system safely and efficiently on a year-by-year, day-by-day and hour-by-hour basis.
• Accomplish timely maintenance and reliability improvements. • Meet state and federal regulations and complete compliance-driven system work. • Ensure that gas and electric systems meet both peak demands and day-to-day demands. • Ensure that localized growth needs are addressed when they differ from overall system
growth needs. • Meet the interconnection needs of independent power generators that choose to connect
to our system. • Plan for future needs so that infrastructure will be in place when the need arrives.
Some of these are regional responsibilities. For instance, all PSE facilities that are part of the Bulk Electric System and the interconnected western system must be planned and designed in accordance with the latest applicable and approved version of the North American Electric Reliability Corporation (NERC) Transmission Planning (TPL) Reliability Standards. These standards set forth performance expectations that affect how the transmission system – 100 kilovolts (kV) and above – is planned, operated and maintained. PSE also must follow Western Electricity Coordinating Council (WECC) reliability criteria; these can be more stringent or more specific than NERC standards at times. PSE must also ensure that the system is flexible enough to adapt to coming changes. Smart Grid components, electric vehicles, customer distributed resources and demand response programs are some of the effective solutions the industry is moving toward in the future, and we need to be prepared to integrate them for the benefit of our customers.
1 / Obligations defined by various codes and best practices such as Washington Administrative Code (WAC) 296 - 45 Electric Power Generation, Transmission, and Distribution; WAC 480-90 Gas Companies - Operations; WAC 480-93 Gas Companies - Safety; WAC 480-100 Electric Companies; WAC 480-108 Electric companies - Interconnection with Electric Generators; WAC 480-100-358:398 Part VI Safety and Standard Rules; National Electric Safety Code (NESC) Parts 1, 2 and 3; NERC Reliability Standards; WECC Regional Reliability Standards; Code of Federal Regulations (CFR) Title 18; CFR Title 49; FERC Order 1000; Occupational Safety and Health Administration; Washington Industrial Safety and Health Administration; National Electric Code; and Institute of Electrical and Electronics Engineers.

8 - 5
Chapter 8: Delivery Infrastructure
PSE 2017 IRP
The goal of PSE’s planning process is to help us fulfill these responsibilities in the most cost-effective manner possible. Through it, we evaluate system performance and bring issues to the surface; we identify and evaluate possible solutions; and we explore the costs and consequences of potential alternatives. This information helps us make the most effective and cost-effective decisions going forward.
Existing System
The table below summarizes PSE’s existing delivery infrastructure as of December 31, 2016. Electric delivery is accomplished through wires, cables, substations, and transformers. Gas delivery is accomplished by means of pipes and pressure regulating stations.
Figure 8-1: PSE-owned Transmission and Distribution System as of December 31, 2016
ELECTRIC GAS
Customers: 1,127,002 Customers: 812,723
Service area: 4,500 square miles Service area: 2,800 square miles
Substations: 352 City gate stations: 40
Miles of transmission line: 2,608 Pressure regulating stations: 581
Miles of overhead distribution line: 10,662 Miles of pipeline: 12,623
Miles of underground distribution line: 10,529 Supply system pressure: 150–550 psig
Transmission line voltage: 55-500 kV Distribution pipeline pressure: 45-60 psig
Distribution line voltage: 4-34.5 kV Customer meter pressure: 0.25 psig
Customer site voltage: less than 600 V

8 - 6
Chapter 8: Delivery Infrastructure
PSE 2017 IRP
How Electric Delivery Systems Work
Figure 8-2: Illustration of Electric Delivery System
Electricity is transported from power generators to consumers over wires and cables, using a wide range of voltages and capacities. The voltage at the generation site must be stepped up to high levels for efficient transmission over long distances (generally 55 to 500 kilovolts). Substations receive this power and reduce the voltage in stages to levels appropriate for travel over local distribution lines (between 4 and 34.5 kV). Finally, transformers at the customer’s site reduce the voltage to levels suitable for the operation of lights and appliances (under 600 volts). Wires and cables carry electricity from one place to another. Substations and transformers change voltage to the appropriate level. Circuit breakers prevent overloads, and meters measure how much power is used. The electric grid was first built 1889, expanding in a highly radial one-way flow design. Over time, the transmission system was looped in a network manner as outages across the nation drove voluntary standards and eventually regulations that require operations with one element out of service. In urban areas a distribution system with looped feeders became common practice to improve reliability. It still operated in a radial one-way flow manner, but as automation and protection devices matured, the system was able to automatically switch to a different source. Nearly 100 percent of the transmission system is networked and portions of PSE’s distribution system are looped.

8 - 7
Chapter 8: Delivery Infrastructure
PSE 2017 IRP
How Natural Gas Delivery Systems Work
Figure 8-3: Illustration of Gas Delivery System
Natural gas is transported at a variety of pressures through pipes of various sizes. Interstate transmission pipelines deliver gas under high pressures (generally 450 to 1,000 pounds per square inch gauge [psig]) to city gate stations. City gate stations reduce pressure to between 150 and 450 psig for travel through supply main pipelines. Then district regulator stations reduce pressure to less than 60 psig. From this point the gas flows through a network of piping (mains and services) to a meter set assembly at the customer’s site where pressure is reduced to what is appropriate for the operation of the customer’s equipment (0.25 psig for a stove or furnace), and the gas is metered to determine how much is used. The gas system was first built in the late 1800s, expanding in a network two-way flow design. From its beginnings as a manufactured gas system, the pipeline materials and operating pressures have changed over time. Natural gas was introduced to the area in 1956, allowing for higher pressures and smaller diameter pipes. Where older cast iron pipe was used, new plastic pipe is inserted into it as a way of cost effectively renewing existing infrastructure in urban areas. While the energy qualities and pipeline materials have changed, the technology used to operate the system has not. Now that gas pipelines are often located within increasingly congested rights-of-way, protecting pipelines from damage becomes even more important.
City
Transmission Pipeline
450 - 1000 psig
City Gate Station Custody Transfer and
Odorization Pressure reduction
to 150-450 psig
Supply Main (6" to 16")
Pressure Limiting Station Pressure reduction to 110 - 150 psig
Limited Supply Main (6" to 10")
District Regulator Station Pressure reduction
to 1/4 - 60 psig
Distribution Main (2" - 8")
Point of Demarcation

8 - 8
Chapter 8: Delivery Infrastructure
PSE 2017 IRP
3. WHAT DRIVES INFRASTRUCTURE INVESTMENT?
Even with load growth being offset by PSE conservation efforts, infrastructure expenditures may stay the same or even increase. This is because load growth is only one of the drivers of infrastructure investment. Aging equipment must be maintained or replaced; regulatory requirements may require spending on system upgrades or alterations; public transportation projects can necessitate equipment relocation; and we are required to integrate new generation resources. Below, we describe the six factors that drive infrastructure investment. Some can be known in advance, others can be forecasted, and some circumstances arise from external events such as extreme weather, new codes or policies that drive behavior or actions, or new transportation projects as a result of unexpected increased funding.
Load Growth
PSE’s first and foremost obligation is to serve the gas and electric loads of our customers; when customers turn on the switch or turn up the heat, sufficient gas and electricity need to be available. Load drives system investment in three ways as overall system loads, short-term peak loads and point (block) loads must be met. Overall System Growth Demands on the overall system increase as the population grows and economic activity increases in our service area, despite the increasing role of demand-side resources and conservation. PSE regularly evaluates economic and population forecasts in order to stay abreast of where and when additional infrastructure, including electric transmission lines, substations and high-pressure gas lines, may be needed to meet growing loads. Peak Loads Peak loads occur when the weather is most extreme. To prepare for these events, PSE carefully evaluates system performance during periods of peak loading each year, updates its system models and compares these models against future load and growth forecasts. This prepares us to determine where additional infrastructure investment is required to meet peak firm loads. Electric and gas system delivery planning is based on near-term and long-term customer growth forecast updates prepared by the Resource Planning and Analysis department. The forecasts include the impact of conservation efforts and implementation of interruptible rate schedules.

8 - 9
Chapter 8: Delivery Infrastructure
PSE 2017 IRP
Interruptible rate schedules are most commonly employed by commercial or industrial customers due to their ability to provide backup generation for critical load and willingness to tolerate an complete outage for period of time, as PSE must be able to depend on curtailment when needed. Residential customers typically do not tolerate undefined outage lengths during extreme events such as cold weather. The gas system is designed to operate more conservatively than the electric system because during a peak event the gas system pressure declines as loads increase. As gas pressure approaches zero, customer equipment is unable to operate as intended, requiring manual intervention by PSE to restore service safely. For this reason, gas outages have much greater public and restoration impacts than electric outages and must be avoided for all but the most extreme conditions. The electric system is more flexible. For short periods of time components can often carry more current than their nameplate ratings call for with no adverse effects, and power restoration following an outage can be achieved instantly if power is rerouted through available switches. Point Loads System investments are sometimes required to serve specific “point loads” that may appear at a specific geographic location in our service territory. Electrical infrastructure to serve a computer server facility is one example; gas infrastructure to serve an industrial facility such as an asphalt plant is another.
Reliability and Resiliency
The energy delivery system is reviewed each year to improve the reliability of service to existing customers. Past outages, equipment inspection and maintenance records, customer feedback, and PSE field input help identify areas where improvements may be made. Additional consideration is given to system enhancements that will improve resiliency (such as being able to provide a second power line from one substation to another in order to enable a self-healing grid). Some of the investments to improve reliability and resiliency include replacing aging conductors, installing covered conductors (tree wire) and converting overhead lines to underground.

8 - 10
Chapter 8: Delivery Infrastructure
PSE 2017 IRP
Regulatory Compliance
PSE is committed to operating our system in accordance with all regulatory requirements. The gas and electric delivery systems are highly regulated by several state and federal agencies including PHMSA (Pipeline & Hazardous Materials Safety Administration), NERC, FERC (Federal Energy Regulatory Commission), the WUTC (Washington Utilities and Transportation Commission) and various worker and public safety regulations. Infrastructure investments driven by compliance requirements include electric transmission projects that are aimed at preventing cascading power outages and system collapse that could extend outside PSE’s system. Gas regulations drive very specific inspection and maintenance activities and often require the replacement of assets based upon age and/or condition.
Public Improvement Projects
PSE must respond to city, county and state jurisdictions within our service area when transportation-related public improvement projects impact our facilities both within and immediately adjacent to public rights of way. PSE gas and electric facilities may require relocation or underground conversion of electrical facilities to accommodate public transportation projects. We also work closely with local jurisdictions to identify system improvement opportunities and to minimize surface restoration costs and disruptions in association with these public improvement projects.
Aging Infrastructure
With continued maintenance, gas and electric infrastructure can provide safe, reliable service for decades. PSE has a number of programs in place that address aging infrastructure by replacing poles, pipes and other components that are nearing the end of their useful life. Our goal is to maximize the life of the system and at the same time minimize customer interruptions by replacing major infrastructure components prior to significant unplanned failure.

8 - 11
Chapter 8: Delivery Infrastructure
PSE 2017 IRP
Integration of Resources
FERC and state regulations require PSE to integrate generation resources into our electric system according to processes outlined in federal and state codes. A new generation plant, whether it is owned and operated by PSE or by others, can require significant electric infrastructure investment to integrate and maintain appropriate electrical power flows within our system and across the region. For the gas system, integrating gas supply resources owned and/or operated by PSE or others (such as underground gas storage, on-system LNG/propane-air peak shaving, and the interstate gas transmission systems) can also require significant infrastructure investment to maintain appropriate system pressures and flows across the region. Distributed generation (DG) – the smaller generation technologies such as roof-top solar panels – must also be reviewed and integrated, often requiring system protection enhancements to satisfy the net metering two-way flow requirements. For larger scale systems, these may also require system infrastructure improvements such as new distribution feeders or a substation. After initial integration, PSE must monitor the impact and influx of these types of resources in order to address any developing power quality concerns and continue to support the desires of customers. The majority of customers who pursue DG today seek to do more than support their own load and desire to sell excess energy back to the utility, which requires additional consideration of infrastructure reliability. Generally, contributions from this type of generation do not occur during PSE’s peak demand2 necessitating the need for infrastructure to supply peak load in order to deliver reliable service. Storage and control systems to help balance DG limitations are maturing, and as control, communications, delivery infrastructure and energy storage systems are modernized, opportunities to integrate distributed generation more effectively to benefit PSE’s operations will increase.
2 / PSE’s peak load occurs in winter when it is dark preventing solar panels from effectively operating during those times.

8 - 12
Chapter 8: Delivery Infrastructure
PSE 2017 IRP
4. PLANNING PROCESS
The goal of the planning process is to deliver reliable energy in the near term and over the long-term planning horizon in cost-effective ways in order to meet customer needs and maximize value to customers, communities and the company. PSE’s system planning process:
• Takes into account the service quality needs of PSE’s customers • Incorporates all applicable regional and federal orders and rules as they relate to system
planning • Includes industry best practices for planning the system
The planning process begins with an evaluation of the system’s current performance and future need through data analysis and modeling tools. Planning considerations include internal inputs such as reliability indices, company goals and commitments, and reviewing the root causes of historic outages. In addition, external inputs such as service quality indices, regulations, municipalities’ infrastructure plans, customer complaints and ongoing service issues are also considered. This robust process is lengthy. It starts in the spring and takes 6-8 months from initial research to finalization of the portfolio. Next, project alternatives are developed. Those alternatives are vetted and reviewed, and projects are compared against one another. Finally, a portfolio of projects is adopted based on optimizing benefit and cost for a given funding level. The process is the same for both long-term and short-term planning. Typically utilities align investment in non-revenue producing infrastructure to customer revenue associated with growth, which further defines a given funding level or constraint for optimization of the portfolio of infrastructure work. Even after the portfolio for a given year is approved, we continue to monitor changing conditions and make alterations as necessary. This robust process is lengthy. It starts in the spring after storm season when system performance data is available, and takes six to eight months to from initial research to finalization of the portfolio, delivering project scope and resource planning for implementation in the fall of the following year.

8 - 13
Chapter 8: Delivery Infrastructure
PSE 2017 IRP
Figure 8-4: Delivery System Planning Process
System Evaluation
System evaluation begins with an evaluation of system performance, a review of existing operational challenges, and consideration of load forecasts, demand side management (DSM) and known commitments and obligations. Performance is measured by the system’s ability to maintain quality and continuous service during normal and peak loads throughout the year while meeting the regulatory requirements that govern them.

8 - 14
Chapter 8: Delivery Infrastructure
PSE 2017 IRP
Performance criteria for electric and gas delivery systems lie at the heart of the process and are the foundation of PSE’s infrastructure improvement planning.
Figure 8-5: Performance Criteria for Electric and Gas Delivery Systems
Electric delivery system performance criteria are defined by:
Gas delivery system performance criteria are defined by:
Safety and compliance (e.g., 100% compliance) Safety and compliance (e.g., 100% compliance)
The temperature at which the system is expected to perform (e.g., normal winter peak, extreme winter peak)
The temperature at which the system is expected to perform (e.g., 55 DD Peak Hour)
The nature of service and level of reliability that each type of customer has contracted for (e.g., firm or interruptible)
The nature of service each type of customer has contracted for (e.g., firm or interruptible)
The minimum voltage that must be maintained in the system (e.g., no more than 5% above or below standard
voltage)
The minimum pressure that must be maintained in the system (e.g., level at which appliances fail to
operate)
The maximum voltage acceptable in the system (e.g., no more than 5% above or below standard voltage)
The maximum pressure acceptable in the system (e.g., defined by CFR 192.623 and
WAC-480-93-020)
Thermal limits of equipment utilized to deliver power to load centers and transmission customers (e.g., per PSE
Transmission Planning Guidelines)
The interconnectivity with other utility systems and resulting requirements, including compliance with NERC
planning standards (e.g., 100% compliance)
8 - 15
Chapter 8: Delivery Infrastructure
PSE 2017 IRP
Performance Inputs PSE collects system performance information from field charts, remote telemetry units, supervisory control and data acquisition equipment (SCADA), employees and customers. Some information is analyzed over multiple years to normalize the effect of variables like weather that can change significantly from year to year. For near-term load forecasting at the local city, circuit or neighborhood level, we use system peak-load broken down by county and customer growth trends, augmented by permitted construction activity for the next two years and including transmission customer load. External Inputs External inputs such as new regulations, municipal and utility improvement plans, and customer feedback, as well as company objectives such as PSE’s asset management strategy or smart grid strategy, are also included in the system evaluation to understand commitments and opportunities to mitigate impact or improve service at least cost. For example, the WUTC issued a policy statement requiring natural gas utilities to file a plan for replacing pipes that represent a higher risk of failure, and PSE’s commitment to this plan is considered in the evaluation. PSE obtains the annual updates to local jurisdiction six-year Transportation Improvement Plans to gain long-term planning perspective on upcoming public improvement projects. As the transportation projects develop through design, engineering and construction, PSE works with the local jurisdictions to identify and minimize potential utility conflicts and to identify opportunities to address system deficiencies and needs. For aging and risk mitigation infrastructure programs like replacement of all DuPont gas pipe associated with the aforementioned WUTC policy statement or replacement of underground high molecular weight cable, coordination over many years becomes meaningful for all who will be impacted by utility construction and surface restoration requirements. PSE also meets with jurisdictions in various forums such as quarterly roundtable discussions that include other utilities and agencies and in formal public presentations required through agreement or local regulation in order to gather input about concerns and coordinate solutions. For example, PSE and the City of Bellevue meet annually to exchange plans related to community development and utility system improvements, which provides an opportunity for interested stakeholders to ask questions and raise issues and concerns. Similarly, PSE engages in a multi-year coordination with Bainbridge Island stakeholders to discuss reliability and gather input regarding improvements. PSE gains public input regarding the need for infrastructure improvement through the PSE and WUTC complaint process, as well as through open forums that result from less than satisfactory service.

8 - 16
Chapter 8: Delivery Infrastructure
PSE 2017 IRP
System Needs, Modeling and Analysis
PSE relies on several tools to help identify needs or concerns and to weigh the benefits of alternative actions to address them. Figure 8-6 provides a brief summary of these tools, the planning considerations (inputs) that go into each and the results (outputs) that they produce. Each tool is used to provide data independently for use in iDOT which then creates the full understanding of all the benefits and risks.
Figure 8-6: Delivery System Planning Tools
TOOL USE INPUTS OUTPUTS
SynerGi® Gas and Electric network modeling
Gas and electric distribution infrastructure from GIS and load
characteristics from CIS, load approvals, load forecast
Predicted system performance
Power World Simulator – Power Flow
Electric network modeling
Electric transmission infrastructure from WECC base case and
load/generation characteristics from CIS, load approvals, and
load forecast
Predicted system performance
Electric Predictive Spreadsheet
Electric outage predictive analysis
Electric outage history from SAP Predicted outage savings
Gas Outage Spreadsheet
Gas outage predictive analysis
Gas SynerGi system performance data for future capacity
Predicted outage savings
Estimated Unserved Energy (EUE) Spreadsheet
Electric financial analysis
Estimated project costs; hourly load data from EMS; load growth
scenarios from load forecast
Net Present Value; income statement; load growth vs.
capacity comparisons; EUE
Distribution / Transmission Integrity
Management Risk Assessment
Gas pipeline risk analysis
Gas infrastructure operating or maintenance concerns from
various databases
Program funding options to mitigate higher risk facilities
Asset Management Assessment
Electric maintenance analysis
Electric infrastructure operating or maintenance concerns from
various databases
Program funding options to mitigate higher risk facilities
All data collected by the tools above are input into iDOT
Investment Decision Optimization Tool
(iDOT)
Gas and electric project data storage
& portfolio optimization
Project scope, budget, justification, alternatives and
benefit/risk data collected from above tools and within iDOT;
resources/financial constraints
Optimized project portfolio; benefit cost ratio for each project;
project scoping document

8 - 17
Chapter 8: Delivery Infrastructure
PSE 2017 IRP
PSE’s gas system model and electric distribution model is a large integrated model of the entire delivery system. It uses a software application (SynerGi® Gas and SynerGi Electric, respectively) that is updated to reflect new customer loads and system and operational changes. This model helps predict capacity constraints and subsequent system performance on a variety of temperatures and under a variety of load growth scenarios. Results are compared to actual system performance data to assess the model’s accuracy. To simulate the performance of the electric transmission system, PSE primarily uses Power World Simulator. This simulation program uses a transmission system model that encompasses infrastructure across 11 western states, 2 provinces in western Canada and parts of northern Mexico. The power flow and stability data for these models are collected, coordinated and distributed through regional organizations including ColumbiaGrid and WECC (one of eight regional reliability organizations under NERC). These power system study programs support PSE’s planning process and facilitate demonstration of compliance with WECC and NERC reliability performance standards. While PSE utilizes a regional model for system evaluation and coordination, the focus is on local concerns and projects. Appendix I describes regional transmission planning and the role of ColumbiaGrid. ColumbiaGrid has had substantial responsibilities for transmission planning, reliability and other development services since 2006 in order to improve the operational efficiency, reliability and planned expansion of the Pacific Northwest transmission grid. PSE is one of 8 utilities that coordinate regional planning through ColumbiaGrid, which provides transparency and encourages broad participation and interaction with stakeholders, including customers, transmission providers, states and tribes. Modeling is a three-step process. First, a map of the infrastructure and its operational characteristics is built from the GIS and asset management system, or in the case of transmission, provided by WECC. For gas, these include the diameter, roughness and length of pipe, connecting equipment, regulating station equipment and operating pressure. For electric infrastructure, these include conductor cross-sectional area, impedance, length, construction type, connecting equipment, transformer equipment and voltage settings. Next, we identify customer loads, either specifically (for large customers) or as block loads for address ranges. Existing customer loads come from PSE’s customer information system or actual circuit readings. Finally, we take into consideration seasonal variations, types of customers (interruptible vs. firm), time of daily peak usage, the status of components (valves or switches closed or open) and forecast future loads to model scenarios of infrastructure or operational adjustments. The goal is to find the optimal solution to a given issue. Where issues surface, the model can be used to evaluate alternatives and their effectiveness. PSE augments potential alternatives with cost estimates and feasibility analysis to identify the lowest reasonable cost solution for both current and future loads.

8 - 18
Chapter 8: Delivery Infrastructure
PSE 2017 IRP
System Alternatives
The alternatives available to address delivery system capacity and reliability issues are listed below. Each has its own costs, benefits, challenges and risks.
Figure 8-7: Alternatives for Addressing Delivery System Capacity and Reliability
ALTERNATIVES ELECTRIC SYSTEM GAS SYSTEM
Add energy source Substation City-gate station
District regulator
Strengthen feed to local area New conductor Replace conductor
New high pressure main New intermediate pressure main
Replace main
Improve existing facility Substation modification Expanded right-of-way
Uprate system
Modify automatic switching scheme
Regulation equipment modification Uprate system
Load reduction
Wire/Non-wire
Rebalance load Fuel switching
Distributed energy resource Battery storage
Natural gas conversion Conservation/Demand response
Load control equipment Possible new tariffs
Fuel switching Conservation
Load control equipment Possible new tariffs
Do nothing
The same alternatives can be used to manage short-term issues like peaking events or conditions created by a construction project. For example:
• Temporary adjustment of regulator station operating pressure, as executed through
PSE’s Cold Weather Action Plan
• Temporary adjustment of substation transformer operating voltage, as done using load
tap changers
• Automatic capacitor bank switching to optimize VAR consumption and maintain adequate
voltage
• Temporary siting of mobile equipment such as compressed natural gas injection vehicles,
liquid natural gas injection vehicles, mobile substations and portable generation
8 - 19
Chapter 8: Delivery Infrastructure
PSE 2017 IRP
Evaluating Alternatives and Recommended Solutions
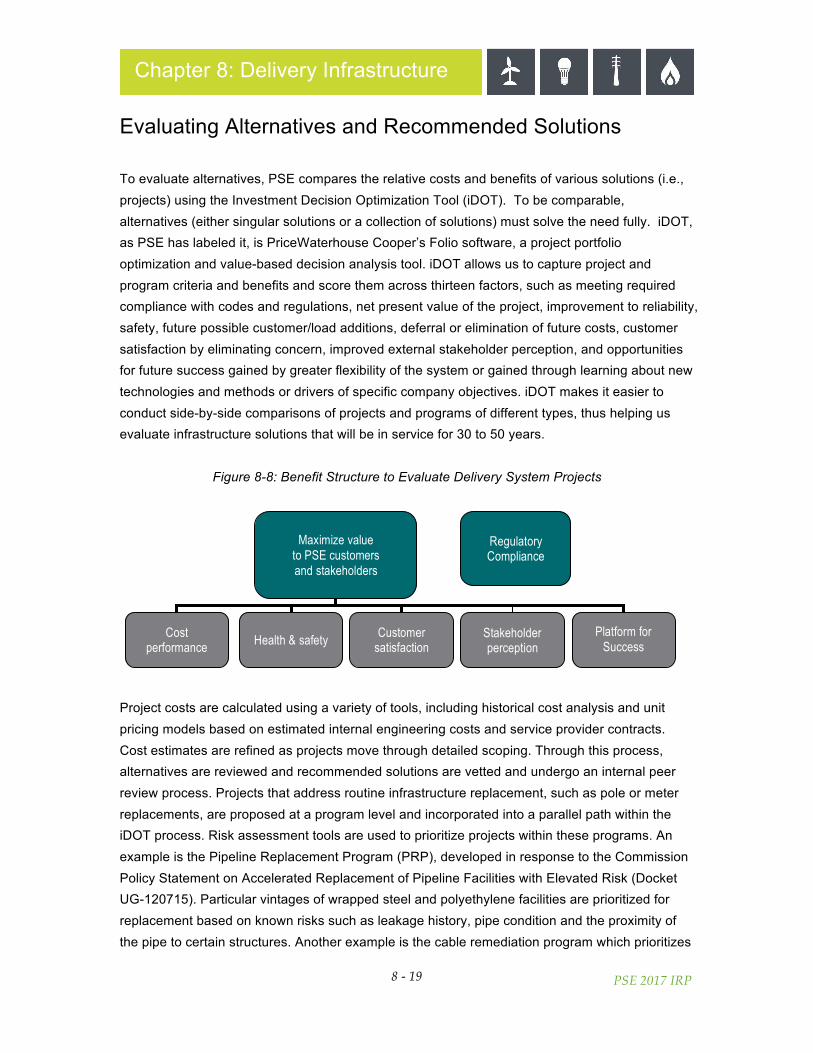
To evaluate alternatives, PSE compares the relative costs and benefits of various solutions (i.e., projects) using the Investment Decision Optimization Tool (iDOT). To be comparable, alternatives (either singular solutions or a collection of solutions) must solve the need fully. iDOT, as PSE has labeled it, is PriceWaterhouse Cooper’s Folio software, a project portfolio optimization and value-based decision analysis tool. iDOT allows us to capture project and program criteria and benefits and score them across thirteen factors, such as meeting required compliance with codes and regulations, net present value of the project, improvement to reliability, safety, future possible customer/load additions, deferral or elimination of future costs, customer satisfaction by eliminating concern, improved external stakeholder perception, and opportunities for future success gained by greater flexibility of the system or gained through learning about new technologies and methods or drivers of specific company objectives. iDOT makes it easier to conduct side-by-side comparisons of projects and programs of different types, thus helping us evaluate infrastructure solutions that will be in service for 30 to 50 years.
Figure 8-8: Benefit Structure to Evaluate Delivery System Projects
Project costs are calculated using a variety of tools, including historical cost analysis and unit pricing models based on estimated internal engineering costs and service provider contracts. Cost estimates are refined as projects move through detailed scoping. Through this process, alternatives are reviewed and recommended solutions are vetted and undergo an internal peer review process. Projects that address routine infrastructure replacement, such as pole or meter replacements, are proposed at a program level and incorporated into a parallel path within the iDOT process. Risk assessment tools are used to prioritize projects within these programs. An example is the Pipeline Replacement Program (PRP), developed in response to the Commission Policy Statement on Accelerated Replacement of Pipeline Facilities with Elevated Risk (Docket UG-120715). Particular vintages of wrapped steel and polyethylene facilities are prioritized for replacement based on known risks such as leakage history, pipe condition and the proximity of the pipe to certain structures. Another example is the cable remediation program which prioritizes
Maximize value to PSE customers and stakeholders
Cost performance
Stakeholder perception
Platform for Success
Health & safety Customer
satisfaction
Regulatory Compliance

8 - 20
Chapter 8: Delivery Infrastructure
PSE 2017 IRP
based on risks such as number of past failures, number of customers impacted and system configuration that prevents timely restoration. Historically, like many other utilities, PSE has not broadly engaged the public and stakeholders in distribution alternative analysis for several reasons; 1) short timeframes for distribution system planning as a result of solutions needing to be completed within the same or following year; 2) the number of annual projects (generally greater than 400) would be difficult to review effectively; and 3) least cost alternatives are generally apparent to the seasoned expert planning engineer. However, NERC TPL standards define a required stakeholder process that is followed for non-consequential load loss alternatives. PSE recognizes public policy is leading to a desire for greater transparency in how alternatives are selected and will need to determine how to most effectively engage stakeholders based definitions of those policies, guidelines or rulemaking. Criteria or incentives that allow utilities to choose alternatives that are not least cost will be important.
Each recommended project and program is compared using iDOT. This involves building a hierarchy of the value these benefits bring to the stakeholders against the project cost. The benefits are reviewed and reassessed periodically with senior management to ensure proper weight and priority is assigned throughout the evaluation process. Using project specific information, iDOT optimizes total value across the entire portfolio of non-mandated or discretionary system infrastructure projects (electric and natural gas) which results in a set of capital projects that provide maximum value to PSE customers and stakeholders relative to given financial constraints. Further minor adjustments are made to ensure that the portfolio addresses resource planning and other applicable constraints or issues such as foreseen permitting or environmental process concerns. Periodically PSE has reviewed this process and the optimization tool along with resulting portfolio with WUTC staff.

8 - 21
Chapter 8: Delivery Infrastructure
PSE 2017 IRP
Annual plans approved by operations management provide a specific portfolio of projects for the year. Final adjustments may be made as the system portfolio is compared with other objectives of the company such as necessary generator or dam work, or customer initiatives. While annual plans are considered final, throughout the year they continue to be adjusted based on changing factors (such as public improvement projects that arise or are deferred; changing forecasts of new customer connections; or project delays in permitting) so that we can ensure the total portfolio financial forecast remains within established budget parameters. As plans and projects develop through the design and permitting phases, cost and benefit are routinely evaluated and confirmed before progressing. Alternatives may be reviewed through the project development progress points along with more detailed routing and siting discussions. The specific portfolio of projects and programs are shared with regional teams and project management teams as project planning begins. Long-range plans are communicated to the public through local jurisdictional tools such as the city and county Comprehensive plans required by the Washington State Growth Management Act. Often this information serves as the starting point for demonstrating the need for improvements to local jurisdictions, residents and businesses far in advance of a project moving to planning, design, permitting and construction. Project maps and details are updated on PSE.com as well.

8 - 22
Chapter 8: Delivery Infrastructure
PSE 2017 IRP
Public Outreach
In addition to the methods described in the system evaluation section regarding gathering input about need and potential coordination opportunities, PSE engages the community, jurisdictions and stakeholders in various ways to arrive at the specific project that is constructed. Project-specific information provides for the greatest engagement with the public, as it enables the community and stakeholders to see specific impacts or relevant interests based on what it means to them (where the project is and what it improves). Outreach tools include community meetings, routing workshops, public open houses and online open houses, webinars, community mailers, surveys and comment cards. PSE provides information on pse.com3 for a wide variety of projects. These include system improvements as well as an overview of the process including public discussion and outreach. The information includes a project overview, what the community can expect during construction, links to project-specific information and contact information for questions and comments. Project-specific webpages for larger and more complex projects provide details and maps. These sites invite stakeholder questions and inquiries. Depending on the scope and complexity of the project, community advisory groups may be formed to capture the affected area’s diverse interests. The goal is to share system needs and potential solutions, to identify and assess community values in the context of the project attributes, and to develop recommendations for PSE’s consideration. As we integrate environmental considerations into project planning, potential effects are identified, assessed, minimized and mitigated as required by all applicable federal, state and local regulatory codes. PSE works with these agencies to obtain all required land use and environmental permits, approvals and authorizations prior to initiation of construction. These permitting processes provide many and various opportunities for written public comment and verbal testimony at open public hearings. Typically, valid and valuable public input is taken into consideration by the agencies and often developed into conditions of final permit approval.
3 / http://pse.com/inyourcommunity/pse-projects/Pages/default.aspx
8 - 23
Chapter 8: Delivery Infrastructure
PSE 2017 IRP
5. 10-YEAR INFRASTRUCTURE PLANS PSE develops both short-range and long-range infrastructure plans that support local needs. These are reviewed and validated annually. As the plan year gets closer, the company refines plan projections based on new developments or information and performs additional analyses to reveal and evaluate additional alternatives. The plan may change as a result of these investigations. The infrastructure additions described below are intended to indicate the scope of investment that may be required over the next ten years in order to serve our customers reliably and fulfill regulatory requirements. They are described in general terms.
Electric Infrastructure Plan
Transmission In the next decade, PSE anticipates building approximately 104 plus miles of new transmission lines (100 kV and above) and upgrading over 122 miles of existing transmission lines. In addition, we anticipate needing to add up to three 230 kV bulk power substations across our service area. These planned improvements do not include transmission needed to support the broader region or improvements needed as a result of providing interconnections for large generation resources. As a “Transmission Provider,” PSE must process all transmission interconnection requests according to applicable FERC resource interconnection procedures. NERC TPL standards establish transmission system planning performance requirements within the planning horizon to develop a Bulk Electric System (BES) that will operate reliably over a broad spectrum of system conditions and following a wide range of probable contingencies.4 These requirements are a primary driver of transmission projects. Distribution In the next decade, PSE anticipates the need to build approximately 6 to 8 new distribution substations to serve load as existing substation capacity is exceeded and another 2 to 4 new substations to serve specific point loads. We also anticipate upgrading approximately 3 existing substations to replace aging infrastructure and adding additional capacity to serve local load growth. In total, the new or expanded substations will require 32 to 48 new distribution lines. PSE will continue work on improving reliability of its worst performing circuits as well as installing smart ready equipment for increasing the resiliency of the grid.
4 / http://www.nerc.com/_layouts/PrintStandard.aspx?standardnumber=TPL-001-4&title=Transmission System Planning Performance Requirements&jurisdiction=United States

8 - 24
Chapter 8: Delivery Infrastructure
PSE 2017 IRP
Ongoing Maintenance Based upon current projections and past experience, in the next decade PSE expects to replace 1,800 miles of underground high molecular weight, failure-prone distribution cable, approximately 1,000 transmission and 10,000 distribution poles. Additionally, PSE anticipates replacement of several major substation components as a result of ongoing inspection and diagnostics. PSE anticipates replacement of its current aging and obsolete Automated Meter Reading (AMR) communication system as well as its electric customer meters with Advanced Metering Infrastructure (AMI) technology to enable smart grid enhancements and customer offerings in the future.
Figure 8-9: Summary of 10-Year Electric Infrastructure Plan
ASSET NUMBER LOCATION
New Transmission Lines 104 miles System-wide
Upgraded Transmission Lines 122 miles System-wide
New Bulk Power Substations Up to three System-wide
New Distribution Substations Eight to Twelve System-wide
Upgraded Distribution Substations Three System-wide
Distribution Lines 32 to 48 System-wide
Cable Replaced 1,800 miles System-wide
Transmission Poles Replaced 1,000 System-wide
Distribution Poles Replaced Up to 10,000 System-wide

8 - 25
Chapter 8: Delivery Infrastructure
PSE 2017 IRP
Planned Transmission System Improvements PSE participates in coordinated, open, and transparent transmission planning processes as intended by FERC Order 1000 and outlined through the western regional planning processes of ColumbiaGrid. PSE identifies new transmission facilities and facility replacements or upgrades required to meet system needs over the ensuing ten years. This list of projects is documented pursuant to PSE’s Attachment K as a participant of those processes.5 Transmission planning studies are performed and project requirements are updated annually. Appendix I: Regional Transmission provides more information regarding Order 1000 and Attachment K. The following list is based on the 2016 planning results6 and provides a high-level description of scope of work, a footnote where more information can be found, and estimated date of completion. It is important to remember that these projects are not associated with facilitating generation resource paths, but are required to meet the local growth or reliability needs of PSE’s customers, which may impact the interconnected grid.
5 / http://www.oatioasis.com/PSEI/PSEIdocs/Attachment_K_20160401.pdf 6 / http://www.oatioasis.com/PSEI/PSEIdocs/PSE_Plan_2016_Draft.pdf

8 - 26
Chapter 8: Delivery Infrastructure
PSE 2017 IRP
PROJECTS COMPLETED SINCE LAST 2015 IRP. (Information on a variety of completed projects with in the last six months can be found on PSE’s website at https://pse.com/inyourcommunity/pse-projects/system-improvements/Pages/Completed-improvements.aspx.) The format of this list of projects is intended to follow Attachment K as closely as possible in order to avoid inconsistency or confusion. The purpose is generally described in terms of improving reliability, increasing capacity to serve load growth, or meeting NERC TPL standards and the planning requirements relative to operating contingencies.
1. Blumaer – Yelm 115 kV Re-conductor7 Date of Operation: 2016 This project addressed capacity and reliability needs of the Yelm area by rebuilding the remaining 12-mile Blumaer – Yelm section of the 42-mile Blumaer – Electron Heights 115 kV transmission line, which mostly consists of 4/0 Cu and 336 ACSR conductors, to 115 kV Standard 1272 ACSR 100C conductor.
2. Spurgeon Creek Transmission Substation Development (Phase 1)8
Date of Operation: 2016 In Phase 1, this project addressed reliability of transmission service to the cities of Lacey, Olympia and Tumwater, by looping the Blumaer – St Clair 115 kV transmission line into the new Spurgeon Creek substation. This project looped the Olympia – St Clair #1 115 kV line into Spurgeon Creek.
3. Moorlands – Vitulli 115 kV Rebuild9
Date of Operation: 2017 This project addressed capacity and reliability needs in the Kenmore and Bothell areas and NERC planning standards requirements by rebuilding the line to increase the winter emergency line rating from 122 MVA to 249 MVA.
FUTURE PROJECTS
4. Bellingham 115 kV Substation Rebuild
Estimated Date of Operation: 2019 This project will increase system reliability in Whatcom County. It involves replacing the existing aging 115 kV main bus substation with a new breaker and a half 115 kV substation.
7 / https://pse.com/inyourcommunity/pse-projects/system-improvements/Pages/Yelm-area-reliability.aspx 8 / https://pse.com/inyourcommunity/pse-projects/system-improvements/Pages/Spurgeon-Creek-substation.aspx 9 / https://pse.com/inyourcommunity/pse-projects/system-improvements/Pages/Moorlands-Vitulli-115-kV-transmission-line-upgrade.aspx

8 - 27
Chapter 8: Delivery Infrastructure
PSE 2017 IRP
5. Sedro Woolley – Bellingham #4 115 kV Rebuild and Reconductor Estimated Date of Operation: 2021 This project will increase capacity and reliability between Whatcom and Skagit Counties by rebuilding the 24-mile long Bellingham – Sedro #4 115 kV line and installing higher capacity conductors.
6. Lake Hills – Phantom Lake New 115 kV Line10
Estimated Date of Operation: 2017 This project will improve reliability, which involves building a new line from Lake Hills to Phantom Lake. This line is necessary to eliminate a radial-only feed to two existing substations such that they can be served during outage conditions.
7. Sammamish – Juanita New 115 kV Line11
Estimated Date of Operation: 2017+ This project will increase capacity and address NERC planning standards requirements by building a new line from Sammamish to Juanita with 1272 kcmil Bittern at 100° C.
8. Novelty – Stillwater – Cottage Brook 115 kV Rebuild
Estimated Date of Operation: 2018 This project will increase capacity and address NERC planning standards requirements by rebuilding the line from 2/0 copper conductors to 1272 kcmil Bittern at 100° C.
9. Talbot 230 kV Bus Improvements
Estimated Date of Operation: 2018+ This project will improve reliability through continuity of service during maintenance work and substation outages by constructing bus improvements on the north and south 230 kV buses at Talbot.
10 / https://pse.com/inyourcommunity/pse-projects/system-improvements/Pages/Lake-Hills-Phantom-Lake.aspx 11 / https://pse.com/inyourcommunity/pse-projects/system-improvements/Pages/Sammamish-Juanita.aspx
8 - 28
Chapter 8: Delivery Infrastructure
PSE 2017 IRP
10. Eastside 230 kV Transformer Addition and Sammamish – Lakeside – Talbot 115 kV Rebuilds (the Energize Eastside Transmission Capacity Project)12 Estimated Date of Operation: 2018+ These projects are intended to provide additional capacity to serve the projected load growth in north central King County, to reinforce the existing transmission ties between north King and central King areas, and to address NERC planning standards requirements. This involves the addition of a 230 kV/115 kV transformer substation in the center of the Eastside load area, and rebuilding the 115 kV Sammamish – Lakeside – Talbot #1 & #2 lines to 230 kV to provide additional transmission capacity to serve projected load growth. A detailed description of this project is presented in the next section of this chapter.
11. Electron Heights – Enumclaw 55-115 kV Conversion
Estimated Date of Operation: 2019 This project provides capacity and better reliability in southeast King county and east Pierce county and also addresses NERC planning standard requirements by converting an existing 55 kV transmission line and associated substations to 115 kV operation.
12. Brisco Park Substation and O’Brien – Brisco 115 kV Transmission Line
Estimated Date of Operation: 2019+ This project will provide needed capacity and better reliability to support the existing and expected load growth in this commercial/industrial area by providing a new 115 kV transmission line in Kent and a new 6-breaker 115 kV ring bus substation in Tukwila.
13. Spurgeon Creek Transmission Substation Development (Phase 2)
Estimated Date of Operation: 2020 In Phase 2, this project will improve the reliability of transmission service to the cities of Lacey, Olympia and Tumwater by looping the future transmission tap extension from Olympia via the Airport substation to Spurgeon Creek. This project also loops in the Olympia – St Clair #1 115 kV line into Spurgeon Creek.
14. White River – Electron Heights 115 kV Line Re-route to Alderton (Phase 2)
Estimated Date of Operation: 2017-18 This project will improve the reliability of transmission service to the cities of Bonny Lake, Orting and surrounding areas where major housing developments are to be built by looping the White River – Electron Heights three-terminal 115 kV transmission line into Alderton.
12 / https://www.energizeeastside.com

8 - 29
Chapter 8: Delivery Infrastructure
PSE 2017 IRP
15. Pierce County Transformer Addition Estimated Date of Operation: 2017-18 This project is intended to provide additional capacity to serve the projected load growth in Pierce County and surrounding areas. The project will involve installation of a 230-115 kV transformer at Alderton substation and about 8 miles of 230 kV transmission line from White River to Alderton.
16. Woodland – St. Clair 115 kV (Phase 2)
Estimated Date of Operation: 2021+ This project will increase the transmission intertie capability and reliability between Pierce and Thurston counties by adding a third transmission intertie between Pierce and Thurston Counties with construction of the remaining 8 miles 115 kV line between Gravelly Lake and Woodland substations.
17. Alderton – Woodland 115 kV uprate
Estimated Date of Operation: 2021+ This project will increase capacity in the Pierce County area by uprating the Alderton – Woodland section of the White River – Fairchild – Alderton 115 kV transmission line, which consists of about 6 miles of 795 TERN 55C conductor. The line section will be uprated to 100C. This project is planned to be completed concurrent with the Woodland – St Clair Phase 2 project.
18. White River 115 kV Bus Improvement
Estimated Date of Operation: 2021+ This project improves reliability by reconfiguring the White River 115 kV main bus to multiple bus sections to reduce the number of line bay forced outages for a bus fault or 115 kV breaker failure condition.
19. West Kitsap Transmission Project
Estimated Date of Operation: 2020+ This project is intended to provide additional capacity to serve the projected load growth in Kitsap County and improve transmission reliability for customers in central and north Kitsap County. The project is planned to be staged in phases over time and will involve construction of multiple segments of 115 kV transmission lines between BPA Kitsap/South Bremerton to Valley Junction. The final step of the multi-year plan is to add a 230-115 kV transformer capacity in Kitsap County.

8 - 30
Chapter 8: Delivery Infrastructure
PSE 2017 IRP
Areas of Future Focus PSE will continue to improve the electric system planning process as more data regarding demand and conservation potential becomes available with technologies such as AMI (Advanced Metering Infrastructure). Additionally, as technologies mature and PSE’s grid becomes more modern, alternatives will be refreshed and reevaluated when necessary. Due to the complexity of the larger planned transmission system improvement projects, the first gate of project development known as Initiation will refine the need and reconfirm preliminary alternatives and solutions and consider implementation challenges and new information. This process targets needs that are more than four to five years out in order to provide adequate review and engagement. This process will improve as PSE matures its ability to predict localized circuit-level load growth and conservation potential. Additionally, the incorporation of learnings about alternative technologies and applications will be important as well.
Energize Eastside Transmission Capacity Project
To illustrate the evaluation, analysis and community involvement PSE performs in the process of making system improvement decisions, PSE is including a detailed description of the Energize Eastside Transmission Capacity Project (project #10 above) in this chapter of the IRP. The Energize Eastside project is needed to meet the local growth needs of the east side of King County, including Bellevue, Redmond, Kirkland, Renton, Newcastle and Issaquah. The following pages discuss the identification of need, the analysis of alternatives considered to address need and the engagement of the Eastside community in a robust public process. The needs assessment and solution identification phases of this project have been completed. Currently, the project is in the route selection and permitting phases.
8 - 31
Chapter 8: Delivery Infrastructure
PSE 2017 IRP
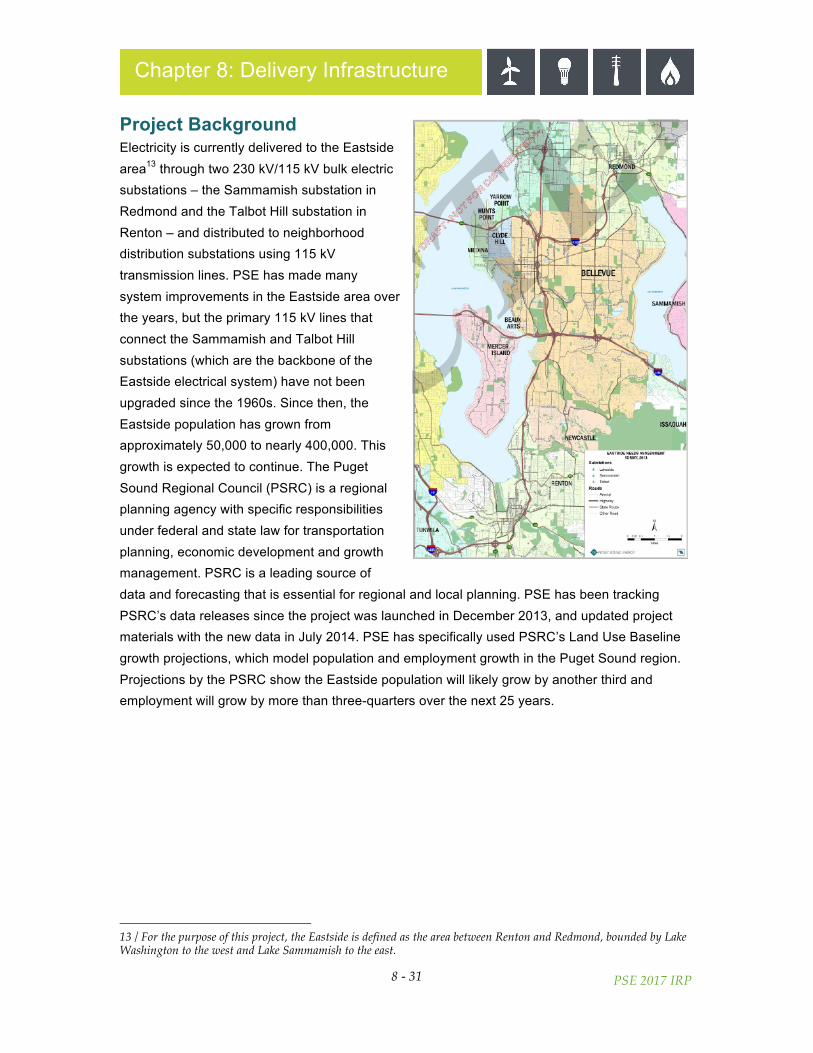
Project Background Electricity is currently delivered to the Eastside area13 through two 230 kV/115 kV bulk electric substations – the Sammamish substation in Redmond and the Talbot Hill substation in Renton – and distributed to neighborhood distribution substations using 115 kV transmission lines. PSE has made many system improvements in the Eastside area over the years, but the primary 115 kV lines that connect the Sammamish and Talbot Hill substations (which are the backbone of the Eastside electrical system) have not been upgraded since the 1960s. Since then, the Eastside population has grown from approximately 50,000 to nearly 400,000. This growth is expected to continue. The Puget Sound Regional Council (PSRC) is a regional planning agency with specific responsibilities under federal and state law for transportation planning, economic development and growth management. PSRC is a leading source of data and forecasting that is essential for regional and local planning. PSE has been tracking PSRC’s data releases since the project was launched in December 2013, and updated project materials with the new data in July 2014. PSE has specifically used PSRC’s Land Use Baseline growth projections, which model population and employment growth in the Puget Sound region. Projections by the PSRC show the Eastside population will likely grow by another third and employment will grow by more than three-quarters over the next 25 years.
13 / For the purpose of this project, the Eastside is defined as the area between Renton and Redmond, bounded by Lake Washington to the west and Lake Sammamish to the east.

8 - 32
Chapter 8: Delivery Infrastructure
PSE 2017 IRP
As required by federal regulations, PSE performs annual comprehensive electric transmission planning studies to determine if there are potential system performance violations (transformer and line overloads) under various operational scenarios and forecasted electrical use. The need for additional 230kV support for the Eastside area was identified and has been included in PSE comprehensive plans since 1993. During the 2009 comprehensive reliability assessment, PSE determined that there was a transmission reliability supply need developing due to the loss of one of the Talbot Hill Substation transformers. Since 2009, other issues have also been identified which impact this portion of the PSE system. These issues include concerns over the projected future loading on the Talbot Hill Substation and increasing use of Corrective Action Plans (CAPs)14 to manage outage risks to customers in this portion of the PSE system. PSE performed studies in 2013 and 2015 that revealed it could not meet federal reliability requirements by the winter of 2017/2018 and the summer of 2018 without the addition of 230 kV to 115 kV transformer capacity in the Eastside area. (Links to these studies are provided on page 30.) To respond to the deficiencies identified in the transmission planning studies, PSE has proposed to construct and operate a new 230 kV to 115 kV electrical transformer served by approximately 18 miles of new high-capacity electric transmission lines (230 kV) extending from Renton to Redmond; this plan includes continued aggressive conservation measures. The proposed transformer will be placed at a substation site near the center of the Eastside. Electrical power transmitted to the new substation for distribution to local customers will address a deficiency in electrical transmission capacity during peak periods identified by PSE through its system planning process. PSE’s Eastside system currently experiences peak demand during the winter driven by heating loads; the summer peak is driven by cooling loads. Continuing population growth increases the risk of more severe overloading by summer 2018. To address this risk, PSE launched the Energize Eastside project in December 2013.
14 / See page 8-38 for description of a Corrective Action Plan.

8 - 33
Chapter 8: Delivery Infrastructure
PSE 2017 IRP
Regulatory Requirements The performance requirements of any integrated transmission system are heavily regulated at both the federal and regional levels. PSE’s regulators include FERC, NERC and WECC (the Federal Energy Regulatory Commission, North American Electric Reliability Corporation and Western Electricity Coordinating Council, respectively). NERC is the regulatory authority certified by FERC to develop and enforce reliability standards. NERC has delegated the task of monitoring and enforcing the federal reliability standards to WECC, the regional entity that has authority over transmission in the western region. The NERC standards mandate that certain forecasts and studies must be completed to determine if the system has sufficient capability to meet expected loads now and in the future. When completing transmission planning studies, contingencies are simulated to determine if the electric system meets the mandatory NERC performance requirements15 for a given set of forecasted demand levels, generation configurations and levels, and multiple system component outages. Even if these outage scenarios are unlikely, federal regulations require that the appropriate planning be performed proactively. This conservative planning methodology is implemented to prevent large scale, cascading, transmission system blackouts, like those that have occurred in the recent past (for example, the 2003 Northeast blackout that affected 55 million people in the Northeast and Midwest regions of the United States and Canada). The PSE transmission planning studies performed in 2013 and 2015 determined that thermal violations on transmission line and transformer equipment might occur under foreseeable scenarios within the next few years. The thermal violations are a result of running scenarios for several component outage contingencies, as required by NERC, that take into consideration peak demand (which is heavily dependent on seasonal temperatures and daily demand profiles) and levels of conservation. In essence, this is a requirement to have redundancy in the transmission system.
15 / The NERC transmission planning standards (TPL) that were in effect in 2012-2013 were: TPL-001-3, TPL-002-0b 2nd Rev (TPL-002-2b), TPL-003-0b 2nd Rev (TPL-003-2b), and TPL-004-2. TPL-001-3, TPL-002-2b, TPL-003-2b, and TPL-004-2 are being retired as they are replaced in their entirety by TPL-001-4. Enforcement of the new standards began January 1, 2015. Visit the NERC website at http://www.nerc.com/pa/Stand/Reliability Standards/TPL-001-4.pdf for more information. Note: Compliance is mandatory irrespective of stakeholders willingness to accept greater reliability risk. See U.S. - Canada Power System Outage Task Force Final Report on the August 14, 2003 Blackout in the United States and Canada: Causes and Recommendations, April 2004.

8 - 34
Chapter 8: Delivery Infrastructure
PSE 2017 IRP
Needs Assessment Reports In total, five separate studies performed by four separate parties have confirmed the need to address Eastside transmission capacity:
• Electrical Reliability Study by Exponent, 2012 – City of Bellevue http://www.energizeeastsideeis.org/uploads/4/7/3/1/47314045/final_electrical_reliability_study_phase_ii_report_2012.pdf
• Eastside Needs Assessment Report by Quanta Services, 2013 – PSE https://energizeeastside2.blob.core.windows.net/media/Default/Library/Reports/Eastside_Needs_Assessment_Final_Draft_10-31-2013v2REDACTEDR1.pdf
• Supplemental Eastside Needs Assessment Report by Quanta Services, 2015 – PSE https://energizeeastside2.blob.core.windows.net/media/Default/Library/Reports/Eastside_Needs_Assessment_Final_Draft_10-31-2013v2REDACTEDR1.pdf
• Independent Technical Analysis by Utility Systems Efficiencies, Inc., 2015 – City of Bellevue http://www.energizeeastsideeis.org/uploads/4/7/3/1/47314045/cob_independent_technical_analysis_1-3.pdf
• Review Memo by Stantec Consulting Services Inc., 2015 – EIS consultant http://www.energizeeastsideeis.org/uploads/4/7/3/1/47314045/stantec_review_memo_eastside_needs_assessment_report.pdf
PSE NEEDS ASSESSMENT REPORTS, 201316 AND 2015.17 PSE transmission planning studies demonstrate that, under certain contingencies, the delivery system on the Eastside could not continue to meet reliability requirements without significant infrastructure upgrades. The Needs Assessment reports published in 2013 and 2015, which PSE performed pursuant to the mandatory federal transmission planning standards, identified four major areas of concern.
1. Overload of PSE facilities in the Eastside area. Studies identified potential overloading of transformers at Sammamish and Talbot Hill substations, and several 115 kV transmission lines routing power to the Eastside area are at risk of overloading under certain conditions.
2. Small margin of error to manage risks from inherent load forecast uncertainties.
PSE’s planning studies rely in large part on load forecast data. Imbedded in PSE’s load forecasts are several factors that include elements of risk. These include conservation, weather and block loads.
16 / A link to the 2013 report is provided above. 17 / A link to the 2015 report is provided above.

8 - 35
Chapter 8: Delivery Infrastructure
PSE 2017 IRP
• Conservation: To date, PSE customers have achieved 100 percent of the company’s conservation goals, which are very aggressive according to industry experts. If 100 percent of conservation goals are not achieved, then the transmission system capacity will be surpassed sooner than expected. 18
• Weather: PSE’s load forecast assumes “every other year” cold weather. (Some utilities take a more conservative approach, using the coldest and hottest weather in five or ten years, as inputs to system performance studies.19) If the region experiences weather extremes outside of those used in PSE’s planning studies, electricity demand will surpass the transmission system capacity sooner than expected.
• Block loads: These include large development projects that add significant load to the system. If block load growth increases more than anticipated, demand for electricity will surpass the transmission capacity sooner than expected.
3. Increased use and expansion of Corrective Action Plans (CAPs) to keep the
system compliant. CAPs are a series of operational steps used to prevent system overloads or loss of customers’ power. They are a short-term fix to alleviate potential operational conditions that could put the entire grid at risk. They protect against large-scale, cascading power outages; however, they can put large numbers of customers at increased risk of power outages. For example, to prevent winter overloads on the Talbot Hill transformer banks, PSE is already using CAPs, which increases outage risk to customers. As growth continues, additional CAPs will be needed. By Federal standards, CAPs are not intended to be long-term solutions to system deficiencies.
4. Impacts to interconnections identified by ColumbiaGrid. Though the need for Energize Eastside is driven by local demand, because the electric system is interconnected for the benefit of all, it is a federal requirement to study all electric transmission projects to ensure there are no material adverse impacts to the reliability or operating characteristics of PSE’s or any surrounding utilities’ electric systems. ColumbiaGrid, the regional planning entity, produces a Biennial Transmission Expansion Plan that addresses system needs in the Pacific Northwest, including the PSE system.
18 / PSE tested the conservation goals at 100%, 75%, 50%, and 0%. See the 2013 and 2015 Eastside Needs Assessment reports. 19 / For example ISO-NE have plans to a 90/10 or one in ten-year weather forecast.

8 - 36
Chapter 8: Delivery Infrastructure
PSE 2017 IRP
PSE’s 2015 Supplemental Needs Assessment Report confirmed the winter deficit findings in the 2013 Needs Assessment Report, stating that:
By winter of 2017‐18, there is a transmission capacity deficiency on the Eastside that impacts PSE customers and communities in and around Kirkland, Redmond, Bellevue, Issaquah, Newcastle, and Renton along with Clyde Hill, Medina, and Mercer Island... By winter of 2019‐20, at an Eastside load level of approximately 706 MW, additional CAPs are required that will put approximately 63,200 Eastside customers at risk of outages.
The 2015 Needs Assessment also confirmed that by summer of 2018, there would be a transmission capacity deficiency on the Eastside that impacts PSE customers and communities in and around Kirkland, Redmond, Renton, Bellevue, Issaquah and Newcastle along with Clyde Hill, Medina and Mercer Island. By summer of 2018, CAPs will be required to manage overloads under certain multiple contingencies, and the use of these CAPs will place approximately 68,800 customers at risk and could require 74 MW of load shedding, affecting approximately 10,900 customers at a time. Based on the 2015 Needs Assessment, if the Energize Eastside project gets delayed until after the summer of 2018, load shedding may be used as a corrective action plan to meet the mandatory reliability requirements defined by NERC. This could result in PSE having to turn the power off to tens of thousands of customers under certain forecasted conditions and would be necessary to prevent more widespread outages beyond the Eastside area. To further study this, in 2015 PSE commissioned Nexant to simulate three scenarios of rotating outages that could be needed if no action is taken to upgrade the Eastside’s transmission system. Nexant’s Energize Eastside Outage Cost Study determined that if PSE must use corrective action plans that include rolling blackouts, more than 130,000 customers could be impacted as early as the summer of 2018, at a cost of tens of millions of dollars to the local economy. Load shedding is not a practice that PSE or many other responsible utilities use unless absolutely necessary. Since load shedding adversely impacts residential, commercial and industrial customers, and surrounding cities, towns and neighboring communities, it is necessary and good utility practice to coordinate with cities, towns, municipal officials and emergency services, and to publicly inform those affected.
8 - 37
Chapter 8: Delivery Infrastructure
PSE 2017 IRP
CITY OF BELLEVUE-COMMISSIONED INDEPENDENT TECHNICAL ANALYSIS.20 The City of Bellevue contracted with Utility System Efficiencies, Inc. (USE) to perform an independent technical analysis (ITA) of the purpose, need and timing of the Energize Eastside project, and this study confirmed the capacity deficiency in the Eastside area. This independent analysis concluded that PSE followed industry practice in forecasting its demand load, incorporating the four major components of forecasting:
• PSE incorporated weather normalizing. The variables used in the weather normalization process were typical based on industry practice.
• PSE used typical data set elements and multiple data sources for its economic/demographic data, acquiring data at the county level, and for the Eastside area at the census-tract level, in order to differentiate growth rates within the service territory. Data on jobs and employment in the Eastside region were obtained by PSE from the Puget Sound Regional Council (PSRC) and the Washington State Office of Financial Management, and included census-tract-level analysis.
• PSE employed regression analysis at this step, an industry standard computer analysis technique, to determine the forecast before new conservation measures and block load adjustments.
• PSE acquired and developed significant end-user data via its IRP process. This includes over 4,000 Demand Side Resource (DSR) measures, incorporated National and State requirements on conservation and RPS, and optimized the achievable, technical measures with a resultant 100 percent conservation scenario which projects 135 MW of winter peak DSR by 2031. PSE gathered block load data and utilized short-term forecast adjustments (1-year ramp in based on certificates of occupancy and 2-year ramp out) to account for the impact on demand.
The ITA concluded that “PSE used reasonable methods to develop its forecast showing the Eastside area growing at a higher level [faster pace] than the county or system level.”
20 / A link to the City of Bellevue ITA is provided on page 30.

8 - 38
Chapter 8: Delivery Infrastructure
PSE 2017 IRP
In addition, the ITA addressed common questions about the project, including:
• Is the Energize Eastside project needed to address the reliability of the electric grid on the Eastside? The ITA determined, “YES.”
• If the load growth rate was reduced, would the project still be needed? The ITA determined, “YES.”
• If generation was increased in the Puget Sound area, would the project still be needed? The ITA determined, “YES.”
• Is there a need for the project to address regional flows, with imports/exports to Canada (ColumbiaGrid)? The ITA determined that by modeling zero flow to Canada, the project is still necessary to address local need.
SEPA ANALYSIS AND PROJECT NEED. In addition to the needs analyses described above, Energize Eastside’s environmental reviews also involved needs analyses. For example, during development of the State Environmental Policy Act (SEPA) Draft Environmental Impact Statement (EIS), a review memo summarized the EIS team subcontractor’s independent analysis of project need:
“...PSE[‘s] needs assessment was overall very thorough and applied methods considered to be the industry standard for planning of this nature. Based on the information that the needs assessment contains, I concur with the conclusion that there is a transmission capacity deficiency in PSE’s system on the Eastside that requires attention in the near future.” – DeClerck, Review Memo by Stantec Consulting Services Inc., July 31, 2015.21
21 / A link to the Stantec memo is provided on page 30.

8 - 39
Chapter 8: Delivery Infrastructure
PSE 2017 IRP
FERC FINDINGS AND CONCLUSION. In response to a complaint filed with the Federal Energy Regulatory Commission against PSE and others, specific to Energize Eastside, FERC dismissed the complaint, stating:
Based on the record before us, we find that Puget Sound [PSE] and the other Respondents complied with their transmission planning responsibilities under Order No. 890 in proposing and evaluating the Energize Eastside Project. – FERC Docket No. EL15-74-000, Order Dismissing Complaint, Issued Oct. 21, 2015.22
The FERC response also concluded:
We agree with Puget Sound [PSE] and ColumbiaGrid that the Energize Eastside Project was properly classified a Single System Project because it was designed to address Puget Sound’s projected inability to serve its own customers, ColumbiaGrid’s Puget Sound Area Study Team did not find any Material Adverse Impacts associated with the project, and ColumbiaGrid included the project as a Single System Project in its most recent 2015 Biennial Plan. Accordingly, we find that the Energize Eastside Project was proposed and evaluated in accordance with the then-applicable transmission planning requirements. – FERC Docket No. EL15-74-000, Order Dismissing Complaint, Issued Oct. 21, 2015.23
22 / https://energizeeastside2.blob.core.windows.net/media/Default/Library/Reports/ 2015_1021_FERC_OrderDismissingComplaint.pdf 23 / Ibid

8 - 40
Chapter 8: Delivery Infrastructure
PSE 2017 IRP
Requirements for Solutions to Meet Need Any solution to solve this deficiency must meet all NERC performance criteria, address all relevant PSE equipment overloads, and continue to meet the performance criteria for at least 10 years after construction. To define the solution, PSE developed criteria to evaluate potential solutions. The following excerpt is from Section 2.5.1 of the 2015 Solutions Study. ELECTRICAL PERFORMANCE CRITERIA
a. Must meet all performance criteria: • Applicable transmission planning standards and guidelines, including mandatory
NERC and WECC standards (NERC TPL-001-4 and WECC TPL-001-WECC-CRT-2) • Within study period (2015– 2024) • Less than or equal to 95 percent of emergency limits for lines • Less than or equal to 90 percent emergency limit for transformers • Normal winter load forecast with [both] 100 percent and 75 percent conservation • Normal summer load forecast with 100 percent conservation • Adjust regional flows and generation to stress cases similar to annual transmission
planning assessment • Take into account future transmission system improvement projects that are
expected to be in service within the study period • Minimal or no re-dispatching of generation24 • No load shedding • No new Remedial Action Schemes • No Corrective Action Plans
b. Must address all relevant PSE equipment violations c. Must not cause any adverse impacts to the reliability or operating characteristics of PSE’s
or surrounding systems d. Must meet performance criteria listed above for 10 or more years after construction with
up to 100 percent of the emergency limit for lines or transformers.
24 / See the Eastside Needs Assessment Report (October 2013)

8 - 41
Chapter 8: Delivery Infrastructure
PSE 2017 IRP
Alternatives Considered PSE studied a variety of potential solutions to resolve the Eastside transmission deficiencies; these included additional conservation, additional generation, demand response (DR), distributed generation (DG), energy storage, expansion of transmission substations, transmission line upgrades and new transmission lines. The results of these studies are documented in PSE’s Solutions Report (2014)25 and Supplemental Eastside Solutions Study Report (2015).26 Ultimately, the 2015 Solutions Study verified the findings of the 2014 Solutions Report, that the preferred solution to solve the Eastside’s transmission deficiencies was aggressive conservation combined with construction of a new 230/115 kV transformer and 230 kV line with associated ancillary facilities. The alternatives studied are summarized in Figure 8-10, and discussed in more detail in the following pages.
Figure 8-10 Summary of Alternatives and Technologies Studied
ALTERNATIVE STUDIED MEETS CRITERIA STUDIES AND REPORTS (Authors)
1. Additional conservation within
the Eastside Area
NO
2015 Solutions Study (PSE)
Non-wires Alternatives Screening Study (E3)
2. Additional generation within
the Eastside Area
NO
2015 Solutions Study (PSE)
3. Energy storage
NO
2015 Solutions Study (PSE)
Eastside System Energy Storage Alternatives Screening Study (Strategen)
4. Transmission line
reinforcements and transformer additions
YES
2015 Solutions Study (PSE)
5. Combination of solutions
NO
2015 Solutions Study (PSE)
25 / https://energizeeastside2.blob.core.windows.net/media/Default/Library/Reports /TransmissionSolutionStudyFebruary2014REDACTEDv2.pdf 26 / https://energizeeastside2.blob.core.windows.net/media/Default/Library/Reports/ SupplementalSolutionsReport_Redacted_May2015.pdf

8 - 42
Chapter 8: Delivery Infrastructure
PSE 2017 IRP
ALTERNATIVE 1 – ADDITIONAL CONSERVATION. PSE retained Energy and Environmental Economics, Inc. (E3) in 2014 to conduct a Non-wires Alternatives Screening Study.27 E3 included energy efficiency, demand response and distributed generation measures in its evaluation of cost-effective non-wires potential in the Eastside area. The study concluded that the cost-effective non-wires potential for the Eastside is not large enough to provide sufficient load reduction to allow even a 4-year deferral of Eastside transmission upgrade needs. The amount of additional conservation in the Eastside area required to avoid transmission upgrades ranged from a low of 138 MW to a high of 244 MW.28 The minimum conservation level of 138 MW was in addition to achieving 100 percent of the projected conservation for the entire PSE system (424 MW from the 2014 Load Forecast); the high level of 244 MW was in addition to achieving 75 percent of the projected conservation for the entire PSE system (318 MW from the 2014 Load Forecast). The study determined that the non-wires potential in the area, including energy efficiency, demand response and distributed generation measures did not represent a permanent solution to the need for the transmission upgrade options, nor was it sufficiently cost-effective to defer the need date for transmission upgrades while maintaining equivalent reliability levels. For more detail see the full report.
27 / https://energizeeastside2.blob.core.windows.net/media/Default/Library/Reports/ PSEScreeningStudyFebruary2014.pdf 28 / A 70 MW to 140 MW range was identified in the 2014 Solution Study. This level was sufficient to drop below 100 percent of the Talbot Hill transformer rating in winter of 2017/18. However, a valid solution requires a transformer loading of no more than 90 percent. Therefore, the 2015 Solution Study identified a higher level of conservation, which was sufficient to drop the loading level on the Talbot Hill transformers down to 90 percent under the worst contingency.

8 - 43
Chapter 8: Delivery Infrastructure
PSE 2017 IRP
E3’s valuation of deferral savings for the project is detailed in this excerpt from its report.

8 - 44
Chapter 8: Delivery Infrastructure
PSE 2017 IRP
Figure 8-11: King County Non-wires Potential vs. Reduction for Needed Deferral

8 - 45
Chapter 8: Delivery Infrastructure
PSE 2017 IRP
ALTERNATIVE 2 – ADDITIONAL GENERATION WITHIN EASTSIDE. PSE studied both conventional generation and distributed generation (DG) in its 2015 Solutions Study. To be effective, this alternative would require at least 300 MW of generation located in the Eastside area. Locating conventional generation of this size on the Eastside has major siting and environmental challenges. For DG to meaningfully impact the identified needs, DG must be installed in the right locations, available when needed and be of significant magnitude. Locating 300 MW or more of distributed renewable generation within the Eastside area by the winter of 2017/2018 was not practical. See the Supplemental Eastside Solutions Study reports (2014 and 2015) for more detail. ALTERNATIVE 3 - ENERGY STORAGE. PSE contracted with Strategen in 2015 to perform an Eastside System Energy Storage Alternatives Screening Study,29 which concluded that an energy storage system with power and energy storage ratings comparable to PSE’s identified need has not yet been installed anywhere in the world. In addition, Strategen determined that the existing Eastside transmission system does not have sufficient capacity to charge energy storage systems to a level sufficient to meet PSE’s operating standards. Based on the interconnection, permitting, procurement and construction timelines provided by PSE, project development for any energy storage configuration would take approximately four years, resulting in a mid-2019 online date. Private developers who are able to take on more project risk may be able to accelerate this cycle by approximately one year.
29 / http://www.energizeeastsideeis.org/uploads/4/7/3/1/47314045/eastside_system_energy_storage_ alternatives_screening_study_march_2015.pdf

8 - 46
Chapter 8: Delivery Infrastructure
PSE 2017 IRP
Strategen evaluated a baseline configuration and two alternatives that also included non-wires measures.
• Strategen estimated that the Baseline Configuration to defer the Eastside transmission system upgrade through 2021 would cost ratepayers approximately $1.44 billion in net present value (NPV) terms, based on PSE’s revenue requirement; however, the Baseline configuration is not technically feasible.
• Alternate Configuration #1 would cost ratepayers approximately $264 million in NPV terms, based on PSE’s revenue requirement. Cost-effectiveness value was derived primarily from the system capacity, flexibility and oversupply reduction benefits for PSE’s customers. (Carbon emission reduction is another benefit, but it is currently non-monetizable.) With a benefit-cost ratio of approximately 1.13, this configuration does appear to be cost-effective, but it does not meet the reliability requirements for the solution.30
Neither Alternative #1 nor Alternative #2 appears capable of meeting PSE’s target online date of 2017/2018. The cost-benefit ratio for the Baseline and Alternative #2 were not calculated because they were not technically feasible. Figure 8-12 presents the capital cost estimates from the E3 report. See the 2014 PSE Screening Study by E3 for details.
30 / Per the 2015 Strategen report, “The Baseline Configuration (a 328 MW / 2,338 MWh storage system) is not technically feasible because the existing Eastside transmission system does not have sufficient capacity to fully charge the system.”

8 - 47
Chapter 8: Delivery Infrastructure
PSE 2017 IRP
Figure 8-12: Energy Storage Configuration Summary
ALTERNATIVE 4 - TRANSMISSION LINE REINFORCEMENTS AND TRANSFORMER ADDITIONS. Combinations of ten transmission line reinforcements and seven transformer additions were reviewed in PSE’s 2015 Solutions study as potential solutions to the Eastside transmission deficiency. These transmission line and transformer addition locations are shown in Figure 8-13. PSE determined that a wires option to construct a new 230/115 kV transformer and 230 kV line with associated ancillary facilities is the preferred solution to solve the Eastside’s need.

8 - 48
Chapter 8: Delivery Infrastructure
PSE 2017 IRP
Figure 8-13: Transmission and Transformer Addition Locations for Energize Eastside

8 - 49
Chapter 8: Delivery Infrastructure
PSE 2017 IRP
ENVIRONMENTAL IMPACT STATEMENT PROCESS. The Energize Eastside project is undergoing environmental review, which includes preparation of a Washington State Environmental Policy Act (SEPA) Environmental Impact Statement (EIS). The Phase 1 and Phase 2 Draft EIS evaluated the Energize Eastside alternatives studies, a “No Action” Alternative (as required by SEPA), and three other “action alternatives.” These alternatives were developed by the partner cities in cooperation with PSE, with the intent of providing options that could attain or approximate PSE objectives for the project at a lower environmental cost. The No Action Alternative provides a benchmark against which the proposed project and other action alternatives can be compared. In 2015, PSE commissioned Nexant to simulate three scenarios of rotating outages that could be needed if no action is taken to upgrade the Eastside’s transmission system. Nexant determined that if PSE must use corrective action plans that include rolling blackouts, more than 130,000 customers could be impacted as early as the summer of 2018, at a cost of tens of millions of dollars to the local economy. The table below shows the results of the study, which highlights the number of customers and economic impacts of rotating outages.
Figure 8-14: Summary of Outage Cost Analysis by Nexant
8 - 50
Chapter 8: Delivery Infrastructure
PSE 2017 IRP
• Scenario #1 includes the 230 kV overhead lines, but also includes options for locations, including underground and underwater options. Of these options, the EIS team only carried forward PSE’s preferred option of a new substation and 230 kV transmission line.
• Scenario #2 includes a variety of solutions that would require very limited new transmission lines next to existing substations. These would need to be implemented in combination in order to meet the project objectives. The EIS team did not carry this option forward as the solutions do not meet the project objectives, and they would rely heavily on voluntary customer actions in some cases.
• Scenario #3 would involve installing enough 115 kV lines and transformers to address the project objectives without building 230 kV lines. This option was not carried forward for further analysis.31
PSE’s Preferred Alternative After extensive study and evaluating and re-evaluating dozens of alternatives both independently and through the Phase I Draft EIS, PSE determined that the most effective solution that meets all criteria and complies with the federal performance requirements is the addition of a 230 kV/115 kV transformer in the center of the Eastside load area. This new transformer would be connected to new 230 kV transmission lines constructed between the Sammamish (Redmond) and Talbot Hill (Renton) substations along with continued aggressive conservation – the Energize Eastside project. This involves constructing a new 230 kV to 115 kV substation, called Richards Creek, to be located on PSE-owned parcel 1024059130 in Bellevue. The Richards Creek substation property is located immediately south of the existing Lakeside 115 kV substation, which is situated on parcel 1024059083 in Bellevue. The new Richards Creek 230 kV to 115 kV transformer will provide a new electrical capacity source for the Eastside area. To connect the transformer, PSE will replace two existing 115 kV lines that were last upgraded in the 1960s with two 230 kV lines. Operating both lines at 230 kV has the lowest potential for interaction with the petroleum product pipelines that share the transmission line corridor. Electricity will be transmitted to the Richards Creek substation at 230 kV and then the voltage will be lowered (“stepped down”) to 115 kV for distribution to customers on the Eastside.
31 / Per the Phase 2 DEIS: “acquisition of up to 60 miles of right-of-way for new 115 kV lines would likely result in some displacement. Delays due to the legal steps required for such acquisition, which could include condemnation, would not meet the project objectives for timeliness to meet reliability requirements. For these reasons, this alternative was not carried forward.”

8 - 51
Chapter 8: Delivery Infrastructure
PSE 2017 IRP
The existing transmission lines are located in PSE’s Sammamish – Lakeside – Talbot Hill corridor, which was established in the late 1920s and early 1930s. Within this existing corridor, the proposed pole locations for the rebuilt lines will generally be in the same locations as the existing poles. In some instances, there may be advantages to moving pole locations to accommodate landowner preferences and/or reduce potential environmental impacts (for example, to move existing pole locations out of wetlands). These facilities are needed to address the deficiency in electrical transmission capacity during peak periods that PSE identified through its system planning process. This project will improve reliability for Eastside communities and supply the needed electrical capacity for growth and development on the Eastside. Engaging the Community on Energize Eastside In today’s increasingly connected and rapidly changing environment, PSE recognizes the need for openness and transparency so that interested parties are able to quickly access relevant expertise and information. Since launching the Energize Eastside project in December 2013, PSE has engaged the Eastside community in a robust public involvement process. This process has included mailings, public meetings and direct outreach efforts to ensure that stakeholders are informed about the project and have had plentiful and diverse opportunities to participate. PSE’s public involvement process, especially with regards to routing, has been conducted over and above formal environmental review and permitting requirements. To date, public outreach and involvement has included:
• 22 Community Advisory Group-related meetings • 6 public open houses, 2 question and answer sessions, and 2 online open houses at key
project milestones • 500+ briefings with individuals, neighborhoods, cities and other stakeholder groups • More than 2,900 comments and questions received • 30+ email updates to more than 1,500 subscribers • 8 project newsletters to 55,000+ households • Ongoing outreach to 500+ property owners, including door-to-door and individual
meetings • Participation in 16 EIS-related public meetings

8 - 52
Chapter 8: Delivery Infrastructure
PSE 2017 IRP
In addition, PSE’s Energize Eastside website provided project updates and functioned as a repository for project materials, including maps, technical studies like the need and solution studies, the Community Advisory Group Final Report, fact sheets on a wide range of topics, newsletters, meeting summaries and other materials. An overview of the public engagement process follows. PHASE 1: PUBLIC ROUTE DISCUSSION (2014). To provide a forum that would generate robust input from diverse community stakeholders, PSE convened a Community Advisory Group to consider community values when evaluating transmission line route options. The advisory group spent a year learning about the Eastside’s electrical system, participating in meetings and workshops and evaluating 18 route options identified by PSE. In addition to the Community Advisory Group, PSE involved the community through public meetings, neighborhood meetings, briefings and comments, which provided Eastside residents opportunities to share their community values and ask initial questions about the project. For details about the advisory group process, review the Community Advisory Group Final Report (2015).32 PHASE 2: FIELDWORK AND ENVIRONMENTAL REVIEW (2015 – TODAY). In 2015, PSE began collecting field information necessary for design and environmental review. PSE kept stakeholders informed about these fieldwork activities to ensure residents knew when crews were expected to perform surveys near their homes and businesses. In 2015, the project began environmental review, which includes preparation of a Washington State Environmental Policy Act Environmental Impact Statement. The City of Bellevue leads the EIS process in cooperation with Newcastle, Kirkland, Redmond and Renton. The SEPA process is a separate regulatory requirement that must be completed before any permits may be issued and includes public involvement milestones. PSE has provided supplemental EIS notifications about major milestones and comment periods to keep stakeholders informed and to support community engagement. In addition, PSE has participated in eight scoping meetings and eight draft EIS hearings over the two-phased EIS process. The Final EIS is anticipated in early 2018.
32 / https://energizeeastside2.blob.core.windows.net/media/Default/CAG/ 2015_0114_Energize_Eastside_CAG_Final_Report_FINAL_for_web.pdf

8 - 53
Chapter 8: Delivery Infrastructure
PSE 2017 IRP
PHASE 3: PROPERTY-OWNER CONSULTATIONS (2016 – TODAY). As project design progressed, PSE began reaching out to individual property owners to share information and answer questions. In spring 2016, the project team visited neighborhoods along the existing corridor and Factoria area in Bellevue to talk with residents and business owners about the project. This door-to-door outreach was conducted to help inform customers about the project status and to address questions and concerns from property and business owners. In September 2016, PSE began meeting with property owners and tenants along the existing corridor to discuss property-specific design and tree replacement plans. We shared our current design for that specific property, including pole locations and how we plan to access those locations during construction. These conversations have helped us refine our project design and better understand customer interests and concerns. In May 2017, PSE began meeting with property owners to begin developing property-specific landscaping and tree replacement plans with property owners. We are currently reaching out to affected property owners about these efforts. FUTURE PHASES: PERMITTING AND CONSTRUCTION. PSE expects to begin submitting permit applications in summer 2017 to keep the project moving forward. We value the community's input and ongoing interest in the project, and PSE is committed to keeping property owners and the community informed about its progress. Visit the project website at www.energizeeastide.com for the latest information and for more details about how the public has been involved in Energize Eastside.

8 - 54
Chapter 8: Delivery Infrastructure
PSE 2017 IRP
Gas Infrastructure Plan
Pressure Regulation Stations In the next decade PSE plans to build or upgrade approximately 7 Northwest Pipeline-supplied gate or limit stations and 16 district regulator stations to serve load as existing station capacity is exceeded. Pipelines In the next decade, PSE expects to add approximately 24 miles of high pressure main and 23 miles of intermediate pressure main as loads grow in our service area. Ongoing Maintenance As with the electric system, PSE is continually addressing aging gas infrastructure within the system in accordance with regulatory requirements and operating practices. In the next decade, PSE plans to replace 200 to 300 miles of gas main that is reaching the end of its useful life. As mentioned above, PSE anticipates replacing its current aging and obsolete Automated Meter Reading (AMR) communication system and gas customer modules with Advanced Metering Infrastructure (AMI) technology to enable smart grid enhancements and future customer offerings.
Figure 8-15: Summary of 10-year Gas Infrastructure Plan
ASSET NUMBER LOCATION
New High Pressure Main 24 miles System-wide
New Intermediate Pressure Main 23 miles System-wide
Gate or Limit Station Upgrades Seven System-wide
District Regulation Sixteen System-wide
Gas Main Replaced 200-300 miles System-wide

8 - 55
Chapter 8: Delivery Infrastructure
PSE 2017 IRP
Planned Gas Supply System Improvements PSE has included higher pressure projects that are associated with the operations at greater than 250 psig and which are significant in cost due to complexity. In this discussion, these are defined as costing $10 million or greater over the next 10 years. PROJECTS COMPLETED SINCE LAST 2015 IRP. (Information on a variety of projects completed within the last six months can be found on PSE’s website at https://pse.com/inyourcommunity/pse-projects/system-improvements/Pages/Completed-improvements.aspx.)
1. Tolt Pipeline (Phase 1)33 Date of Operation: 2015-2018 The project is intended to provide additional capacity and reliability to serve the growth from Bothell/Woodinville to Bellevue. Phase 1 of the project involves constructing 2.8 miles of 16-inch high pressure main.
FUTURE PROJECTS
2. North Seattle Reinforcement Projects Estimated Date of Operation: 2020+ This collection of projects will increase capacity and reliability to serve existing load and growth in the north Seattle area, from Lynnwood to southern Seattle. These projects are in the planning phase and consist of upsizing or adding new high pressure main and regulation.
3. South Tacoma Distribution Upgrades
Estimated Date of Operation: 2020+ This collection of projects will increase capacity and reliability to serve growth in the Tacoma area, from Tacoma to DuPont and Bonney Lake. These projects are in the design phase, which consists of upsizing, looping or adding new intermediate pressure main.
4. Tolt Pipeline (Phase 2)34
Estimated Date of Operation: 2020+ Phase 2 of this project will increase capacity and reliability to serve growth in the greater Eastside area, from Bothell/Woodinville to Bellevue. Phase 2 of the project involves constructing 1.2 miles of 16-inch natural high pressure main.
33 / https://pse.com/inyourcommunity/pse-projects/system-improvements/Pages/Tolt-Natural-Gas-Line-Project.aspx 34 / https://pse.com/inyourcommunity/pse-projects/system-improvements/Pages/Tolt-Natural-Gas-Line-Project.aspx

8 - 56
Chapter 8: Delivery Infrastructure
PSE 2017 IRP
Areas of Future Focus PSE will continue to improve the gas system planning process as more data regarding demand and conservation potential becomes available with technologies such as Advanced Metering Infrastructure. As technologies mature, alternatives will be refreshed and reevaluated when necessary. Generally, alternatives to date are various infrastructure solutions such as uprating, regulation or pipeline upgrades. Due to the complexity of larger planned system improvement projects the first gate of project development known as Initiation will refine the need and reconfirm preliminary alternatives and solutions and consider implementation challenges and new information. This process targets needs that are more than four to five years out in order to provide adequate review and engagement. This process will improve as PSE matures its ability to predict localized circuit-level load growth and conservation potential. Additionally, the incorporation of learnings about alternative technologies and applications will be important as well.

8 - 57
Chapter 8: Delivery Infrastructure
PSE 2017 IRP
6. CHALLENGES AND OPPORTUNITIES
New Regulations
Regulatory compliance is a significant driver of PSE infrastructure investment, but it is difficult to anticipate what rules may be adopted in the future or to predict how they may impact spending on our delivery systems. The following examples from the last decade illustrate the kind of expenditures that regulatory activity can necessitate. Gas System Beginning with the Pipeline Safety Improvement Act (PSIA) of 2002 and again in 2006 with the Pipeline Inspection, Protection, Enforcement, and Safety (PIPES) Act, Congress has directed the Pipeline and Hazardous Materials Safety Administration to increase the strength of integrity management programs that cover natural gas transmission and distribution pipelines. These programs require PSE to perform detailed inspections and analysis of pipeline systems to gain more knowledge of pipeline integrity risks and to devise measures to mitigate these risks. Numerous actions have resulted from these requirements, including expanded pipe replacement programs, enhanced damage prevention activities and increased inspection intervals. These expanded pipe replacement programs have increased both the number and footage of projects. Pipeline safety incidents which have occurred across the country continue to focus the attention of state and federal regulators and lawmakers on improving pipeline and public safety performance. Proposed legislation includes:
• expanding the mileage of pipelines subject to more rigorous inspection and testing,
• requiring the use of automatic and remote controlled shut-off valves,
• expanding the use of excess flow valves, and
• requiring more timely notification of pipeline incidents.
All would require additional investment in processes and infrastructure to support compliance.
8 - 58
Chapter 8: Delivery Infrastructure
PSE 2017 IRP
Electric System In 2007, new regulations mandated by The Energy Policy Act of 2005 became effective and enforceable by regional electric reliability organizations. This act was triggered by concern about the robustness and reliability of nation’s electrical grid, and it moved the industry into an era in which system planning, performance and operating requirements are no longer voluntary, but mandated by law and audited and enforced by fines and sanctions. At minimum, the PSE Bulk Electric System must be planned and operated to comply with these new reliability standards. As a result, PSE is making significant investments in both hardware and software assets for the portions of our system operating above 100 kV. Regulations of the type affecting the Bulk Electric System are not currently present on the distribution system. However, distribution planning continues to be of interest in state legislative proceedings and with regulators. Current proposed legislation would establish a new reporting requirement for utilities to define a plan to foster the application and use of distributed generation. New drone technology and FAA regulations have the potential to gather system information that may be useful in future planning exercises. PSE began evaluating areas where this technology may be utilized in 2015/2016.
Maturing System Alternatives
Finding optimal solutions to energy delivery system problems is a priority for PSE, and we are piloting and implementing several maturing technologies and alternatives that have the potential to help meet today’s challenges and future challenges. While some technologies are mature enough for customer applications, the scalability and integration for meeting system needs is still maturing for the utility. Distributed energy resources have been considered by PSE for many years in the planning model, and as they mature they will become more viable to offset the reliability of traditional infrastructure solutions. Customer reliability and rates are key considerations to intentionally advancing these ideas so that no harm comes from applications that are not effectively scalable. Informing customers and stakeholders about the capability and viability of these technologies is also an important priority for PSE.
8 - 59
Chapter 8: Delivery Infrastructure
PSE 2017 IRP
Smart Grid Technologies Smart Grid is a term used to describe the integration of intelligent devices and new technologies into the electrical grid that promote self-healing and enable customer choice to a degree not possible with the grid’s original infrastructure. At a basic level, these technologies are a networked group of generators, storage systems, sensors and control systems that allow for an optimized response to changes. The solutions are highly complex and require new technology integrations, complementary tariffs and policies governing their use, and extensive reengineering of business processes and work practices. PSE’s objectives for the smart grid include the abilities to: meet customer expectations for service and product offerings, improve reliability, find alternatives to serving energy needs, increase operational efficiencies, and improve communication and usage information for customers. PSE has set forth plans for a smart grid in the biennial Smart Grid Technology Report35 filed with the WUTC in 2016. PSE will leverage existing investments in smart grid technologies while expanding the foundational elements to more fully integrate smart grid technology. PSE will demonstrate the value of smart grid technology in both targeted locations as well as in field test beds. Demonstrations in the targeted locations will focus on technology that is more mature and ready for expanded implementation throughout our service area such as distribution automation, advanced meter infrastructure (AMI) and conservation voltage reduction. To evaluate more cutting edge and complex technologies and test the interplay and impacts that these technologies have when combined, field test beds will be conducted in small, neighborhood-sized sections of our service area. PSE is planning for distributed generation integration and control, coupled with demand response and voltage optimization. These technologies, when successfully implemented, are the cornerstones of a smart grid. As they are implemented together successfully, PSE will look to expand to more locations.
35 / https://www.utc.wa.gov/docs/Pages/DocketLookup.aspx?FilingID=161048
8 - 60
Chapter 8: Delivery Infrastructure
PSE 2017 IRP
To accomplish this vision, PSE will pull from decades of experience with grid technologies, many of which were cutting edge implementations at their time, including its use of transmission automation, AMR and system-wide SCADA. With implementation and improvements to Outage Management System (OMS), Geographical Information System (GIS) and Customer Information System (CIS), Energy Management System (EMS), and Internet Protocol (IP) based Supervisory Control and Data Acquisition (SCADA) network, PSE will be able to further advance operation and efficiency. Current work includes replacement of the aging AMR system with an AMI system capable of command and control which will increase the viability of alternatives that save energy and defer or delay traditional infrastructure; investigation of an advanced distribution grid management system (ADMS) that will facilitate control of distribution assets for distribution automation, voltage optimization and distributed generation integration; and continued replacement of PSE’s legacy analog networks and obsolete remote telemetry unit equipment. Distributed Generation Distributed generation (DG) is the incorporation of small-scale generation into the electric grid close to where its users are (close to load). Many such sources exist: internal combustion engines, fuel cells, gas turbines and micro-turbines, hydro and micro-hydro applications, photovoltaics, wind energy, solar thermal energy and waste/biomass. The collective impact of distributed generation has the potential to reduce demand for large-scale electric power generation and the associated infrastructure requirements, and it could offer alternatives to load and reliability concerns at the circuit level. PSE has incorporated distributed generation into its planning process for many years, but the maturity of the technology and grid created barriers to implementing DG as a cost-effective alternative to system improvements; however, the maturity of the technology is increasing. PSE has already responded to over 4,000 customers who have interconnected distributed renewable generators under 100 kW (mostly solar), and the number of requests is increasing annually. Also, several customers have participated in tariffs to interconnect larger generators sized between 100 kW and 5 MW; these interconnections follow an established procedure and timeline for study and cost assignment. PSE has interconnected 20 such customers so far. Most interconnections thus far desire to redirect surplus back on to the grid which requires reliable infrastructure to make that happen. Additionally, while the growing interconnections will offset total load, peak load reduction is less likely because PSE’s peak loads often occur outside of daylight hours when solar generators are not producing. PSE sizes the delivery system to meet peak loads; however, the growing use of energy storage may influence the ability for DG to impact peak loads.

8 - 61
Chapter 8: Delivery Infrastructure
PSE 2017 IRP
Distributed generation in PSE’s service territory has not yet triggered significant impacts to the grid resulting from the two-way power flow, but several challenges arising from distributed generation have yet to be fully addressed. The upstream impacts of the two-way flow require a different approach to protection and control systems. PSE is also monitoring the impact of inverter technology on power quality. Even a modest amount of distributed generation requires the distribution grid to be equipped to manage power quality, thermal and mechanical limits of the grid elements, power system stability and the security of supply. Research in states that experience high penetrations of distributed generation points to several technologies that support its adoption. These include smart inverter technology, distributed generation control systems, upgrading and uprating distribution grid elements, and integrated storage. Energy Storage PSE’s experience with grid-scale energy storage started with a 2MW project in the town of Glacier, Wash., in Whatcom County. To integrate this storage component, PSE needed to invest in protection upgrade at the substation, replacing the substation fuses with a circuit switcher. In addition, because the storage system required communications with the central energy management control system, PSE needed to install adequate communication networks to enable this communication. PSE’s 2 MW battery will support about 150 customer homes for a day. The vision for the battery is to perform peak shaving, frequency support and local outage mitigation. The battery has demonstrated its capabilities with regard to peak shaving and frequency support, and PSE is still working to demonstrate the ability to provide local outage mitigation. Because the town of Glacier is fed by a radial transmission line and radial distribution system, when either of these lines experiences an outage, there is no redundancy or backup available to mitigate the outage. Before power can be restored, repairs must be made to the lines. The battery may provide a new alternative, if it can provide power to the town when damage occurs to the transmission line or certain sections of the distribution lines. Otherwise, alternatives for redundancy are to bring in new transmission lines and add feeder ties to other substations, but in a remote area like Glacier, adding these new circuits would require many miles of new lines, an option for which the costs outweigh the benefits. Hence, a battery that can mitigate a subset of the outages offers a unique opportunity. (Read more about energy storage in Appendix L.). Unlike a distributed generator, energy storage acts as a load on the grid as well as a generation source. PSE will need to consider how charging the battery impacts the demands on the grid. Additionally, robust and reliable infrastructure will still be required to support alternatives such as siting large batteries to feed partial or entire circuits or siting many small batteries to feed several houses.

8 - 62
Chapter 8: Delivery Infrastructure
PSE 2017 IRP
Conservation Voltage Reduction Reducing the voltage at an end-user’s site by a small percentage can result in energy savings without compromising the operation of customers’ equipment. PSE began a conservation voltage reduction (CVR) pilot program in conjunction with Northwest Energy Efficiency Alliance (NEEA) in 2006 implementing a pilot study of 10 residential customers that achieved a 2 percent energy savings with no adverse effects. Results on more recent PSE projects are showing an average of 1.5 percent energy savings on the substation circuits. Since then, PSE has implemented CVR at six substations. Implementation involves three categories of work: installation of AMI meters to measure voltage near the end of the line, phase balancing and adjusting voltage settings at the substation transformer and line regulators. Because CVR relies on AMI metering to measure voltage, so far the implementation has been viable in areas where PSE has piloted AMI network and metering in advance of full AMI implementation. As full AMI implementation is completed, changes to IT systems and business processes will provide the opportunity to implement CVR more broadly across PSE service territory over the next 5 to 10 years. This will improve the viability of CVR as an alternative to implementing traditional infrastructure or generation solutions to address local capacity concerns. Demand Response Alternatives When demand for power is at its highest and customers reduce their energy use in response, utility energy delivery system planners call this demand response (DR). Based on estimated demand response capacity for residential, commercial and industrial customer sectors in our 2007 and 2009 IRPs, PSE developed two voluntary demand response pilots, one for residential loads that was conducted from 2009 to 2011, and one for commercial/industrial loads that was conducted from 2008 to 2010. In the 2015 IRP, the analysis found demand response to be a cost-effective resource in the demand-side portion of the portfolio. Based on those findings, PSE has moved forward with an acquisition strategy for demand response.

8 - 63
Chapter 8: Delivery Infrastructure
PSE 2017 IRP
The acquisition strategy for DR includes consideration of the technology and management needed to ensure response is effective. Viability at the local or circuit level as an alternative to traditional infrastructure solutions will depend on the confidence we have in managing this program. PSE anticipates increasing utilization of DR over time. As with CVR, the fully implemented AMI system, with its improved technology and two-way communication, will facilitate more meaningful progress in implementing DR. Electric Vehicles PSE’s customers are adopting electric vehicles (EV). In 2014, PSE launched a pilot program to collect interval energy usage data from EV owners. Over 1,100 customers have joined the pilot, providing PSE with a large population of data points. This information is used to develop load curves which will ultimately inform cost of service, distribution system impacts, and generation and transmission system impacts. We have developed estimates of expected energy needs, performed initial assessment of distribution impacts on select circuits, and performed some tests on the effectiveness of curtailed charging. EVs are not specifically an alternative to traditional infrastructure or generation, but the future penetration and load impact must be considered and managed effectively. To date, PSE has determined that EVs pose minimal impacts to generation and transmission systems in the short run. Near-term distribution system impacts are small and likely manageable. In significant numbers, the additional loads from EVs could enhance the efficiency and economics of operating the electric system, with greater results achieved by encouraging off-peak charging when the system has spare capacity. However, unmanaged (through tariff incentives, for example), the peak demand on a specific circuit may increase significantly and actually drive infrastructure. PSE is working with the EV community to prepare effectively as adoption increases.