dell confidential 1 green it solutions. green is everywhere dell confidential 2
TRANSCRIPT
DELL CONFIDENTIAL 1
GREEN IT SOLUTIONS

GREEN IS EVERYWHERE
DELL CONFIDENTIAL 2
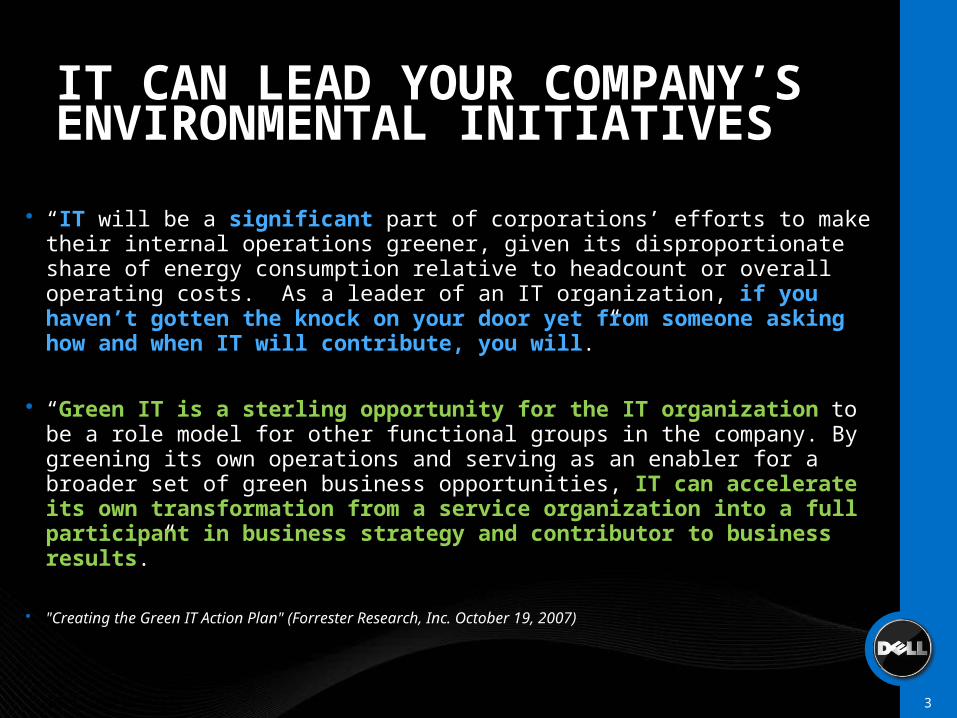
IT CAN LEAD YOUR COMPANY’S ENVIRONMENTAL INITIATIVES
“IT will be a significant part of corporations’ efforts to make their internal operations greener, given its disproportionate share of energy consumption relative to headcount or overall operating costs. As a leader of an IT organization, if you haven’t gotten the knock on your door yet from someone asking how and when IT will contribute, you will.”
“Green IT is a sterling opportunity for the IT organization to be a role model for other functional groups in the company. By greening its own operations and serving as an enabler for a broader set of green business opportunities, IT can accelerate its own transformation from a service organization into a full participant in business strategy and contributor to business results.”
"Creating the Green IT Action Plan" (Forrester Research, Inc. October 19, 2007)
DELL CONFIDENTIAL 3
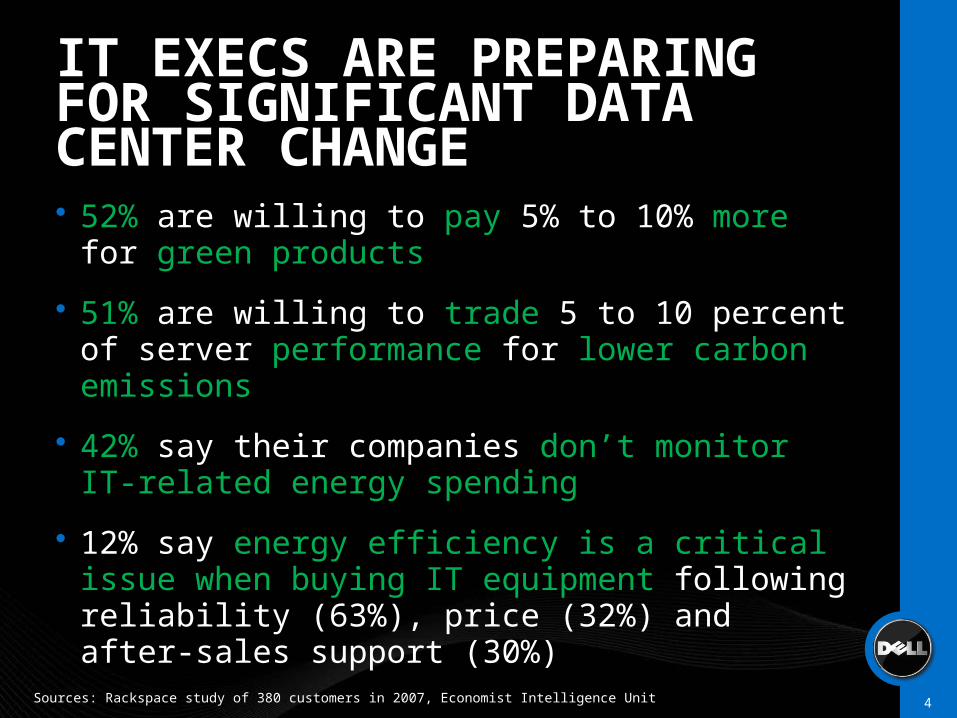
IT EXECS ARE PREPARING FOR SIGNIFICANT DATA CENTER CHANGE 52% are willing to pay 5% to 10% more for green
products
51% are willing to trade 5 to 10 percent of server performance for lower carbon emissions
42% say their companies don’t monitor IT-related energy spending
12% say energy efficiency is a critical issue when buying IT equipment following reliability (63%), price (32%) and after-sales support (30%)
DELL CONFIDENTIAL 4Sources: Rackspace study of 380 customers in 2007, Economist Intelligence Unit

ACHIEVING YOUR ORGANIZATION ITS GREEN OBJECTIVES
CONTRIBUTE TO CORPORATE SOCIAL RESPONSIBILITY AND GREEN INITIATIVES
REDUCE OVERALL ELECTRICITY CONSUMPTION AND SPEND
IMPROVE UTILIZATION OF IT EQUIPMENT
Creating the Green IT Action Plan" (Forrester Research, Inc. October 19, 2007)
DELL CONFIDENTIAL 5
DELL CONFIDENTIAL 6
POWER & COOLING SOLUTIONS
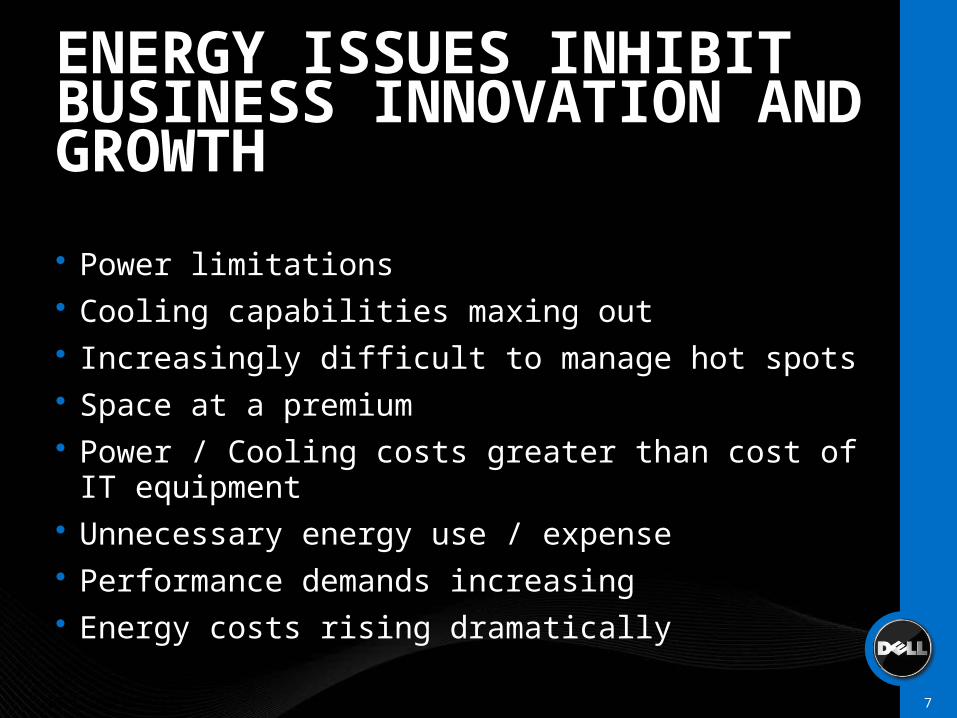
ENERGY ISSUES INHIBIT BUSINESS INNOVATION AND GROWTH
Power limitations Cooling capabilities maxing out Increasingly difficult to manage hot spots Space at a premium Power / Cooling costs greater than cost of IT
equipment Unnecessary energy use / expense Performance demands increasing Energy costs rising dramatically
DELL CONFIDENTIAL 7
DELL CONFIDENTIAL 8
THE POWER & COOLING CHALLENGE
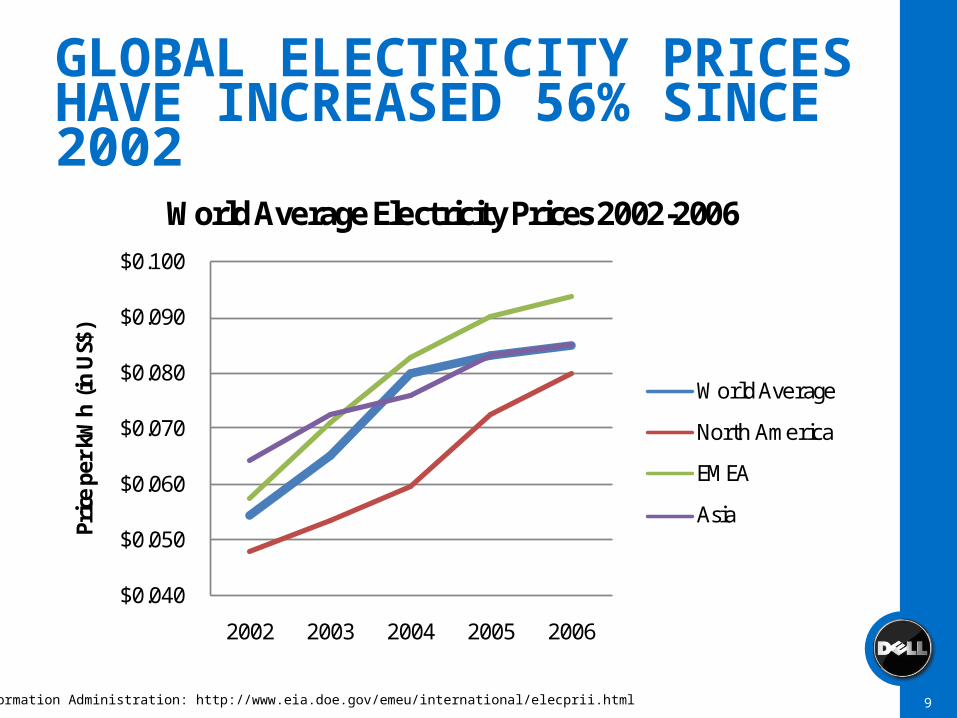
GLOBAL ELECTRICITY PRICES HAVE INCREASED 56% SINCE 2002
DELL CONFIDENTIAL 9Energy Information Administration: http://www.eia.doe.gov/emeu/international/elecprii.html
$0.040
$0.050
$0.060
$0.070
$0.080
$0.090
$0.100
2002 2003 2004 2005 2006
Pric
e pe
r kW
h (in
US$
)
World Average Electricity Prices 2002-2006
World Average
North America
EMEA
Asia
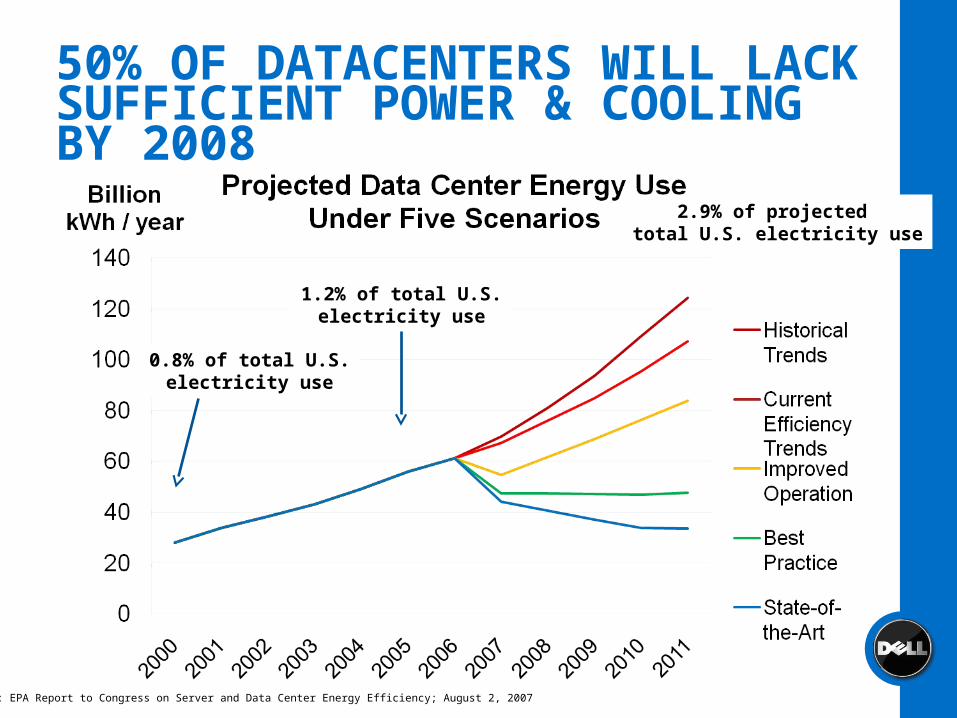
50% OF DATACENTERS WILL LACK SUFFICIENT POWER & COOLING BY 2008
Source: EPA Report to Congress on Server and Data Center Energy Efficiency; August 2, 2007
2.9% of projected total U.S. electricity use
1.2% of total U.S.electricity use
0.8% of total U.S.electricity use
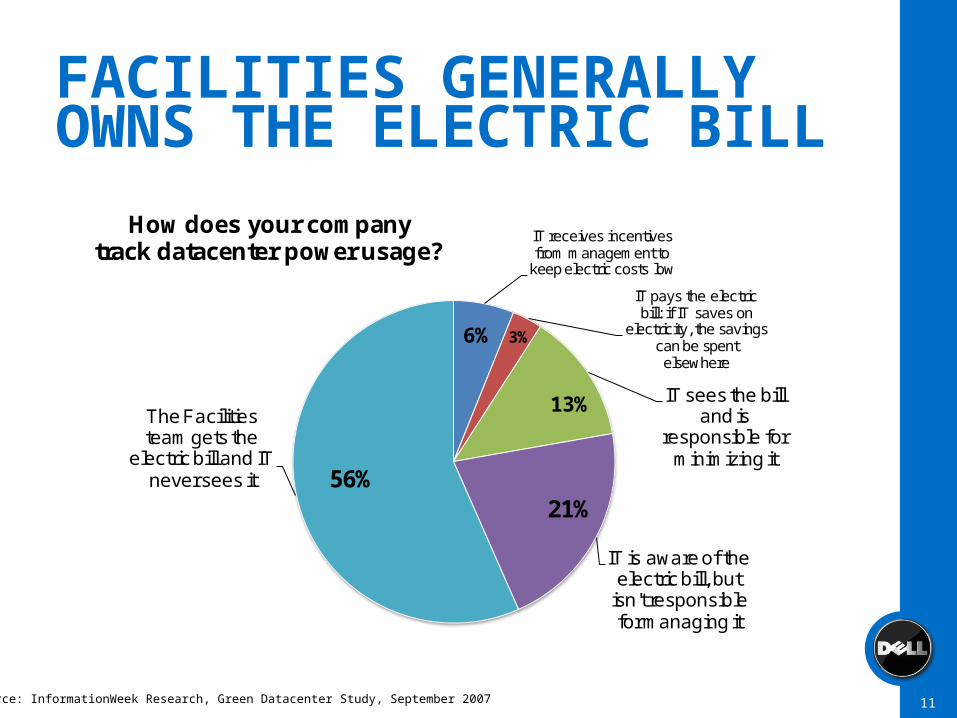
FACILITIES GENERALLY OWNS THE ELECTRIC BILL
DELL CONFIDENTIAL 11Source: InformationWeek Research, Green Datacenter Study, September 2007
IT receives incentives from management to
keep electric costs low
IT pays the electric bill: if IT saves on
electricity, the savings can be spent elsewhere
IT sees the bill and is
responsible for minimizing it
IT is aware of the electric bill, but
isn't responsible for managing it
The Facilities team gets the
electric bill and IT never sees it
How does your company track datacenter power usage?
56%
6% 3%
13%
21%
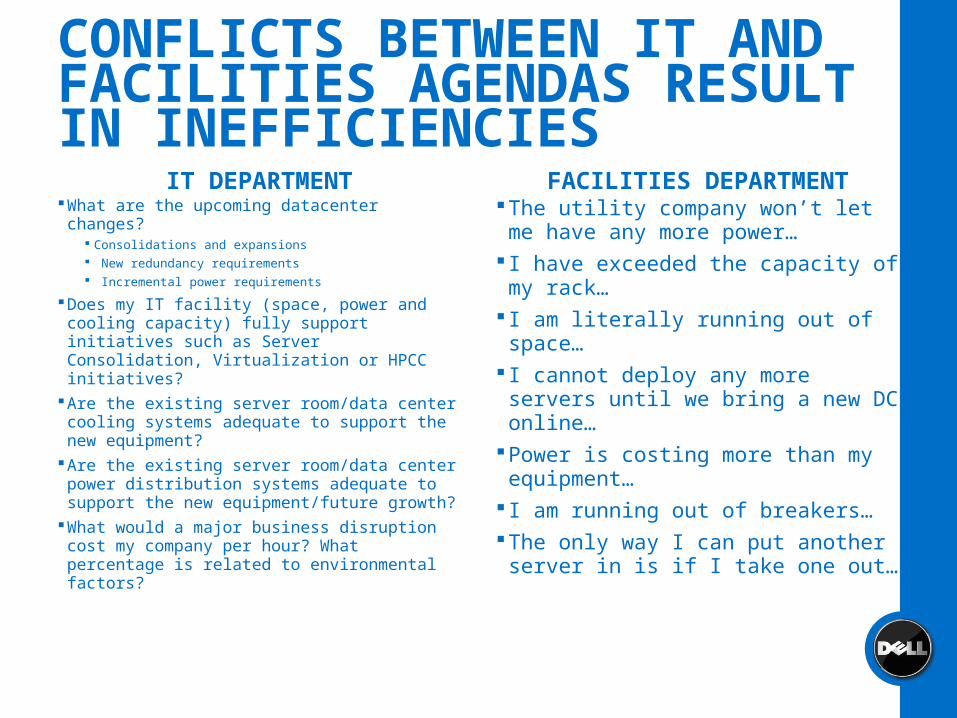
CONFLICTS BETWEEN IT AND FACILITIES AGENDAS RESULT IN INEFFICIENCIES
IT DEPARTMENTWhat are the upcoming datacenter changes?
Consolidations and expansions New redundancy requirements Incremental power requirements
Does my IT facility (space, power and cooling capacity) fully support initiatives such as Server Consolidation, Virtualization or HPCC initiatives?
Are the existing server room/data center cooling systems adequate to support the new equipment?
Are the existing server room/data center power distribution systems adequate to support the new equipment/future growth?
What would a major business disruption cost my company per hour? What percentage is related to environmental factors?
FACILITIES DEPARTMENTThe utility company won’t let me have
any more power… I have exceeded the capacity of my
rack… I am literally running out of space… I cannot deploy any more servers until
we bring a new DC online…Power is costing more than my
equipment… I am running out of breakers…The only way I can put another server in
is if I take one out…
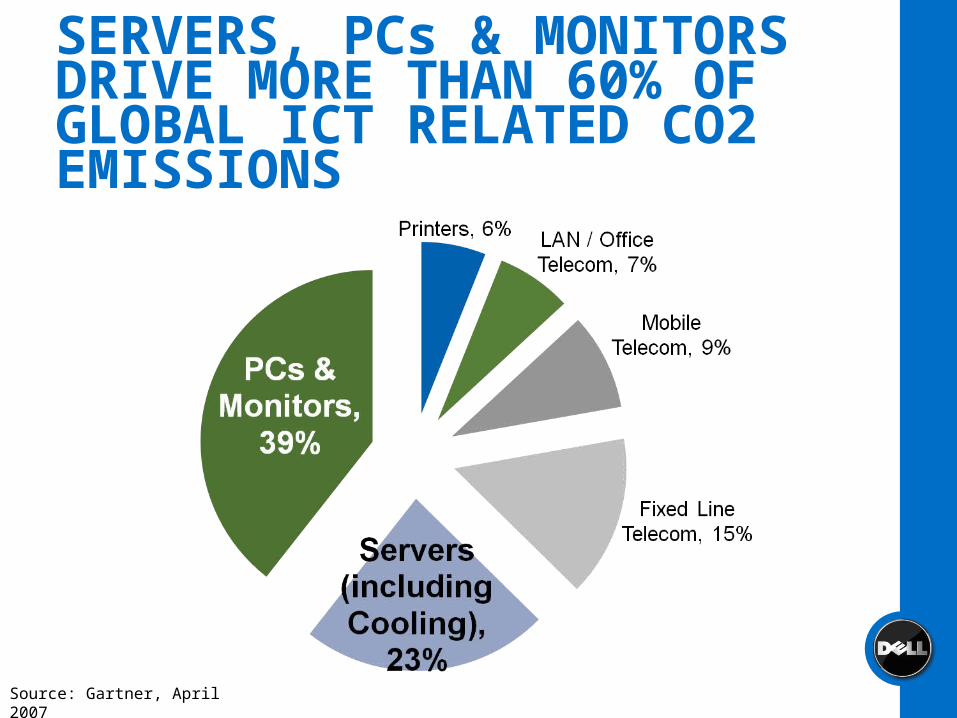
SERVERS, PCs & MONITORS DRIVE MORE THAN 60% OF GLOBAL ICT RELATED CO2 EMISSIONS
Source: Gartner, April 2007
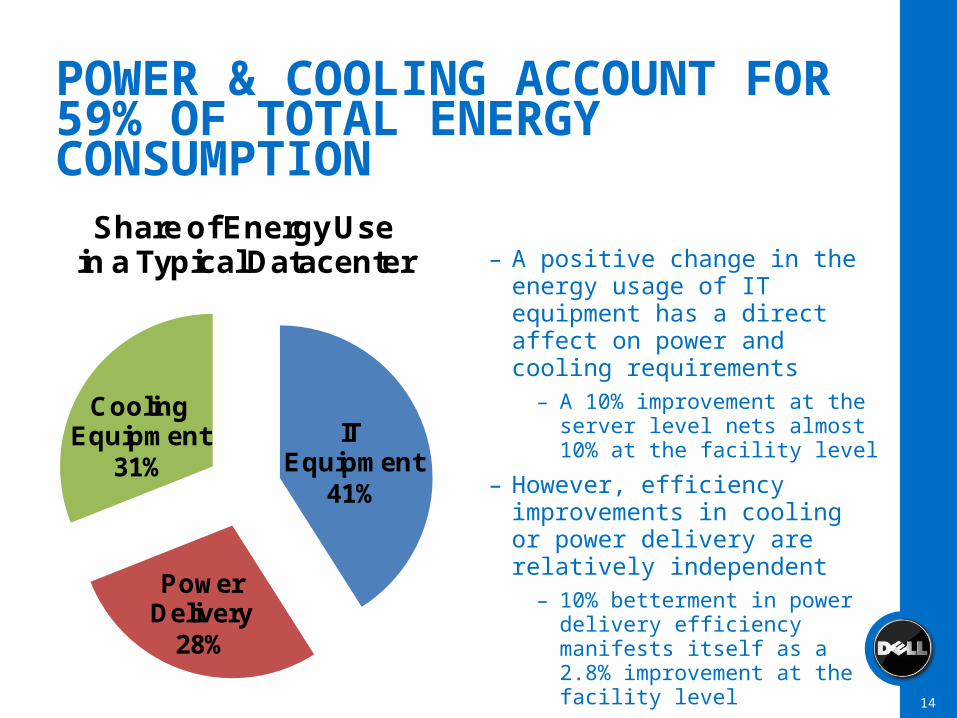
IT Equipment
41%
Power Delivery
28%
Cooling Equipment
31%
Share of Energy Use in a Typical Datacenter
POWER & COOLING ACCOUNT FOR 59% OF TOTAL ENERGY CONSUMPTION
DELL CONFIDENTIAL 14
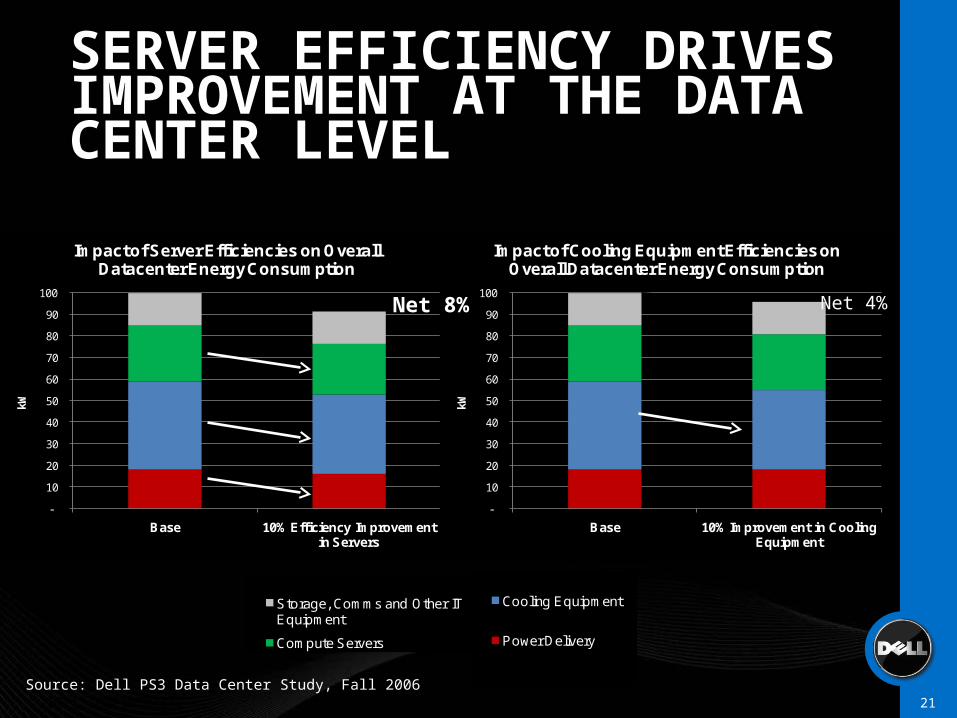
– A positive change in the energy usage of IT equipment has a direct affect on power and cooling requirements
– A 10% improvement at the server level nets almost 10% at the facility level
– However, efficiency improvements in cooling or power delivery are relatively independent
– 10% betterment in power delivery efficiency manifests itself as a 2.8% improvement at the facility level
DELL CONFIDENTIAL 15
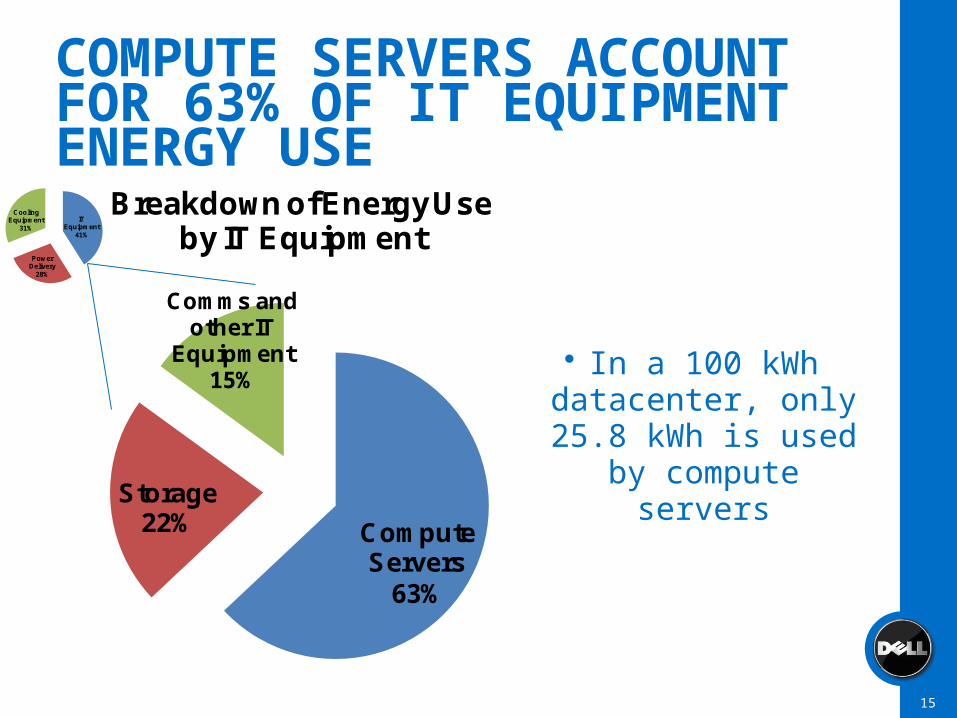
Compute Servers
63%
Storage22%
Comms and other IT
Equipment15%
Breakdown of Energy Use by IT Equipment
In a 100 kWh datacenter, only 25.8
kWh is used by compute servers
IT Equipment
41%
Power Delivery
28%
Cooling Equipment
31%
Share of Energy Use in a Typical Datacenter
COMPUTE SERVERS ACCOUNT FOR 63% OF IT EQUIPMENT ENERGY USE
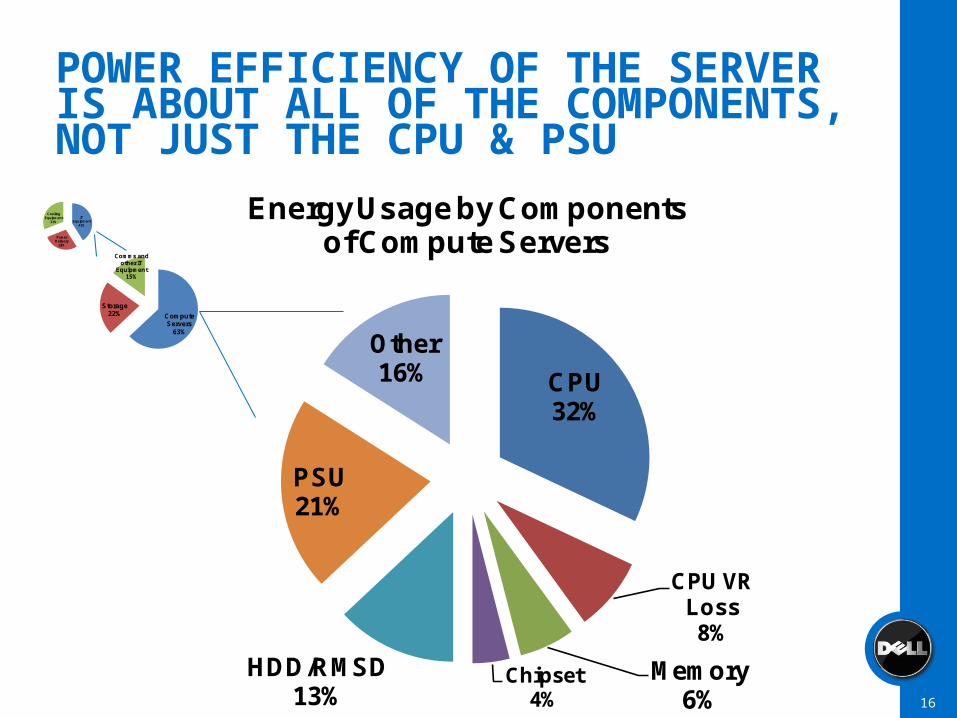
CPU32%
CPU VR Loss8%
Memory6%
Chipset4%
HDD/RMSD13%
PSU21%
Other16%
Energy Usage by Components of Compute Servers
POWER EFFICIENCY OF THE SERVER IS ABOUT ALL OF THE COMPONENTS, NOT JUST THE CPU & PSU
DELL CONFIDENTIAL 16
Compute Servers
63%
Storage22%
Comms and other IT
Equipment15%
Breakdown of Energy Use by IT Equipment
IT Equipment
41%
Power Delivery
28%
Cooling Equipment
31%
Share of Energy Use in a Typical Datacenter

73%
46%
40%
40%
36%
27%
22%
20%
20%
CRACs
Raised floor, forced air thru tiles
Supplemental Air conditioners
Air distribution units
Rack enclosures with built in cooling
Blanking panels within / between each rack
Heat rejection units
Aisle enclosures for hot aisle containment
Hot / cold aisle configuration
Which of the following do you have installed in your datacenter to deal with cooling?
SIMPLE TO IMPLEMENT, HIGH IMPACT BEST PRACTICES ARE INFREQUENTLY USED
DELL CONFIDENTIAL 17
Sources: IDC Datacenter Power and Cooling Trends June 2007

MIXING OF HOT AND COLD AIR INCREASES AS SERVER ENERGY CONSUMPTION RISES
DELL CONFIDENTIAL 18
Absence of cold air means that the probability of
component failure increases.
The racks shown that don’t have blue all the way to the
top have reached their cooling capacity.
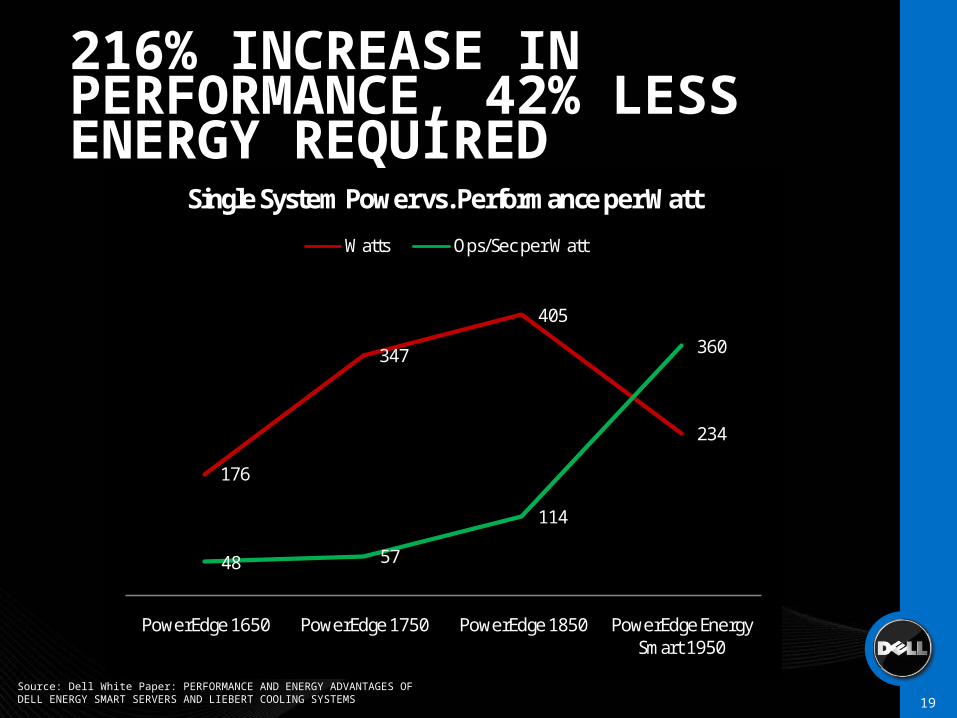
216% INCREASE IN PERFORMANCE, 42% LESS ENERGY REQUIRED
DELL CONFIDENTIAL 19
176
347
405
234
48 57
114
360
PowerEdge 1650 PowerEdge 1750 PowerEdge 1850 PowerEdge Energy Smart 1950
Single System Power vs. Performance per Watt
Watts Ops/Sec per Watt
Source: Dell White Paper: PERFORMANCE AND ENERGY ADVANTAGES OF DELL ENERGY SMART SERVERS AND LIEBERT COOLING SYSTEMS

0%
5%
10%
15%
20%
25%
30%
35%
40%
45%
Power Delivery Cooling Equipment
Compute Servers
Storage, Comms and Other IT Equipment
Share of Datacenter Energy Use
IN TYPICAL DATA CENTERS, COMPUTE SERVERS ACCOUNT FOR LESS THAN 30% OF ENERGY CONSUMPTION
DELL CONFIDENTIAL 20
Source: Dell PS3 Data Center Study, Fall 2006
-
10
20
30
40
50
60
70
80
90
100
Base 10% Efficiency Improvement in Servers
kW
Impact of Server Efficiencies on Overall Datacenter Energy Consumption
-
10
20
30
40
50
60
70
80
90
100
Base 10% Improvement in Cooling Equipment
kW
Impact of Cooling Equipment Efficiencies on Overall Datacenter Energy Consumption
SERVER EFFICIENCY DRIVES IMPROVEMENT AT THE DATA CENTER LEVEL
DELL CONFIDENTIAL 21
Source: Dell PS3 Data Center Study, Fall 2006-
10
20
30
40
50
60
70
80
90
100
Base 10% Efficiency Improvement in Servers
kW
Impact of Server Efficiencies on Overall Datacenter Energy Consumption
Storage, Comms and Other IT Equipment
Compute Servers
Cooling Equipment
Power Delivery
Net 4%
-
10
20
30
40
50
60
70
80
90
100
Base 10% Efficiency Improvement in Servers
kW
Impact of Server Efficiencies on Overall Datacenter Energy Consumption
Storage, Comms and Other IT Equipment
Compute Servers
Cooling Equipment
Power Delivery
Net 8%
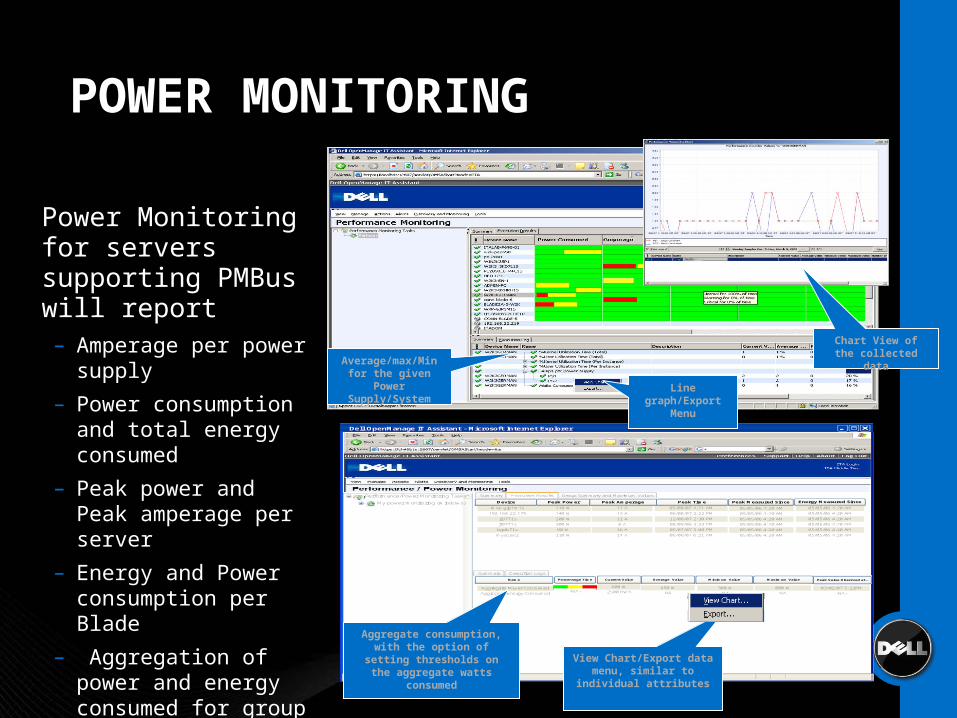
POWER MONITORING
Power Monitoring for servers supporting PMBus will report – Amperage per power
supply
– Power consumption and total energy consumed
– Peak power and Peak amperage per server
– Energy and Power consumption per Blade
– Aggregation of power and energy consumed for group of servers
Dell OpenManage IT Assistant - Microsoft Internet ExplorerDell OpenManage IT Assistant - Microsoft Internet Explorer
Applet OMCF.ui.MainApplet Started
Performance/Power Monitoring Tasks
My power monitoring (Windows)
Summary Execution Logs
Name Current Value Average Value Minimum Value Maximum Value
Aggregate Energy Consumed
Aggregate Power Consumed2500 KWh
600 W
-NA-
450 W
-NA-
300 W
-NA-
800 W
Percentage Time
-NA-
Peak Value Observed at..
-NA-
03/02/07 5:22PM
Summary Group Summary and Maximum ValuesExecution Results
140 W
110 W
300 W
200 W
110 W
90 W
192.168.22.179
Wxp-gjp1m1s
jt9771s
jr9771s
myserver
bgdb71s
13 A
12 A
8 A
11 A
14 A
16 A
06/08/07 2:22 PM
05/08/07 4:21 AM
08/09/06 3:33 PM
12/08/07 2:30 PM
06/06/07 6:21 AM
05/07/07 5:00 PM
05/05/06 4:20 AM
05/05/06 4:20 AM
05/05/06 4:20 AM
05/05/06 4:20 AM
05/05/06 4:20 AM
05/05/06 4:20 AM
05/05/06 4:20 AM
05/05/06 4:20 AM
05/05/06 4:20 AM
05/05/06 4:20 AM
05/05/06 4:20 AM
05/05/06 4:20 AM
Device Peak Power Peak Amperage Peak Time Peak Measured Since Energy Measured Since
Aggregate consumption, with the option of setting
thresholds on the aggregate watts
consumed
View Chart/Export data menu, similar to
individual attributes
Average/max/Min for the given
Power Supply/System
Chart View of the collected data
Line graph/Export
Menu
23
Scop
e o
f M
an
ag
ed
En
vir
on
men
t
Scope of Virtual Infrastructure
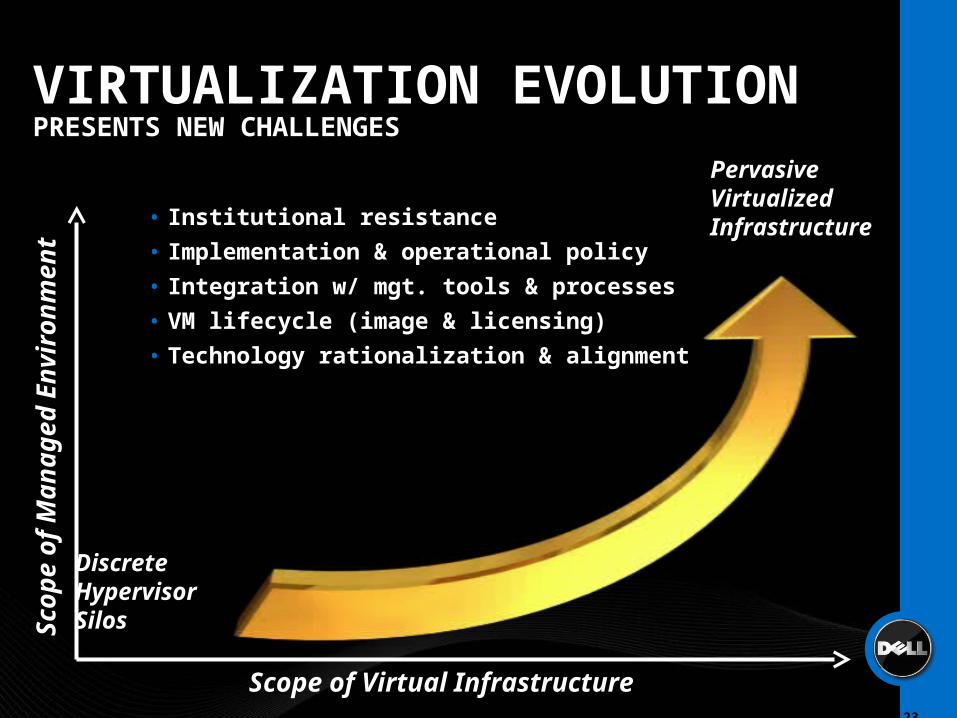
Pervasive Virtualized Infrastructure
VIRTUALIZATION EVOLUTIONPRESENTS NEW CHALLENGES
Discrete Hypervisor Silos
• Institutional resistance
• Implementation & operational policy
• Integration w/ mgt. tools & processes
• VM lifecycle (image & licensing)
• Technology rationalization & alignment

UNLOCK YOUR HIDDEN DATA CENTER
VIRTUALIZATION
DELL CONFIDENTIAL 24
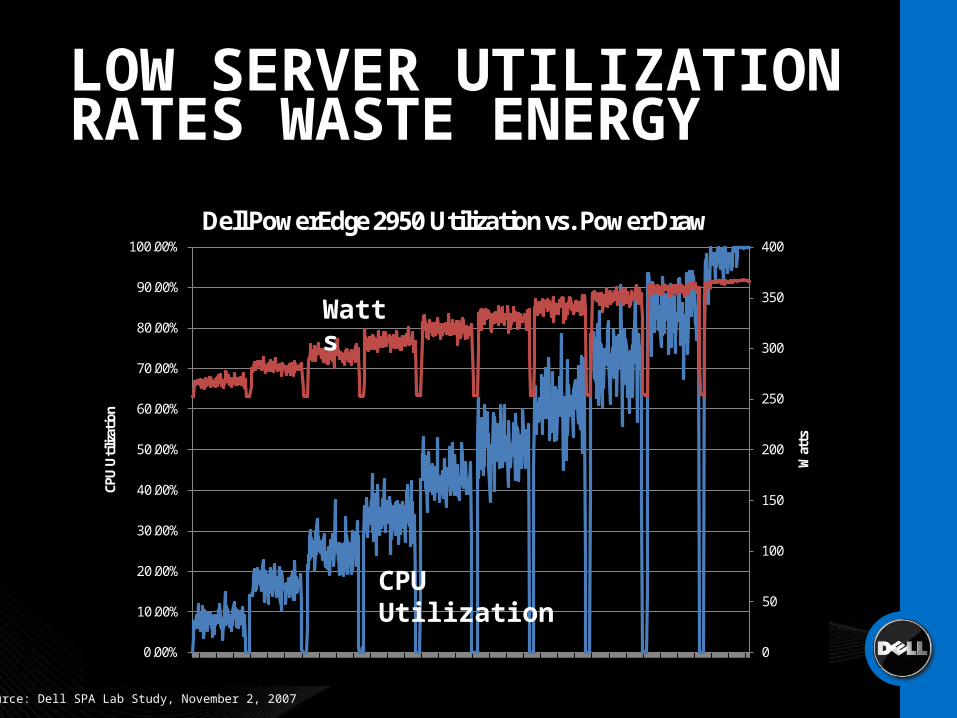
LOW SERVER UTILIZATION RATES WASTE ENERGY
Source: Dell SPA Lab Study, November 2, 2007
0
50
100
150
200
250
300
350
400
0.00%
10.00%
20.00%
30.00%
40.00%
50.00%
60.00%
70.00%
80.00%
90.00%
100.00%
1 35 69 103
137
171
205
239
273
307
341
375
409
443
477
511
545
579
613
647
681
715
749
783
817
851
885
919
953
987
1021
1055
Watt
s
CPU
Uti
lizati
on
Dell PowerEdge 2950 Utilization vs. Power Draw
Watts
CPU Utilization
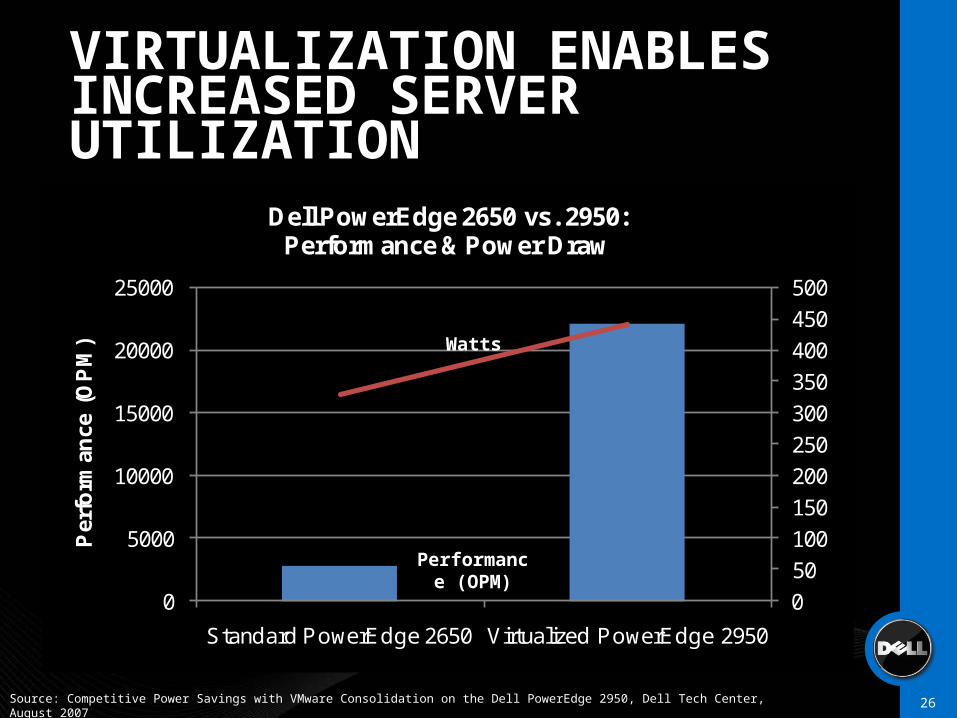
VIRTUALIZATION ENABLES INCREASED SERVER UTILIZATION
DELL CONFIDENTIAL 26
0
50
100
150
200
250
300
350
400
450
500
0
5000
10000
15000
20000
25000
Standard PowerEdge 2650 Virtualized PowerEdge 2950
Per
form
ance
(O
PM
)
Dell PowerEdge 2650 vs. 2950: Performance & Power Draw
Source: Competitive Power Savings with VMware Consolidation on the Dell PowerEdge 2950, Dell Tech Center, August 2007
Watts
Performance (OPM)

UNLOCK YOUR HIDDEN DATA CENTER: AN ILLUSTRATIONBASELINE
ASSUMPTIONS: TYPICAL LARGE DATA
CENTER
5000 SERVERS– ~29 servers / rack
– 10% 5+ years old
– 70% 2-5 years old
– 20% <2 years old
WORKLOADS = 4750
PUE = 2.23
Cooling vs. IT Power draw: 92.6 to 100 watt ratio
DELL CONFIDENTIAL 27
Source: Based on Dell PS3 Data Center Study, Fall 2006
0
1000
2000
3000
4000
5000
6000
Number of Servers Server Power Consumption (kW)
Workloads
Unlocking the Hidden Data Center: Baseline Servers, Power Consumption and Workloads

BEST PRACTICE: RAISING DATA CENTER SET POINT LEADS TO GREATER EFFICIENCY1.Chiller cooling efficiency
improves with increased water temperature
2.Increased water temperature enables an increase in temperature of the air handler coil
3.Incorporating Variable Frequency Drive blowers into air handlers enables greater efficiency
DELL CONFIDENTIAL 28
9.8
10
10.2
10.4
10.6
10.8
11
11.2
44 46 48 50 52 54 56
BT
U/H
R C
oo
lin
g /
Ch
ille
r W
att
Water Temperature
Air Cooled Chiller Efficiency
0%
20%
40%
60%
80%
100%
120%
60% 65% 70% 75% 80% 85% 90% 95% 100%
Fan
Po
wer
an
d F
low
rate
(%
of
full
)
Air Handler Load %
Fan Power at Partial Load

UNLOCK YOUR HIDDEN DATA CENTER: AN ILLUSTRATIONOPTIMIZED DATA CENTER TEMPERATURE
DELL CONFIDENTIAL 29
Data center temperature raised 5 degrees
No change in servers, server power or workloads
5% reduction in Total Data Center Power Consumption
Cooling vs. IT Power draw: 80.5 to 100 watt ratio (13% improvement)
Improvement at overall data center: PUE drops from 2.23 to 2.12
0
1000
2000
3000
4000
5000
6000
Number of Servers Server Power Consumption (kW)
Workloads Total Data Center Power Consumption
Unlocking the Hidden Data Center: Servers, Power Consumption and Workloads w/
Optimized Facility Temperature
Baseline Optimize Facility Temperature
5%
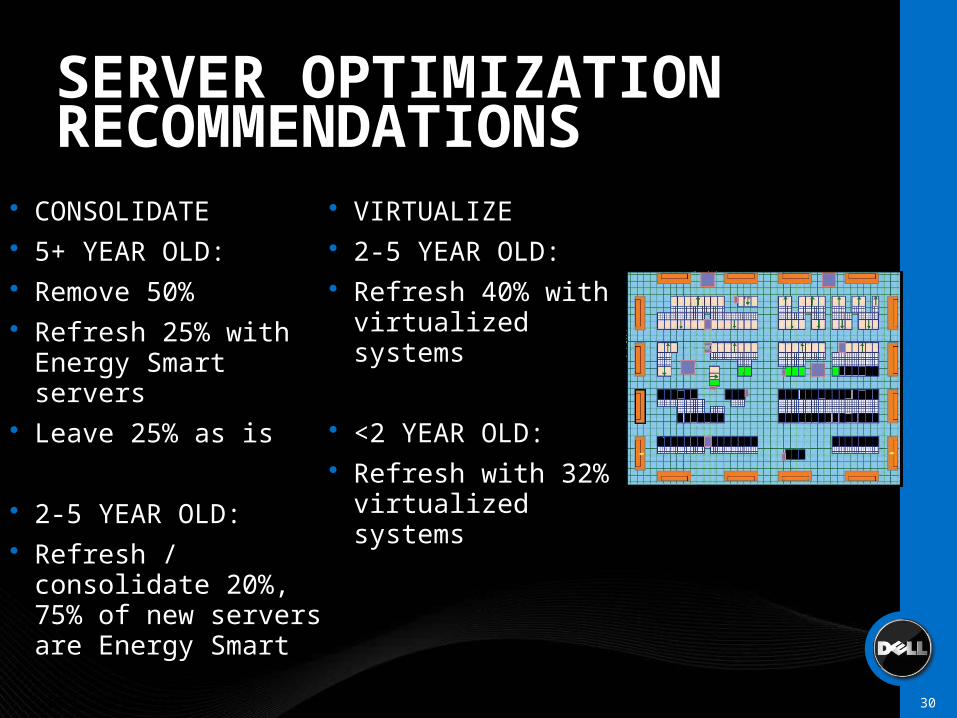
SERVER OPTIMIZATION RECOMMENDATIONS
CONSOLIDATE 5+ YEAR OLD: Remove 50% Refresh 25% with
Energy Smart servers Leave 25% as is
2-5 YEAR OLD: Refresh / consolidate
20%, 75% of new servers are Energy Smart
DELL CONFIDENTIAL 30
VIRTUALIZE 2-5 YEAR OLD: Refresh 40% with
virtualized systems
<2 YEAR OLD: Refresh with 32%
virtualized systems

0
1000
2000
3000
4000
5000
6000
Number of Servers Server Power Consumption (kW)
Workloads Total Data Center Power Consumption
Unlocking the Hidden Data Center: Comparison of Servers, Power Consumption and Workloads
Baseline Optimize Facility Temperature Optimize Servers
REDUCE DATA CENTER POWER CONSUMPTION UP TO 45% WITH NO PERFORMANCE CHANGE
DELL CONFIDENTIAL 31
No change
39%
42%
45%
0100020003000400050006000700080009000
10000
Number of Servers Server Power Consumption (kW)
Workloads Total Data Center Power Consumption
Unlocking the Hidden Data Center: Comparison of Servers, Power Consumption and Workloads
Baseline Optimize Facility Temperature
Optimize Servers Fill "Hidden Data Center"
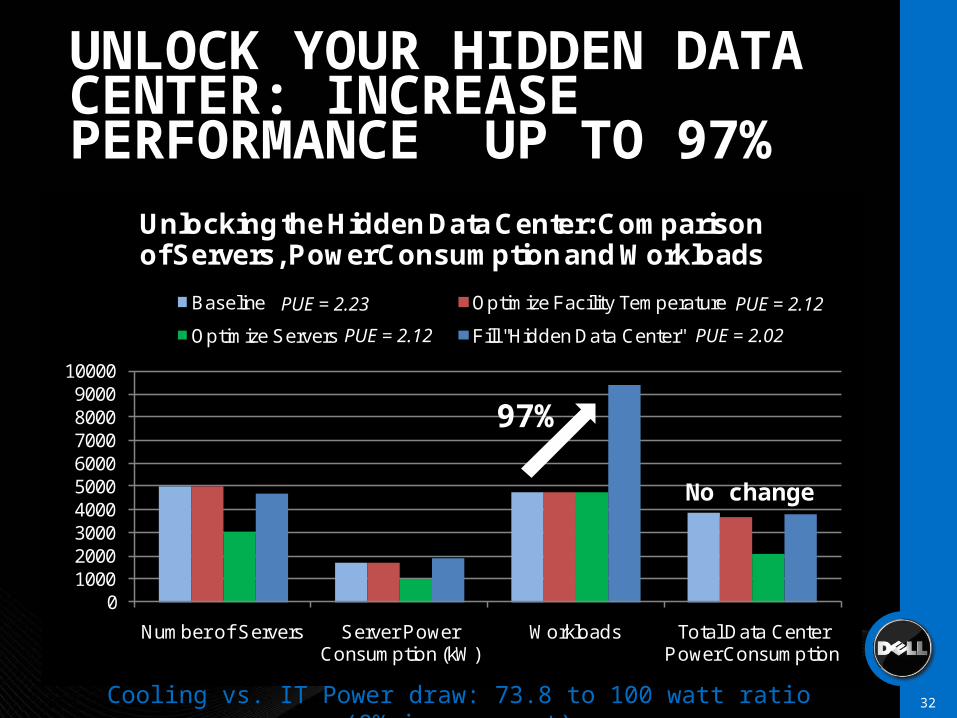
UNLOCK YOUR HIDDEN DATA CENTER: INCREASE PERFORMANCE UP TO 97%
DELL CONFIDENTIAL 32
97%
No change
PUE = 2.23
PUE = 2.12 PUE = 2.02
PUE = 2.12
Cooling vs. IT Power draw: 73.8 to 100 watt ratio (8% improvement)
THANK YOU
DELL CONFIDENTIAL 33