deltek vision 5.1 analysis and reporting white paper: vision® 5.1 analysis and reporting learning...
TRANSCRIPT
WHITE PAPER
www.deltek.com [email protected] 800.456.2009
Deltek Vision® 5.1 Analysis and ReportingUsing Microsoft® SQL Server™ 2005 Analysis Services and Microsoft® Excel®
Vision 5.1 empowers executives and managers by providing a new way to analyze information using Microsoft SQL Server 2005 Analysis Services and Microsoft Excel. This new capability enables pre-configured Vision data (Analysis Cubes) to be accessed through Microsoft Excel for viewing and interactive analysis.
Overview Of analysis cubesThe new Deltek Vision 5.1 Analysis Cubes capability takes Vision reporting to a whole new level by consolidating project and general ledger data into flexible views that empower decision makers. Information that previously would have required running and consolidating dozens of reports is now accessible through a single Microsoft Excel PivotTable view using Analysis Cubes. Trending data with full transaction backup is available through simple drag and drop configuration and drill-down screens.
Analysis Cubes allow you to take advantage of the vast amount of information stored in the Vision database and make more informed business decisions without having to learn complex report customization or take time compiling multiple reports. This enhancement equates to a significant time savings for users and has been designed specifically with the end goal of easy, efficient analysis of your data.
Vision 5.1 utilizes Microsoft SQL Server 2005 Analysis Services, the online analytical processing (OLAP) engine and data mining
platform within SQL Server 2005. Project, labor, expense, employee, vendor, general ledger and other Vision data can be analyzed and viewed over fiscal periods, years, quarters, calendar months and even days using preconfigured Excel templates. Simply click or drag and drop the desired columns, rows, values and filters into the pivot table template, and your Vision data is quickly populated into Excel, ready for your analysis and specific formatting needs.
With Analysis Services, Deltek Vision data is stored in a central data repository populated directly from your Vision database, but compiled in a format that is optimized for rapid query and analysis. The cube views are run off of this stored data, which is normally refreshed nightly as part of the database maintenance routine. Though database size drives processing times, the largest Vision databases tested took minutes to refresh rather than hours. The data warehouse can also be created on demand if up-to-the-minute data is necessary for an analysis.
contents
Overview of Analysis Cubes .....................1
Learning How to Configure and Use Vision Analysis Cubes ........2
Analysis Cubes Highlights .............................2
User Scenarios .....................2
Conroller/CFO Use Case: Profitability Analysis ............................3
Resource Manager Use Case: Staffing Analysis ............................4
Principal Use Case: Annual Revenue with Set Goals Analysis ................7
CEO/CFO Use Case: Income Statement View of Project Types ..................8
Summary ........................... 11
2 WHITE PAPER: visiOn® 5.1 analysis and repOrting
learning hOw tO cOnfigure and use visiOn analysis cubes Deltek Vision Analysis Cubes data is accessed through Microsoft Excel, modeling the Excel pivot table functionality. This brings the power of Excel to Vision reporting, including Excel’s strong formatting options, calculation and graphing capabilities and ease of use. With little to no training, you can now actively analyze your project, employee and general ledger data from almost any angle, over any timeframe, from a single screen.
For information on how to configure Vision Analysis Cubes, please see the technical documents—Configure Analysis Cubes and Configure Analysis Cubes for internet accessibility—available for download from the Vision e-Support site. If you want to configure the Analysis Cubes for internet accessibility, you must complete the instructions in the Configure Analysis Cubes document before completing the instructions in the Configure Analysis Cubes for internet accessibility document.
To learn how to use Deltek Vision Analysis Cubes to create reports in Excel 2007, see the Analysis Cubes book in the Vision Help system. Topics include instructions on how to connect to a Vision data cube in Excel, descriptions of reporting fields available in each Vision data cube, how to troubleshoot and so on.
Deltek technical and application consulting assistance is also available (billable on a time and materials basis) for both technical and training questions related to the Vision Analysis Cubes. Please contact a Deltek representative if you would like assistance setting up or learning Vision’s Analysis Cubes.
analysis cubes highlightsWith Deltek Vision Analysis Cubes, you can do the following:
Expand and collapse detail on the fly. For example, you can •expand your one page organization summary to see totals by principal, then market sector, project manager, project, phase, task and so on. Then you can easily collapse it all back to a single page view.
Rather than choosing your own hierarchy, use our •preconfigured pivot tables for commonly requested hierarchies such as projects by organization and employees by office.
Enjoy significant performance enhancements in retrieving •and viewing data thanks to the Analysis Services data storage.
See immediate results. It is no longer necessary to •iteratively set up report options and selection, run the report, find out it’s not what you needed, adjust the report configuration, re-run the report and so on. Cube data populates on the fly as the configuration is changed, on the same screen.
Analyze results over hierarchical time dimension including •fiscal or calendar year, quarter, month, even transaction date and day of the week.
Enable users, such as executives and project managers, •to easily understand and analyze Vision data with minimal training.
Pick your favorite from numerous methods for cube •data delivery including Microsoft Excel, Microsoft® Access, Performance Point®—any tool that can read SQL Analysis Services.
Create intuitive analysis views with extremely flexible •layout and formatting capabilities.
Bring the power of Excel to your analysis process with •sort, filter and graphing capabilities.
Save time and money by avoiding the need for custom •reports and time consuming manual report compilations for those unique data views.
user scenariOsThe remainder of this document describes four Analysis Cubes user scenarios to better explain how they may be applied to decision making at your firm. The examples are as follows:
A corporate controller finds answers to why profitability •is down.
A resource manager seeks visibility into labor cross •charging activities; are her offices properly staffed?

3 WHITE PAPER: visiOn® 5.1 analysis and repOrting
A marketing VP tracks quarterly revenue goals by principal •to make decisions on allocating future business development spending.
A CEO reviews an income statement to evaluate •performance by market sector.
These examples suggest a specific user audience for the particular analysis. However, this may vary based on your firm’s structure and business process.
cOntrOller/cfO use case: prOfitability analysisJim is the controller for a 150-person architectural firm. While reviewing the company’s performance over the last six months, he noticed that profitability is down, but he is not sure why.
Using the Deltek Vision Project cube, he is able to quickly look across organizations and notice that the San Francisco architectural organization has been less profitable than expected. As he expands the organizations by project manager, he identifies the two project managers who have lowest profitability in these offices. He prints a list of the projects causing the profitability dip to review them.
Jim created the following view to quickly determine which project managers to approach.
Set Row Labels of Project Organization, Project 1. Manager and Project Number—Short Name.
Set Column Labels of Fiscal Year—Quarter—Period.2.
Click or drag and drop fields from the PivotTable Field 3. List into the the Row Labels and Column Labels areas.
Fields that you drag and drop into the Row Labels and 4. Column Labels areas automatically display in the views output area.
Set Values of Profit and any other desired fields. 5. In this example, Net Revenue and Effective Multiplier also display.

4 WHITE PAPER: visiOn® 5.1 analysis and repOrting
Set any filters for the columns or rows by clicking the 6. drop-down arrow next to Column Labels or Row Labels on the report output. In this example, only the fiscal year of 2007 is displayed.
Drill-down to the problem project managers and 7. projects by expanding the rows on the output.
Jim found that in the established San Francisco architectural office, Steve Anderson and Ann Johnson are having trouble with two of their projects.
resOurce Manager use case: staffing analysisJessica is a resource manager in charge of ensuring that each office in her firm is adequately staffed. She keeps a close tab on which offices are borrowing the most labor and which offices have employees loaned out the most frequently. To help her analyze this interoffice work, she needs a view that shows her yearly, quarterly and monthly amounts for how many direct hours and billable values are being spent by employees working outside of their current office.
Jessica used the Vision Project cube as follows to help her research:
Set Row Labels of Employees by Office and Project 1. Office. You can change the labels on the Excel output area to clarify that this is the Employee’s Office.
Set Column Labels of Fiscal Year—Quarter—Period.2.

5 WHITE PAPER: visiOn® 5.1 analysis and repOrting
Set Values of Labor Hours and any other desired 3. dimensions. In this example, Labor Total Billing also displays in Jessica’s analysis.
Select any desired filters. In this example Project 4. Charge Type is selected.
Add the appropriate Project Charge Type filters by 5. clicking the drop-down arrow in the top left corner of the output.
Filter the transaction years as necessary using the 6. Column Labels filter.

6 WHITE PAPER: visiOn® 5.1 analysis and repOrting
You can drill-down to timesheet details by double-clicking the cell in question. In this case, Jessica noticed that a lot of employees in the new Washington office were helping Boston with projects while waiting for Washington jobs to begin. However, Adam Freeney seemed to be spending even more time than normal in Boston. With drill-down, Jessica found that three large Boston projects were taking up his time.
Armed with the timesheet data, Jessica approached the project managers of Gilbert Elementary School, Adelphi Research Lab and Fox Run Expansion to make sure they would be able to free up Adam once the Washington projects got rolling.
Get details on who worked where or details on quarterly cross charging totals by using the expanding and collapsing rows 7. and columns.
7 WHITE PAPER: visiOn® 5.1 analysis and repOrting
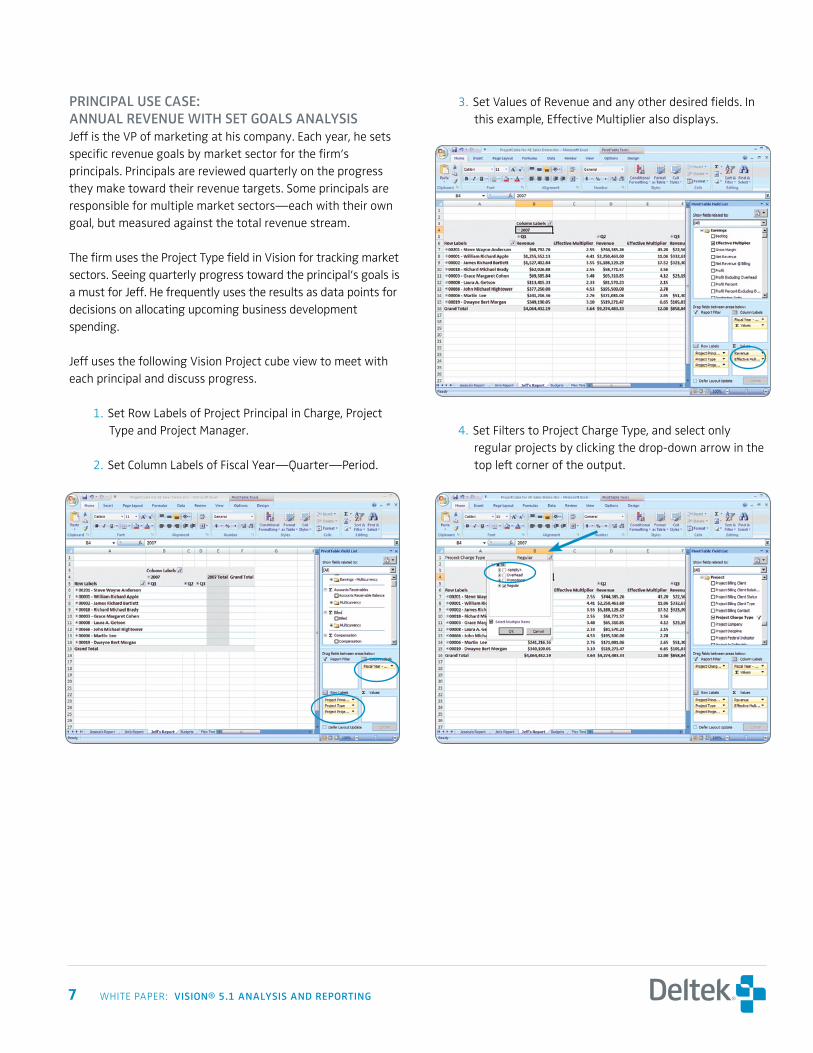
principal use case: annual revenue with set gOals analysisJeff is the VP of marketing at his company. Each year, he sets specific revenue goals by market sector for the firm’s principals. Principals are reviewed quarterly on the progress they make toward their revenue targets. Some principals are responsible for multiple market sectors—each with their own goal, but measured against the total revenue stream.
The firm uses the Project Type field in Vision for tracking market sectors. Seeing quarterly progress toward the principal’s goals is a must for Jeff. He frequently uses the results as data points for decisions on allocating upcoming business development spending.
Jeff uses the following Vision Project cube view to meet with each principal and discuss progress.
Set Row Labels of Project Principal in Charge, Project 1. Type and Project Manager.
Set Column Labels of Fiscal Year—Quarter—Period.2.
Set Values of Revenue and any other desired fields. In 3. this example, Effective Multiplier also displays.
Set Filters to Project Charge Type, and select only 4. regular projects by clicking the drop-down arrow in the top left corner of the output.

8 WHITE PAPER: visiOn® 5.1 analysis and repOrting
Set any filters for the columns or rows by clicking the 5. drop-down arrow next to Column Labels or Row Labels on the output. In this example, only the fiscal year of 2007 display.
On a second worksheet, set up a grid defining annual 6. revenue goals by principal (for example, principal, annual budget and variance).
Create calculated fields defining variances to the goals 7. as YTD Revenue minus Goal.
Be careful to select the total annual revenue value, not the quarterly value. Then select the quarterly revenue totals per principal by making the cell on the Budgets worksheet equal to the cell with the appropriate sum on the pivot table analysis. By setting the budget to look to the pivot table data, a report is created that updates on the fly whenever the revenue numbers in the analysis view are refreshed.
Jeff decides he should meet with Laura first.
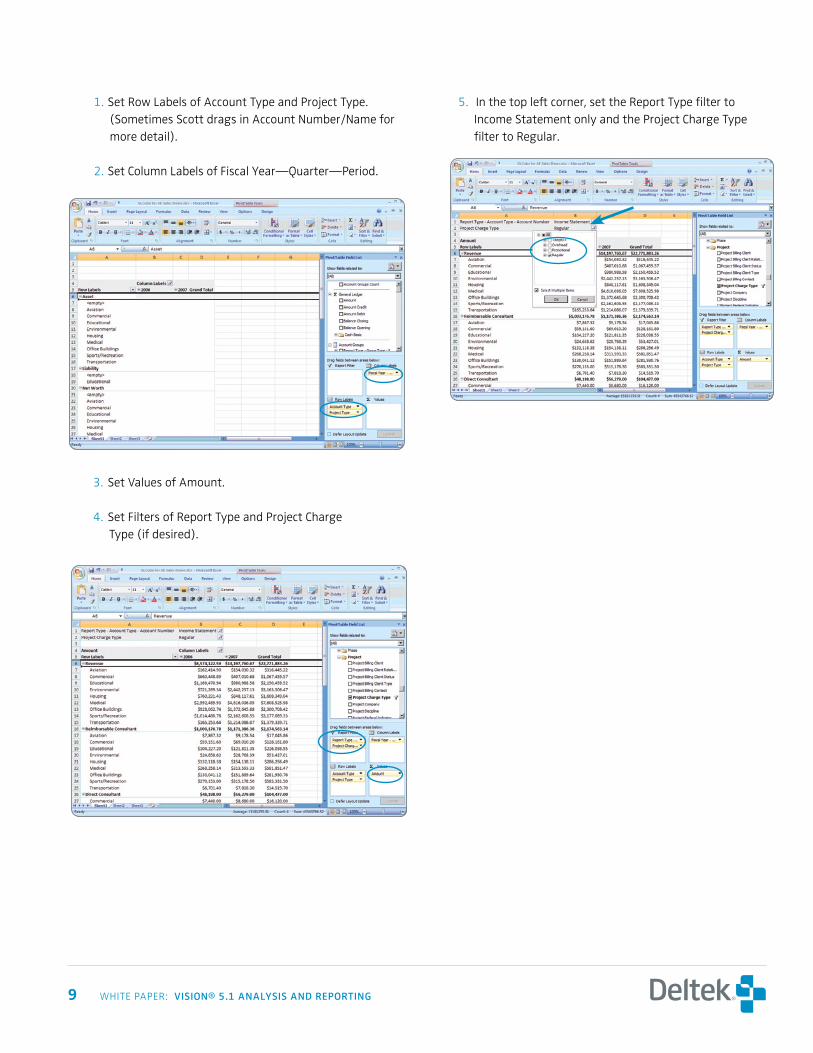
ceO/cfO use case: incOMe stateMent view Of prOject typesScott is the owner of an architectural firm. Everyone in the firm does business with a variety of project types, so Scott never felt the need to set up organizations that would require him to arbitrarily attach his employees to a “practice group.” However, last year the firm started focusing on the transportation industry, and Scott wants to know how that type of work is shaping up when compared to more established project types. He prefers to see the numbers in an Income Statement format.
Scott used the Vision General Ledger cube to create the following analysis to check on the new project type.
9 WHITE PAPER: visiOn® 5.1 analysis and repOrting
Set Row Labels of Account Type and Project Type. 1. (Sometimes Scott drags in Account Number/Name for more detail).
Set Column Labels of Fiscal Year—Quarter—Period.2.
Set Values of Amount.3.
Set Filters of Report Type and Project Charge 4. Type (if desired).
In the top left corner, set the Report Type filter to 5. Income Statement only and the Project Charge Type filter to Regular.

10 WHITE PAPER: visiOn® 5.1 analysis and repOrting
In the Column Labels on the view output, filter to see only the years of data that are pertinent. 6. (Scott only cares to see 2006 and 2007).

11 WHITE PAPER: visiOn® 5.1 analysis and repOrting
Scott is pleased with the exponential growth in revenues, but to get the whole story per market sector, he decides to 7. change the order of the Row Labels. This allows him to see each project type with all the expenses and revenue posted to it separately.
suMMaryThese four simple examples demonstrate how Analysis Cubes can be used to create views that are not easily achievable using the standard Vision reporting module. The information shown on these analysis views would have taken approximately 16 separate reports to create in Vision, without the timeframe component. With the timeframe component, each period, quarter and year would be a unique report, and the number of reports required increases exponentially.
In addition, the time required to create and save one of these reports in the standard Vision module is about the same as the time to configure the entire screen using Vision’s Analysis Cubes. This means that not even including the timeframe component, the Vision Analysis Cubes application is 16 times more efficient than the standard reporting tool. This exciting new tool can help you create and use data to facilitate the decision making process in record time.

Deltek (NASDAQ: PROJ) is the leading provider of enterprise applications software designed specifically for project-focused businesses. For more than two decades, our software applications have enabled organizations to automate mission-critical business processes around the engagement, execution and delivery of projects. More than 12,000 customers worldwide rely on Deltek to measure business results, optimize performance, streamline operations and win new business.
contact deltek
Deltek•13880DullesCornerLane,Herndon,VA20171us & canada: 800.456.2009 or 703.734.8606 uK: +44 (0) 20 7518-5010
© 2007 Deltek, Inc. All rights reserved. All referenced trademarks are the property of their respective owners.
www.deltek.com
800.456.2009