demand –and supply the global economy - new...
TRANSCRIPT
1
The Global Economy
Aggregate Supply & Demand
Demand – AND supply
2
Problem Set #3
• Answers will be posted Tuesday
3
Problem Set #3: Question 3
• What indicators do you recommend?
• How is the economy doing?
4
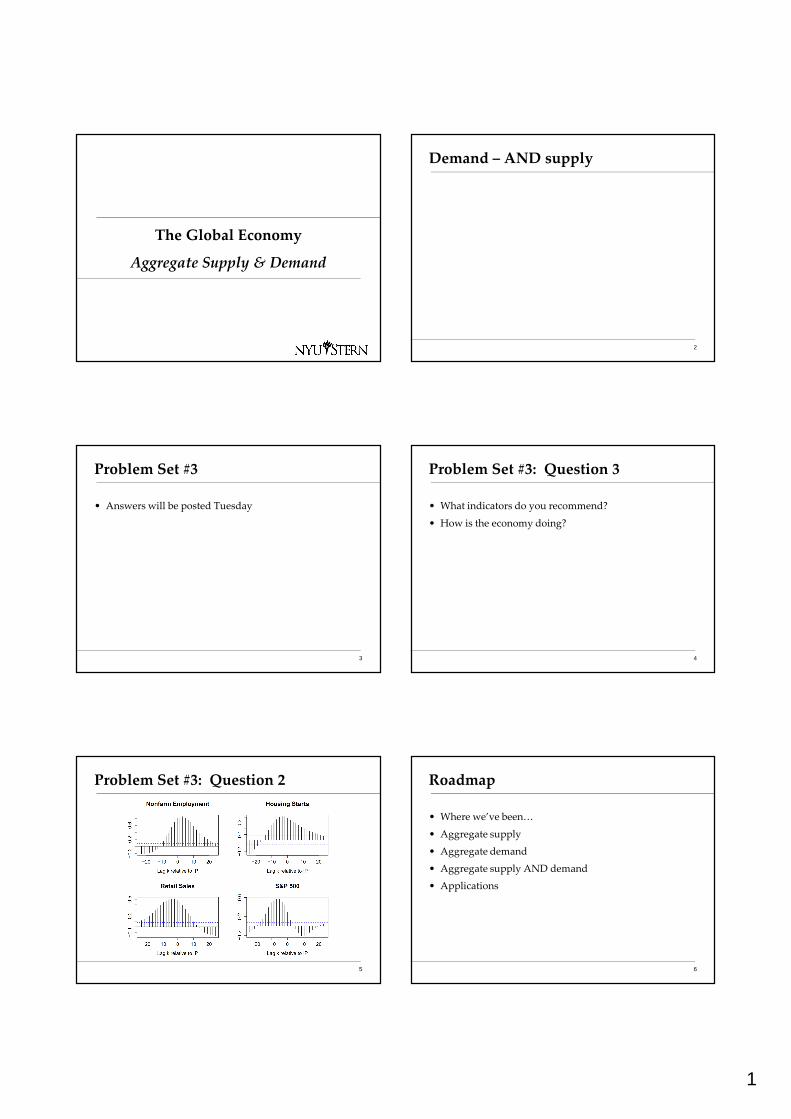
Problem Set #3: Question 2
5
Roadmap
• Where we’ve been…
• Aggregate supply
• Aggregate demand
• Aggregate supply AND demand
• Applications
6
2
Where we’ve been…
• Where we’ve been: business cycle data
– Properties: some things are more cyclical than others
– Indicators: procyclical and countercyclical, leading and lagging
• Where we’re headed: business cycle theory
– Adapt supply/demand diagram to whole economy
– Examine sources of fluctuations, possible policy responses
– Today: using the AS/AD diagram
– Next week: monetary policy and interest rates
7
Aggregate supply & demand
Two perspectives
• Supply is what matters
– If you build it, people will buy it
– All we had prior to 1930
• Demand is what matters
– If there’s demand, someone will build it
– Response to Depression (John Maynard Keynes and others)
– Paul Krugman?
• What we do
– Supply AND demand
9
Aggregate supply and demand
• Adapt supply/demand diagram to whole economy
• Axes
– P is price level
– Y is real GDP
– Usually interpreted as inflation and GDP growth
• Curves
– Supply is about production of goods
– Demand is about purchases of goods
10
Aggregate supply and demand
Y
PAS
AD
11
Aggregate supply
3
Aggregate supply I
• Supply is about production
• Classical version [“long run”]
• Production function
Y = A Kα L1-α
• At any point in time
– A is given [but may change over time]
– K is given [but may change over time]
– L reflects “equilibrium” in labor market
• Y must therefore be “given” [and AS* vertical]
13
Aggregate supply I
Y
P AS*
14
Y*
Aggregate supply I
• Reminder:
Y = A Kα L1-α
• Over time, what happens when these change?
– A?
– K?
– L?
• How do we represent this in the diagram?
15
Aggregate supply I
Y
P AS*
16
Y*
Aggregate supply I
• Oil prices
• An increase is like a drop in TFP
• Why?
– Think about total payments to capital, labor, and oil producers
– If more goes to oil producers, there’s less for capital and labor
– Our measure of output is payments to capital and labor, so it’s gone down
– If oil producers are local the lost revenue would show up there, but if they’re abroad, local output falls
– That’s just like a fall in productivity: AS shifts left
17
Aggregate supply II
• Keynesian version [“short run”]
• Production function
Y = A Kα L1-α
• At any point in time
– A, K given
– Simple version: nominal wage “sticky”
– Increase in P reduces real wage, firms hire more workers
– More L implies more Y � AS curve slopes upward
• Wage eventually adjusts, bringing us back to AS*
18
4
Aggregate supply II
Y
P AS*AS
19
Y*
Aggregate supply: shifts
• What happens to aggregate supply if we
– Change A or K?
– Change price of oil?
• Note: both AS and AS* shift – and by same amount [the last part is a short cut, you can thank me later]
20
Aggregate supply II
Y
P AS*AS
21
Y*
Aggregate supply: shifts
Y
P AS*AS
22
Y*
Aggregate supply: shifts
Y
P AS*AS
23
Y*
Aggregate demand
5
Aggregate demand
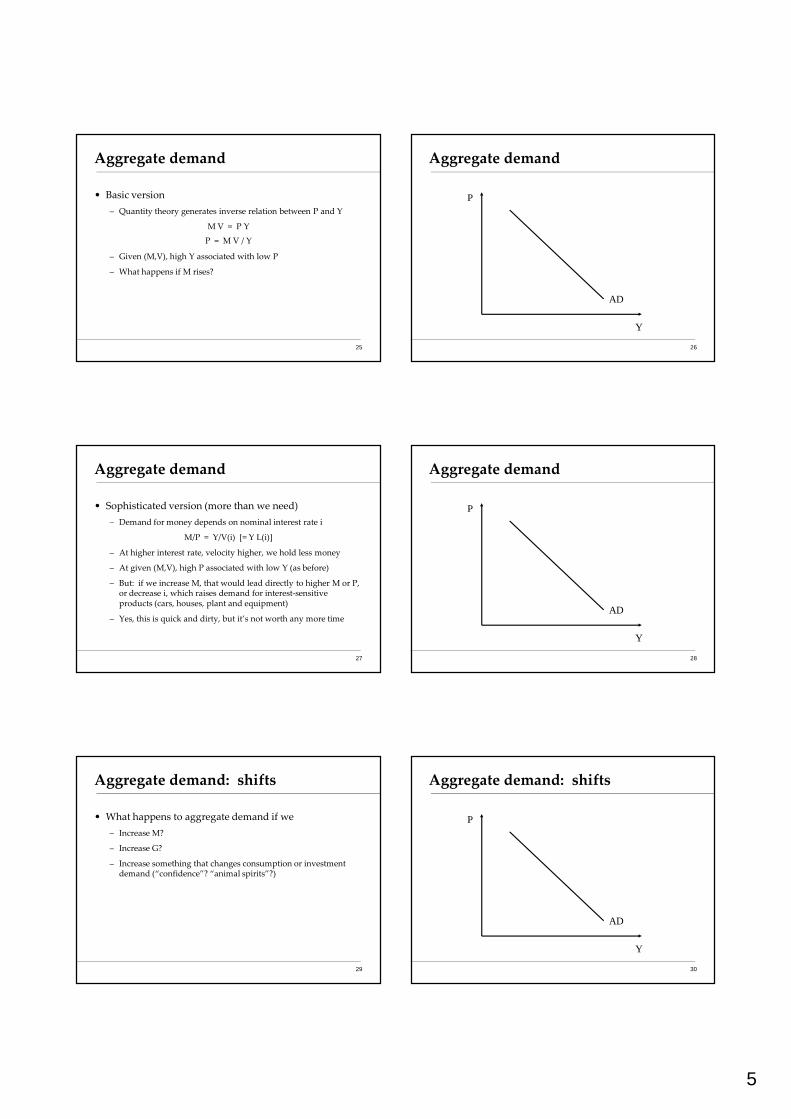
• Basic version
– Quantity theory generates inverse relation between P and Y
M V = P Y
P = M V / Y
– Given (M,V), high Y associated with low P
– What happens if M rises?
25
Aggregate demand
Y
P
AD
26
Aggregate demand
• Sophisticated version (more than we need)
– Demand for money depends on nominal interest rate i
M/P = Y/V(i) [= Y L(i)]
– At higher interest rate, velocity higher, we hold less money
– At given (M,V), high P associated with low Y (as before)
– But: if we increase M, that would lead directly to higher M or P, or decrease i, which raises demand for interest-sensitive products (cars, houses, plant and equipment)
– Yes, this is quick and dirty, but it’s not worth any more time
27
Aggregate demand
Y
P
AD
28
Aggregate demand: shifts
• What happens to aggregate demand if we
– Increase M?
– Increase G?
– Increase something that changes consumption or investment demand (“confidence”? “animal spirits”?)
29
Aggregate demand: shifts
Y
P
AD
30
6
Aggregate demand: shifts
Y
P
AD
31
Aggregate demand: shifts
Y
P
AD
32
Aggregate supply & demand
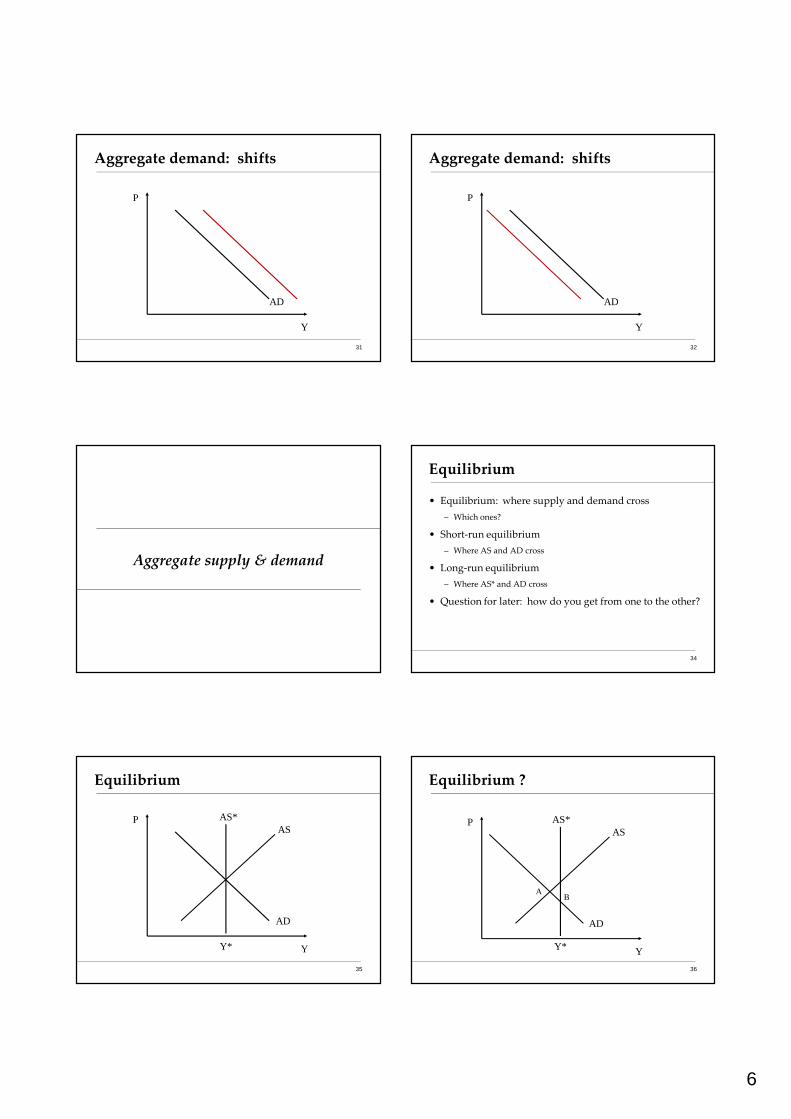
Equilibrium
• Equilibrium: where supply and demand cross
– Which ones?
• Short-run equilibrium
– Where AS and AD cross
• Long-run equilibrium
– Where AS* and AD cross
• Question for later: how do you get from one to the other?
34
Equilibrium
Y
PAS
AD
AS*
35
Y*
Equilibrium ?
Y
PAS
AD
AS*
AB
36
Y*
7
Equilibrium
• Start at A
– At A, real wage is too high [How do we know that? Y is below Y*]
• End at B – but how do we get there?
– Wage too high, so let’s say it falls
– That moves AS to the right until it crosses AS* at B
– Wages “sticky,” not stuck forever
– At lower wage, firms hire more workers, output rises
37
Applications of the AS/AD model
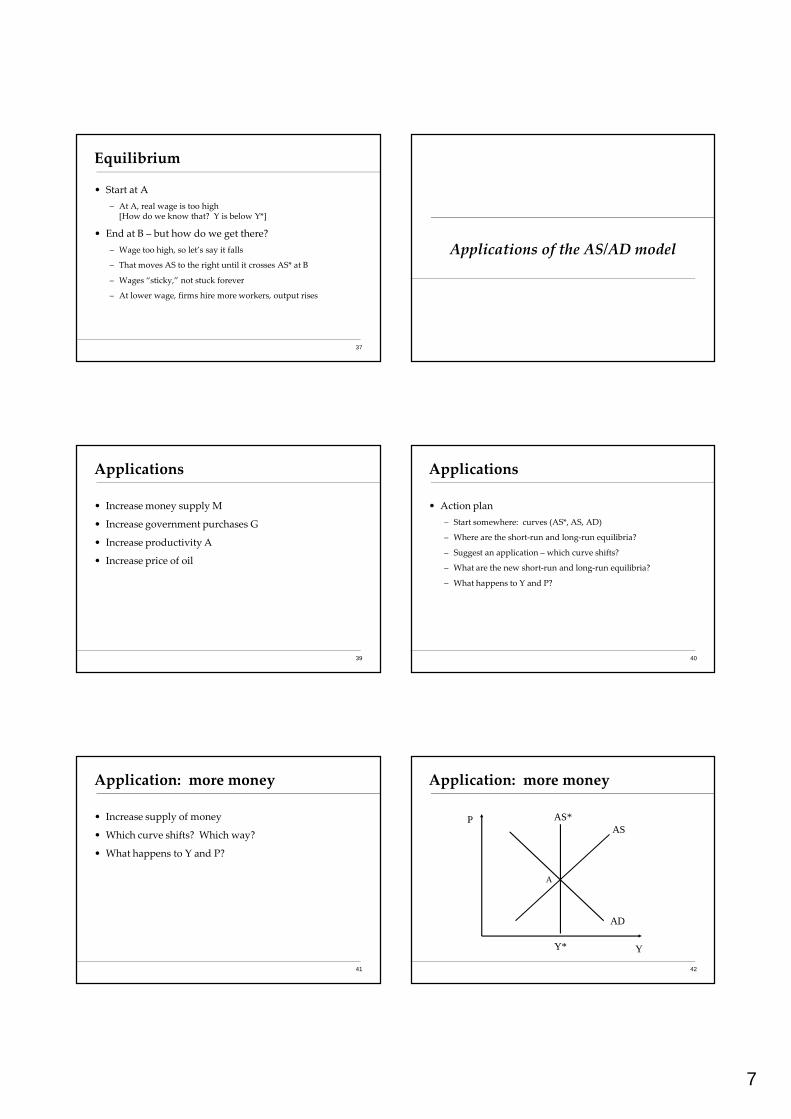
Applications
• Increase money supply M
• Increase government purchases G
• Increase productivity A
• Increase price of oil
39
Applications
• Action plan
– Start somewhere: curves (AS*, AS, AD)
– Where are the short-run and long-run equilibria?
– Suggest an application – which curve shifts?
– What are the new short-run and long-run equilibria?
– What happens to Y and P?
40
Application: more money
• Increase supply of money
• Which curve shifts? Which way?
• What happens to Y and P?
41
Application: more money
Y
PAS
AD
AS*
42
Y*
A
8
Application: more money
Y
PAS
AD
AS*
43
Y*
AB
C
Application: more money
• Start at A: short run and long run equilibrium
• More money: AD shifts right
• New short-run equilibrium at B
– Higher prices, higher output
• New long-run equilibrium at C
– Higher prices, output unchanged (!)
• Why? Does this make sense to you?
44
Application: more money
• How does this compare to our analysis of hyperinflations?
• Hyperinflation
– More money generates higher prices
• AS/AD
– Short run: higher prices AND higher output
– Long run: only higher prices
• What about Milton Friedman
– Is “inflation always and everywhere a monetary phenomenon”?
45
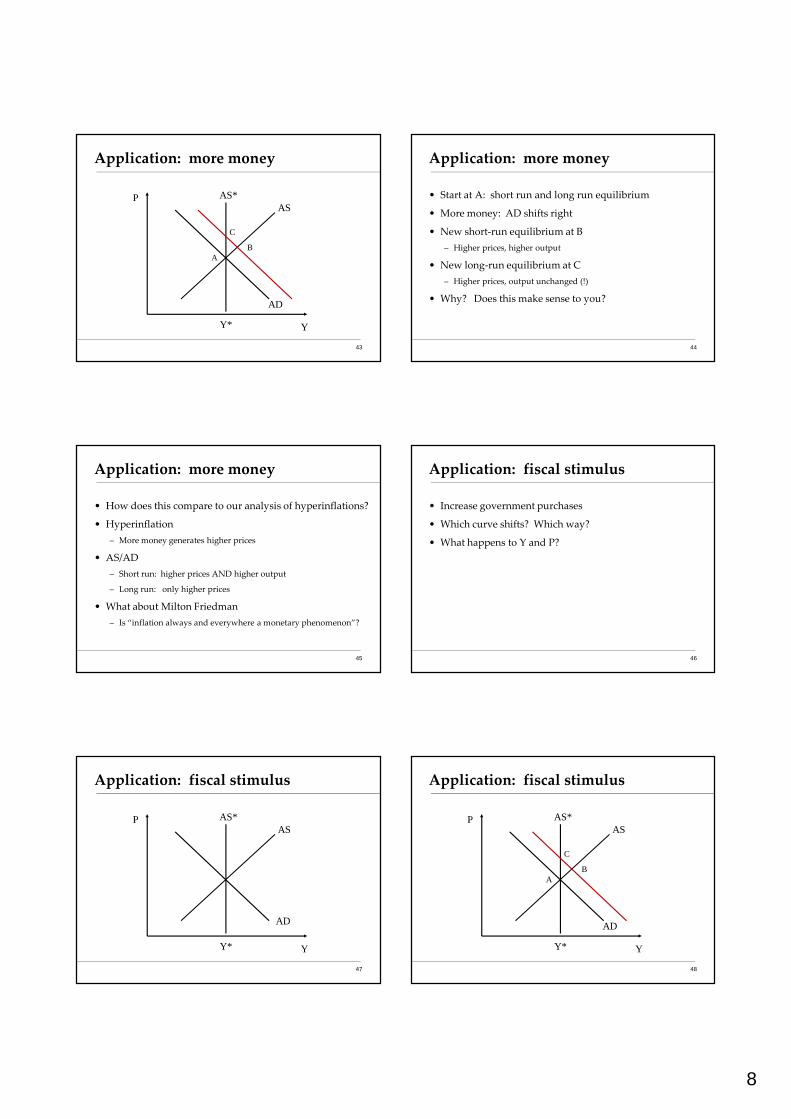
Application: fiscal stimulus
• Increase government purchases
• Which curve shifts? Which way?
• What happens to Y and P?
46
Application: fiscal stimulus
Y
PAS
AD
AS*
47
Y*
Application: fiscal stimulus
Y
PAS
AD
AS*
48
Y*
AB
C
9
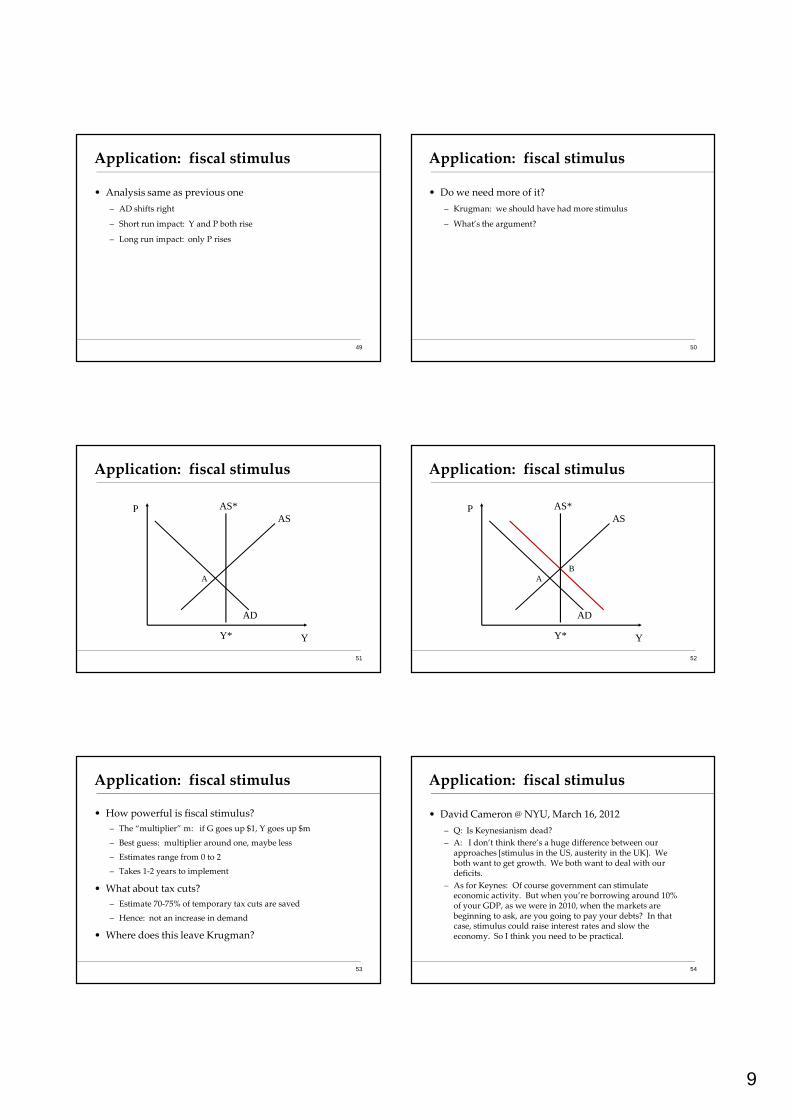
Application: fiscal stimulus
• Analysis same as previous one
– AD shifts right
– Short run impact: Y and P both rise
– Long run impact: only P rises
49
Application: fiscal stimulus
• Do we need more of it?
– Krugman: we should have had more stimulus
– What’s the argument?
50
Application: fiscal stimulus
Y
PAS
AD
AS*
51
Y*
A
Application: fiscal stimulus
Y
PAS
AD
AS*
52
Y*
BA
Application: fiscal stimulus
• How powerful is fiscal stimulus?
– The “multiplier” m: if G goes up $1, Y goes up $m
– Best guess: multiplier around one, maybe less
– Estimates range from 0 to 2
– Takes 1-2 years to implement
• What about tax cuts?
– Estimate 70-75% of temporary tax cuts are saved
– Hence: not an increase in demand
• Where does this leave Krugman?
53
Application: fiscal stimulus
• David Cameron @ NYU, March 16, 2012
– Q: Is Keynesianism dead?
– A: I don’t think there’s a huge difference between our approaches [stimulus in the US, austerity in the UK]. We both want to get growth. We both want to deal with our deficits.
– As for Keynes: Of course government can stimulate economic activity. But when you’re borrowing around 10% of your GDP, as we were in 2010, when the markets are beginning to ask, are you going to pay your debts? In that case, stimulus could raise interest rates and slow the economy. So I think you need to be practical.
54
10
Application: fiscal stimulus
• Via Mankiw
55
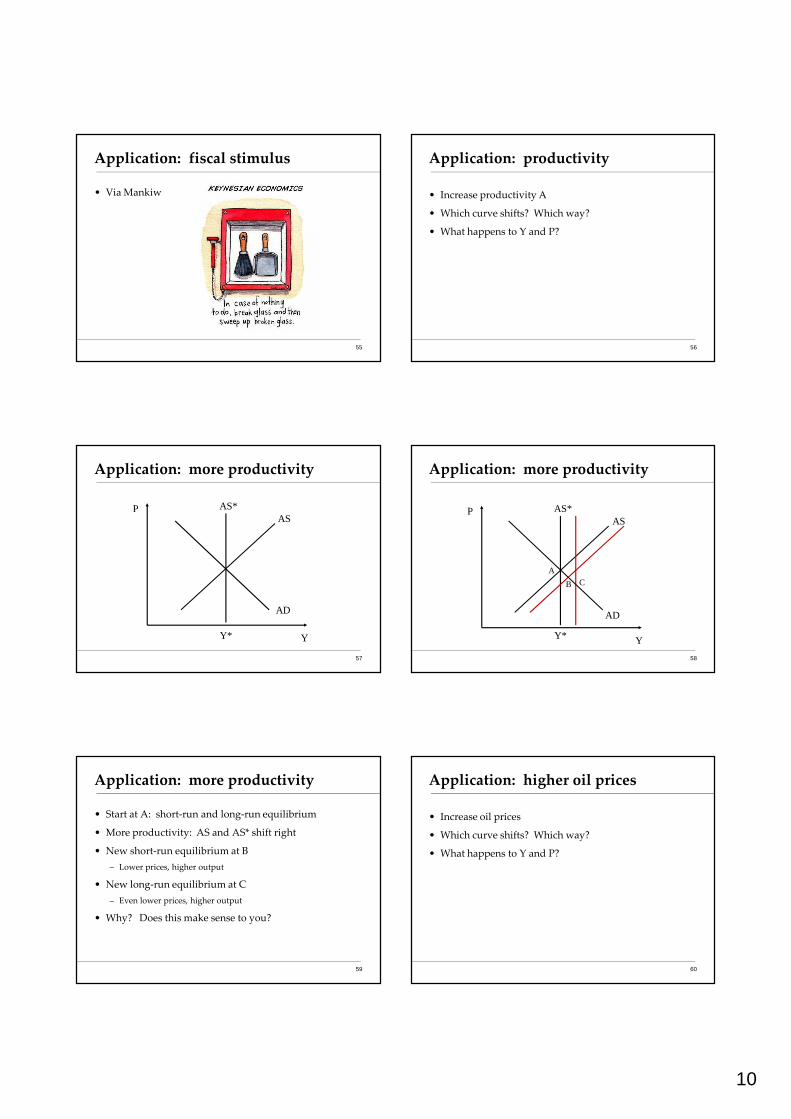
Application: productivity
• Increase productivity A
• Which curve shifts? Which way?
• What happens to Y and P?
56
Application: more productivity
Y
PAS
AD
AS*
57
Y*
Application: more productivity
Y
P AS*AS
58
Y*
AD
A
B C
Application: more productivity
• Start at A: short-run and long-run equilibrium
• More productivity: AS and AS* shift right
• New short-run equilibrium at B
– Lower prices, higher output
• New long-run equilibrium at C
– Even lower prices, higher output
• Why? Does this make sense to you?
59
Application: higher oil prices
• Increase oil prices
• Which curve shifts? Which way?
• What happens to Y and P?
60
11
Application: higher oil prices
Y
PAS
AD
AS*
61
Y*
Aggregate supply: higher oil prices
Y
P AS*AS
62
Y*
AD
A
BC
Application: higher oil prices
• Start at A: short run and long run equilibrium
• Higher oil prices: AS and AS* shift left
• New short-run equilibrium at B
– Higher prices, lower output
• New long-run equilibrium at C
– Even higher prices, lower output
• Why? Does this make sense to you?
63
What have we learned?
• Aggregate supply and demand is the analyst standard
– Supply refers to production, affected by productivity, oil prices, etc
– Demand refers to purchases, affected by money supply, government purchases, etc
• Summary
– In the long run, output is determined by the production function (the first half of the course)
– In the short run, things like the money supply and government purchases also matter (this part of the course)
64
After the break
• We’ll discuss “Crisis in confidence”
65
The Global Economy
Policy in the AS/AD Model
12
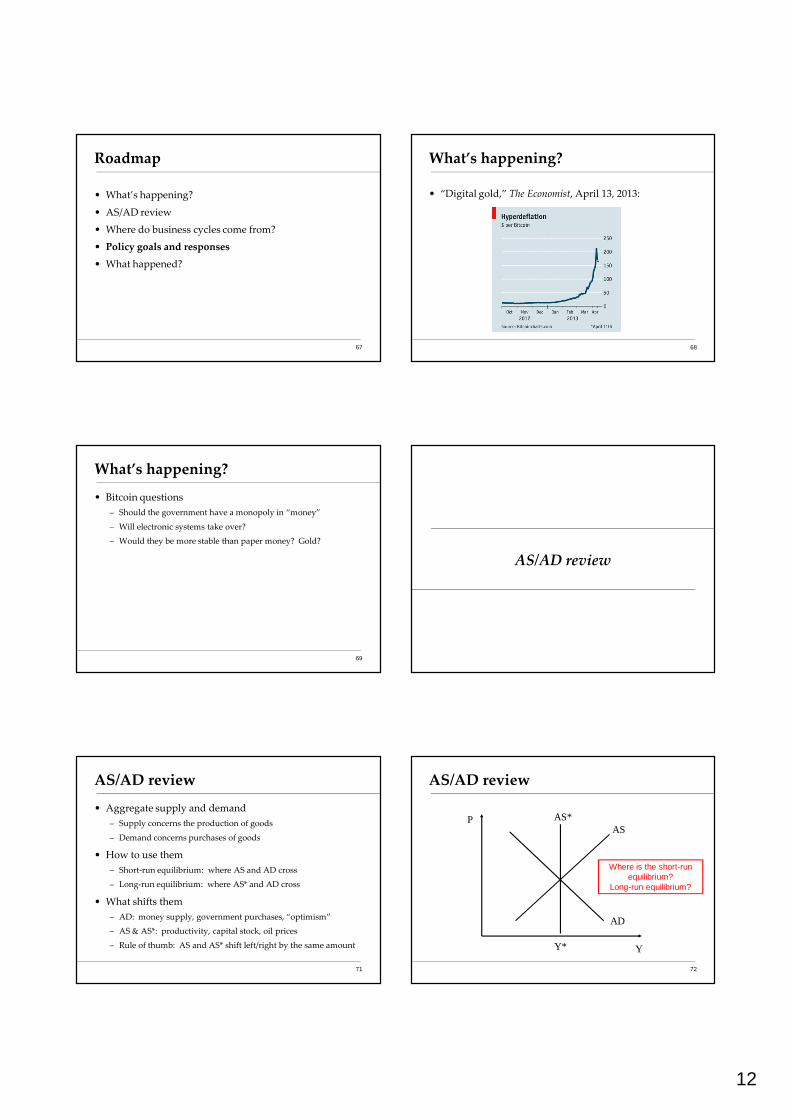
Roadmap
• What’s happening?
• AS/AD review
• Where do business cycles come from?
• Policy goals and responses
• What happened?
67
What’s happening?
• “Digital gold,” The Economist, April 13, 2013:
68
What’s happening?
• Bitcoin questions
– Should the government have a monopoly in “money”
– Will electronic systems take over?
– Would they be more stable than paper money? Gold?
69
AS/AD review
AS/AD review
• Aggregate supply and demand
– Supply concerns the production of goods
– Demand concerns purchases of goods
• How to use them
– Short-run equilibrium: where AS and AD cross
– Long-run equilibrium: where AS* and AD cross
• What shifts them
– AD: money supply, government purchases, “optimism”
– AS & AS*: productivity, capital stock, oil prices
– Rule of thumb: AS and AS* shift left/right by the same amount
71
AS/AD review
Y
PAS
AD
AS*
72
Y*
Where is the short-run equilibrium?
Long-run equilibrium?
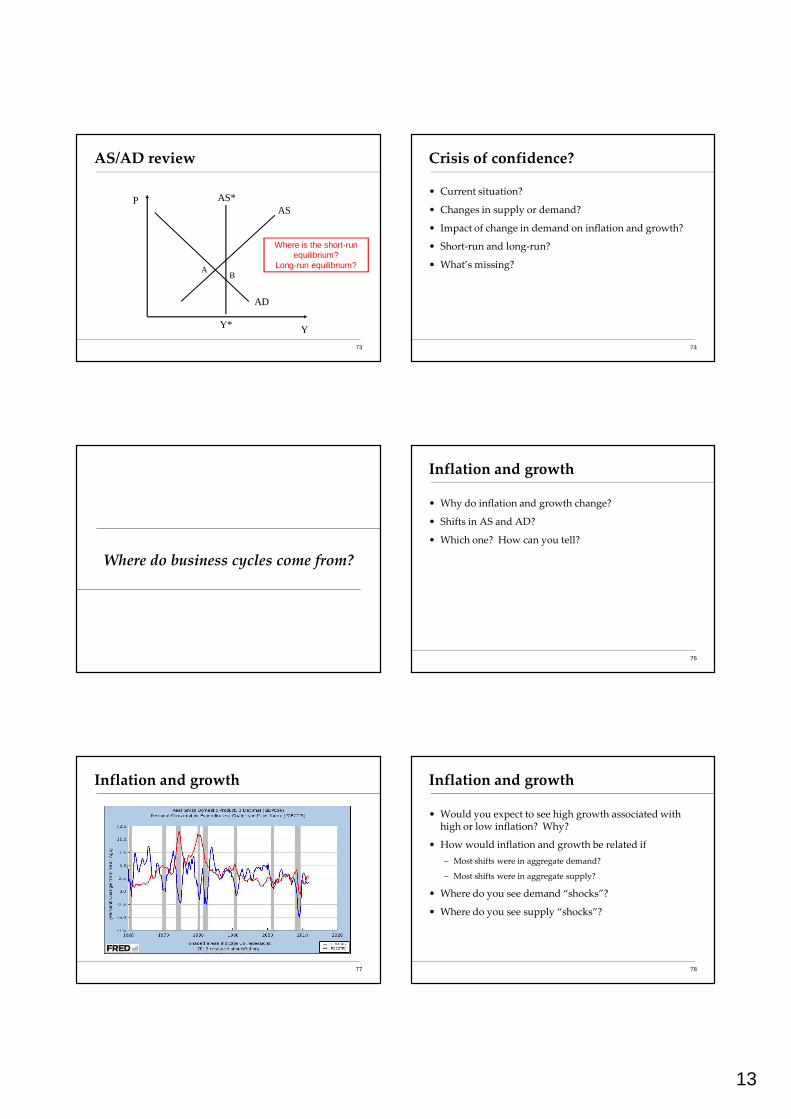
13
AS/AD review
Y
PAS
AD
AS*
AB
73
Y*
Where is the short-run equilibrium?
Long-run equilibrium?
Crisis of confidence?
• Current situation?
• Changes in supply or demand?
• Impact of change in demand on inflation and growth?
• Short-run and long-run?
• What’s missing?
74
Where do business cycles come from?
Inflation and growth
• Why do inflation and growth change?
• Shifts in AS and AD?
• Which one? How can you tell?
76
Inflation and growth
77
Inflation and growth
• Would you expect to see high growth associated with high or low inflation? Why?
• How would inflation and growth be related if
– Most shifts were in aggregate demand?
– Most shifts were in aggregate supply?
• Where do you see demand “shocks”?
• Where do you see supply “shocks”?
78
14
Inflation and growth
79
Inflation and growth
• Do we see mostly supply or demand shocks?
80
Inflation and growth
81
-2.0
0.0
2.0
4.0
6.0
8.0
10.0
12.0
14.0
-6.0 -4.0 -2.0 0.0 2.0 4.0 6.0 8.0 10.0
Inflation
GDP growth
Policy goals and responses
Policy goals and responses
• The idea
– Monetary policy should respond differently to changes in output that result from supply and demand shifts
– Accommodate one, offset the other
– Intuitive only when you understand it – not before!
83
Policy goals and responses
• What are our policy goals?
– Low inflation or stable prices [why?]
– Output at or near Y* [invisible hand again]
• How would we reach them?
– Typically monetary policy, which shifts AD
– Could use fiscal policy, too, but it takes longer to implement
84
15
Policy goals and responses
Y
PAS
AD
AS*
85
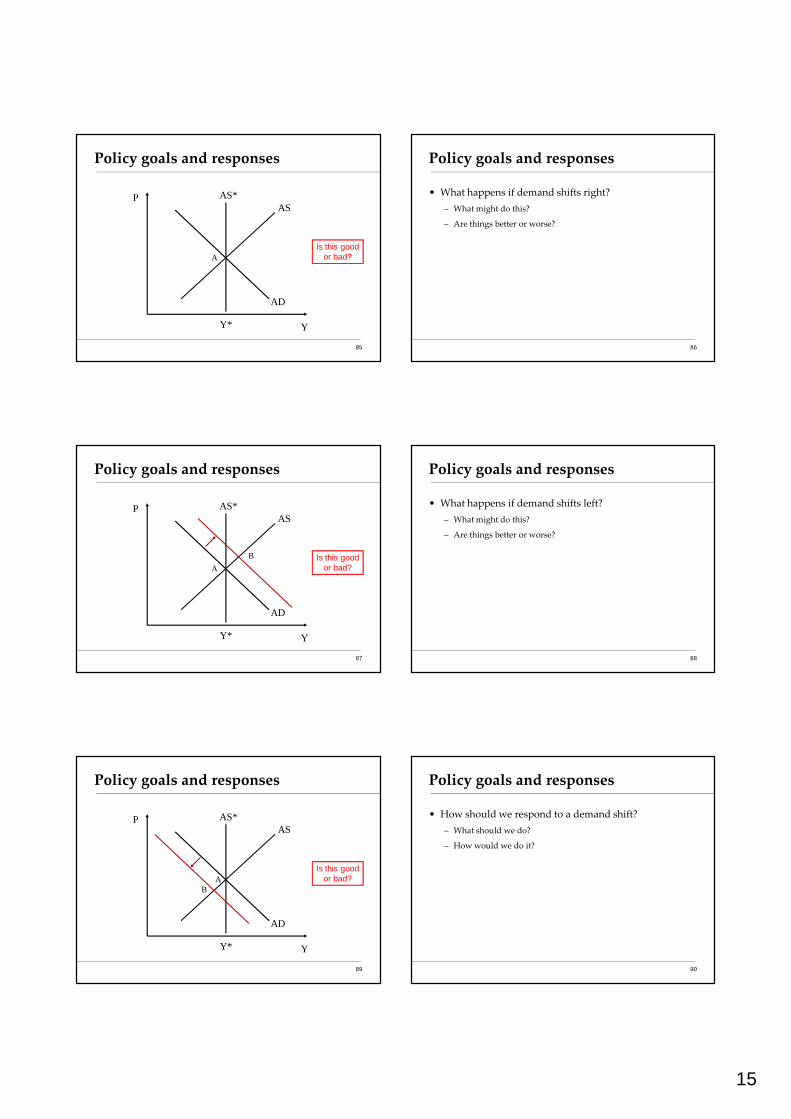
Y*
AIs this good
or bad?
Policy goals and responses
• What happens if demand shifts right?
– What might do this?
– Are things better or worse?
86
Policy goals and responses
Y
PAS
AD
AS*
87
Y*
AIs this good
or bad? B
Policy goals and responses
• What happens if demand shifts left?
– What might do this?
– Are things better or worse?
88
Policy goals and responses
Y
PAS
AD
AS*
89
Y*
AIs this good
or bad? B
Policy goals and responses
• How should we respond to a demand shift?
– What should we do?
– How would we do it?
90
16
Policy goals and responses
Y
PAS
AD
AS*
91
Y*
AWhat should policy do?
B
Policy goals and responses
• How should we respond to a demand shift?
– Reverse it: use (say) monetary policy to shift demand back to A
• Does this make sense to you?
92
Policy goals and responses
• Now do the same thing with supply shifts
• Same logic, but keep your eyes open for something new
• What happens if supply shifts right?
– What might do this?
– Are things better or worse?
93
Policy goals and responses
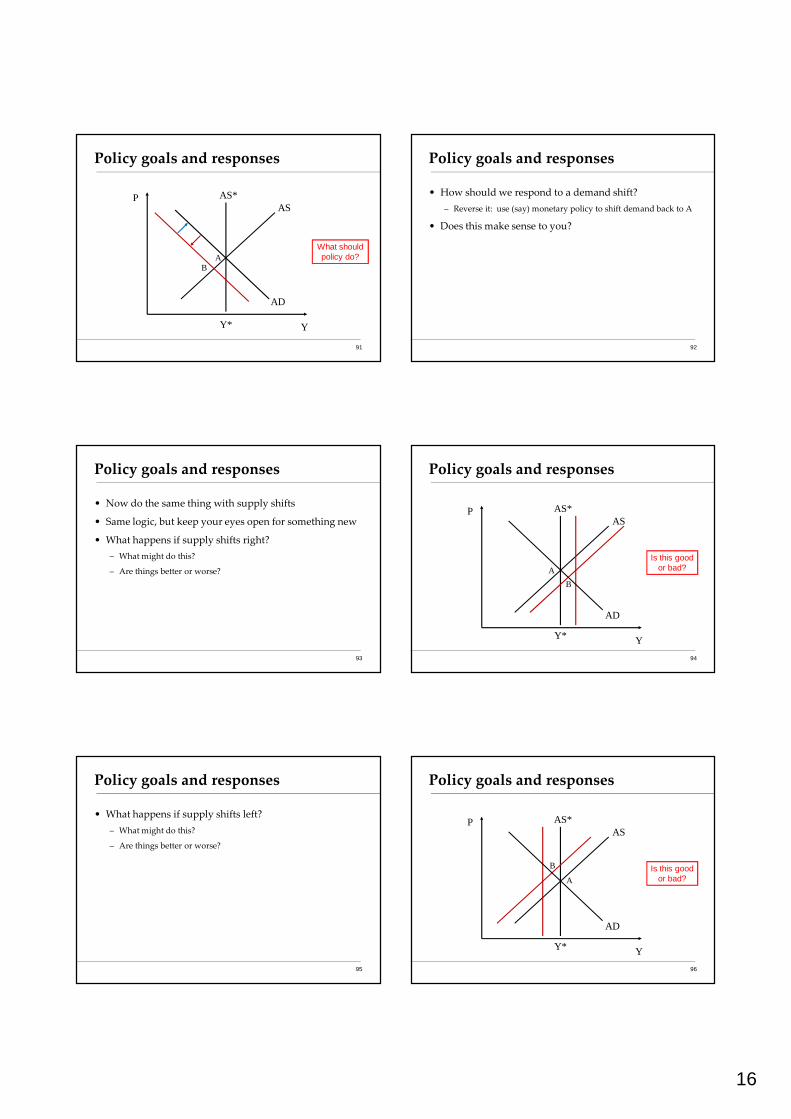
Y
P AS*AS
94
Y*
AD
A
B
Is this good or bad?
Policy goals and responses
• What happens if supply shifts left?
– What might do this?
– Are things better or worse?
95
Policy goals and responses
Y
P AS*AS
96
Y*
AD
A
B Is this good or bad?
17
Policy goals and responses
• How should we respond to a supply shift?
– What should we do?
– How should we do it?
• Reminder: policy goals are
– Stable prices
– Output at or near Y*
97
Policy goals and responses
Y
P AS*AS
98
Y*
AD
A
B
What should policy do?
Policy goals and responses
Y
P AS*AS
99
Y*
AD
A
B
Why is C good? C
Policy goals and responses
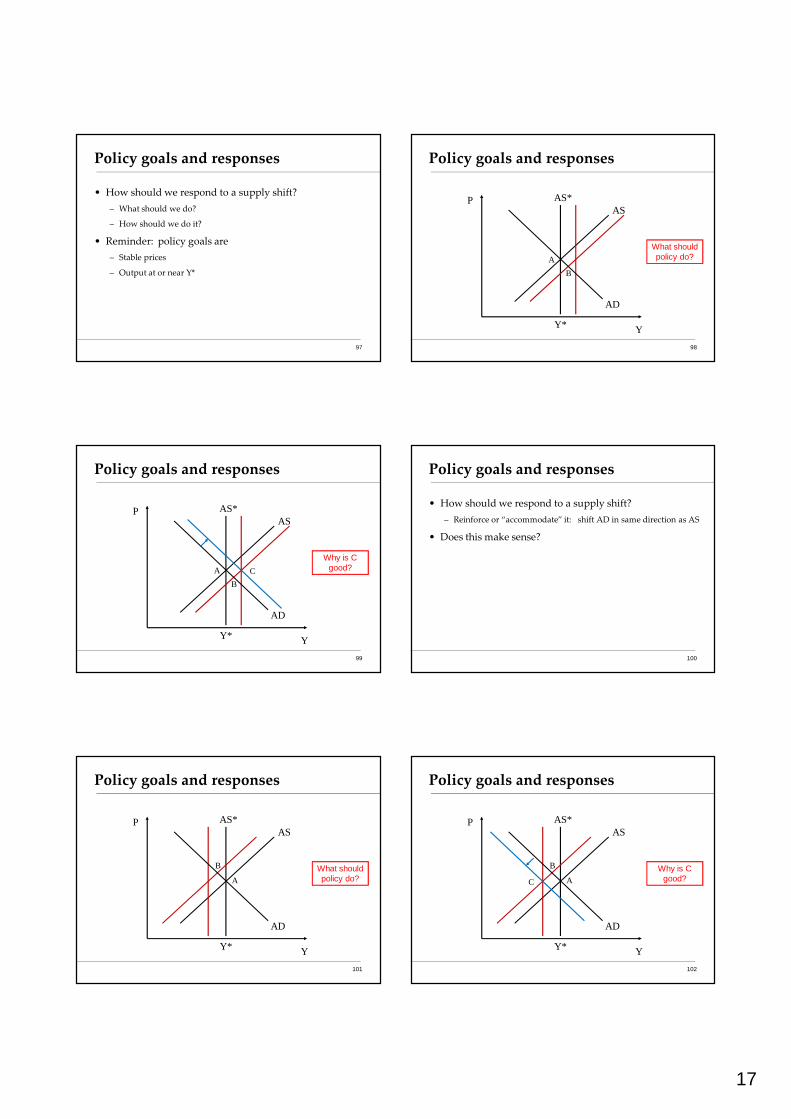
• How should we respond to a supply shift?
– Reinforce or “accommodate” it: shift AD in same direction as AS
• Does this make sense?
100
Policy goals and responses
Y
P AS*AS
101
Y*
AD
A
B What should policy do?
Policy goals and responses
Y
P AS*AS
102
Y*
AD
A
B Why is C good? C
18
Policy goals and responses
• How should we respond to a supply shift?
– Reinforce or “accommodate” it: shift AD in same direction as AS
• Does it make sense to lower output further?
103
What happened?
What happened?
• Our goal
– Identify source of shock: supply or demand?
– Recommend the appropriate policy
105
What happened?
• In the mid 1970s?
– GDP growth low, inflation jumped up
• In the early 1980s
– Double-dip recession, inflation fell sharply
• In the late 1990s?
– GDP growth high, inflation remained low
• In the early 2000s?
– Fear of deflation, aggressive monetary expansion
106
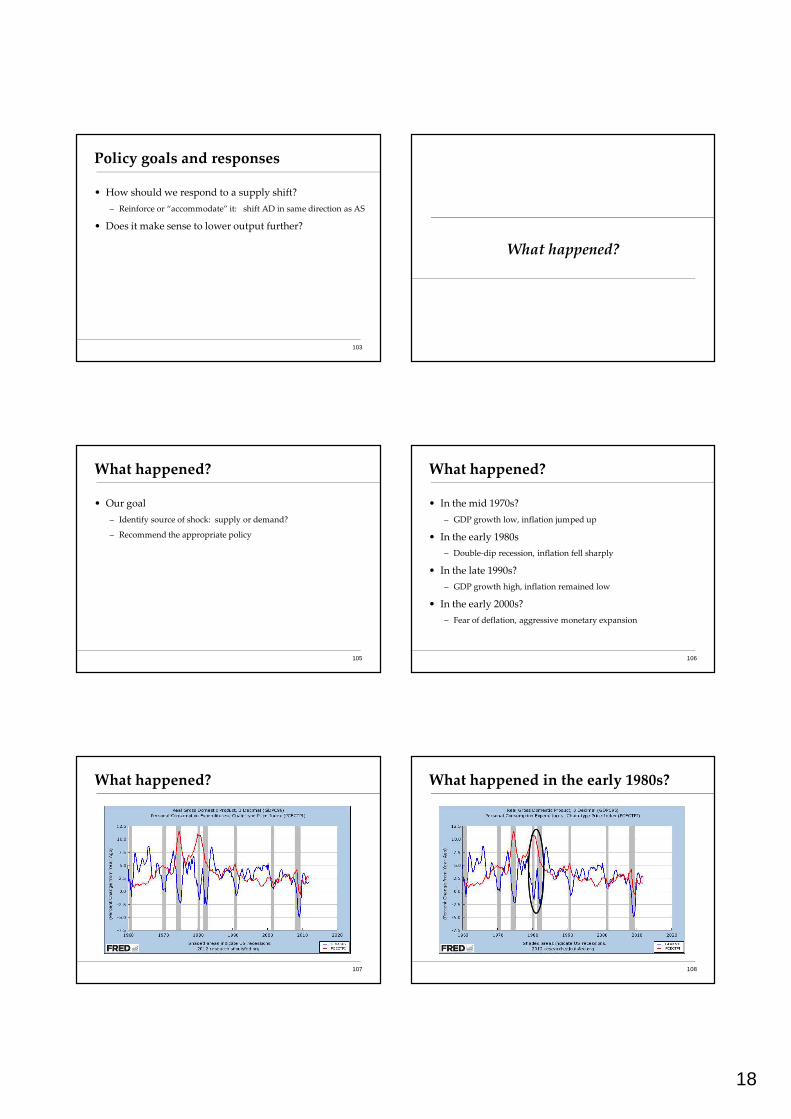
What happened?
107
What happened in the early 1980s?
108
19
What happened in the early 1980s?
• In the early 1980s?
– Double dip recession, inflation dropped sharply
• Order of events
– Volcker appointed head of Fed, charged with killing inflation
– Reduced money growth, interest rates rose sharply
– After a year or two, inflation dropped
• How did this work? Shift in supply or demand?
109
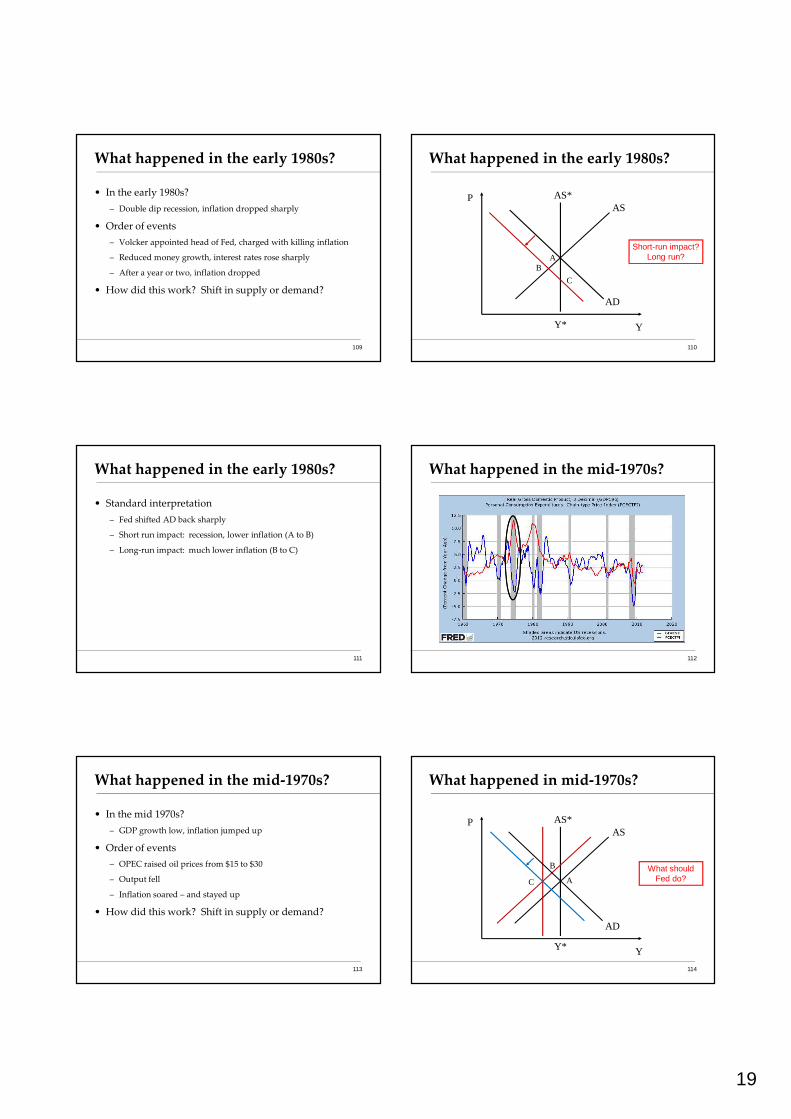
What happened in the early 1980s?
Y
PAS
AD
AS*
110
Y*
AB
Short-run impact? Long run?
C
What happened in the early 1980s?
• Standard interpretation
– Fed shifted AD back sharply
– Short run impact: recession, lower inflation (A to B)
– Long-run impact: much lower inflation (B to C)
111
What happened in the mid-1970s?
112
What happened in the mid-1970s?
• In the mid 1970s?
– GDP growth low, inflation jumped up
• Order of events
– OPEC raised oil prices from $15 to $30
– Output fell
– Inflation soared – and stayed up
• How did this work? Shift in supply or demand?
113
What happened in mid-1970s?
Y
P AS*AS
114
Y*
AD
A
B What should Fed do? C
20
What happened in mid-1970s?
Y
P AS*AS
115
Y*
AD
A
B What happens if Fed shifts AD the other way?
C
What happened in the mid-1970s?
• Standard interpretation of 1970s inflation
– OPEC was a shift left in AS/AS*
– Fed should therefore accommodate, shift AD left
– If so, we would have seen a drop in Y but stable prices
– But the Fed shifted AD right, raising inflation sharply
– Long-run output response the same in both cases
116
What happened in the late 1990s?
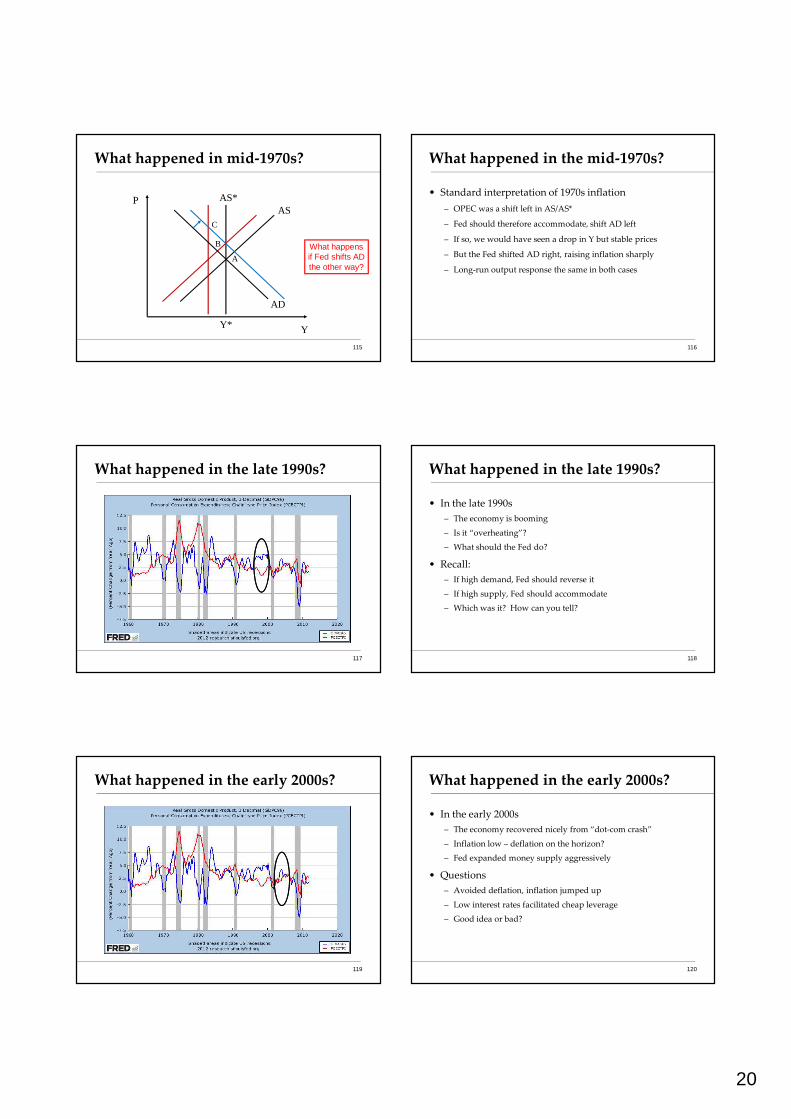
117
What happened in the late 1990s?
• In the late 1990s
– The economy is booming
– Is it “overheating”?
– What should the Fed do?
• Recall:
– If high demand, Fed should reverse it
– If high supply, Fed should accommodate
– Which was it? How can you tell?
118
What happened in the early 2000s?
119
What happened in the early 2000s?
• In the early 2000s
– The economy recovered nicely from “dot-com crash”
– Inflation low – deflation on the horizon?
– Fed expanded money supply aggressively
• Questions
– Avoided deflation, inflation jumped up
– Low interest rates facilitated cheap leverage
– Good idea or bad?
120
21
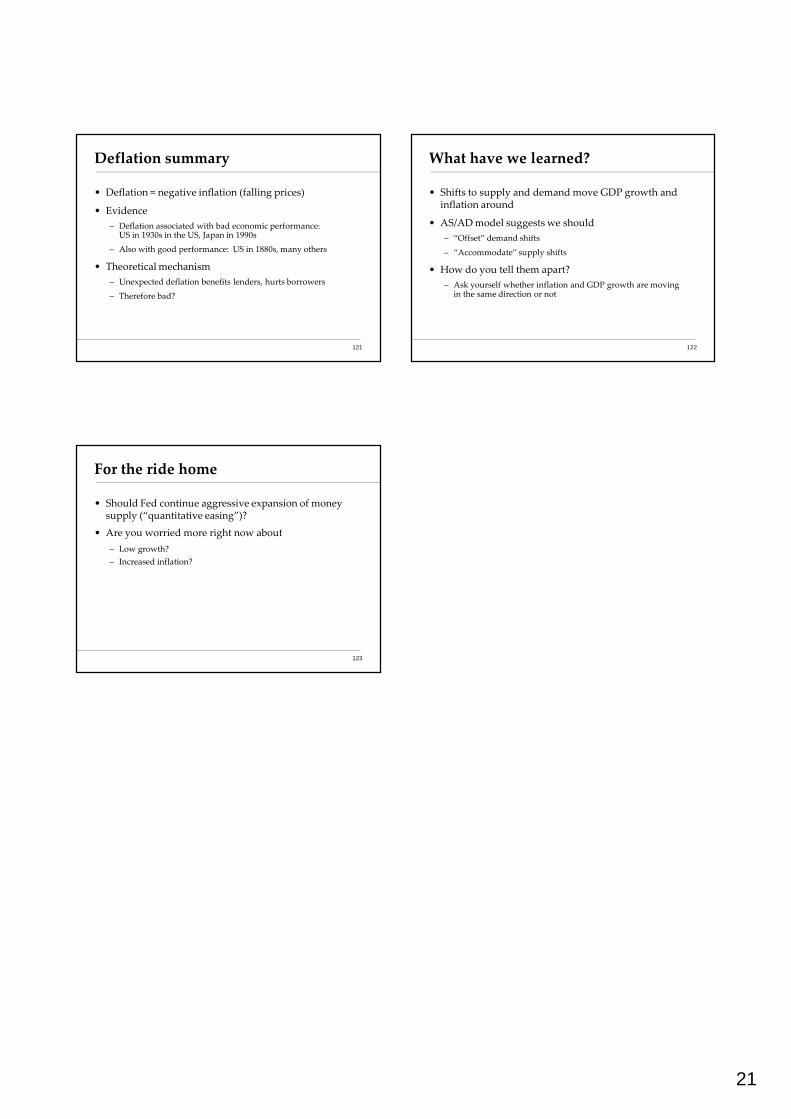
Deflation summary
• Deflation = negative inflation (falling prices)
• Evidence
– Deflation associated with bad economic performance: US in 1930s in the US, Japan in 1990s
– Also with good performance: US in 1880s, many others
• Theoretical mechanism
– Unexpected deflation benefits lenders, hurts borrowers
– Therefore bad?
121
What have we learned?
• Shifts to supply and demand move GDP growth and inflation around
• AS/AD model suggests we should
– “Offset” demand shifts
– “Accommodate” supply shifts
• How do you tell them apart?
– Ask yourself whether inflation and GDP growth are moving in the same direction or not
122
For the ride home
• Should Fed continue aggressive expansion of money supply (“quantitative easing”)?
• Are you worried more right now about
– Low growth?
– Increased inflation?
123