the u.s. economy and lodging demand the supply … october 23, 2015 ... • the u.s. economy and...
TRANSCRIPT

ECONOMETRIC ADVISORS
STATE OF THE U.S. LODGING INDUSTRY October 23, 2015
Robert Mandelbaum – Director of Research Information Services
2 ECONOMETRIC ADVISORS
• The U.S. Economy and Lodging Demand • The Supply Story • Tracking the Business Cycles of U.S. Hotels • U.S. Lodging Market Forecast • Profit Trends • Questions and Answers
PRESENTATION OUTLINE

3 ECONOMETRIC ADVISORS
HOTEL HORIZONS® FORECAST REPORTS Prepared For:
• 59 major cities • 6 national chain-scales • 6 location types
Five Year Forecasts Of:
• Supply • Demand • Occupancy • ADR • RevPAR
4 ECONOMETRIC ADVISORS
STR, Inc. • Historical rooms occupied, room available,
rooms revenue
• Pipeline of future hotel construction
Moody’s Analytics • Economic forecasts
HOTEL HORIZONS® FORECAST REPORTS Sources of Variables
ECONOMETRIC ADVISORS
THE U.S. ECONOMY AND LODGING DEMAND
6 ECONOMETRIC ADVISORS
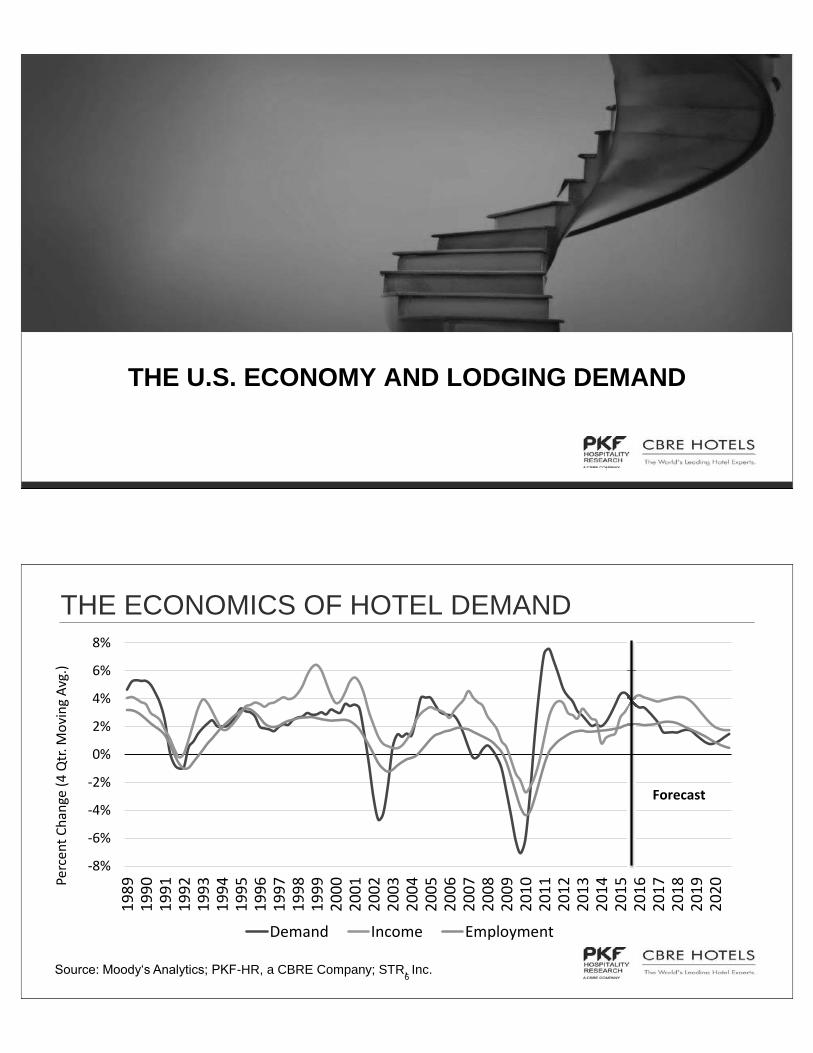
THE ECONOMICS OF HOTEL DEMAND
-8%
-6%
-4%
-2%
0%
2%
4%
6%
8%
1989
1990
1991
1992
1993
1994
1995
1996
1997
1998
1999
2000
2001
2002
2003
2004
2005
2006
2007
2008
2009
2010
2011
2012
2013
2014
2015
2016
2017
2018
2019
2020Pe
rcen
t Cha
nge
(4 Q
tr. M
ovin
g Av
g.)
Demand Income Employment
Forecast
Source: Moody‘s Analytics; PKF-HR, a CBRE Company; STR, Inc.

7 ECONOMETRIC ADVISORS
THE OUTLOOK FOR THE DRIVERS THAT ARE MOST IMPORTANT TO HOTELS REMAINS FAVORABLE
-2.7%
2.0%
-1.9%
-8.2% -5.4%
-0.5%
1.3%
3.9% 1.7%
3.9%
2.7% 2.5%
-1.5%
2.9%
0.8%
4.6%
2.7% 1.9%
0.5% 0.1%
1.9% 1.1%
3.0% 3.8%
-0.9%
4.6% 4.3%
2.1% 0.6% 3.7%
2.6% 3.8% 3.7% 3.4% 3.4% 3.0%
-10
-8
-6
-4
-2
0
2
4
6
8
10
I II III IV I II III IV I II III IV I II III IV I II III IV I II III IV I II III IV I II III IV I II III IV
2008 2009 2010 2011 2012 2013 2014 2015 2016
(GOVERNMENT) Government consumption expendituresand gross investmentTRADE (Net exports of goods and services)
BUSINESS (Gross private domestic investment)
CONSUMERS (Personal consumption expenditures)These matter the most.
4.6%
GDP Component Forecast
Source: BEA, Moody’s Analytics, PKF Hospitality Research, a CBRE Company Hotel Horizons: September – November 2015, STR, Inc.
8 ECONOMETRIC ADVISORS
1. Average weekly hours, manufacturing 2. Average weekly initial claims for unemployment insurance 3. Manufacturers’ new orders, consumer goods and materials 4. ISM® Index of New Orders 5. Manufacturers' new orders, nondefense capital goods excluding aircraft
orders 6. Building permits, new private housing units 7. Stock prices, 500 common stocks 8. Leading Credit Index™ 9. Interest rate spread, 10-year Treasury bonds less federal funds 10. Average consumer expectations for business conditions.
THE CONFERENCE BOARD L.E.I. The ten components of The Conference Board Leading Economic Index® for the U.S. include:
9 ECONOMETRIC ADVISORS
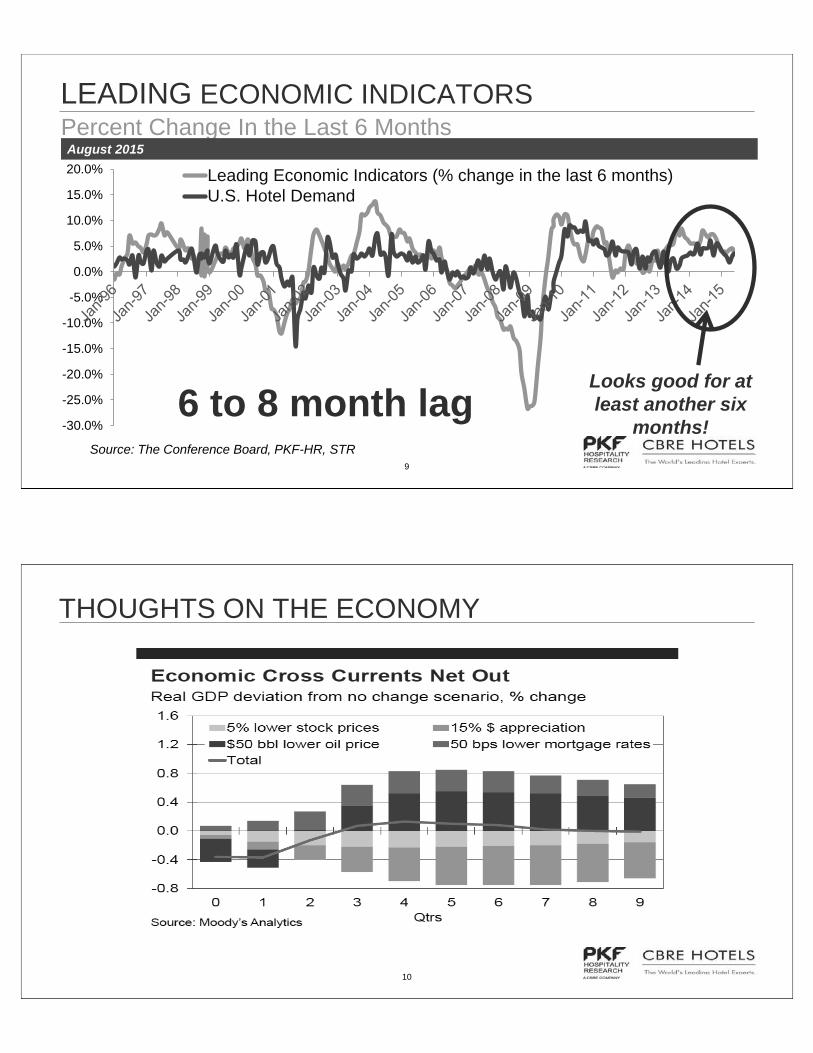
Percent Change In the Last 6 Months LEADING ECONOMIC INDICATORS
-30.0%
-25.0%
-20.0%
-15.0%
-10.0%
-5.0%
0.0%
5.0%
10.0%
15.0%
20.0% Leading Economic Indicators (% change in the last 6 months)U.S. Hotel Demand
Source: The Conference Board, PKF-HR, STR
6 to 8 month lag Looks good for at least another six
months!
August 2015
10 ECONOMETRIC ADVISORS
THOUGHTS ON THE ECONOMY
11 ECONOMETRIC ADVISORS
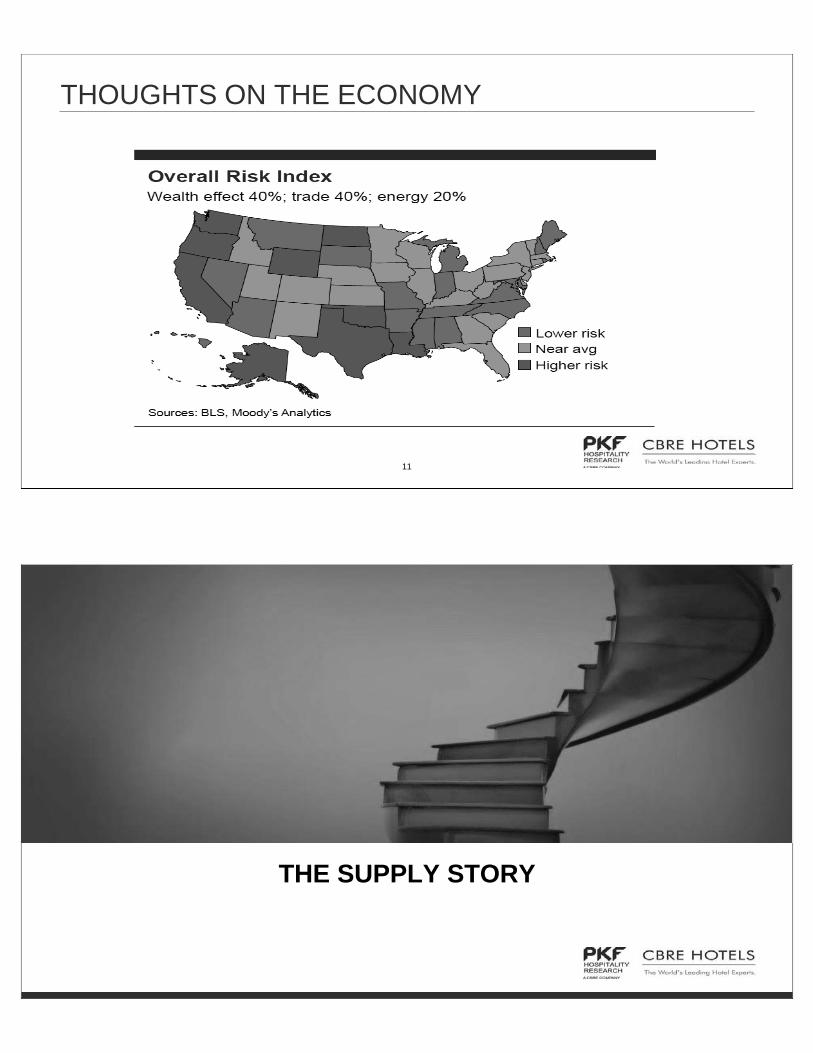
THOUGHTS ON THE ECONOMY
ECONOMETRIC ADVISORS
THE SUPPLY STORY

13 ECONOMETRIC ADVISORS
When did we hit our last peak number of new hotels entering the market?
U.S. SUPPLY CHANGE
Long Run Average = 1.9%
4.0%
3.0%
-0.2%
0.8%
1.8%
2.8%
3.8%
4.8%
5.8%Forecast
Source: PKF Hospitality Research, STR, Inc.
Q2 1999 Q1 2009
14 ECONOMETRIC ADVISORS
U.S. Pipeline, Number of Rooms by Phase, August 2015 and March 2008
TODAY VS. THE PREVIOUS PEAK OF CONSTRUCTION ACTIVITY
Phase 2015 Q1/2008 % Difference Change
In Construction 132,401 207,468 -36.1%
Final Planning 175,090 113,419 54.4%
Planning 132,353 344,363 -61.6%
Active Pipeline 439,844 665,250 -33.9%
Source: STR, Inc.
2.5%
0.7%
3.5%
2.1%
Change from July 2015

15 ECONOMETRIC ADVISORS
1. Financing remains a challenge. 2. Elevated uncertainty that characterized this past cycle
has not yet been forgotten. 3. Construction costs are rising faster than property values
in many markets, undermining the feasibility of new development.
4. Scarcity of brands that lenders are willing to finance.
WHY SO LITTLE NEW CONSTRUCTION?
15
rands that lenders are willing to finance.citpty of b
A NEW DISRUPTOR?
17 ECONOMETRIC ADVISORS
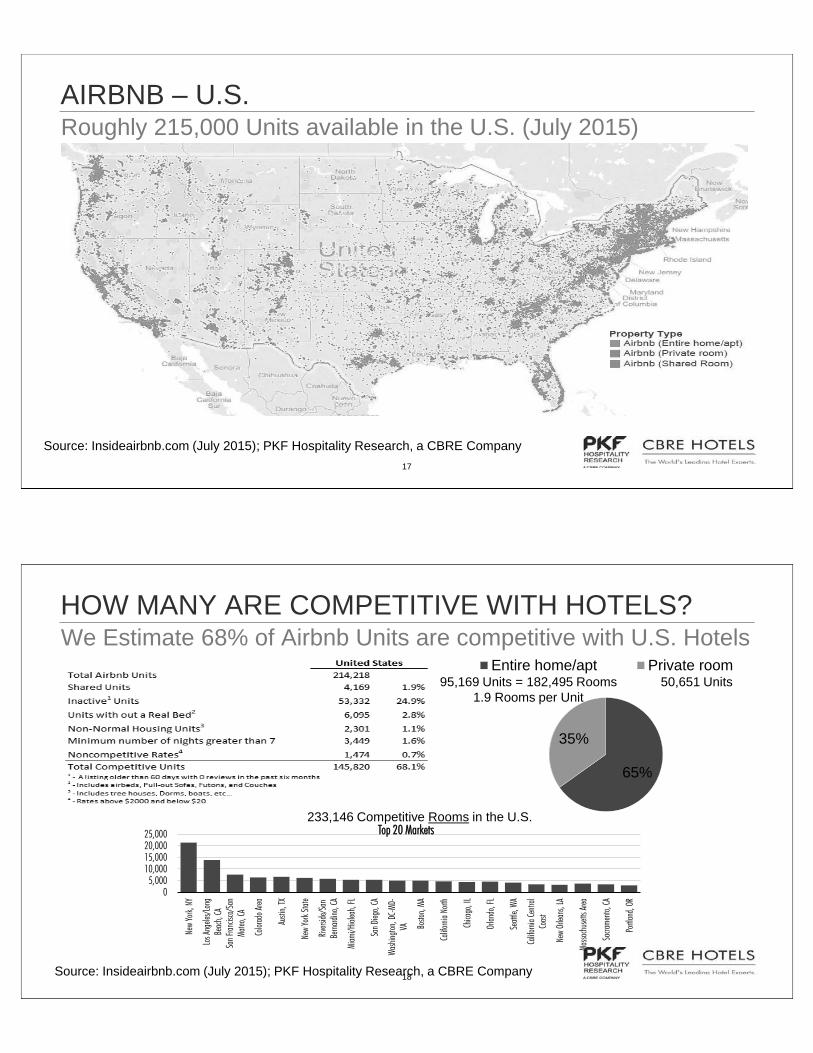
Roughly 215,000 Units available in the U.S. (July 2015) AIRBNB – U.S.
Source: Insideairbnb.com (July 2015); PKF Hospitality Research, a CBRE Company
18 ECONOMETRIC ADVISORS
We Estimate 68% of Airbnb Units are competitive with U.S. Hotels HOW MANY ARE COMPETITIVE WITH HOTELS?
Source: Insideairbnb.com (July 2015); PKF Hospitality Research, a CBRE Company
65%
35%
Entire home/apt Private room95,169 Units = 182,495 Rooms
1.9 Rooms per Unit 50,651 Units
233,146 Competitive Rooms in the U.S.
05,000
10,00015,00020,00025,000
New
York,
NY
Los A
ngele
s/Lon
gBe
ach,
CASa
n Fran
cisco
/San
Mateo
, CA
Color
ado A
rea
Austi
n, TX
New
York
State
Rivers
ide/S
anBe
rnardi
no, C
A
Miam
i/Hial
eah,
FL
San D
iego,
CA
Wash
ington
, DC-M
D-VA Bo
ston,
MA
Califo
rnia N
orth
Chica
go, IL
Orlan
do, F
L
Seatt
le, W
A
Califo
rnia C
entra
lCo
ast
New
Orlea
ns, L
A
Massa
chus
etts A
rea
Sacra
mento
, CA
Portla
nd, O
R
Top 20 Markets
19 ECONOMETRIC ADVISORS
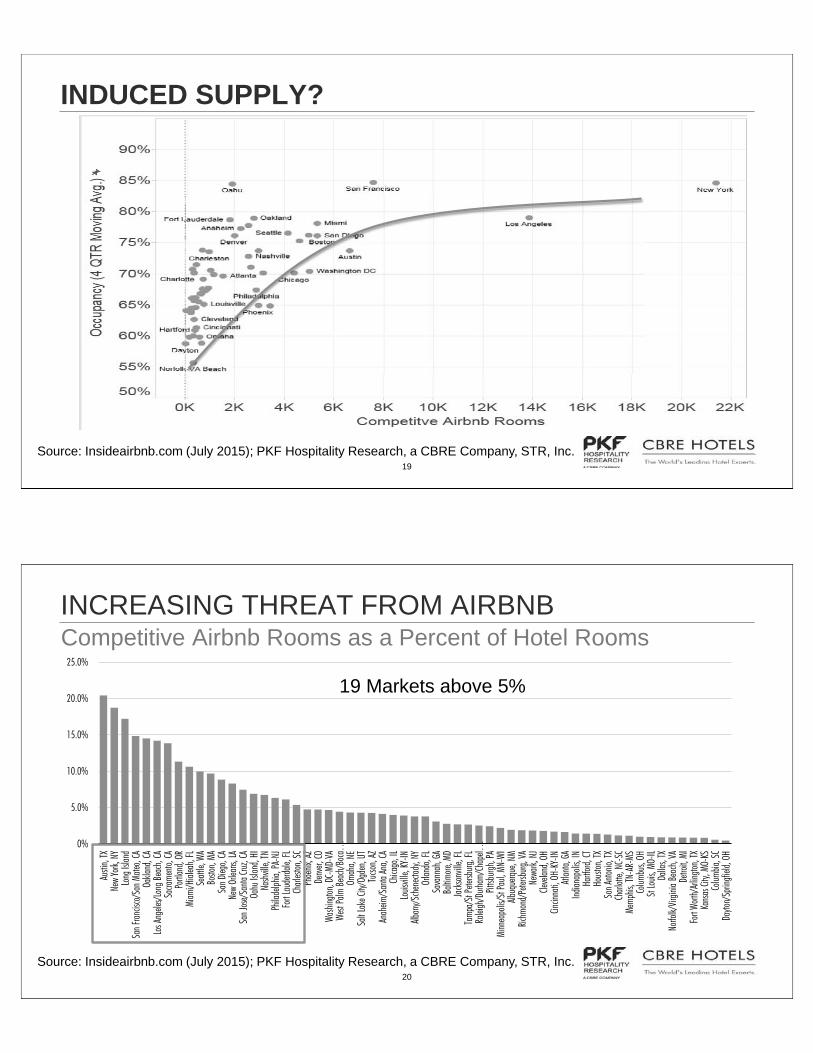
INDUCED SUPPLY?
Source: Insideairbnb.com (July 2015); PKF Hospitality Research, a CBRE Company, STR, Inc.
20 ECONOMETRIC ADVISORS
0%
5.0%
10.0%
15.0%
20.0%
25.0%
Austi
n, TX
New
York,
NY
Long
Islan
dSa
n Fran
cisco
/San
Mate
o, CA
Oakla
nd, C
ALo
s Ang
eles/L
ong B
each
, CA
Sacra
mento
, CA
Portla
nd, O
RMi
ami/H
ialea
h, FL
Seatt
le, W
ABo
ston,
MASa
n Dieg
o, CA
New
Orlea
ns, L
ASa
n Jos
e/Sa
nta Cr
uz, C
AOa
hu Is
land,
HINa
shvil
le, TN
Phila
delph
ia, PA
-NJ
Fort
Laud
erdale
, FL
Charl
eston
, SC
Phoe
nix, A
ZDe
nver,
COWa
shing
ton, D
C-MD
-VA
West
Palm
Bea
ch/B
oca…
Omah
a, NE
Salt L
ake C
ity/O
gden
, UT
Tucso
n, AZ
Anah
eim/S
anta
Ana,
CACh
icago
, IL
Louis
ville,
KY-IN
Alban
y/Sch
enect
ady,
NYOr
lando
, FL
Sava
nnah
, GA
Baltim
ore, M
DJa
ckson
ville,
FLTa
mpa/
St Pe
tersb
urg, F
LRa
leigh
/Durh
am/C
hape
l…Pit
tsburg
h, PA
Minn
eapo
lis/S
t Pau
l, MN-
WIAlb
uque
rque,
NMRic
hmon
d/Pe
tersb
urg, V
ANe
wark,
NJ
Cleve
land,
OHCin
cinna
ti, OH
-KY-
INAtl
anta,
GAInd
ianap
olis,
INHa
rtford,
CTHo
uston
, TX
San A
ntonio
, TX
Charl
otte,
NC-S
CMe
mphis
, TN-
AR-M
SCo
lumbu
s, OH
St Lo
uis, M
O-IL
Dalla
s, TX
Norfo
lk/Vir
ginia
Beac
h, VA
Detro
it, MI
Fort
Worth
/Arlin
gton,
TXKa
nsas
City,
MO-
KSCo
lumbia
, SC
Dayto
n/Sp
ringfi
eld, O
H
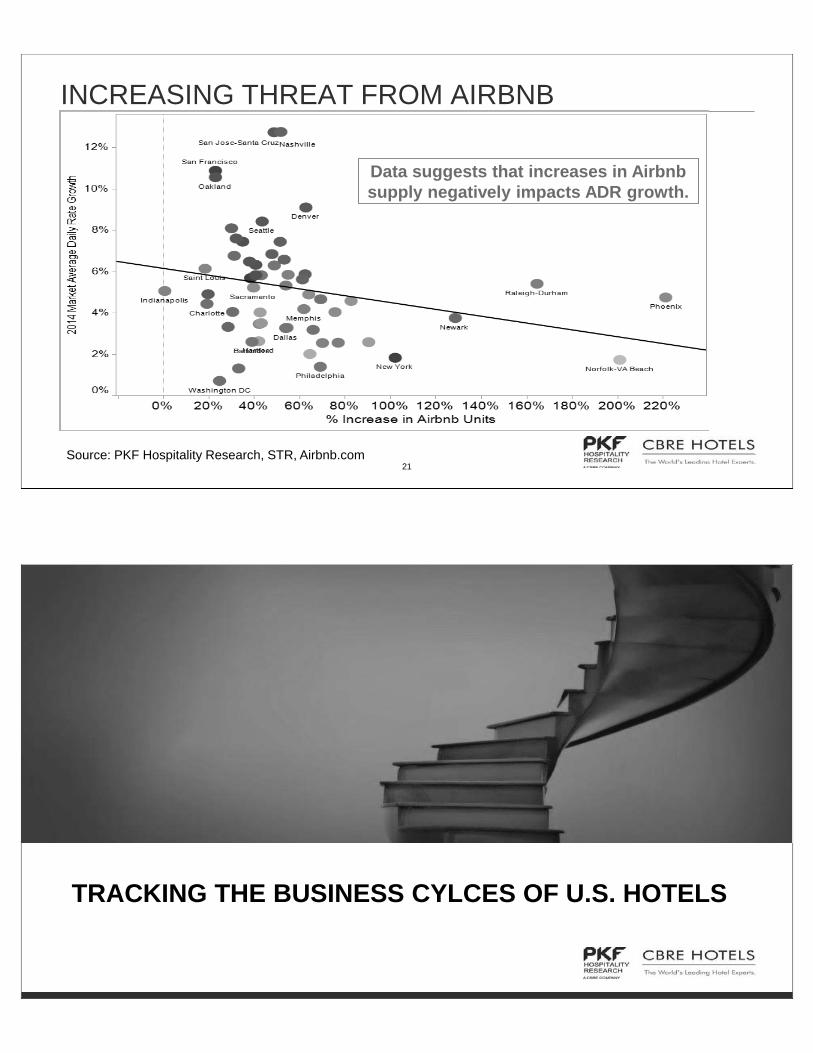
Competitive Airbnb Rooms as a Percent of Hotel Rooms INCREASING THREAT FROM AIRBNB
19 Markets above 5%
Source: Insideairbnb.com (July 2015); PKF Hospitality Research, a CBRE Company, STR, Inc.
21 ECONOMETRIC ADVISORS
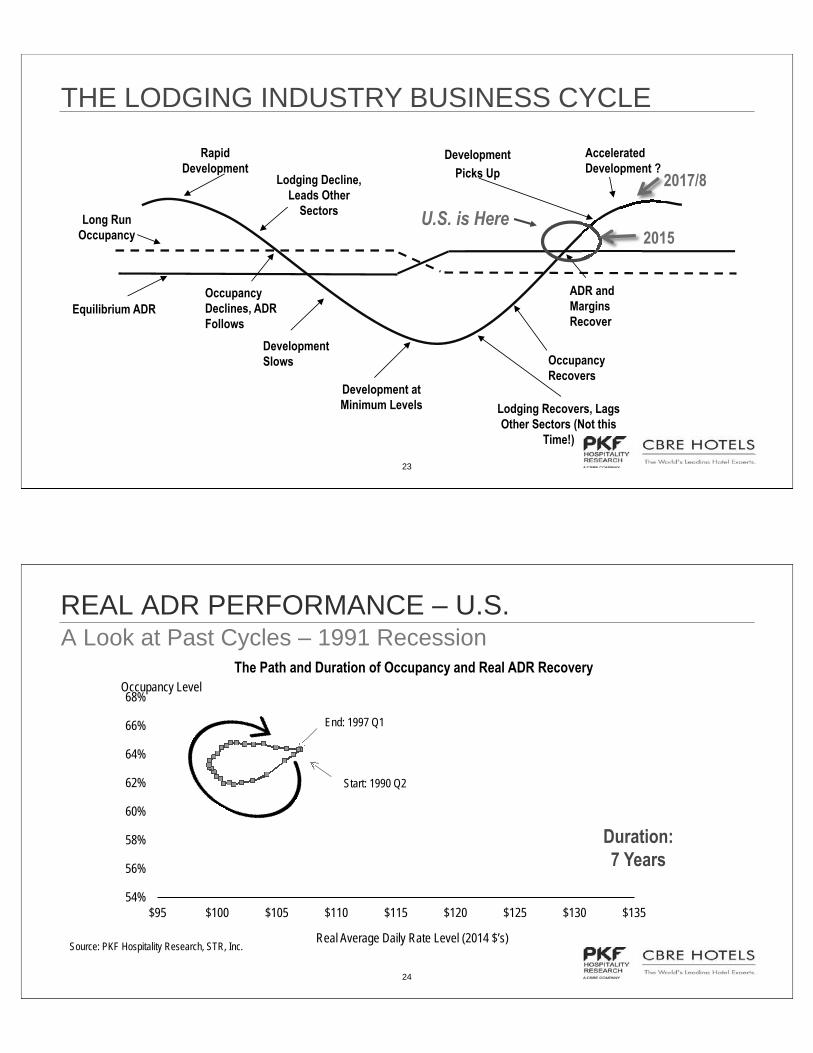
INCREASING THREAT FROM AIRBNB
Data suggests that increases in Airbnb supply negatively impacts ADR growth.
Source: PKF Hospitality Research, STR, Airbnb.com
ECONOMETRIC ADVISORS
TRACKING THE BUSINESS CYLCES OF U.S. HOTELS
23 ECONOMETRIC ADVISORS
Rapid Development
Occupancy Declines, ADR Follows
Development at Minimum Levels
Lodging Decline, Leads Other
Sectors
Occupancy Recovers
ADR and Margins Recover
Development Picks Up
Development Slows
Lodging Recovers, Lags Other Sectors (Not this
Time!)
Long Run Occupancy
Accelerated Development ?
Equilibrium ADR
U.S. is Here 2015
p2017/8
THE LODGING INDUSTRY BUSINESS CYCLE
24 ECONOMETRIC ADVISORS
A Look at Past Cycles – 1991 Recession REAL ADR PERFORMANCE – U.S.
Real Average Daily Rate Level (2014 $’s)
Duration: 7 Years
The Path and Duration of Occupancy and Real ADR Recovery
Source: PKF Hospitality Research, STR, Inc.
54%
56%
58%
60%
62%
64%
66%
68%
$95 $100 $105 $110 $115 $120 $125 $130 $135
End: 1997 Q1
Start: 1990 Q2
Occupancy Level
25 ECONOMETRIC ADVISORS
A Look at Past Cycles – 2001 Recession REAL ADR PERFORMANCE – U.S.
Real Average Daily Rate Level (2014 $’s)
Duration: 6 Years – 1 Quarter
The Path and Duration of Occupancy and Real ADR Recovery
54%
56%
58%
60%
62%
64%
66%
68%
$95 $100 $105 $110 $115 $120 $125 $130 $135
End: 2007 Q1
Start: 2001 Q1
Source: PKF Hospitality Research, STR, Inc.
Occupancy Level
26 ECONOMETRIC ADVISORS
Current Cycle REAL ADR PERFORMANCE – U.S.
Real Average Daily Rate Level (2014 $’s)
The Path and Duration of Occupancy and Real ADR Recovery
54%
56%
58%
60%
62%
64%
66%
68%
$95 $100 $105 $110 $115 $120 $125 $130 $135
Present
Start: 2008 Q1
Source: PKF Hospitality Research, STR, Inc.
Occupancy Level

27 ECONOMETRIC ADVISORS
54%
56%
58%
60%
62%
64%
66%
68%
$95 $100 $105 $110 $115 $120 $125 $130 $135
2015 Q2
Start: 2008 Q1
Forecast End: 2015 Q4
Current Cycle – cont’d REAL ADR PERFORMANCE – U.S.
Real Average Daily Rate Level (2014 $’s)
The Path and Duration of Occupancy and Real ADR Recovery
Current Cycle – Sept 2015
Forecast Duration: 8.5 Years
Source: PKF Hospitality Research, STR, Inc.
Occupancy Level
28 ECONOMETRIC ADVISORS
54%
56%
58%
60%
62%
64%
66%
68%
$95 $105 $115 $125 $135
2015 Q2
Start: 2008 Q1
Forecast End: 2015 Q4
Current Cycle – cont’d REAL ADR PERFORMANCE – U.S.
Occupancy
Level
Real Average Daily Rate Level (2014 $’s)
The Path and Duration of Occupancy and Real ADR Recovery
Forecast Duration: 8.5 Years
Source: PKF Hospitality Research, STR, Inc.
CycleCycle Start
Cycle Peak
At Real ADR
Recovery Delta1990 64.4% 64.8% 64.3% -0.1%2001 63.1% 63.5% 62.9% -0.2%2008 62.3% 65.8% 65.4% 3.1%
Occupancy Level
ECONOMETRIC ADVISORS
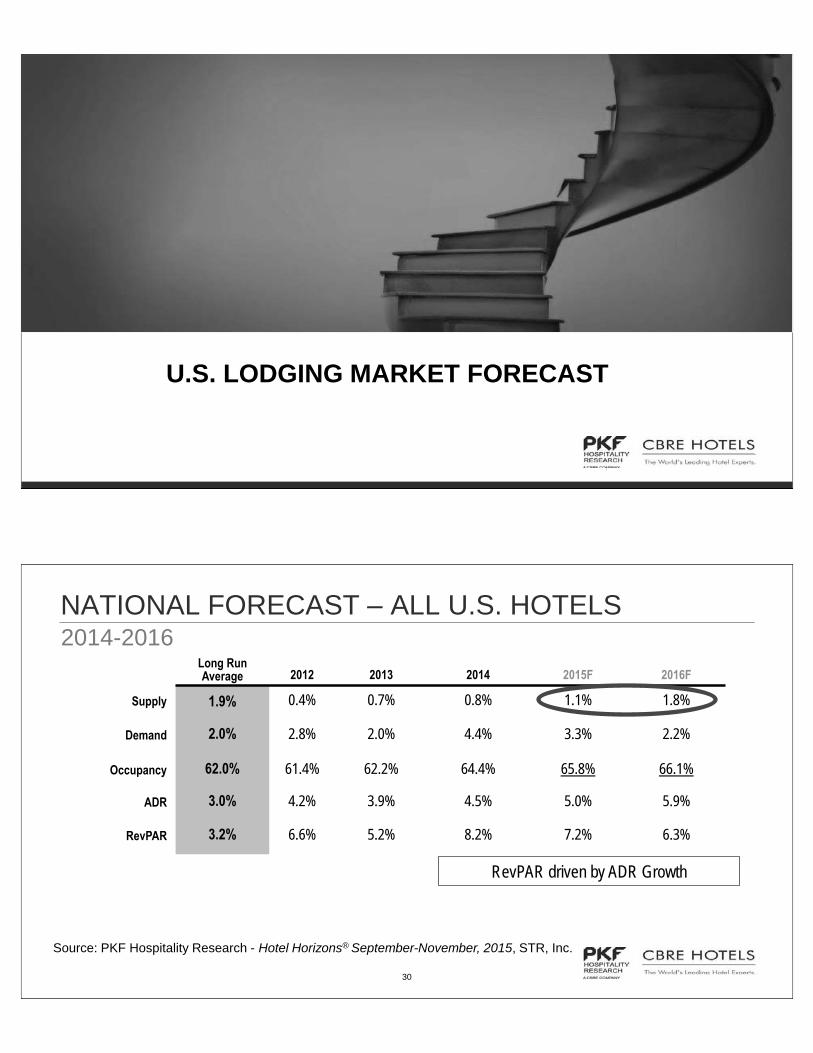
U.S. LODGING MARKET FORECAST
30 ECONOMETRIC ADVISORS
2014-2016 NATIONAL FORECAST – ALL U.S. HOTELS
Long Run Average 2012 2013 2014 2015F 2016F
Supply 1.9% 0.4% 0.7% 0.8% 1.1% 1.8%
Demand 2.0% 2.8% 2.0% 4.4% 3.3% 2.2%
Occupancy 62.0% 61.4% 62.2% 64.4% 65.8% 66.1%
ADR 3.0% 4.2% 3.9% 4.5% 5.0% 5.9%
RevPAR 3.2% 6.6% 5.2% 8.2% 7.2% 6.3%
RevPAR driven by ADR Growth
Source: PKF Hospitality Research - Hotel Horizons® September-November, 2015, STR, Inc.

31 ECONOMETRIC ADVISORS
Lower-Priced Categories Moving Up The Recovery Curve REVPAR FORECAST BY CHAIN-SCALE
Chain-Scale 2014 2015F 2016F
Luxury 6.3% 6.4% 7.0%
Upper-Upscale 7.1% 6.1% 6.0%
Upscale 8.5% 6.4% 6.5%
Upper-Midscale 8.3% 6.8% 7.1%
Midscale 8.3% 7.7% 6.0%
Economy 8.7% 7.3% 7.1%
All Hotels 8.2% 7.2% 6.3% Source: PKF Hospitality Research - Hotel Horizons® September-November, 2015, STR, Inc.
32 ECONOMETRIC ADVISORS
U.S. HOTEL MARKETS GREATEST AND LEAST CHANGE IN REVPAR
-7.6% 0.3% 0.3% 0.3% 0.6%
6.3% 7.9%
8.3% 9.6%
10.4% 11.6%
-10% -5% 0% 5% 10% 15%
HoustonPittsburgh
MiamiNew York
OmahaNational Average
SeattleAtlanta
NashvilleSan Jose-Santa Cruz
Oakland
Source: PKF Hospitality Research - Hotel Horizons® September-November, 2015, STR, Inc.
Forecast Change 2015 to 2016
ECONOMETRIC ADVISORS
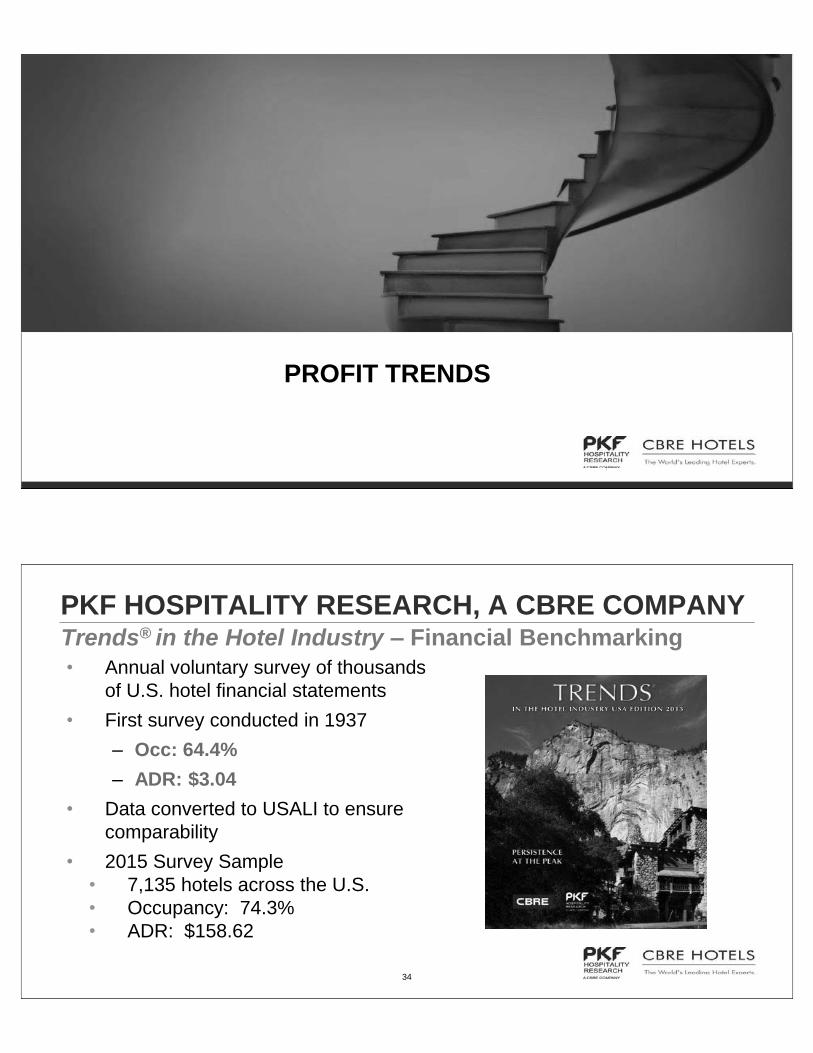
PROFIT TRENDS
34 ECONOMETRIC ADVISORS
PKF HOSPITALITY RESEARCH, A CBRE COMPANY Trends® in the Hotel Industry – Financial Benchmarking • Annual voluntary survey of thousands
of U.S. hotel financial statements • First survey conducted in 1937
– Occ: 64.4% – ADR: $3.04
• Data converted to USALI to ensure comparability
• 2015 Survey Sample • 7,135 hotels across the U.S. • Occupancy: 74.3% • ADR: $158.62
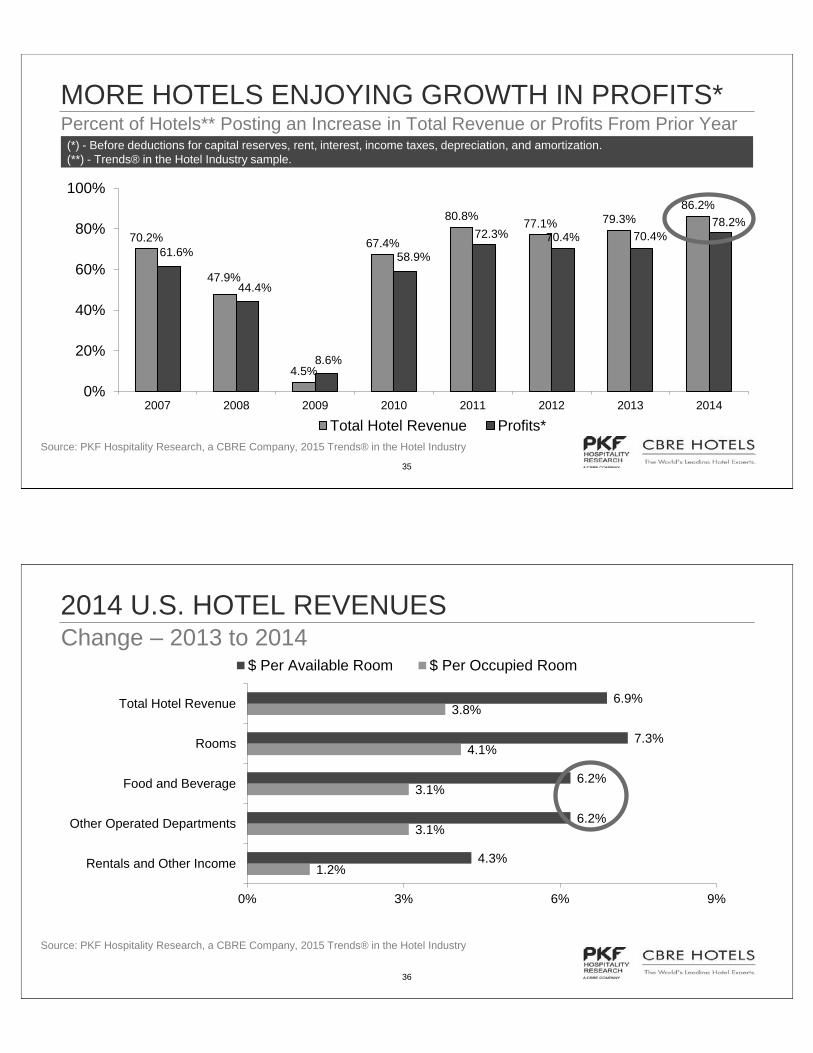
35 ECONOMETRIC ADVISORS
Percent of Hotels** Posting an Increase in Total Revenue or Profits From Prior Year MORE HOTELS ENJOYING GROWTH IN PROFITS* (*) - Before deductions for capital reserves, rent, interest, income taxes, depreciation, and amortization. (**) - Trends® in the Hotel Industry sample.
70.2%
47.9%
4.5%
67.4%
80.8% 77.1% 79.3% 86.2%
61.6%
44.4%
8.6%
58.9%
72.3% 70.4% 70.4% 78.2%
0%
20%
40%
60%
80%
100%
2007 2008 2009 2010 2011 2012 2013 2014
Total Hotel Revenue Profits*Source: PKF Hospitality Research, a CBRE Company, 2015 Trends® in the Hotel Industry
36 ECONOMETRIC ADVISORS
Change – 2013 to 2014 2014 U.S. HOTEL REVENUES
Source: PKF Hospitality Research, a CBRE Company, 2015 Trends® in the Hotel Industry
1.2%
3.1%
3.1%
4.1%
3.8%
4.3%
6.2%
6.2%
7.3%
6.9%
0% 3% 6% 9%
Rentals and Other Income
Other Operated Departments
Food and Beverage
Rooms
Total Hotel Revenue
$ Per Available Room $ Per Occupied Room
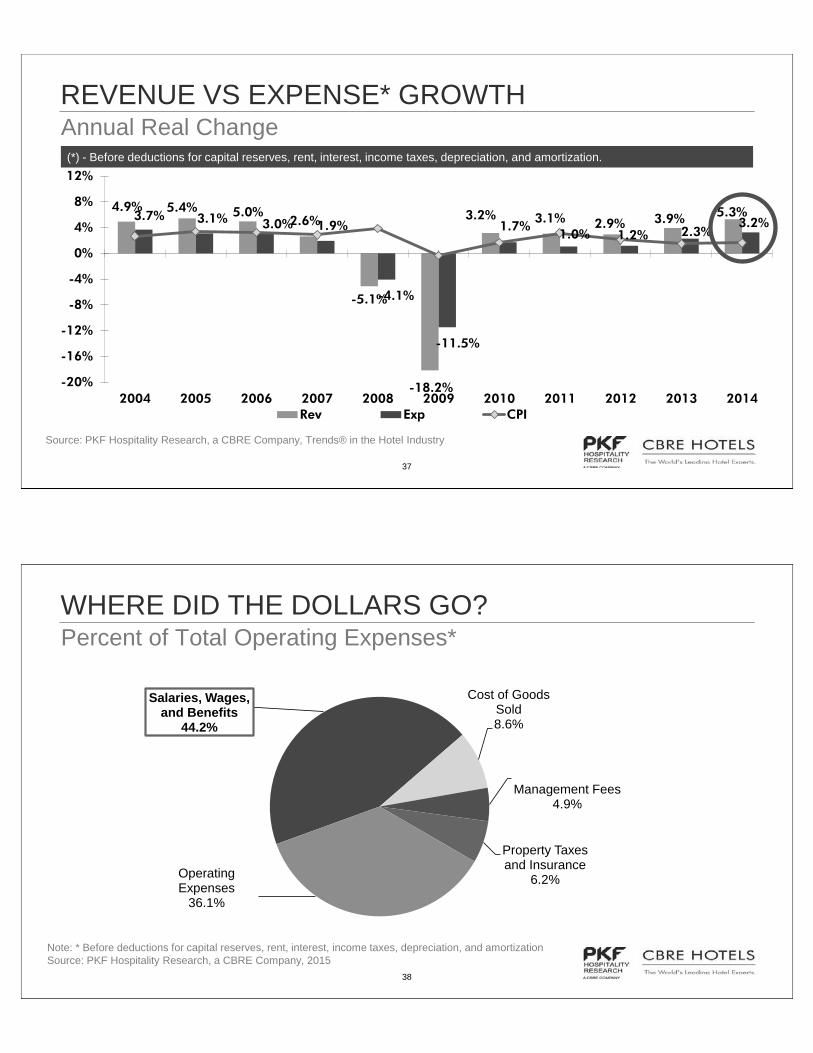
37 ECONOMETRIC ADVISORS
Annual Real Change REVENUE VS EXPENSE* GROWTH
(*) - Before deductions for capital reserves, rent, interest, income taxes, depreciation, and amortization.
Source: PKF Hospitality Research, a CBRE Company, Trends® in the Hotel Industry
4.9% 5.4% 5.0% 2.6%
-5.1%
-18.2%
3.2% 3.1% 2.9% 3.9% 5.3% 3.7% 3.1% 3.0% 1.9%
-4.1%
-11.5%
1.7% 1.0% 1.2% 2.3%
3.2%
-20%
-16%
-12%
-8%
-4%
0%
4%
8%
12%
2004 2005 2006 2007 2008 2009 2010 2011 2012 2013 2014Rev Exp CPI
38 ECONOMETRIC ADVISORS
Percent of Total Operating Expenses* WHERE DID THE DOLLARS GO?
Salaries, Wages, and Benefits
44.2%
Cost of Goods Sold 8.6%
Management Fees 4.9%
Property Taxes and Insurance
6.2% Operating Expenses
36.1%
Note: * Before deductions for capital reserves, rent, interest, income taxes, depreciation, and amortization Source: PKF Hospitality Research, a CBRE Company, 2015

39 ECONOMETRIC ADVISORS
CHANGE IN HOSPITALITY EMPLOYMENT COMPENSATION
Source: PKF Hospitality Research, A CBRE Company, Bureau of Labor Statistics, 2015
3%
4%
5%
6%
7%
8%
9%
10%
-1%
0%
1%
2%
3%
4%
5%
6%
2004 2005 2006 2007 2008 2009 2010 2011 2012 2013 2014
Change in Average Hourly Compensation for Hospitality Employees U.S. Unemployment Rate
Change In Hourly Compensation U.S. Unemployment Rate
40 ECONOMETRIC ADVISORS
CHANGE IN HOURS WORKED VS. CHANGE IN ROOMS OCCUPIED
Source: PKF Hospitality Research, A CBRE Company, Bureau of Labor Statistics, 2015
-15%
-10%
-5%
0%
5%
10%
2004 2005 2006 2007 2008 2009 2010 2011 2012 2013 2014
Change in Total Hours Worked Change in Occupied Rooms
Annual Change
41 ECONOMETRIC ADVISORS
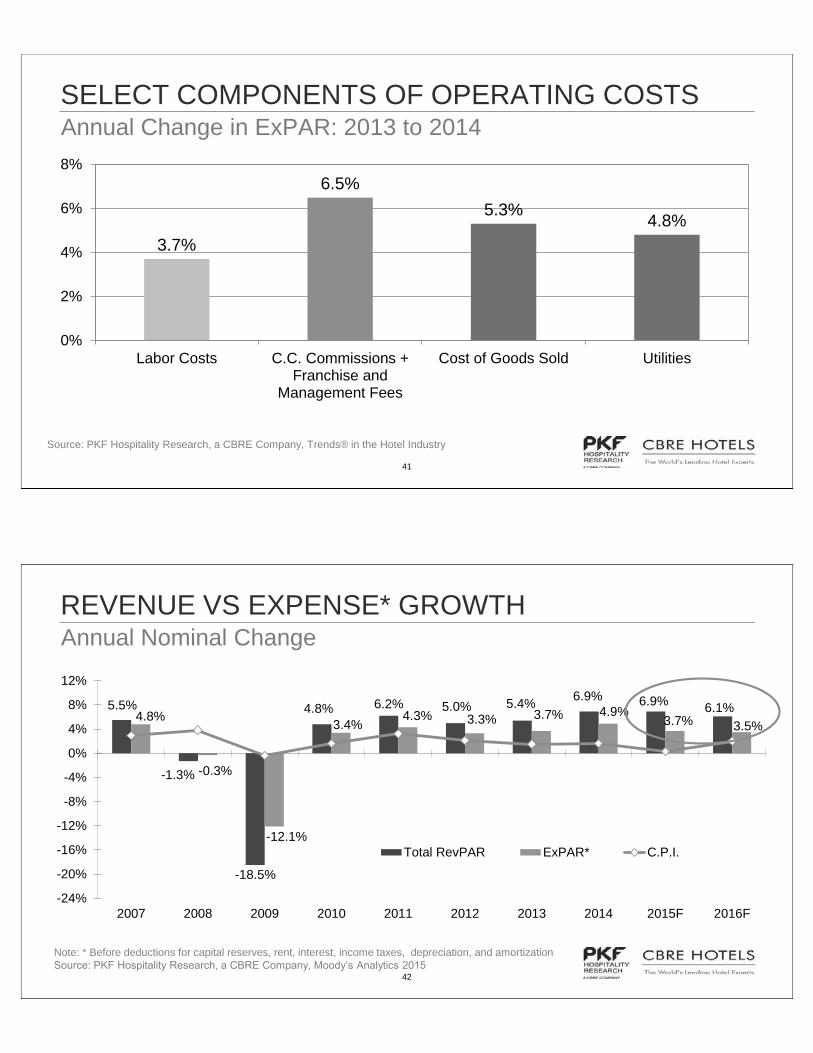
Annual Change in ExPAR: 2013 to 2014 SELECT COMPONENTS OF OPERATING COSTS
Source: PKF Hospitality Research, a CBRE Company, Trends® in the Hotel Industry
3.7%
6.5% 5.3% 4.8%
0%
2%
4%
6%
8%
Labor Costs C.C. Commissions +Franchise and
Management Fees
Cost of Goods Sold Utilities
42 ECONOMETRIC ADVISORS
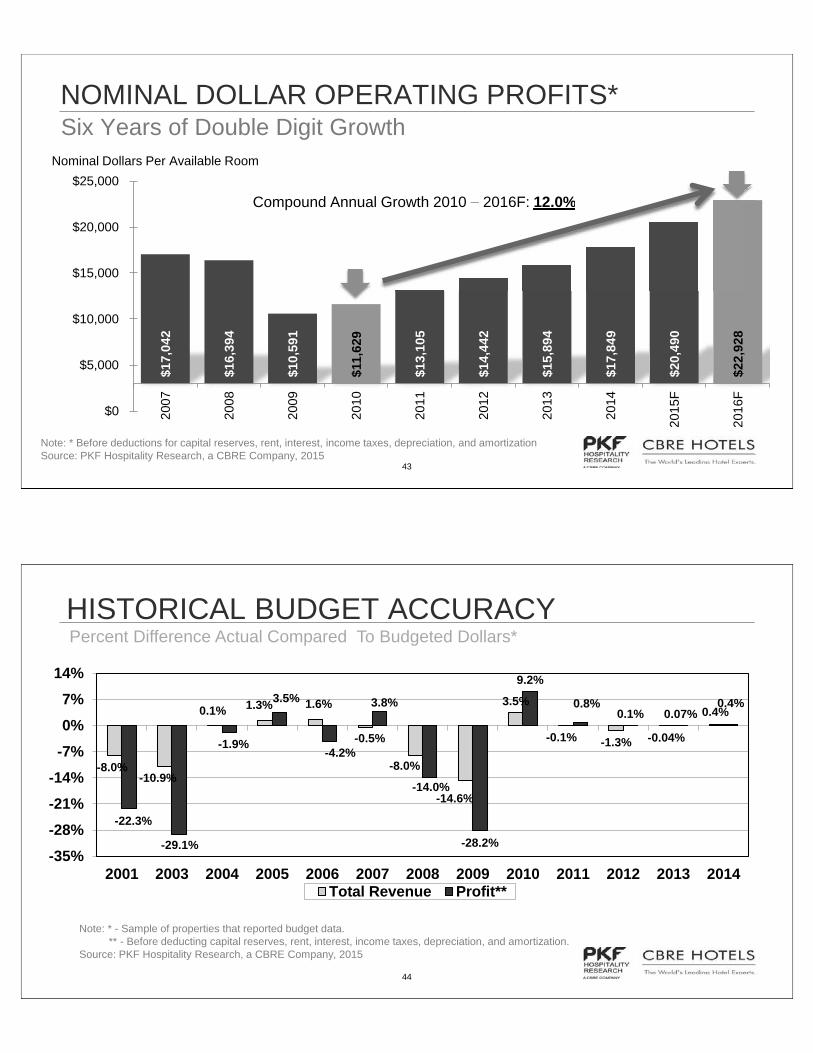
Annual Nominal Change REVENUE VS EXPENSE* GROWTH
5.5%
-1.3%
-18.5%
4.8% 6.2% 5.0% 5.4% 6.9% 6.9% 6.1% 4.8%
-0.3%
-12.1%
3.4% 4.3% 3.3% 3.7% 4.9%
3.7% 3.5%
-24%
-20%
-16%
-12%
-8%
-4%
0%
4%
8%
12%
2007 2008 2009 2010 2011 2012 2013 2014 2015F 2016F
Total RevPAR ExPAR* C.P.I.
Note: * Before deductions for capital reserves, rent, interest, income taxes, depreciation, and amortization Source: PKF Hospitality Research, a CBRE Company, Moody’s Analytics 2015
43 ECONOMETRIC ADVISORS
Six Years of Double Digit Growth NOMINAL DOLLAR OPERATING PROFITS*
$17,
042
$16,
394
$10,
591
$11,
629
$13,
105
$14,
442
$15,
894
$17,
849
$20,
490
$22,
928
$0
$5,000
$10,000
$15,000
$20,000
$25,00020
07
2008
2009
2010
2011
2012
2013
2014
2015
F
2016
F
Compound Annual Growth 2010 – 2016F: 12.0%
Nominal Dollars Per Available Room
Growth 2010 – 2016F: 12.0%
Note: * Before deductions for capital reserves, rent, interest, income taxes, depreciation, and amortization Source: PKF Hospitality Research, a CBRE Company, 2015
44 ECONOMETRIC ADVISORS
HISTORICAL BUDGET ACCURACY
-8.0% -10.9%
0.1% 1.3% 1.6%
-0.5%
-8.0%
-14.6%
3.5%
-0.1% -1.3% -0.04%
0.4%
-22.3%
-29.1%
-1.9%
3.5%
-4.2%
3.8%
-14.0%
-28.2%
9.2%
0.8% 0.1% 0.07%
0.4%
-35%-28%-21%-14%-7%0%7%
14%
2001 2003 2004 2005 2006 2007 2008 2009 2010 2011 2012 2013 2014Total Revenue Profit**
Note: * - Sample of properties that reported budget data. ** - Before deducting capital reserves, rent, interest, income taxes, depreciation, and amortization. Source: PKF Hospitality Research, a CBRE Company, 2015
Percent Difference Actual Compared To Budgeted Dollars*

45 ECONOMETRIC ADVISORS
THANK YOU FOR YOUR TIME
PKF HOSPITALITY RESEARCH | CBRE HOTELS
www.pkfc.com
Robert Mandelbaum