demand - mrbeem4+demand+ppt.pdfa. substitutes like coke and pepsi b. compliments like pb and j,...
TRANSCRIPT
Demand Chapter 4
The Way it Works
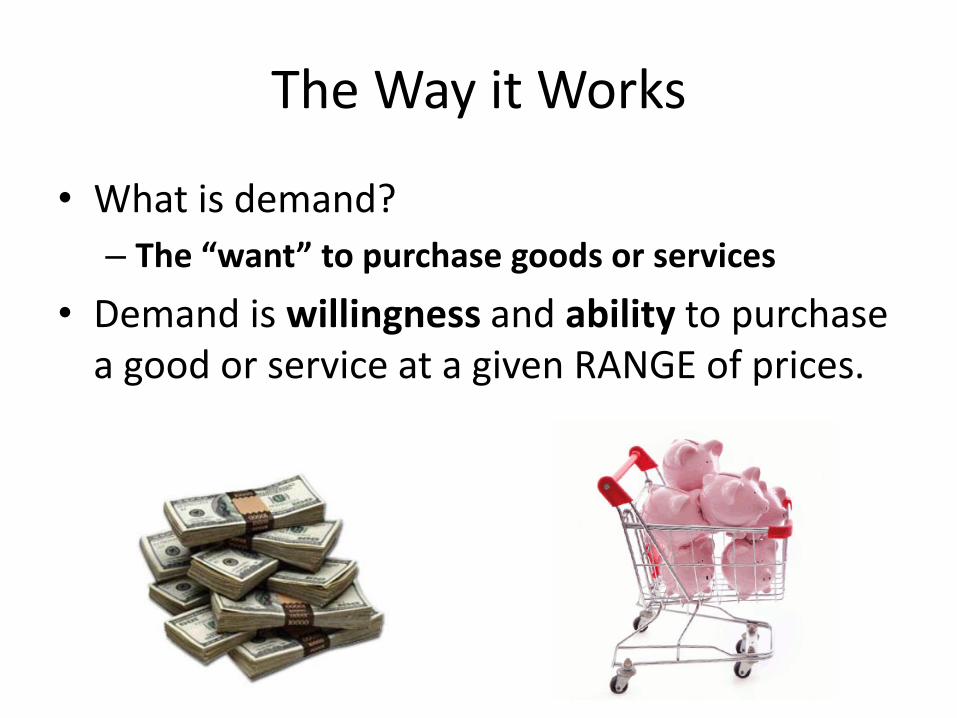
• What is demand?
– The “want” to purchase goods or services
• Demand is willingness and ability to purchase a good or service at a given RANGE of prices.
The Law…
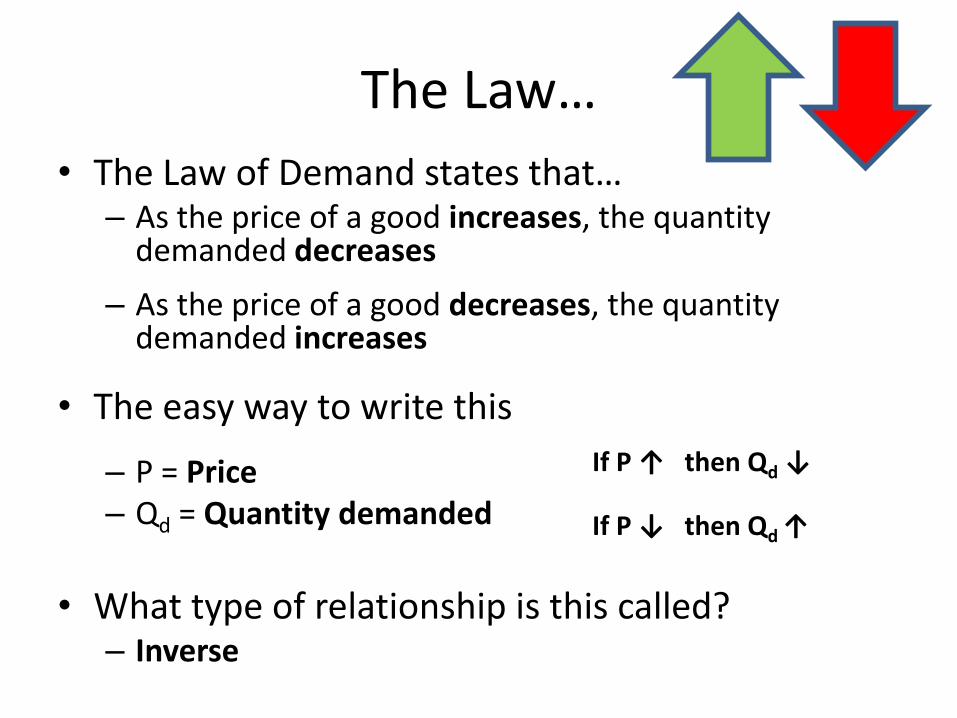
• The Law of Demand states that… – As the price of a good increases, the quantity
demanded decreases
– As the price of a good decreases, the quantity demanded increases
• The easy way to write this
– P = Price – Qd = Quantity demanded
• What type of relationship is this called?
– Inverse
If P ↑ then Qd ↓
If P ↓ then Qd ↑
What’s the Difference?
• What is the difference between demand and quantity demanded?
– Demand is simply the willingness and ability to buy something
– Demand is the curve or line
– Quantity demanded is the # of units purchased at a specific price
– Quantity demanded is the dot or point on the line
What’s the Difference?
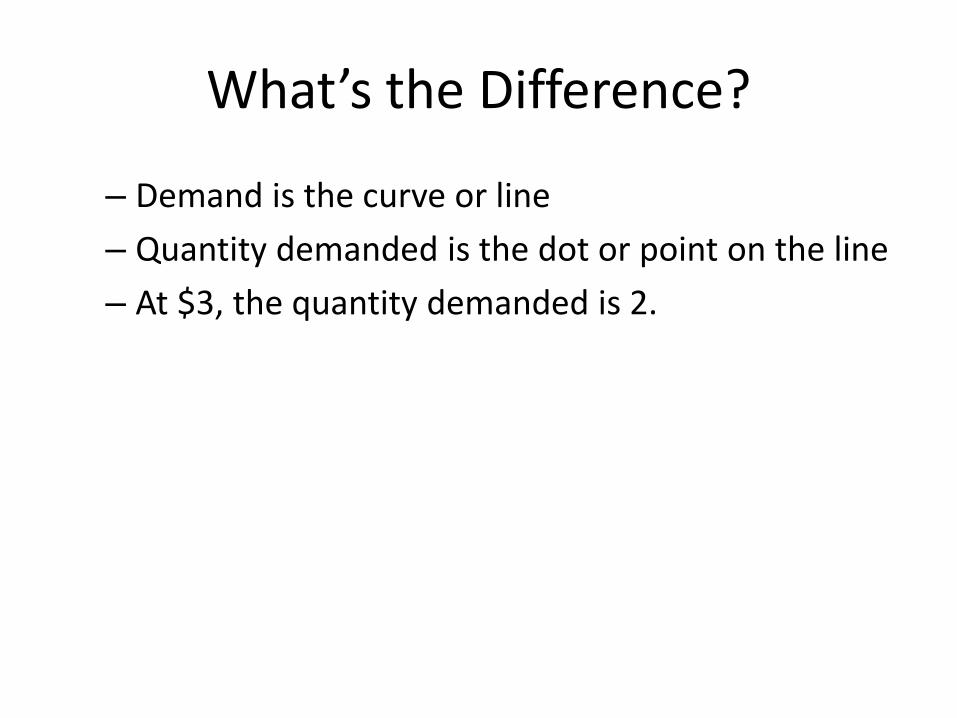
– Demand is the curve or line
– Quantity demanded is the dot or point on the line
– At $3, the quantity demanded is 2.
How Much You Consume…
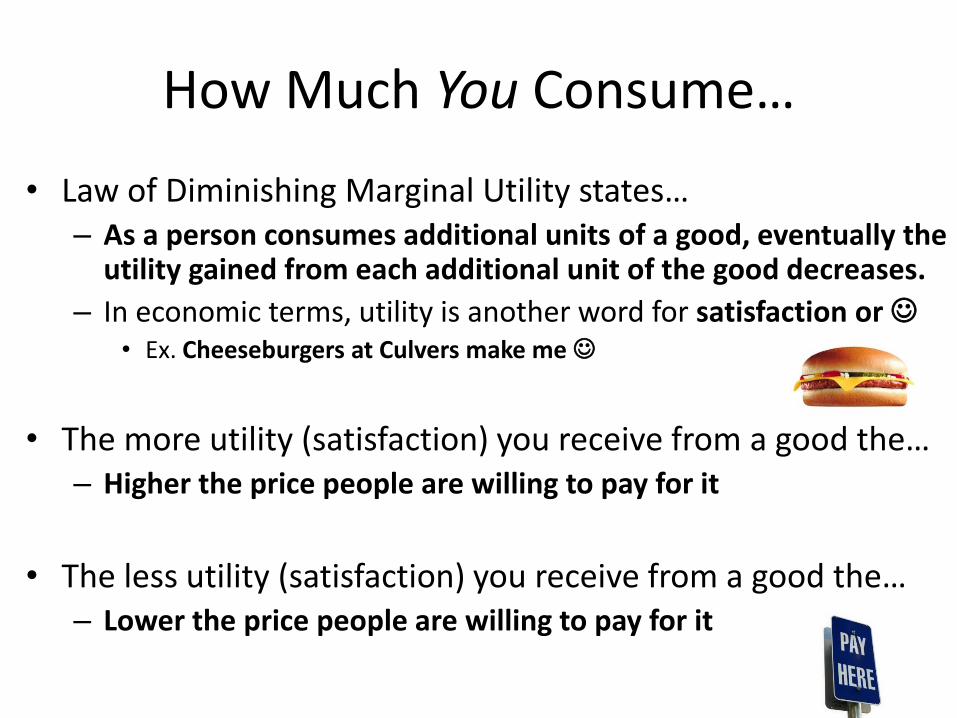
• Law of Diminishing Marginal Utility states… – As a person consumes additional units of a good, eventually the
utility gained from each additional unit of the good decreases.
– In economic terms, utility is another word for satisfaction or • Ex. Cheeseburgers at Culvers make me
• The more utility (satisfaction) you receive from a good the… – Higher the price people are willing to pay for it
• The less utility (satisfaction) you receive from a good the… – Lower the price people are willing to pay for it
Chart or Graph?
• A demand schedule is the numerical representation of the Law of Demand
• A demand curve is the graphical representation of the Law of Demand
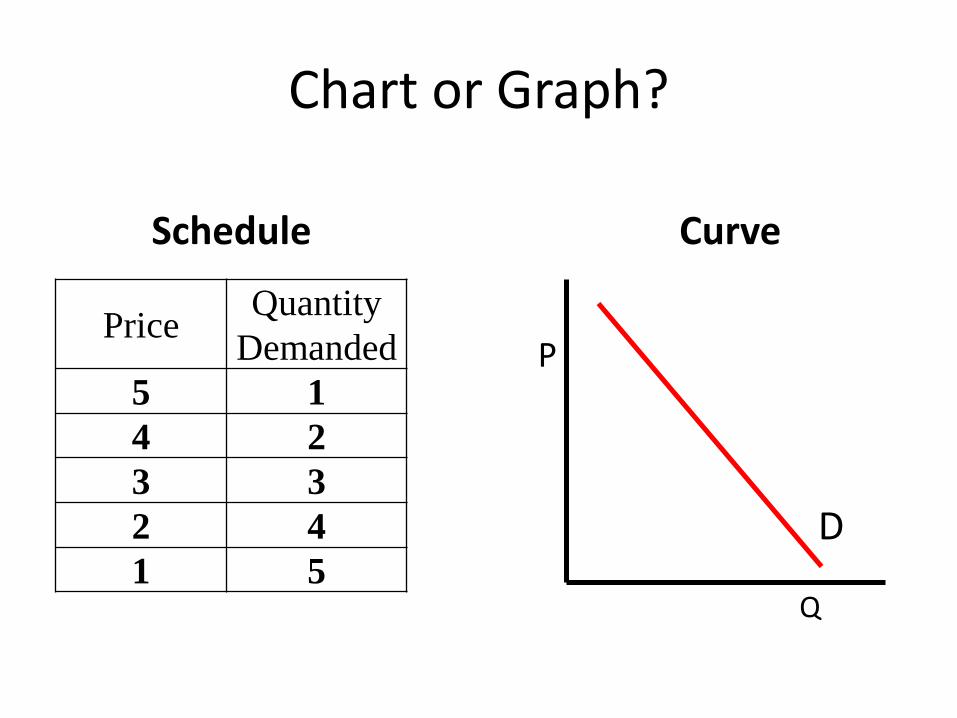
Chart or Graph?
Price Quantity
Demanded
5 1
4 2
3 3
2 4
1 5
P
Q
Schedule Curve
D

Shifting the Curve…
• When demand increases, the demand curve SHIFTS to the right!
D 1
P
Q
D 2
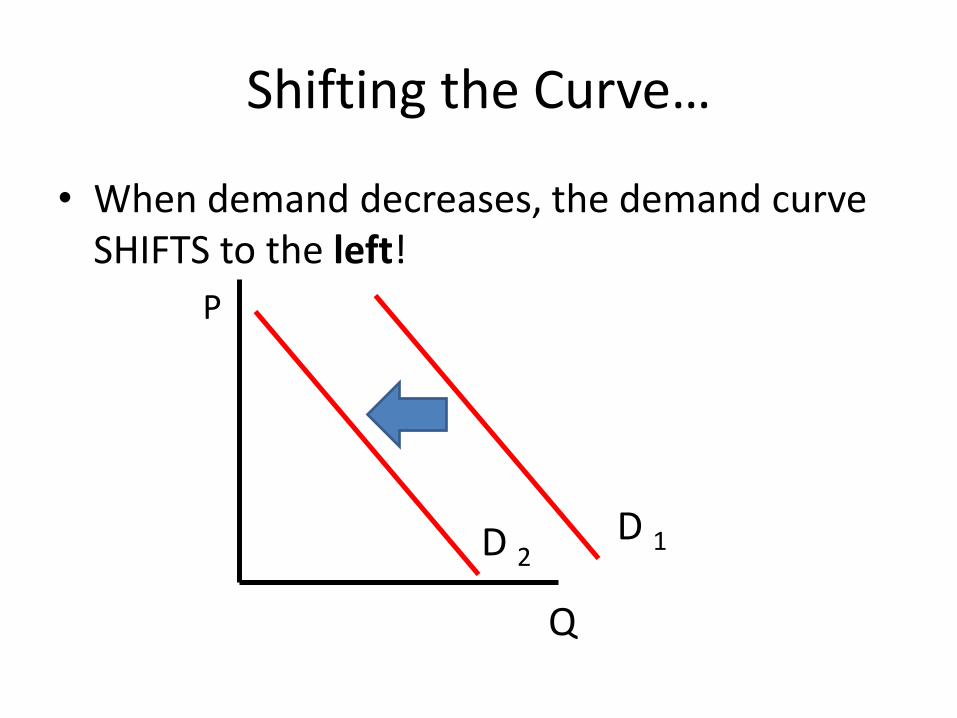
Shifting the Curve…
• When demand decreases, the demand curve SHIFTS to the left!
D 1
P
Q
D 2
4 Factors that Shift the Demand Curve
1. Income- How much money you have affects what you buy… (more $ = more D)
2. Tastes/Preferences- fads and popularity
3. Price of Related Goods
A. substitutes like Coke and Pepsi
B. Compliments like PB and J, Burgers and Fries
4. Number of Buyers: The more buyers the more Demand, the less buyers the less demand
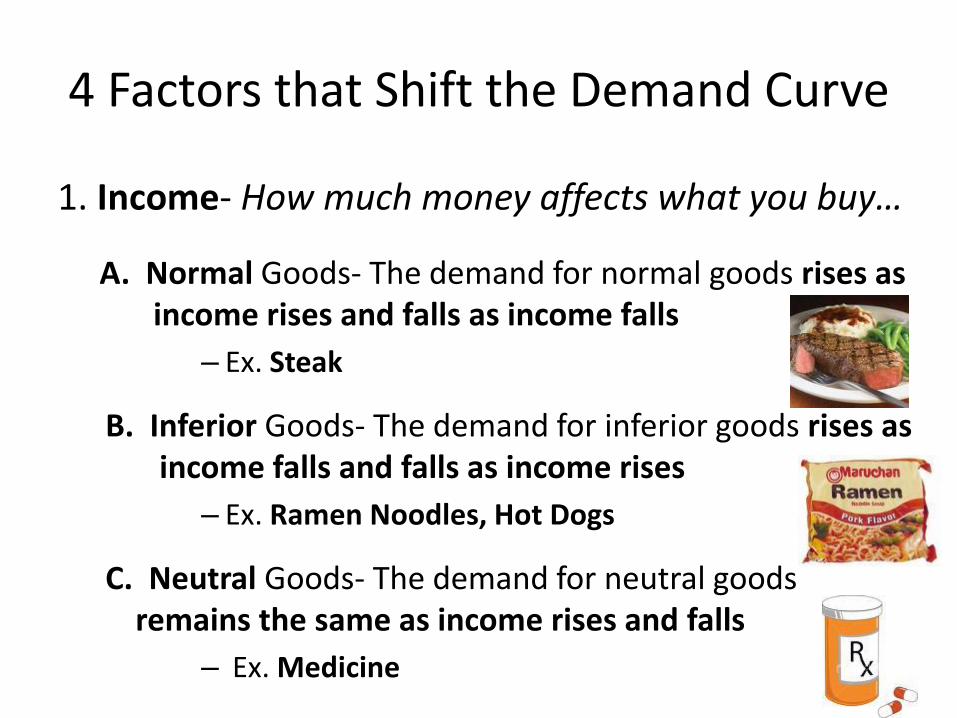
4 Factors that Shift the Demand Curve
1. Income- How much money affects what you buy…
A. Normal Goods- The demand for normal goods rises as income rises and falls as income falls
– Ex. Steak
B. Inferior Goods- The demand for inferior goods rises as income falls and falls as income rises
– Ex. Ramen Noodles, Hot Dogs
C. Neutral Goods- The demand for neutral goods remains the same as income rises and falls
– Ex. Medicine
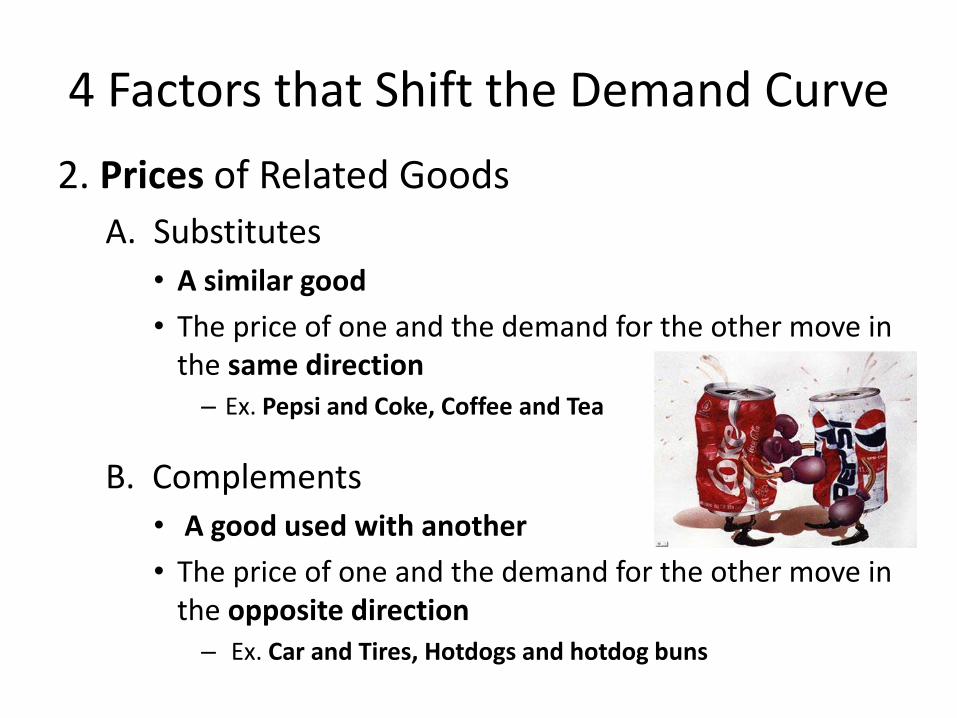
4 Factors that Shift the Demand Curve
2. Prices of Related Goods
A. Substitutes
• A similar good
• The price of one and the demand for the other move in the same direction – Ex. Pepsi and Coke, Coffee and Tea
B. Complements
• A good used with another
• The price of one and the demand for the other move in the opposite direction – Ex. Car and Tires, Hotdogs and hotdog buns
4 Factors that Shift the Demand Curve
3. Preferences
– Demand changes as preference’s change
• Ex. Clothing
4. Number of Buyers
– As the number of buyers increase, the demand for a good increases
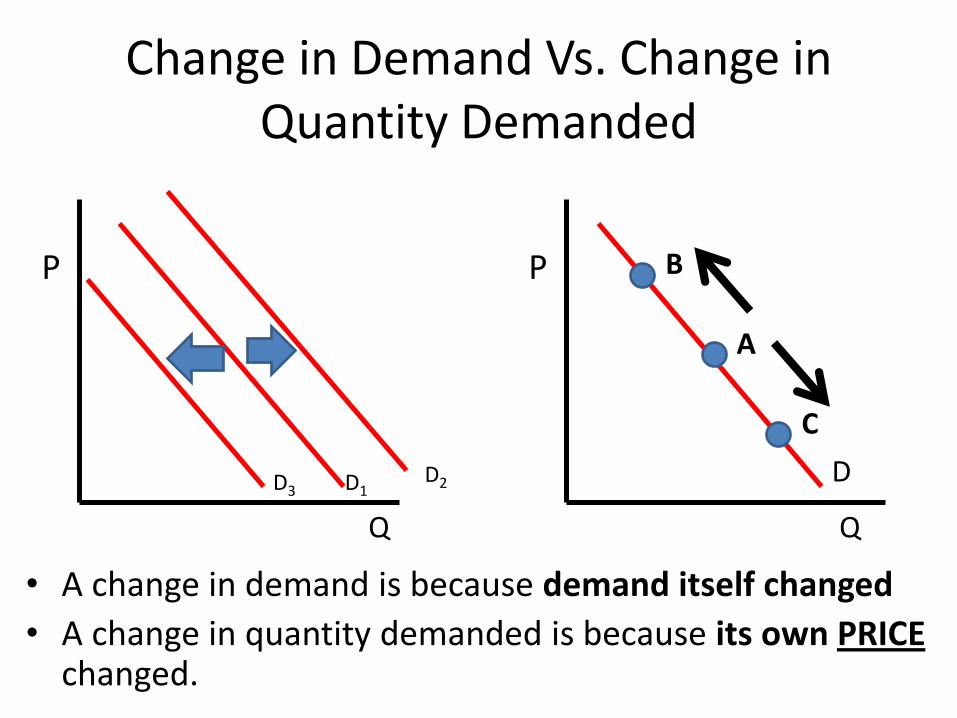
Change in Demand Vs. Change in Quantity Demanded
• A change in demand is because demand itself changed
• A change in quantity demanded is because its own PRICE changed.
P
Q
P
Q
A
B
C
D D2 D1 D3
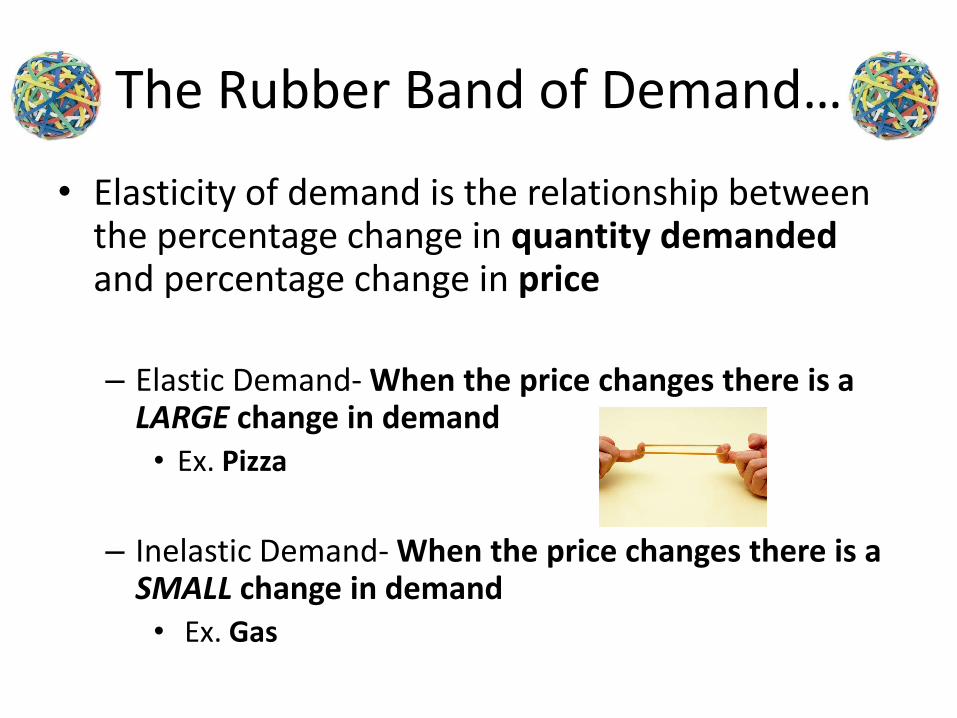
The Rubber Band of Demand…
• Elasticity of demand is the relationship between the percentage change in quantity demanded and percentage change in price
– Elastic Demand- When the price changes there is a LARGE change in demand • Ex. Pizza
– Inelastic Demand- When the price changes there is a SMALL change in demand • Ex. Gas
4 Determinants of Elasticity
1. Number of Substitutes
– If a good has many substitutes, then consumers will choose another type of good when price rises
• Lots of substitutes = Elastic
– Ex. Cereal
• Few or no close substitutes = Inelastic
– Ex. Diamonds
4 Determinants of Elasticity
2. Luxuries vs. Necessities
– If a good is a luxury and the price rises, then consumers will buy less of it
• Luxury = Elastic
• Ex. BMW
– If a good is a necessity and the price rises, then consumers will continue to buy it
• Necessity = Inelastic
• Ex. Gas
4 Determinants of Elasticity
3. Percentage of Income Spent on a Good
– The higher the percentage of one’s income that is spent on a good the more elastic demand for that good will be
• Ex. Cigarettes
4 Determinants of Elasticity
4. Time
– As time increases consumers have more chance to change their purchases
**Ex. Demand for gas in the short run is inelastic because there is no alternative, but in the long run it could be elastic because consumers can purchase new cars
• Ex. Smaller or Hybrid