demand response: an underutilized capacity resource whose
TRANSCRIPT

Demand Response: An Underutilized Capacity Resource Whose Time is Now
March 2, 2006

© 2005 EnerNOC, Inc. All Rights Reserved – Strictly Confidential, Permission Required for Distribution2
Contents
Demand Response?
EnerNOC Overview
EnerNOC Examples and Experience
DR as a Capacity Alternative
Appendix
ge
t m
ore

© 2005 EnerNOC, Inc. All Rights Reserved – Strictly Confidential, Permission Required for Distribution3
Customers reducing their demand for electricity from the grid in response to:
– High wholesale electricity prices or– System resource capacity needs or– System reliability events
Can be achieved by curtailment or self-generation (backup generators)Customers receive payments for performance
$/kW
h
24 Hours
Generation Capacity
Demand
kW
24 Hours
With EnerNOCWith EnerNOC
What is Demand Response?g
et
mo
re

© 2005 EnerNOC, Inc. All Rights Reserved – Strictly Confidential, Permission Required for Distribution4
The “NOC” in EnerNOC stands for Network Operations Center. EnerNOC enables existing assets with inexpensive, scalable technology to accomplish significant and guaranteed reductions in demand.
EnerNOC Overviewg
et
mo
re

© 2005 EnerNOC, Inc. All Rights Reserved – Strictly Confidential, Permission Required for Distribution5
Proven and growing track record - Over 200 MW’s of demand response capacity managed at more than 500 customer sites. Over 500 MW’s of peak demand currently monitored by PowerTrak®
Compelling offering – Total Energy Management Solutions Provider encompassing – Demand Response, Demand Management, Data Management, Research, Education, Permitting, Financing, Metering, Aggregation, Enrollment, Installation, Payment Reconciliation, Maintenance Management, Risk Management
Significant and growing market - Currently serving:– ISO New England (Certified IBCS and Demand Response Provider) – NYISO (Responsible Interface Party)– PJM (Emergency Demand Response Provider)– California ISO markets (Certified Demand Reserves Partnership Provider)– SCE, National Grid, NStar
Distinguished technology - Provide 24/7, real-time metering and web-based device monitoring and control through open architecture technology that leverages customers’ existing assets
Significant resources– Strong balance sheet and impressive financial track record– Deep management team experience in energy and technology
management – 50 employees with more than 60 engineering and management degrees
EnerNOC is the leading technology-enabled, C&I-focused total energy management solutions provider
EnerNOC Overviewg
et
mo
re

© 2005 EnerNOC, Inc. All Rights Reserved – Strictly Confidential, Permission Required for Distribution6
Government
Light Industrial
Education
Food Sales and Storage
Healthcare
Lodging and Resorts
Commercial Office and High Tech
Notable CustomersEnerNOC has secured marquee customers in its Total Energy Management program territoriesLarge Industrial
And Utilities
ge
t m
ore
© 2005 EnerNOC, Inc. All Rights Reserved – Strictly Confidential, Permission Required for Distribution7
0
500
1,000
1,500
2,000
2,500
3,000
3,500
4,000
11:00 AM 12:00 PM 1:00 PM 2:00 PM 3:00 PM 4:00 PM 5:00 PM 6:00 PM 7:00 PM 8:00 PM 9:00 PM
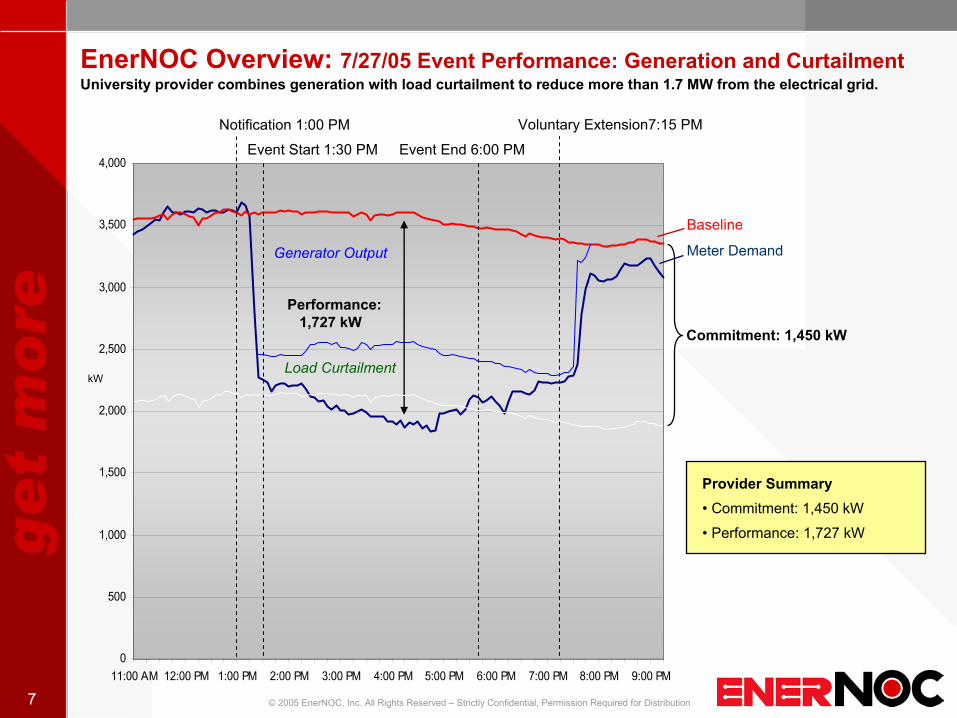
EnerNOC Overview: 7/27/05 Event Performance: Generation and CurtailmentUniversity provider combines generation with load curtailment to reduce more than 1.7 MW from the electrical grid.
Provider Summary• Commitment: 1,450 kW
• Performance: 1,727 kW
kW
Notification 1:00 PM
Event Start 1:30 PM Event End 6:00 PM
Baseline
Meter Demand
Commitment: 1,450 kW
Generator Output
Load Curtailment
Performance: 1,727 kW
Voluntary Extension7:15 PM
ge
t m
ore

© 2005 EnerNOC, Inc. All Rights Reserved – Strictly Confidential, Permission Required for Distribution8
0
2,000
4,000
6,000
8,000
10,000
12,000
14,000
16,000
11:00 AM 12:00 PM 1:00 PM 2:00 PM 3:00 PM 4:00 PM 5:00 PM 6:00 PM 7:00 PM 8:00 PM 9:00 PM
EnerNOC Overview: 7/27/05 Event Performance: Parallel ProcessingCommunications provider simultaneously transfers 50 facilities to backup generators, totaling over 12 MW.
kW
Notification 1:00 PM
Event Start 1:30 PM Program End 6:00 PM
Baseline
Provider Summary
• Sites: 50
• Commitment: 12,050 kW
• Performance:13,418 kW (non-coincident) 12,980 kW (coincident)
Performance: 12,980 kW
Generator OutputStacked Meter Demand
Commitment: 12,050 kW
Voluntary Extension 7:15 PM
ge
t m
ore

© 2005 EnerNOC, Inc. All Rights Reserved – Strictly Confidential, Permission Required for Distribution9
0
100
200
300
400
500
600
11:00 AM 12:00 PM 1:00 PM 2:00 PM 3:00 PM 4:00 PM 5:00 PM 6:00 PM 7:00 PM 8:00 PM 9:00 PM
EnerNOC Overview: 7/27/05 Event Performance: CurtailmentUniversity provider curtails more than 400 kW of load at five individual sites.
kW
Notification 1:00 PM
Event Start 1:30 PM Event End 6:00 PM
Baseline
Stacked Meter Demand
Commitment: 370 kW
Performance: 416 kW
Load Curtailment
Provider Summary
• Sites: 5
• Commitment: 370 kW
• Performance:424 kW (non-coincident) 416 kW (coincident)
Voluntary Extension 7:15 PM
ge
t m
ore

© 2005 EnerNOC, Inc. All Rights Reserved – Strictly Confidential, Permission Required for Distribution10
…and singles out EnerNOC as a national success story for
demand response
EnerNOC is developing a national reputation as the company that addresses needs of utilities and ISOs/RTOs by making demand response reliable and successful.
EnerNOC Overview
Pat Wood presents at U.S. National Town Meeting on
Demand Response onJune 21, 2005…
ge
t m
ore

© 2005 EnerNOC, Inc. All Rights Reserved – Strictly Confidential, Permission Required for Distribution11
Strengthens a PUC’s and a utility’s leadership role in addressing the peak electricity capacity shortfalls and in reducing emissions
Demonstrates the economic and operational viability of demand response as a reliable, verifiable, and economic resource for meeting peak load needs
Compliments existing energy efficiency programs, and serves as acatalyst for further energy management and efficiency measures
Enables effective engagement of C&I customers in real-time market participation and taps into a sizeable capacity resource
Strengthens a PUC’s and a utility’s brand and identity as innovators
DR as a Capacity AlternativeDemand response with EnerNOC delivers numerous benefits.
ge
t m
ore

© 2005 EnerNOC, Inc. All Rights Reserved – Strictly Confidential, Permission Required for Distribution12
DR Capacity Alternative: Capacity on DemandEnerNOC offers a completely outsourced solution. The complexities of administering and participating in a demand response program are entirely simplified for utilities and end-use customers. Our approach has three key characteristics:
ge
t m
ore

© 2005 EnerNOC, Inc. All Rights Reserved – Strictly Confidential, Permission Required for Distribution13
DR Capacity Alternative: Capacity on Demand
ASPECT VALUE COMMENTS Size 100 MW Large enough to retire a large peaker
Price $10 per kW per month Will enable customer adoption, and provide a
guaranteed product at a cost equivalent to or less than a new peaking plant
Term 4 to 6 years Long enough to attract end-user participation
In Service Date
Within 3 months of contract signature Firm ramp-up schedules, with goal of bringing as much capacity online in year one and all capacity online by 18-24 months
End User Assets
EnerNOC directly controls customers’ HVAC systems, lighting systems, process equipment, pumps, other energy consuming devices, and backup generators when permitted and appropriate
EnerNOC’s technology optimizes asset performance and gives customers immediate access to their energy consumption patterns. EnerNOC’s customers typically initiate further energy efficiency initiatives once they recognize the benefits of demand response
Event Window
12:00 pm to 6:00 pm on non-holiday weekdays, to be defined by utility, system operator, and EnerNOC
Window parallels system peak
Event Trigger
Reliability events and/or peak demand hours, TBD by the utility, system operator, and EnerNOC
DR resources will provide capacity during reliability events and allow retirement of dirty, out of favor peak plants or obviate need for new peak plant build outs
The following table summarizes key aspects of a program concept and is offered as a starting point for discussion.
ge
t m
ore

© 2005 EnerNOC, Inc. All Rights Reserved – Strictly Confidential, Permission Required for Distribution14
Appendixg
et
mo
re

© 2005 EnerNOC, Inc. All Rights Reserved – Strictly Confidential, Permission Required for Distribution15
Demand Response provides a better solution to meeting peak demand than the traditional solution of over-building generation.
Demand Response Impact Potential
500
1,000
0
US Summer Peak Demand: 697 GW
Hydro
Nuclear
Coal
Renewables
Combined Cycle
Gas/Oil Steam
Pumped Storage
Peaking CT/IC
US Generating Capacity: 948 GW
Source: EIA Electric Power Annual 2003
ge
t m
ore

© 2005 EnerNOC, Inc. All Rights Reserved – Strictly Confidential, Permission Required for Distribution16
400
500
600
700
800
900
1,000
5 500
1,000
1,500
2,000
2,500
3,000
3,500
4,000
4,500
5,000
5,500
6,000
6,500
7,000
7,500
8,000
8,500
8,760
Illustrative Load Duration Curve for 1,000 MW’s of Electricity in the US
Annual Hours
MW
’s
Peak with DR
Demand Response Impact PotentialEnerNOC reduces peak demand associated with ~1% of annual electricity consumption. Nationwide, DR could provide 95 GW with a replacement value of ~$28 billion.
Peak without DR
ge
t m
ore

© 2005 EnerNOC, Inc. All Rights Reserved – Strictly Confidential, Permission Required for Distribution17
Peak Load Drop Potential
0%
2%
4%
6%
8%
10%
12%
14%
0255075100
Peak Hours
% M
W R
educ
tion
Based on CT 2004 load duration curve
Demand Response Impact PotentialA few hours of demand response provide substantial peak load reduction.
ge
t m
ore

© 2005 EnerNOC, Inc. All Rights Reserved – Strictly Confidential, Permission Required for Distribution18
Demand response is slow and insignificant – it will never provide enough capacity to address grid issues
Demand response is not reliable
Demand response is not functionally equivalent to generation
Demand response payments have to be uniform within ISO territories
Demand response will fully mitigate energy market price spikes
Demand response is not an environmentally friendly solution
Demand Response Mythsg
et
mo
re

© 2005 EnerNOC, Inc. All Rights Reserved – Strictly Confidential, Permission Required for Distribution19
Fast and significant – EnerNOC enabled 40 sites in less than six weeks and is on track to enable well over 100 MW in Southwest Connecticut alone; these sites can be dispatched within minutes
Precise – Demand response capacity can be brought online exactly where it is needed when it is needed
Verifiable and accountable – EnerNOC captures 5-minute interval data, providing direct visibility into asset performance; EnerNOC accepts penalties for non-performance; system operators can rely on us
Economical – Demand response capacity is very cost effective compared to alternatives, and customers commit when the price is right, but Demand Response is not a panacea for all market challenges.
Environmentally friendly – Many customers curtail electricity usage during events; others use backup generators (BUGs), and U.S. EPA studies show that demand response can reduce air emissions, even when diesel-fueled BUGs are used
Demand response is ready for primetime because it is:Demand Response Market Realities
ge
t m
ore

© 2005 EnerNOC, Inc. All Rights Reserved – Strictly Confidential, Permission Required for Distribution20
Load and Technical Analysis
Enable and Enroll Facility
Program Management
Event Management
Conduct facility walk-through
– Identify curtailable loads
– Identify backup generator potential
– Identify existing metering systems to integrate and save money
Interview facility engineering and operations staff to identify customer sensitivitiesDevelop technical solution optionsSummarize load analysis, present options for load control and program involvement, and present economic potential
Begin collecting dataResearch, file, and renew all required city and state permits for program participationMaintain all required recordsEnroll load in daily/monthly markets to maximize potential benefit while minimizing riskPresent real-time meter data to system operator for verification and to customer for reportingMonitor loads continuously and adjust enrollments accordinglyReconcile data and collect and disburse program paymentsManage any program disputes and changes for customer
Notify customers in advance of potential eventsNotify customers during day of event of event “window” and requirementsCurtail load/initiate backup generator operation as requiredMonitor, meter, and adjust performance according to enrolled loadNotify customers of event completion and restore normal operationsProvide event and load reports accordinglyContinually ensure operational integrity of technical solution
Design technical solutionProcure required technology (e.g., metering, relays, controls)Install (or integrate with existing) metering, controls, and communicationTest and troubleshoot technical solutionInitiate monitoring and begin metering loadsApply for, administer, and secure eligible cost reimbursementsRegister as customer’s AssetsAggregate customer loads as applicableEnroll assets into each DR program
EnerNOC’s offering is a complete solution.
EnerNOC Examples and Experience: Solution Overviewg
et
mo
re

© 2005 EnerNOC, Inc. All Rights Reserved – Strictly Confidential, Permission Required for Distribution21
Site Survey
Technical and Financial Analysis
Report and Presentation
Interview
EnerNOC Examples and Experience: Demand Response AuditEnerNOC’s four-part evaluation of a facility’s energy use and operating flexibility identifies opportunities for how demand response can be implemented, energy usage can be reduced or rescheduled, and peak demand limited.
ge
t m
ore

© 2005 EnerNOC, Inc. All Rights Reserved – Strictly Confidential, Permission Required for Distribution22
(kW)
0
1000
2000
3000
4000
5000
6000
7000
8000
9000
7:00 8:00 9:00 10:00 11:00 12:00 1:00 2:00 3:00 4:00 5:00
Profile of Generator Customer During 8-20-04 ISO-New England Test
(kW)
EnerNOC Examples and ExperienceBackup Generators Provide Significant “Negawatts”
ge
t m
ore

© 2005 EnerNOC, Inc. All Rights Reserved – Strictly Confidential, Permission Required for Distribution23
0
50
100
150
200
250
300
350
400
12:00 am 2:00 am 4:00 am 6:00 am 8:00 am 10:00 am 12:00 pm 2:00 pm 4:00 pm 6:00 pm 8:00 pm 10:00 pm 12:00 am
Time of Day
kW
ISO Calls 7 Hour “Event” Starting at 11:00 a.m.
EnerNOC Automatically
Communicates to All Stores
EnerNOC Restores
Automatically
30 kW from 1/3 Lights
20 kW from Store AC or Air Handler
20 kW from Backup
Generator
EnerNOC Remotely Curtails/
Generates
EnerNOC Examples and ExperienceEnerNOC’s deploys industry-specific solutions that maximize the customer’s contribution and return without risk to business continuity.
Supermarket 24 Hour Load Profile and EnerNOC Demand Response Application
ge
t m
ore

© 2005 EnerNOC, Inc. All Rights Reserved – Strictly Confidential, Permission Required for Distribution24
500
600
700
800
900
1000
1100
1200
1300
1400
7:00 8:00 9:00 10:00 11:00 12:00 1:00 2:00 3:00 4:00 5:00 6:00
Profile of Load Reduction Customer During 8-20-04 ISO-New England Test
(kW)
EnerNOC Examples and ExperienceWho Says Load Reduction Isn’t For Real?
ge
t m
ore

© 2005 EnerNOC, Inc. All Rights Reserved – Strictly Confidential, Permission Required for Distribution25
$30
$40
$50
$60
$70
$80
$90
$100
$110
$120
9:00 10:00 11:00 12:00 1:00 2:00 3:00 4:00 5:00
Real-Time Locational Marginal Prices (CT), 8-20-04
($/MWh)
EnerNOC Examples and ExperienceDemand Response Can Make a Difference
ge
t m
ore

© 2005 EnerNOC, Inc. All Rights Reserved – Strictly Confidential, Permission Required for Distribution26
EnerNOC, Inc.28 West 44th St. Suite 1200
New York, NY 10036212-523-0519 – Phone
212-523-0332 – Fax
EnerNOC, Inc.45 Fremont St. Suite 1400San Francisco, CA 94105
415-278-8413 – Phone415-278-8444 – Fax
EnerNOC, Inc.75 Federal Street, Suite 300
Boston, MA 02110617-224-9900 – Phone
617-224-9910 – Fax
ge
t m
ore