demographic, social and economic changes in tharparkar
TRANSCRIPT
Munich Personal RePEc Archive
Demographic, Social and EconomicChanges in Tharparkar (1988-2006) - AnAnalysis
Rajar, Allah Wasayo and Herani, Gobind M. and Dhakan,
Ali Akbar
Sindh University, Indus Institute of Highere education, BIZTEK
2007
Online at https://mpra.ub.uni-muenchen.de/12256/
MPRA Paper No. 12256, posted 09 May 2009 17:51 UTC

Demographic, Social and Economic Changes (1988-2006) and their Future Prospects of Tharparkar
Indus Journal of Management & Social Sciences, Vol. 1, No. 2:107-128 (Fall 2007) Gobind M. Herani, Allah Wasayo Rajar and Ali Akbar Dhakan
Indus Journal of Management & Social Sciences
Vol. 1, No. 2:107-128 (Fall 2007)
Demographic, Social and Economic Changes in Tharparkar (1988-2006)
- An Analysis
Allah Wasayo Rajar*, Gobind M. Herani** and Ali Akbar Dhakan***
ABSTRACT
This study is firstever in nature and belongs to Thaparkar but the concept is general
and can be replicated in mostly rain-fed areaes of the world. This study attempts to
find out demographic, social and economic changes and its prospects. To achieve
mandated task, the study is focussed on: Firstly, to find out the existing trends of
demographic changes in the district. Secondly, to identify ever-increasing population
and demographic problems and policy implementation gap, and finally, the paper
attempts to suggest policy recommendations for sustainable management of
demographic problems. Data analysis, findings and recommendations would be
beneficial to the policy makers, planers, government, NGOs, and donnor agerncies for
further planning of the developlment policies. Demographic, social and economic
changes are the variables for special analysis. Therefore, an attempt has been made to
test the following hypothesises. It was hypothysed that: (i). Higher the population
growth rate, lower the afforidability power. (ii). Higher the literacy ratio, lower the
population growth. (iii). Higher the literacy ratio, higher the living status. (iv). Higher
the urbanization, higher the literacy ratio. (v). When the literacy rate increases, the
positive development also increases in social sectors. (vi). Population density
increases, the income growth rate decresaes.
JEL. Classification: J11, R11, O12
Keywords: Rain-fed Areas, Demographic, Social and Economic Changes;
Transient and Incoherent Grazing
The material presented by the authors does not necessarily represent the view point of editors and the
management of Indus Institute of Higher Education (IIHE) as well as the authors’ institutes
IJMSS is published by Indus Institute of Higher Education (IIHE), Plot. # ST-2D, Block-17, Gulshan-e-
Iqbal, Karachi, Pakistan
* Prof. Allah Wasayo Rajar is Prof. of Economics at University of Sindh-Pakistan.
Email:[email protected]
** Dr. Gobind M. Herani is Senior Research Fellow at Indus Institute of Higher Education
(IIHE), Karachi-Pakistan. Email: [email protected]
*** Dr. Ali Akbar Dhakan is Senior Research Fellow and Associate Dean at BIZTEK, Ex- Deputy Governor
State Bank of Pakistan and Chairman Sindh Development Foundation. Email:

Demographic, Social and Economic Changes in Tharparkar (1988-2006) - An Analysis
1. INRODUCTION
Actually Thar consists of: (i). Bahawalpur (ii). Judhpur (Indian state) (iii). Some
parts of Jesalmer (Indian state) (iv). Obaro and Mirpur Mathelo talukas of district
Sukkur (v). Eastern part of Khairpur (vi). Some parts of Khipro and Umerkot talukas
and (vii). Present Tharparkar. This study is about present Tharparker, which consists
of Mithi, Diplo, Chachro and Nagarparkar talukas. Thar is a desert region in the
southern part of Sindh province in Pakistan (Herani 2002:1).
This aridzone district of Sindh remains one of the country’s disadvantaged regions.
Indicators of health, education and other determinants of well-being are invariable at
the bottom of national scale, sporadic and scanty rain fall, dwindled water resources,
transient and incoherent grazing, and reliance on exploitative economy even for
mundance needs are the permanent features of Thari livelihood. Except for substance
live stock farming, there are strictly limited opportunities for income generation,
barring a few occupations, e.g. Handicraft and carpet production that are more
beneficial for the middle man than the actual producers. There are viable economic
alternatives.
It is common with individuals as well as all the families of that district to migrate to
the irrigated area to serve labours on farms or brick kilns and farm harvesting etc., at
low wages. Majority of male members usually turn their faces towards cities
especialy Karachi in order to earn for their livelihood. They are ready to accept any
odd job. We can find many tailors from Thar district in Hyderabad and Karachi and
other cities. Main occupation of Karachi migrated people is tailoring.
Tharparkar is compounded by difficulties of access and communication, its’
economy is characterised by high population growth, inspite of relatively high
maternal and infant mortality rates. The hardships are further exacerbated by the
migration of communities, decreasing socio-economic opportunities based on
traditional practices, and above all, rapid and irrevocable deterioration of
environmental resources that retains the very survivals of the population.
Some related literature about Tharparkar is available: like TRDP Evauluation Report
by Hassan and Hardy (1993); Herani (2002); Dawn. Local, 19, Octomber 2000; Ratta
Rang Koomayal Baar (1999); Thar Drought Presentation (1997 - 1998, 1998 - 1999,
1999 - 2000, 2000 – 2001); Mangi (1996); Silsilevar Thar Magazine; Herani, Rajar
and Khaskheli (2007) and different websites1. Thardeep, Bahn-Beli, and lots of other
NGOs are working at Tharparkar and their literature is also available.
1(http://www.dawn.com/2000/10/19Local.htm);(http//:nation.com.pk/ 5/12/000);
(http://www.Tharparkar.sdnpk.or/pic5.htm); (http://www.dawn.com/2000/07/09/letted.htm );
(htttp://www.dawn.com/2000/06/26/nat.htm); (http://www.dawn.com/2000/11/01/local.htm);
(http://www.un.org.pk/drought/Sindhmission.htm(4-12 June 2000);
(http://www.jang.com.pk/thenews/jan2001-daily/21-01-2001/national/n3.htm);
(http://dosfan.lib.uic.edu/ERC/economics/commercial_guides/Pakistan.htm)
Indus Journal of Management & Social Sciences 108

Allah Wasayo Rajar, Gobind M. Herani and Ali Akbar Dhakan
Related literature other than Tharparkar is: Mithal (1976); Somalia (1999);
Simmonds (1949); Bhati, Goyal and Daulay (1997) and Social (2001:180-181).
All the above studies, reports, news and wbsites show that this area needs constant
research work to update the information about Thar district for further planning.
These facts are kept in mind while writing this study.
The organization of this study is comprised of : Section 2 about methodology,
purpose of study, hypothesis, data collection and data analysis; Section 3 is about
demographic, social and economic changes; Section 4 is about conclusions and
finally Section 5 is about policy implications.
2 METHODOLOGY
2.1 Purpose of Study
This study attempts to find out Tharparkar’s demographic, social and economic
changes and its prospects. To achieve mandated task, the study is focussed on:
Firstly, to find out the existing trends of the demographic changes in the district.
Secondly, to identify pressing population and demographic problems and policy
implementation gap, finally, the paper attempts to suggest policy recommendation
for sustainable management of demographic problems.
2.2 Hypothesis
Demographic, social and economic changes are the variables for the special
analysis. Therefore, an attempt has been made to test following hypotheses. It was
hypothysed that: (i). Higher the population growth rate, lower the afforidability
power. (ii). Higher the literacy ratio, lower the population growth. (iii). Higher the
literacy ratio, higher the living status. (iv). Higher the urbanization, higher the
literacy ratio. (v). When the literacy increases, the positive development also
increases in social sectors (vi). Population density increases, income growth rate
decresaes.
2.3 Data Collection Technique
To achieve the purposes of the study both primary and secondary sources were
used. First of all review of available literature was undertaken, which were based
on published and unpublished materials including government census reports,
articles, research papers, thesis as a sources of information for the study. A
systematic review of the electronic database references was also undertaken. Data
were also collected from census carried out by Bureau of Statistics from 1951 to
1998.
2.4 Data Analysis
Vol. 1, No. 2:107-128 (Fall 2007) 109

Demographic, Social and Economic Changes in Tharparkar (1988-2006) - An Analysis
Finally collected data was analysed and presented in the form of tables, maps,
graphs and desrcriptions. This analysis was carried out on the basis of conclusions
drawn, and recommendations were made keeping in view the demographic,
physical, social and economic changes and natural environment of the district.
3 CHANGES IN THAR BETWEEN 1988-2006
3.1 Demographic Changes
The increase in the total population of Tharparkar between 1981 and 1991 has been
worked out as 3.2 percents of Pakistan national average. The population in urban
centres is worked out at 4.4 percent, which is the average urban growth rate of the
country. Thus the population of Thar has increased form 546000 to 747000 during
1988 to 2006. The population of Urban areas has increased from 25,000 to 39,000.
This is major increase and certainty have very pressurizing affect on the desert’s
economy.Thar’s resources during the period under review shows an enormous fall
in the cultivated area in Thar since 1982- to 1991.
With the increase of population, the population of livestock is also increasing and
it is four million heads in 1993 (TRDP Leaflet). According to figures of 1992, the
total population of Thar was 9,10,686, which is approximately 3.2% (per annum)
during the last ten years. The area of Thar is 21589 square kilometers. (Hassan and
Hardy 1993:4) Both figurs include some areas of Umerkot district). From above
figures it is clear that population is increasing along with animal population, thus
showing a decrease in land and resources in the same ratio. If this rate of increase is
continued then there will be a need of resources mostly for live stocks fodder, as
well as planning, which will lead Thar towards industrial economy.
During 1981 to 1998 the population of Thar increased from 540,985 to 914,291.
According to National Census 1998, this increase shows an annual growth rate at
3.13 percent. (District 1999:19). If the growth rate will remain the same, then in
2020 it will be double the existing population.
Live stock population, which was 3.88 millions in 1991, increased in 1993 to 4
millions (projected TRDP), yet in 1996 census the population decreased to 3.86
millions (38,56,328). The decrease of 0.51% during 1991-1996 was because of
droughts. This condition remained constant till the year 2000. In 2000’s drought
conditions the animal poppulation again decreased, therefore projection will not be
accurate but it will remain in betwwen 3.00 to 3.60 millions approximately (Herani
2002:46).
Table-1
Population of Thar In (Thosands)
Year 1951 1961 1972 1981 1998 1981-1991TRDP p.19
population 249.28 290.40 359.36 540.99 914.29 747.00
Growth rate - 1.55 1.85 4.97 3.13 3.2
Source: District Census Report of Tharparkar 1998.
Indus Journal of Management & Social Sciences 110
Allah Wasayo Rajar, Gobind M. Herani and Ali Akbar Dhakan
3.1.1 Conditions of Human Settlements
According to TRDP evaluation report 1993, major changes have taken place in the
towns and villages of Thar since 1987. In the towns, such as Islamkot and Mithi, a
large number of new shops have been opened; old katcha (non-metalled) structures
have been replaced with steel structure. A fairly large number of shops and houses
have been constructed through encroachments on government land by migrants
from rural areas. These encroachments have been intentionally promoted by
government functionaries and are protected by them.
The shops in the town bazars have a larger variety of products from urban areas as
well as imported consumer goods such as biscuits, soap, henna (hand coulring
leaves), textiles, ready-made garments and medicines. An important addition is the
availability of newspapers and magazines, which were non-extent in 1987.
Shopkeepers informed the evaluation team that sale of factory produced food stuffs,
such as tea, biscuits, ghee (butter oil), powdered milk have increasing demand. An
increasing number of Tharis have also started to wearing ready-made garments, a
very rare thing in the past. The changes in the physical nature of the bazars is
certainly worth mentioning, since there was an air of considerable affluence as
compared to 1987-88.
However, the towns have become more unhygienic. There is still no proper sewage
system and almost all neighbourhoods have their cesspools which are increasing in
size. The open drains are not maintained and the streets and opens spaces are
littered with organic waste and polythene bags. An increase in the number of
vehicles have converted the pure atmosphere into polluted atmosphere.
In the rural settlements the picture is not dissimilar. In all the villages, which were
visited, a few of the residents (their number is increasing) have demolished their
Thari huts and replaced them with semi-pacca or in some cases, with pacca
structures. Mud utensils, commonly in 1987, to a considerable extent have been
replaced by aluminium, stainless steel and plastic ones. Majority of Potters
(Kumhars) have adopted new skills and many of them have migrated to the urban
areas. They have even become richer than the higher caste i.e. agriculturists of their
villages. In addition, a few village shops, non-existent in 1987-88, have come up.
(Hassan and Hardy 1993:4-7)
In 2006, the people of all the big villages are migrating to settle in urban areas. When
they are settled in big villages or cities of Thar, they renovate their houses replacing
old cultural huts into burnt bricks-based structured houses. In Mithi, Chelhar, Diplo
and Islamkot number of shops have been increased and migrants from rural areas are
settled over there. Things which were not available in 1987-88, are now available in
big shops e.g. eggs, milk etc. In Chelhar, milk is brought from Umerkot by bus. More
fresh vegetable are also available in all big towns and villages, which are en-route for
easy transportation. With the change in their thinking, their standard of living has
Vol. 1, No. 2:107-128 (Fall 2007) 111

Demographic, Social and Economic Changes in Tharparkar (1988-2006) - An Analysis
also improved. They accepted modern thoughts due to which their life style is
becoming clean with their thoughts.
After the cyclone of 1994, most of the houses of taluka Chachro were demolished
or declared risky residence. After this incident there occurred a change in their
thaught and instead of pucca houses they preferred to build a hut (chora), which is
safer in rainy seasons. Earth quake of 2001 has also made destruction and a large
number of houses were declared unfit for human living. Therefore, every Thari is
making atleast one hut (Chora) to be used in emergencies, such as rains and earth
quake.
3. 2 Social Changes
3.2.1 Sex and AgeComposition
3.2.1.1 Sex Ratio
The sex ratio (males per 100 females) of the district in 1998 is 120.6 as compared to
Sindh province 112.24. (Sindh census 1998, p.80) The sex ratio in rural and urban
areas varies at 121.03 and 112.0 respectively. The sex ratio widely differs at various
age groups in the district. It is 137.58 at age group 0-4 and there after decrease
gradually up to 128.75 at age group 10-14. It again comes down to 104.85 at age
group 25-29, which further decline to 101.92 at age bracket 40-44. However, it rises
up suddenly at age group 45-49 to 112.16, touches to 118.17 at age group 55-59,
thereafter it shows irregular trend and ranges from 101.45 to 118.14 at advanced ages
(60+). The fluctuation of sex ratio at various age brackets is the indications of un-
even distribution of population, which may be impact of factors like age misreporting,
comparative under/over reporting of either sex, etc., (Herani 2002:63).
3.2.1.2 Age Composition
According to 1998 Census, the population of youth a below 15 years is 50.28 percent
of the total population of the District. The percentage below 5 years was 18.21, which
included 2.65 percent infants. The population of 65 years and above was 3.73 percent.
The proportion of working age groups; i.e. 15 to 64 years comes to 45.98 percent
giving an age dependency ratio of 117.48 percent i.e. the ratio of 126.31 and 107.70
percent for males and females respectively. There is a significant variation in the age
dependency ratios in rural and at 119.23 percent as against 85.01 percent in urban
areas. The adult population 18 years and above was 44.73 percent for males and 47.37
percent for females. This percentage is 44.45 in rural and 50.80 in urban area and the
population eligible to vote after 2001 was 18 years and above. The percentage of
population by important age groups, sex and rural / urban areas is given in table,
figures reflects the age and sex structure of the district.
The district has a broad based population pyramid indicating a high proportion of
population under 5, which are 18.21 percent comprising 19.29 percent males and
Indus Journal of Management & Social Sciences 112

Allah Wasayo Rajar, Gobind M. Herani and Ali Akbar Dhakan
16.91 percent females. Shape of the pyramid becomes narrower at the adult age
groups and then went on to a thin peak showing a smaller proportion of population at
advanced age groups. Dependency ratio is 117.48 % as compared to Sindh province
83.58 % (Provincial 1998:81).
Table-2
Percentage of Poppulation By Age Sex And Rural / Urban Areas 1998 ALL AREAS RURAL URBAN
Age Both
Sex
Male Female Both
sex
Male Female Both
sex
Male Female
Less than one
year
2.65 2.94 2.29 2.66 2.96 2.30 2.25 2.46 2.02
Less than 5
years
18.21 19.29 16.91 18.37 19.48 17.02 14.89 15.12 14.63
Less than 10
years
36.41 38.04 34.44 36.71 38.41 34.66 29.64 29.49 29.81
Less than 15
years
50.28 52.33 47.82 50.61 52.73 48.05 43.04 43.02 43.06
18 years and
above
44.73 42.54 47.37 44.45 42.18 47.21 50.80 50.87 50.72
21 years and
above
38.34 36.66 40.37 38.09 36.32 40.23 43.88 44.33 43.38
15-49 years 39.12 37.37 41.23 38.75 36.91 40.98 47.24 47.81 46.60
15-64 years 45.98 44.19 48.15 45.61 43.74 47.88 54.05 54.32 53.75
65 years and
above
3.73 3.49 4.03 3.77 3.52 4.07 2.91 2.66 3.19
Age
dependency
ratio
117.48 126.31 107.70 119.23 128.61 108.85 85.01 84.10 86.04
Source: District Census Report of Tharparkar 1998
3.2.1.3 Marital Status
All individuals with 15 years and above age enumerated in 1998 population census
were classified according to their marital status, namely, "married", "never married",
"widowed" and "divorced". Out of them 22.53 percent were un-married. 72.36
currently married, 5.07 widowed and negligible i.e. 0.04 percent as divorced. The
never married amongst males are 28.45 percent, which is much higher than the
females at 16.00 percent. This difference is also reflected through the ratio of
marriages, which is 22.46 years for males as compared to 19.34 years for females
(Herani 2002:65).
3.2.1.4 Literacy
Literacy in the 1998 Census is defined as the “ability to read a news paper or write a
simple letter in any language, the literacy is measured in terms of literacy ratio and
computed as percentage of literate persons among the population aged 10 years and
above.
Vol. 1, No. 2:107-128 (Fall 2007) 113
Demographic, Social and Economic Changes in Tharparkar (1988-2006) - An Analysis
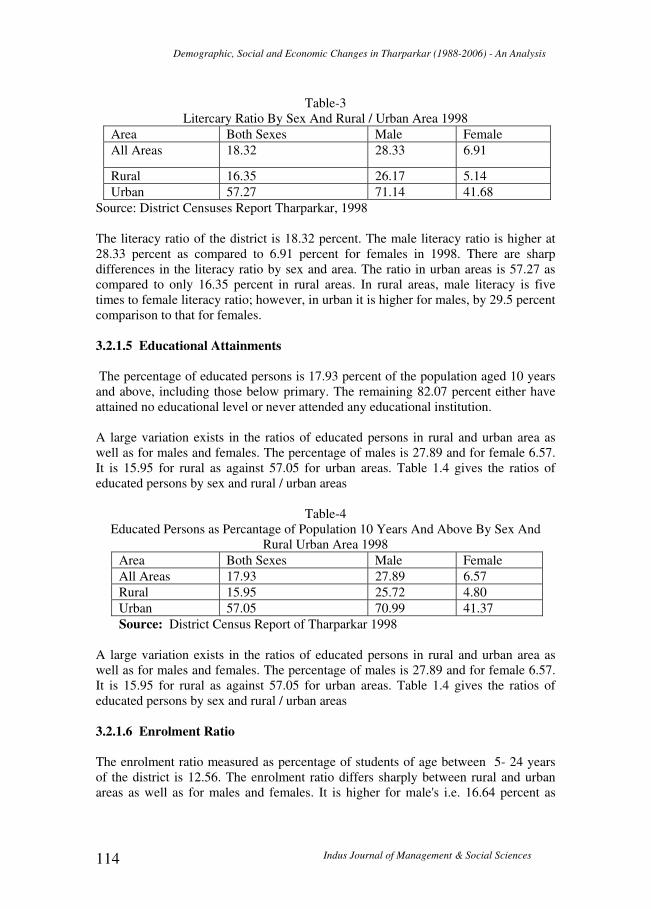
Table-3
Litercary Ratio By Sex And Rural / Urban Area 1998
Area Both Sexes Male Female
All Areas 18.32 28.33 6.91
Rural 16.35 26.17 5.14
Urban 57.27 71.14 41.68
Source: District Censuses Report Tharparkar, 1998
The literacy ratio of the district is 18.32 percent. The male literacy ratio is higher at
28.33 percent as compared to 6.91 percent for females in 1998. There are sharp
differences in the literacy ratio by sex and area. The ratio in urban areas is 57.27 as
compared to only 16.35 percent in rural areas. In rural areas, male literacy is five
times to female literacy ratio; however, in urban it is higher for males, by 29.5 percent
comparison to that for females.
3.2.1.5 Educational Attainments
The percentage of educated persons is 17.93 percent of the population aged 10 years
and above, including those below primary. The remaining 82.07 percent either have
attained no educational level or never attended any educational institution.
A large variation exists in the ratios of educated persons in rural and urban area as
well as for males and females. The percentage of males is 27.89 and for female 6.57.
It is 15.95 for rural as against 57.05 for urban areas. Table 1.4 gives the ratios of
educated persons by sex and rural / urban areas
Table-4
Educated Persons as Percantage of Population 10 Years And Above By Sex And
Rural Urban Area 1998
Area Both Sexes Male Female
All Areas 17.93 27.89 6.57
Rural 15.95 25.72 4.80
Urban 57.05 70.99 41.37
Source: District Census Report of Tharparkar 1998
A large variation exists in the ratios of educated persons in rural and urban area as
well as for males and females. The percentage of males is 27.89 and for female 6.57.
It is 15.95 for rural as against 57.05 for urban areas. Table 1.4 gives the ratios of
educated persons by sex and rural / urban areas
3.2.1.6 Enrolment Ratio
The enrolment ratio measured as percentage of students of age between 5- 24 years
of the district is 12.56. The enrolment ratio differs sharply between rural and urban
areas as well as for males and females. It is higher for male's i.e. 16.64 percent as
Indus Journal of Management & Social Sciences 114
Allah Wasayo Rajar, Gobind M. Herani and Ali Akbar Dhakan
compared to 7.56 percent for females. The enrolment ratio is much higher in urban
areas at 42.95 percent and only 11.19 percent in rural areas. There are also sharp
differences between male and female enrolment ratio in rural and urban area. In rural
areas, the ratio of male is more than double to that of female, whereas in urban areas,
it is higher at 49.95 percent for males, as against 35.25 percent for females. Table 1.5
gives enrolment ratio by sex and rural / urban areas.
Table -5
Enrloment Ratio By Sex And Rural / Urban Area 1998
Area Both Sexes Male Female
All Areas 12.56 16.64 7.56
Rural 11.19 15.21 6.24
Urban 42.95 49.95 35.25
Source: District Census Report of Tharparkar 1998
3.2.1.7 Education
Between 1985-86 and 1990-91 there has been a major increase in number of
schools and teachers in the 4 talukas of the Thar district (Herani 2002, Appendix-
14) However, there has not been a corresponding increase in the number of
students, except for enrolment at the mosque schools (Madaris). Since 1985-86, the
number of female students at primary level has increased from 1,854 to 6,923 in
1990-91. Although impressive in percentage terms, this figure constitutes no more
than 9 percent of all school age going girls in the Thar district. In 1989, this figure
was 7 percent.
In 1985-86, there were only 2 girls middle schools in the district and now there are
7. However, there are no middle schools for girls in the Diplo and Nagar talukas. In
addition, the girls high school at Diplo, which was operating in 1987, remains the
only one in the whole district. The number of students at the school has fallen from
240 in 1985-86, to 131 in 1991-92. Due to the absence of girls high schools and an
acute shortage of girls middle schools in the district, woman teachers and
paramedical staff cannot be locally recruited. In addition, the absence of girls
middle and high schools also means that the only way women can receive education
is by going away from their village to a nearby village, where there is a school. This
is simply not possible in the vast majority of cases and in the recent past, the law
and order problems in the province have created an additional psychological barrier
to girls moving away from their village or travelling alone. This is the reason given
for the drop in the number of girl students at the high school in Diplo (Hassan and
Hardy 1993:11).
The education department runs primary, middle and secondary schools. However,
there are very few middle and high school facilities for girls. In addition, these
facilities are available only at the taluka headquarters. It is not very easy to travel
for the vast majority of students especially girls. Further, there is no hostel facilities
Vol. 1, No. 2:107-128 (Fall 2007) 115
Demographic, Social and Economic Changes in Tharparkar (1988-2006) - An Analysis
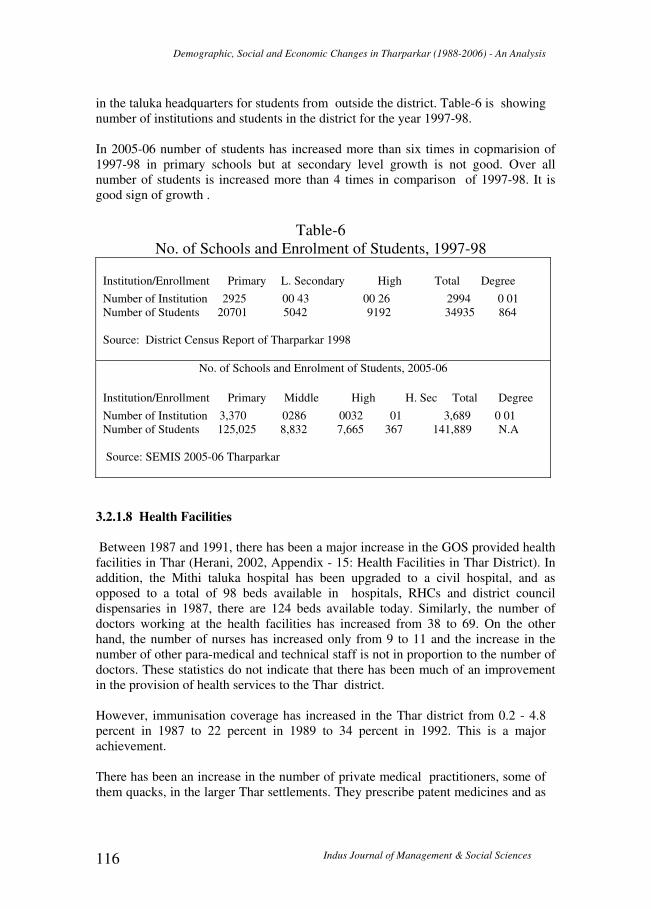
in the taluka headquarters for students from outside the district. Table-6 is showing
number of institutions and students in the district for the year 1997-98.
In 2005-06 number of students has increased more than six times in copmarision of
1997-98 in primary schools but at secondary level growth is not good. Over all
number of students is increased more than 4 times in comparison of 1997-98. It is
good sign of growth .
Table-6
No. of Schools and Enrolment of Students, 1997-98
Institution/Enrollment Primary L. Secondary High Total Degree
Number of Institution 2925 00 43 00 26 2994 0 01
Number of Students 20701 5042 9192 34935 864
Source: District Census Report of Tharparkar 1998
No. of Schools and Enrolment of Students, 2005-06
Institution/Enrollment Primary Middle High H. Sec Total Degree
Number of Institution 3,370 0286 0032 01 3,689 0 01
Number of Students 125,025 8,832 7,665 367 141,889 N.A
Source: SEMIS 2005-06 Tharparkar
3.2.1.8 Health Facilities
Between 1987 and 1991, there has been a major increase in the GOS provided health
facilities in Thar (Herani, 2002, Appendix - 15: Health Facilities in Thar District). In
addition, the Mithi taluka hospital has been upgraded to a civil hospital, and as
opposed to a total of 98 beds available in hospitals, RHCs and district council
dispensaries in 1987, there are 124 beds available today. Similarly, the number of
doctors working at the health facilities has increased from 38 to 69. On the other
hand, the number of nurses has increased only from 9 to 11 and the increase in the
number of other para-medical and technical staff is not in proportion to the number of
doctors. These statistics do not indicate that there has been much of an improvement
in the provision of health services to the Thar district.
However, immunisation coverage has increased in the Thar district from 0.2 - 4.8
percent in 1987 to 22 percent in 1989 to 34 percent in 1992. This is a major
achievement.
There has been an increase in the number of private medical practitioners, some of
them quacks, in the larger Thar settlements. They prescribe patent medicines and as
Indus Journal of Management & Social Sciences 116

Allah Wasayo Rajar, Gobind M. Herani and Ali Akbar Dhakan
such there has been, according to the shopkeers that stock these medicines, an over
200 percent increase in their import and use in the last 5 years.
There has been no visible hygiene related improvement in environmental conditions
or the attitudes of people. The conditions in the larger settlements have deteriorated
due to the pressure of ever-increasing population. Thus generating bulk of solid
waste and waste water, and a break up of the social structure. (Hassan and Hardy
1993:12)
According to 1998 census the health department headed by the District Health
Officer operates only three taluka hospitals. There are also maternity homes and
rural health centers. In addition, there are a large number of district council
dispensaries in the desert. The following table showing the medical facilities
available in the district for the year 1997-98 is as follows:
Table-7
No. of Government Hospitals & Dispensaries 1997-98
Type No. Run By
1. Civil Hospital 01 Provincial Government
2. Hospitals 02 Provincial Government.
3. Rural Health Centers 03 Provincial Government.
4. Basic Health Units 21 Provincial Government
5. Dispensaries 38 District Council
6. Maternity Child Welfare Centers 02 Provincial Government.
Source: District Censuses Report Tharparkar 1998
There is one hospital bed for every 7,000 people in Tharparkar district. According to
the Sindh health department documents, the total number of beds in the district is 150
to cater to the needs of over one million people, which means every 7,190 people in
this district are sharing one bed. (Dawn 2000, 19, Oct)
3.2.1.9 Roads
There were no new roads except Naukot to Mithi till 1988-1993. In 2006, all the
talukas are inter-connected by roads and also other schems are in operation. Some
villages en-route are also linked with main roads.
3.3. Economic Changes
3.3.1. Economically Active Population
Economically active population comprises the persons of either sex who are engaged
in some work for pay or profit including un-paid family helpers as well as the un-paid
persons, who are not working but looking for work as well as laid off, during the
reference period. The economically active population of District is 21.71 percent of
Vol. 1, No. 2:107-128 (Fall 2007) 117

Demographic, Social and Economic Changes in Tharparkar (1988-2006) - An Analysis
its total population and 37.14 percent of the population aged 10 years and above. The
percentage of children bellow 10 years is 36.41, out of which 3.87 percent are
students and 5.87 percent are others. Among the inactive population 31.24 percent are
domestic workers including 27.95 percent housewife. The activity or participation
rates, percentage of population by economic categories and unemployment rates are
shown in table- 1.8 below:
Table-8
Percentage of Population by Economic Categories, Sex and Rural / Urban Areas,
1998. All areas Rural Urban
Economic
category
Both Male Female Both
sex
Male Female Both
sex
Male Female
Labour force 21.71 36.72 3.61 21.64 36.53 3.63 23.30 41.15 3.32
Not in labour
force
78.29 63.28 96.39 78.36 63.47 96.37 76.70 58.85 96.68
Children
Below 10 years
36.41 38.04 34.44 36.71 38.41 34.66 29.64 29.49 29.81
Domestic
workers
31.24 6.02 61.66 31.22 6.23 61.47 31.64 1.26 65.65
Students
3.87 6.92 0.20 3.51 6.27 0.16 11.86 21.55 1.01
All others
6.77 12.31 0.09 6.91 12.56 0.08 3.56 6.56 0.22
Unemployment
rate
4.76 5.10 0.61 4.76 5.10 0.61 4.70 4.98 0.80
Labour force
participation
rate (refined)
34.14 59.27 5.51 34.20 59.31 5.55 33.12 58.36 4.73
Source: District Censuses Report Tharparkar 1998
The percentage of economically active population to the total population i.e. 21.71 is
termed as crude activity or participation rate. While the percentage among population
aged 10 years and above is called refined activity or participation rate, which is 34.14
percent for the district.
The refined participation or activity rate has been used for analysis. There is a wide
variation in the activity rates between males and female as it is 59.27 percent for
males as compared to only 5.51 percent for female resulting in an overall low
participation rate. The activity rates between rural/ urban areas differ slightly as it is
21.64 percent in rural area as against 23.30 percent in urban areas.
3.3.2 Employed Population by Industry
Half of the working population i.e. 73.15 percent is engaged in ‘Agriculture,
Forestry, Hunting and fishing' and remaining in non-agricultural industries. In rural
areas, the most important industry is ‘Agriculture, Forestry, Hunting and Fishing’,
Indus Journal of Management & Social Sciences 118
Allah Wasayo Rajar, Gobind M. Herani and Ali Akbar Dhakan
which accounts for 75.85 percent. In urban areas 30.80 percent of the working
population is associated with the Community, Social and personal Services' followed
by 24.68 percent in activities not adequately defined (Herani 2002:39).
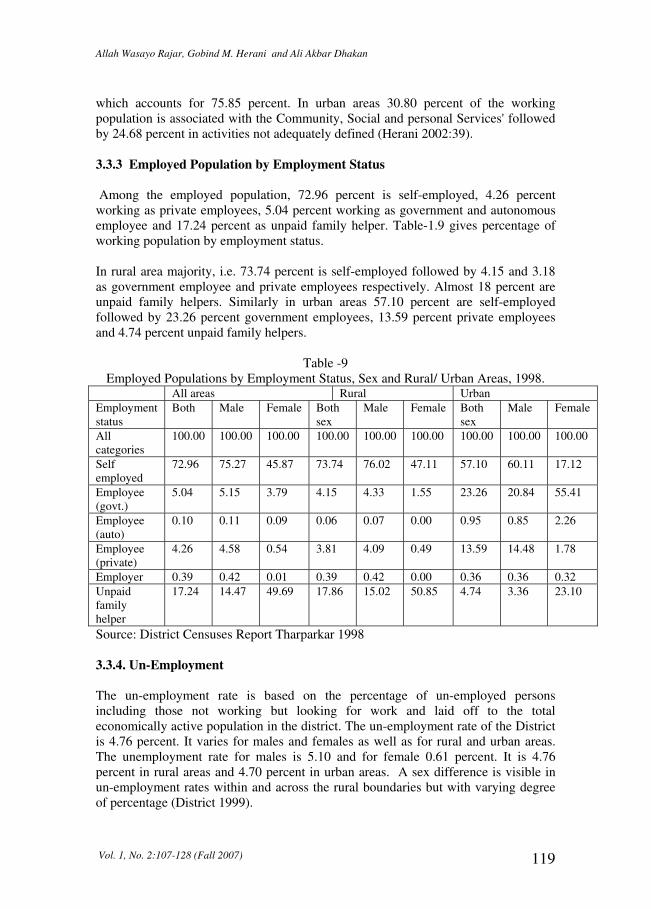
3.3.3 Employed Population by Employment Status
Among the employed population, 72.96 percent is self-employed, 4.26 percent
working as private employees, 5.04 percent working as government and autonomous
employee and 17.24 percent as unpaid family helper. Table-1.9 gives percentage of
working population by employment status.
In rural area majority, i.e. 73.74 percent is self-employed followed by 4.15 and 3.18
as government employee and private employees respectively. Almost 18 percent are
unpaid family helpers. Similarly in urban areas 57.10 percent are self-employed
followed by 23.26 percent government employees, 13.59 percent private employees
and 4.74 percent unpaid family helpers.
Table -9
Employed Populations by Employment Status, Sex and Rural/ Urban Areas, 1998. All areas Rural Urban
Employment
status
Both Male Female Both
sex
Male Female Both
sex
Male Female
All
categories
100.00 100.00 100.00 100.00 100.00 100.00 100.00 100.00 100.00
Self
employed
72.96 75.27 45.87 73.74 76.02 47.11 57.10 60.11 17.12
Employee
(govt.)
5.04 5.15 3.79 4.15 4.33 1.55 23.26 20.84 55.41
Employee
(auto)
0.10 0.11 0.09 0.06 0.07 0.00 0.95 0.85 2.26
Employee
(private)
4.26 4.58 0.54 3.81 4.09 0.49 13.59 14.48 1.78
Employer 0.39 0.42 0.01 0.39 0.42 0.00 0.36 0.36 0.32
Unpaid
family
helper
17.24 14.47 49.69 17.86 15.02 50.85 4.74 3.36 23.10
Source: District Censuses Report Tharparkar 1998
3.3.4. Un-Employment
The un-employment rate is based on the percentage of un-employed persons
including those not working but looking for work and laid off to the total
economically active population in the district. The un-employment rate of the District
is 4.76 percent. It varies for males and females as well as for rural and urban areas.
The unemployment rate for males is 5.10 and for female 0.61 percent. It is 4.76
percent in rural areas and 4.70 percent in urban areas. A sex difference is visible in
un-employment rates within and across the rural boundaries but with varying degree
of percentage (District 1999).
Vol. 1, No. 2:107-128 (Fall 2007) 119
Demographic, Social and Economic Changes in Tharparkar (1988-2006) - An Analysis
3.3.5 Transportation
The most important indicator of social change in the Thar region is the increase in
transport activity and its nature. In 1987, there were 3 jeep taxis in Thar. In 1991
there were over 35 and they charged Rs.500 per day. They claim that there is no
shortage of business and there is room for more taxis. The taxi clients are all locals
and often fodder, consumer items and Thari dairy products are transported in them
(Herani 2002:41).
During 2007 more GMC vehicles are being converted into buses and transportation
is better than previous years. Direct buses are coming from Karachi, Hyderabad to
Mithi after every one hour. The bus fare charged is also nominal because of the
roads e.g. from Mithi to Naukot, Diplo to Mithi, Mithi to Umerkot via Chelhar. It
shows that standard has improved comparatively due to Pacca roads and
transportation is becoming more comfortable due to buses, taxies, jeeps etc. Now a
day taxies are also availbale in rural areas and in future more tranport is expected.
3.3.6 Carpet Industry
During the field trips it is observed that carpet looms at more than 50 percent of the
villages are installed. In all cases the weavers were children who had been trained by
an already trained person, who had received training at Islamkot, which used to be a
major carpet manufacturing centre. According to the relatives of the children working
at the looms, their average earnings are Rs.700 per month. The number of looms is
steadily increasing and about 80 percent of the boys, who works on them are from the
Meghwar community. For example, at the Jogi Marhi settlement there were 2 looms
in 1987, 12 in 1988, and 41 in 1990. Over 80 persons work on these looms. In the
Lunio settlement, outside the TRDP, PA, there are 10 looms with 30 children working
on them. The hour of work vary between 10 and 14 per day and the conditions of
work are unhealthy because of a lack of light and cross ventilation.
Families whose children are working on the looms, have lost interest in agriculture
and the children are quite definite that they will not be agriculturists. In addition,
these families are distinctly more affluent than their neighbours.
The looms are all owned by entrepreneurs and middlemen from the urban areas of
Thar. Initially, they were installed in the urban settlements, where the children were
brought from the rural areas and lived in large groups in one room with grown-ups.
Many of them became drug and alcohol addictd. After that the move to the villages
was made because it cut the middleman’s overhead costs and made this activity a
more low prolife one, thus reducing government and public awareness concerning it
and interference in it (Hassan and Hardy 1993:15).
All the above report are upto 1993 (TRDP). Carpet manufacturing has decreased
since 1993 -1999. Due to low rate of income and advances denied by middle man. If
given advances then in justice is done to children by paying low wages.
Indus Journal of Management & Social Sciences 120
Allah Wasayo Rajar, Gobind M. Herani and Ali Akbar Dhakan
Consequently people started to search an alternate to earn for their livelihood; and
started to move towards various cities of the province eg. Karachi, Hyderabad etc.
Mostly youths are engaged in ready made garments and earning more than carpet.
Only few labours have taken the advance for bonded labour, which mostly given at
salary basis or daily wages. In some cases, those manufactureres, who had left this
business, since 2000 have again started this busness of carpet for exports. According
to survey of TRDP and RASSTA Development Consultants, in their book in Sindhi
" Rata Rang Komayal Bar " 1999 12% of children are working in carpet industry.
Other workers are more than 14 years of age (Ratta 1999:13-15).
In 2006 it was observed that some middle man are coming directly hire
manufacturers at suitable rates. Due to this initiative by exporters carpet industry
has started flourishing. The road and telecummunication network has reduced the
travelling time and it has facilitated the Tharies to get more opportunity of earning.
Khadhi weaving is also in practice and some active NGOs are encouraging the
weavers.
3.3.7 Remittance Economy
Since time immemorial Tharis migrate, during dry seasons, or in periods of
drought, along with their animals to the barrage areas to work as farmers. This
migration was primarily for feeding and watering their animals, selling their dairy
products and surviving through drought period. However, between 1987 and 1992 ,
an ever increasing number of Tharis are migrating to the urban areas outside Thar to
work as masons, as tailor masters in garment factories, as domestic servants, as
labourer in sugar factories, and as employees in government departments. They earn
between Rs. 1,000 to 4,000 per month. Villagers claim that families who receive
remittance money from the cities have lost interest in agriculture and in many cases
they are giving their lands to others on contract basis.
In addition to this migration, since 1987 the Thar elite have also abandoned the
desert. They live in Karachi or Hyderabad with their families where they are
engaged in business or “service” and visit the desert in “in season”. Many Tharis
have also established shops in the cities where they sell Thari handicrafts and
employ Tharies as their assistants. A number of such shop owners operate through
middlemen in the desert, or themselves act as middlemen.
After 1993 more Tharies have been migrated to barrage areas. Majority of Thries
are working in cities as tailors. They are earning 4000-6000, but due to
unestablished market over all in Pakistan this sector also is somewhat influenced.
Inspite of that tailors are earning good and their standard of living has improved
comparatively (Herani 2002:44).
In April 2006, people who did not have livestock or business in Thar, depnend upon
remittance economy, from barrage area and cities; and this trend is increasing day
by day. Now every one who comes out of Thar, including students and those who
Vol. 1, No. 2:107-128 (Fall 2007) 121
Demographic, Social and Economic Changes in Tharparkar (1988-2006) - An Analysis
are in search of government jobs. Also prefer to join tailoring job in order to face
the drought conditions; pass their time and earn some thing more than those who are
low paid government servants. One thing is in common that they waste their income
living in cities due to lack of awareness, mis-using the money and extra expenditure
and send less money to home; inspite of that it is at this time better job for Tharis.
Garments Factories have provided them with facilities but at the same time some
literate persons are also spoiled because they have never accepted low salary from
private sector due to lack of confidence in the power of education. They are
satisfied with what they are earning. They are waiting for government jobs, which
are not available. Those who have joined the private sector by the passage of time
have learned to earn.
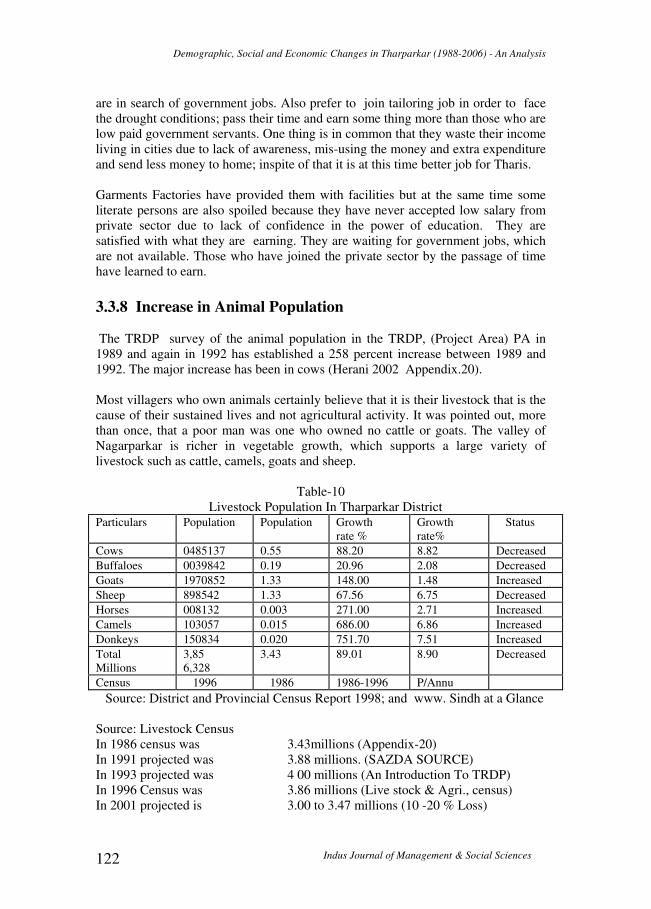
3.3.8 Increase in Animal Population
The TRDP survey of the animal population in the TRDP, (Project Area) PA in
1989 and again in 1992 has established a 258 percent increase between 1989 and
1992. The major increase has been in cows (Herani 2002 Appendix.20).
Most villagers who own animals certainly believe that it is their livestock that is the
cause of their sustained lives and not agricultural activity. It was pointed out, more
than once, that a poor man was one who owned no cattle or goats. The valley of
Nagarparkar is richer in vegetable growth, which supports a large variety of
livestock such as cattle, camels, goats and sheep.
Table-10
Livestock Population In Tharparkar District Particulars Population Population Growth
rate %
Growth
rate%
Status
Cows 0485137 0.55 88.20 8.82 Decreased
Buffaloes 0039842 0.19 20.96 2.08 Decreased
Goats 1970852 1.33 148.00 1.48 Increased
Sheep 898542 1.33 67.56 6.75 Decreased
Horses 008132 0.003 271.00 2.71 Increased
Camels 103057 0.015 686.00 6.86 Increased
Donkeys 150834 0.020 751.70 7.51 Increased
Total
Millions
3,85
6,328
3.43 89.01 8.90 Decreased
Census 1996 1986 1986-1996 P/Annu
Source: District and Provincial Census Report 1998; and www. Sindh at a Glance
Source: Livestock Census
In 1986 census was 3.43millions (Appendix-20)
In 1991 projected was 3.88 millions. (SAZDA SOURCE)
In 1993 projected was 4 00 millions (An Introduction To TRDP)
In 1996 Census was 3.86 millions (Live stock & Agri., census)
In 2001 projected is 3.00 to 3.47 millions (10 -20 % Loss)
Indus Journal of Management & Social Sciences 122

Allah Wasayo Rajar, Gobind M. Herani and Ali Akbar Dhakan
In 2006 expected round about 4.00 millions
3.3.9 Agricultural Activity
District is poor in agriculture as it depends upon rain. Livestock farming is
sustainable source of income. If plants are looked after with proper planning, it will
lead Thar to industrial economy.
3.3.10 Artisanal Activity
Artisanal activity in Thar has increased to cater the city markets. It is entirely
financed and managed by Thari middlemen and increasingly uses the raw materials.
As a result, the production of khata (blanket) and kharal (wollen rugs) has fallen (in
some areas they are not produced any more), and that of shawls has gone up.
Thareis no longer make thread out of their wool but exporting it in raw form. The
price of Thari wool has increased from Rs. 10 per kg in 1987 to Rs 25. Similarly,
leather is no longer manufactured or worked in Thar in any substantial quality but
hides and skins are sent to Karachi and Hyderabad in bulk (Hassan and Hardy
1993:19).
Embroidery is old traditional art of the women, which is introduced and much liked
in the international markets. Per day labour is very low ispite of that ladies are doing
it and supporting their familes.
3.3.11 Thar’s Mineral Wealth
Sulphur deposits are found at Karoonjhar Hills in Nagar Parkar taluka besides
granite stone and china clay. Coal deposits have been recovered at Warwai, a small
village, near Islamkot. This is one of the 13 places in the district, where coal
deposits have been found.
Granite: The Tharparkar district comprised in-exhaustible good quality granite
deposits at Nagarparkar on Pak India border. Entire Karoonjhar Range of mountain
is granite. Local mining companies are engaged in granite mining and polishing.
There is a lot of potential for investment in granite mining and processing.
Thar Coal Deposits: Tharparkar district is spread over an area of around 20,000
square kilometers. Of this over 9,000 square kilometers is identified coalfield
having estimated reserves of around 200 billion tones of good quality lignite,
suitable for power generation. The coalfield is located at a distance of around 400
kilometers in northeast of Karachi. Thar coal is being developed, as a fuel,
especially for power generation, which is enough to meet fuel requirements of the
country for centuries and, would provide a sustainable and reliable power
generation programme (District 1999:5-6).
3.3.12 Debt Status
Vol. 1, No. 2:107-128 (Fall 2007) 123

Demographic, Social and Economic Changes in Tharparkar (1988-2006) - An Analysis
Eighty percent of the Thari households in the Project Area (PA) are in debt to
money lenders and 65 percent of Thari households in the PA pay 3 percent per
month as interest on their debts. 75 percent of the households in debt have borrowed
money for food and 25 percent for other needs. This situation was established by the
TRDP base line survey of 1989. Since there is no previous survey or a survey after
that date, the trends in debt cannot be ascertained. However, as average earnings
according to the survey are only Rs. 4,954 per year. About 46 percent of their
earning is spent on food, there is no way that these debts can be repaid. According
to the villagers, who spoke to us during the field trip that the vast majority of these
debts were incurred during the previous droughts. Only, those persons who are
working regularly in the cities or the barrage areas, those whose children (more than
one) work at the carpet looms; and those who can sell enough cattle, can repay these
debts (Hassan and Hardy 1993:19-20).
According to survey of" Children working in Carpet Industry" in 1999, round about
81 percent have the burdon of loan at their shoulders; out of that 64 percent are able
to pay the loan easily. Mostly people are able to pay loan upto Rs. 5000. An average
amount of loan is from 10-50 thousands as a averrage. Less then 10 percent families
are able to pay more then 10 thousands.
They are loaner in the following order: (i). 2% NGOs. (ii). 27% Money lenders .
(iii). 5% Contractors. (iv). 7% Relatives. (v). 11%land Lord. (vi). 12%Neighbours.
(Ratta Rang Koomayal Baar 1999, pp.13-15). Primary data of thesis (Herani 2002,
Table-8) is as bellow: (i). 9% Farm bonded loaner, (ii). 26% Loaners to
shopkeepers, (iii). 23% Money lenders, (iv). 22 Friends/ relatives, (v). 20% Not
loaners at all.
In 2007 without survey, by opinions of common people during casual trip and
personal observations it is coming to know that situation of people has improved.
3. CONCLUSIONS
Finally it can be concluded that population in Tharpakar has highest ratio as compare
to other districts of Sindh province. According to census 1998 overall growth rate was
2.8% per annum for the province and for Thar 3.12%.
Its population growth rate is decreased, in comparison of 1981-1991, which was
3.2% and it was worked out 4.4 for urban areas. It was 3.12 in 1981-1998 per annum.
With this growth rate up to 2020 the population will be double. It does not support
the hypothesis two.
Ratio of males is greater than female. It means number of workers has increased.
50.28% population is bellow 15 years. While at provincial level it was 42.76%, it
shows high growth rate of working people. If they are educated and motivated for
Indus Journal of Management & Social Sciences 124

Allah Wasayo Rajar, Gobind M. Herani and Ali Akbar Dhakan
proper income generating sources, then it will prove better; otherwise there will be
lower affordability power, which supports hypothesis one.
It is found that 22.58% are un-married, while at provincial level rate is 30.62%. It
shows that population growth rate will be more in future in comparison of province.
Literacy rate is 57.27 % for urban and 18.35% at rural level. Moreover, over all in
Thar, it is 18.32% and at provincial level, it is 25.73%. In urban areas of provincial
ratio of educated is 55.96% and at Tharparkar is 57.05% indicates that Tharies urban
are more aware for education. It supports the hypothesis four.
Human settlements have improved along with living status. As urbanization is
increasing living status is also increasing, making new huts better than before and in
every respect they are ready to accept new methods of social change. It supports the
hypothesis three and five. As urbanization increased, the literacy ratio increased and
growth rate also increased along with density per square K.M, it does not support
hypothesis six.
Health care facilities are increased in the sense that number of practitioners have
increased. Immunization has increased from 4.8% to 34% from 1989 to 1998. Public
hospitals have not increased.
Out of total refined population, only 34% is participation rate by economic category.
It is 59.27% for males and 5.51% for females resulting in an overall low participation.
Transportation has increased at better level. Moreover, with the spread of road
network, it will improve more. Network of road is also increased in the era of present
regime and expected better in future. Carpet industry is in ups downs depending upon
the export demand. At present remittance, income has played a big role as a
contributor in the development of home status of people.
Livestock has decreased due to droughts occurring. It was better in census of 1981.
However, it is the sustainable source of income in Thar. In addition, it will lead Thar
in to industrial economy if it is promoted by awareness.
4. POLICY RECOMMENDATIONS
Based on the rapidly growing population of the district, sustainable planning to cope
with challenges next from it, a number of policy recommendations are made for
human resource development and management of demographic, social and economic
problems.
i. New trend of migration from villages to urban areas is encouraging. This trend puts
pressure on the urban areas and creates some problems of overcrowding and
density.
It is therefore recommended to enhance the social and economic activities in small
villages. It will also help to utilize the rangeland of villages when they will stay
over their native places.
Vol. 1, No. 2:107-128 (Fall 2007) 125

Demographic, Social and Economic Changes in Tharparkar (1988-2006) - An Analysis
ii. There is need of increasing livestock, which is real sustainable source of income
iii. There is need of microfinance and safety nets. It is also recommended that deposit
at very small amount be encouraged to train them in financial matters and will
create the habit of saving.
iv. Arrangement should be made for those who have nothing to eat only simple bread
for two times. At least simple bread at two times food should be ensured by
microfinance and create the habit of deposit a very small amount at fixed time. In
this way, they will also get rid off from traditional moneylenders.
iv. Best race of livestock that gives more production should be introduced for
boosting of income and alleviating poverty.
v. There is need of properly managed system of artisanal activities support. It will
support them a surety of at least of a small earning.
vi. Presently a lot of work is being done on network of roads. Electricity and tube
wells. It has improved the status of living and healthy environment. So it is
recommended to enhance the plans and complete the ongoing plans with in time.
vii. This District has abundant labourers as compared to other region of the province
Sindh and must adopt modren incentives and technologies e.g. information
technology, electrical machinary for cottage industry and dairy farming; making
them aware for more efficient employment of their domestic labour.
viii. Government of Pakistan must launch a boosting program for encouraging
students to achieve almost 100% literacy rate as well as scientific knowledge and
latest technology should be imparted. It can be done by encouraging scholarships,
which is introduced for girls at this time by government.
ix. Active NGOs should play active role in creating awareness in Tharies. They are
doing but more scholars are required which is lacking of these NGOs. There is
need to develop strong partnership and cooperation among the public private and
corporate sectors to handle the problems and urban and rural settlements viable
and live able.
x. Innovative plans should be made for successful completion of projects. Advocacy
method should be adopted during decision-making and implementation of
planning of planning procedures.
xi. Reform of Rangeland and Farmland should be done by fencing at farmland for the
better environment and fodder for livestock.
xii. Rainy canal scheme should be completed as soon as possible.
xiii. Tree plantation schemes should be encouraged by indigenous and exotic plants.
xiv. Under ground water should be pulled out by increasing the number of tube wells.
xv. Small dams should be built to harvest the rainwater. Already proposed and
pending work should be completed.
xvi. Water supplied through pipe line should be extended.
xvii. Mobile community bank should be introduced through NGOs getting deposits
and that should be encouraged according to guide lines issued by state bank of
Pakistan in 2005.
xviii. Degree college of Mithi should be given status of university, which was already
in plan to provide the quality education at low expenses
xix. More research programs should be made to update the data for planners.
Indus Journal of Management & Social Sciences 126
Allah Wasayo Rajar, Gobind M. Herani and Ali Akbar Dhakan
xx. Minerals exploration should be extended and royality should be given for the
development of Tharparkar.
REFERENCES
Bhati, T.K and R.K. Goyal and H.S. Daulay. 1997. Development of dry land
agriculture on watershed basis in hot arid tropics of India: a Case Study.
Annals of Arid Zone, 36(2): 115-121 (Internet source)
Country. 1996. Country Commercial Guides. [recently found in the Tharparkar Desert
of Sindh with the .18.5 Construction 4.1 Electricity & gas distribution 3.9 An
imported tractor scheme was launched for. (Internet source)]
District.1999. District Census Report of Tharparkar 1998. Islamabad: Population
Census Organization, Statistics Division, Government of Pakistan,
September.
Hassan, Arif and Fiona A. Hardy. 1993. Tharparkar rural Development Project
(TRDP) Evaluation 1993. (Government of Sindh, United Nations Children’s
Fund (UNICEF) Save the Children Fund (SCF)-U.K)
Herani, Gobind M. 2002. A Comparative Study of Agro-based industry of Tharparkar
with Canal Barrage Area Sindh (1988-2000) Suggested Techniques Leading
to an Industrial Economy. Sindh: PhD Theses, Department of Economics,
University of Sindh, Jamshoro, April.
Herani, Gobind M., Allah Wasayo Rajar and Muhammad Ali Khaskheli. 2007.
Reforming Farmland and Rangeland in Tharparkar: Suggested
Implementations for Income Generation. Indus Journal of Management &
Social Sciences, Vol. 1, No.1: 16-36 (Spring)
Mithal S.P and Mohd. Rafiq Khan. 1976. History of Rural Development in Modern
Vol - V. India: Gandhian Institute of Studies, Janana mandal Ltd. April : 9
Provicial. 2001. Provincial Census Report of Sindh, 1998. Islamabad: population
Census Organization, Statistics Division, Government of Pakistan, May
Ratta. 1999. Ratta Rang Koomayal Baar.Children Work in Carpet Industry in Thar.
Mithi Tharparkar: Thardeep Rural Development Tharparkar & RAASTA
Development Consultants
Simmonds, S. 1949. Overseas Economics Surveys, Denmark Economic and
Commercial conditions in Denmark. London: His Majesty's Stationary
Office
Social. 2001. Social Development in Pakistan Annual Review 2000 towards Poverty
Reduction. Karachi: Social Policy and Development Centre and Oxford
University, Pakistan
Somalia. 1999. Somalia Human Development. Context of Human Development in
Somalia. Chapter 1: Introduction. Introduction. 1.1 The Relevance of Human
Development in the Somalia Context.
(http://meltingpot.fortunecity.com/lebanon/254/undp.htm)
Thar. 2000. Thar Drought Presentation (1997 - 1998, 1998 - 1999, 1999 - 2000,
2000-2001).http://www.un.org.pk/drought/Sindhmission.htm(4-12 June
2000)
Vol. 1, No. 2:107-128 (Fall 2007) 127

Demographic, Social and Economic Changes in Tharparkar (1988-2006) - An Analysis
Thar. 2001. Schemes launched in Thar, 23rd May, Karachi. (Internet source)
Dawn. Local, 19, ctomber.2000.http://www.dawn.com/2000/10/19
DAWNS - Local, 01 November 2000. Oct 31: Various schemes of water, roads,
electricity and health care were being undertaken in the desert area of
Tharparkar to solve basic problems of the
http://www.dawn.com/2000/11/01/local.htm (HYDERABAD, Oct 31 :)
DAWN-Letters 09 July 2000 in the drought-
http://www.dawn.com/2000/07/09/letted.htm
www partnership partnerships and Collaborations. Welfare Help build this site If
http:///www.doleta gov/ /www.partnerships/default.asp
http://www.Tharparkar.sdnpk.or/pic5.htm
htttp://www.dawn.com/2000/06/26/nat.htm [More Results From:
http://www.dawn.com www.dawn.com (MITHI, June 25)
http://dosfan.lib.uic.edu/ERC/economics/commercial_guides/Pakistan.htmCASE
STUDIES IN MICROFINANCE AKRSP http://www-
esd.worldbank.org/html/esd/agr/sbp/last/pakistan.htm
Indus Journal of Management & Social Sciences 128