demography -1 dr. uzma. hassan (mbbs, mph, msc) assistant professor community medicine rawal...
TRANSCRIPT

1
DEMOGRAPHY -1Dr. Uzma. Hassan
(MBBS, MPH, MSc)
Assistant Professor Community Medicine
Rawal Institute Of Health Sciences, Islamabad
Dated: 30-April-2015

2
DEMOGRAPHY
Demography is the scientific study of human population. It focuses its attention on three readily
observable human phenomenon.
1. Changes in population size (growth or decline)
2. Composition of the population
3. Distribution of population in space

3
DEMOGRAPHY
Demography is the study of human populations concerning their size, distribution, structure and changes within them.Size: the number of persons in the population at a
given time. Distribution: the arrangement of the population in
space at a given timeStructure: the distribution of the population among
its sex and age groupings Changes: occur due to the growth or decline of
the total population, resulting from births, deaths and in or out migration.

4
POPULATION STUDIES
Population studies are concerned not only with demographic variables (births, deaths, migration) but also with relationship between population changes and other variables- Social Economic Political Biological Genetic Geographical Environmental Health

5POPULATION STUDIES
In general Population Studies: take into account the effects of social, economic and health factors on population growth and vice versa.
In broader sense population studies: is concerned with other characteristics of human beings such as : o Ethnicity (race, mother tongue)o Social characteristics (marital status, literacy,
educational attainment, women’s status)o Economic characteristics (employment status,
occupation, income).
6
DEMOGRAPHIC PROCESSES
It deals with five demographic processes:
1. Fertility
2. Mortality
3. Marriage
4. Migration
5. Social mobilityThese five processes are at work within a
population determining size, composition and distribution
7
DEMOGRAPHIC CYCLEThe history of world population since 1960
suggests that there is a demographic cycle of 5 stages through which a nation passes:
a) First stage ( High stationary )
b) Second Stage ( Early expanding )
c) Third stage ( Late expanding )
d) Fourth stage ( Low stationary )
e) Fifth stage ( Declining )

8
STAGES OF DEMOGRAPHIC CYCLE
First stage: (High stationary) This stage is characterized by a high birth rate and a high death rate, which cancel each other and the population remains stationary.
Secondary Stage: (Early expanding) The death begins to decline while the birth rate remains unchanged.
Third stage: (Late expanding) The death rate declines still further and the birth rate tends to fall. The population continues to grow because births exceeds deaths.

9
STAGES OF DEMOGRAPHIC CYCLE
Fourth Stage: (Low stationary) There is low birth and low death rate with the result that the population becomes stationary.
Fifth Stage: (Declining) The population begins to decline because birth rate is lower than death rate.

10
DEMOGRAPHIC TRENDS

11
Age-Sex Composition
Refers to the proportion of males and females in different age groups. This composition has a direct bearing on social,
economic and health needs of communities or countries.
In “old” population the society has to arrange for the care of elderly, and the health system of the country should be organized accordingly.
In a “young” population the country has to provide more schools, immunization, and economic support of young.
12
Population Pyramid
Population Pyramid: A pictorial presentation of the age sex composition of a population.Several factors can be ascertained by a glance
at the chart : o The population is old or youngo What is the dependency ratioo At what rate the population is increasingo Was there a recent change in fertility or mortality
of this population.

13
Population Pyramid
The age pyramid of Pakistan is typical of developing countries, with a broad base and a tapering top.
In the developed countries like Switzerland the pyramid generally shows the bulge in the middle and has a narrow base.
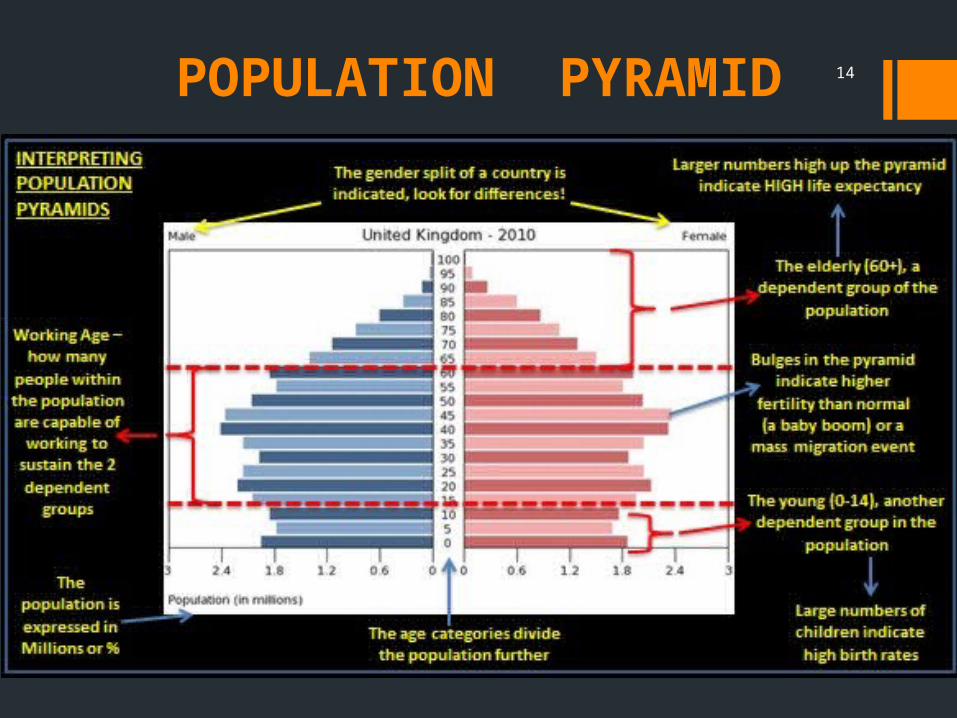
14POPULATION PYRAMID
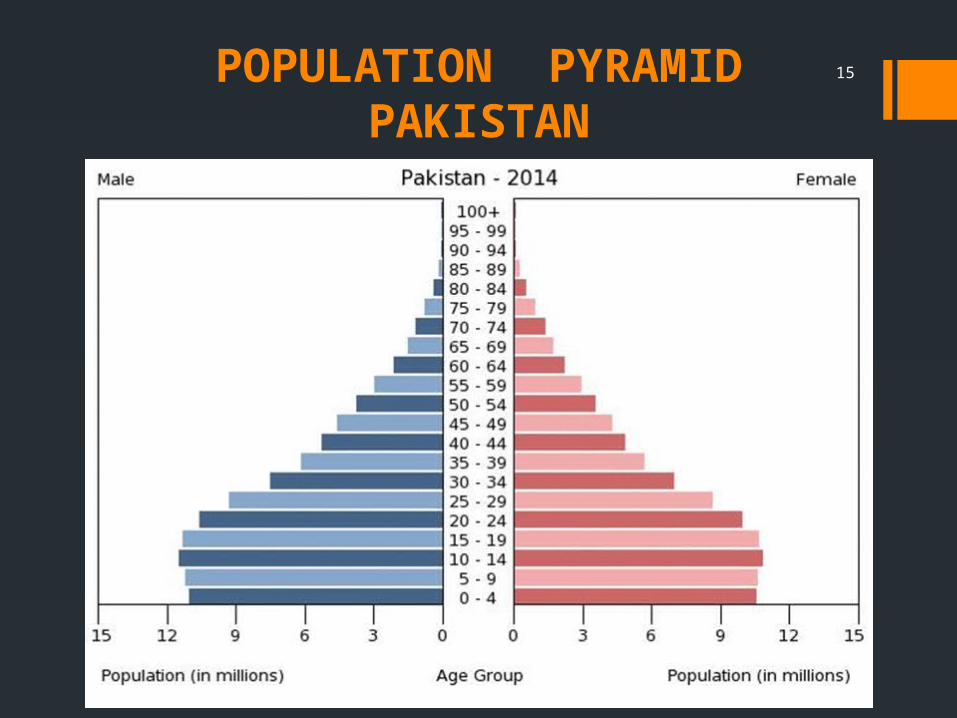
15POPULATION PYRAMIDPAKISTAN

16POPULATION PYRAMIDPAKISTAN
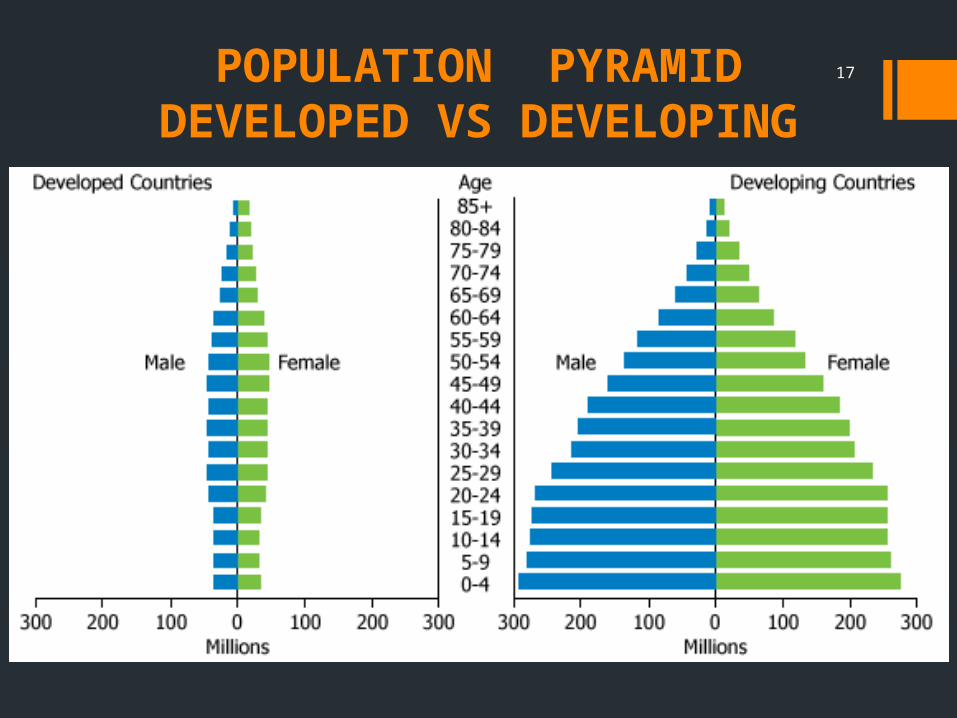
17POPULATION PYRAMIDDEVELOPED VS DEVELOPING

18POPULATION PYRAMIDDEVELOPED VS DEVELOPING
19
Sex Ratio
Sex Ratio: The number of females per thousand males. In any study of population, analysis of sex
composition plays a vital role. It is affected by:o the differentials in mortality conditions of males
and femaleso sex selective migration and o sex ratio at birth.

20Dependency RatioThe proportion of persons above 65 years of age and children below 15 years of age are considered to be dependent on the economically productive age group (15-64 years)Total dependency Ratio: The ratio of combined
age group 0-14 years plus 65 years and above to the 15-65 years age group is referred to as the total dependency ratio. It is also referred to as,
Societal dependency ratio: and reflects the need for a society to provide for their younger and older population groups. This can be sub divided into:o Young age dependency ratio: (0-14 years)o Old age dependency ratio: (65 years and more)

21
Density of Population
It is one of the important indices of population concentration.
It is defined as “the number of persons, living per square kilometers”.
22
Family Size
Commonly family size means: the total number of persons in a family.
In demography family size means : the total number of children a women has borne at a point in time.
The completed family size indicates: the total number of children borne by a women during her child bearing age group which is generally assumed to be between 15 and 45 years.

23
Family Size
Total fertility rates: The approximate magnitude of the completed family size.
Dependent factors: Duration of marriage, education of the couple, number of births and living children, preference of male children, desired family size.
Family planning: Involves both decision regarding “desired family size” and the “effective limitation of fertility once that size has been reached”.

24
Urbanization
Growing Urbanization is a recent phenomenon in the developing countries.
The increase in urban population has been attributed both to natural growth (through births) and migration through villages
Because of:o Employment opportunitieso Attraction for better living conditions o Availability of social services such as education,
health, transport, entertainment
25
Net- Migration: The total number of persons added or subtracted from a population as a result of the combined effect of immigration and emigration (In-migration- out-migration)
Population Growth Rate: The rate at which a given population is expected to increase in a given period of time. It is shown in percentage per year.
26
Population Doubling time: The time that would take for a population to double.
Formula: Population increase is on the compound interest formula,1 % per year increase would cause the population to double in about 70 years.
If the population is increasing at 3 % per year then doubling time will be 70 divided by 3 = 23.3 years.

27
Literacy and education
The benefits of having a literate population are multidimensional.
Spread of literacy is associated with modernization, urbanization, industrialization, communication and commerce.
A person is deemed as literate: If he or she can read and write with understanding in any language. A person who can merely read but cannot write is not considered as literate.

28
Literacy and education
Crude Literacy Rate: The Literacy rate taking into account the total population in the denominator .

29
Life Expectancy
Life expectancy or expectation of life: at a given age is the average number of years which a person of that age may expect to live, according to the mortality pattern prevalent to that country.
This is considered as one of the best indicators of a country's level of the overall health status of its population.

30
FERTILITYFertility / Natality: The actual bearing of children. Woman’s reproductive age: 15-45 years of age
( period of 30 years). A women married at 15 and living till 45 years with
her husband is exposed to the risk of pregnancy for 30 years, and may give birth to 15 children, but the maximum is rarely achieved.
The higher fertility is attributed to several factors: Universality of marriage, lower age of marriage, low level of literacy, poor level of living, limited use of contraceptives and traditional way of life.
31FACTORS AFFECTING FERTILITY1. Age at marriage: The females who get married
before the age of 18 years of age give rise to greater number of children as compared to those who get married after 20 years. The national average for effective marriage is 20.5 years.
2. Duration of married life:10-25 percent of all the births occur within 1-5 years of married life, 50-55 percent of all births within 5-15 years of married life. Birth after 25 years of life are very rare.

32
FACTORS AFFECTING FERTILITY
3. Spacing of children: When all the births are postponed by one year in each group there is a decline in total fertility.
It follows that spacing in children has a significant impact in the fertility rates.

33FACTORS AFFECTING FERTILITY
4. Education: There is an inverse relationship between educational level and fertility. Surveys show that the total fertility level is 1.7 children higher for illiterate women than for women with at least a high school education.
5. Economic Status: Economic Status bears an inverse relation with fertility. The total number of children born declines with an increase in per capita expenditure of the house hold. It is a known fact that economic development is the best contraceptive.
34FACTORS AFFECTING FERTILITY
6. Caste and Religion: Muslims have a higher fertility rate as compared to Hindus. A fertility rate of 3.9 among Muslims, 2.65 among Hindus and 2.35 in Christians.
7. Nutrition: The effect of nutrition on fertility is largely indirect. Virtually all well-fed societies have low fertility and poorly fed societies high fertility.

35FACTORS AFFECTING FERTILITY 8. Family planning: Family planning is another
important factor in fertility reduction. In a number of developing countries, family planning has been a key factor in declining fertility.
9. Other Factors: Fertility is affected by a number of physical, biological, social and cultural facts, such as place of women in society, value of children in society, widow remarriage, breast feeding, customs and beliefs, industrialization and urbanization.

36FERTILITY- RELATED STATISTICS
Fertility may be measured by a number of indicators given below:
1. Birth Rate
2. General Fertility Rate
3. General Marital Fertility Rate
4. Age Specific Fertility Rate
5. Age Specific Marital Fertility Rate
6. Total Fertility Rate
7. Total Marital Fertility Rate

37
FERTILITY- RELATED STATISTICS
9. Gross Reproduction Rate
10. Net Reproduction Rate
11. Child-Woman Ratio
12. Pregnancy Rate
13. Abortion Rate
14. Abortion Ratio
15. Marriage Rate

38
1. Birth Rate
• It is “the number of live births per 1000 estimated mid-year population, in a given year”.
• This is an unsatisfactory measure of fertility because the total population is not exposed to child bearing. Therefore it does not give a true idea of the fertility of a population
Number of live births during the year
Estimated mid-year population X 1000Birth Rate =

39
2. General Fertility Rate (GFR)• It is “the number of live births per 1000 women in the reproductive
age-group (15-44 or 49 years) in a given year”
• This is a better than the crude birth rate because the denominator is restricted to the number of women in the child-bearing age, rather than the whole population.
• The major weakness of this rate is that not all women in the denominator are exposed to the risk of childbirth
Number of live births in an area during the year
Mid-year female population age 15-44 (or 49) in the same area in same year
X 1000GFR =
40
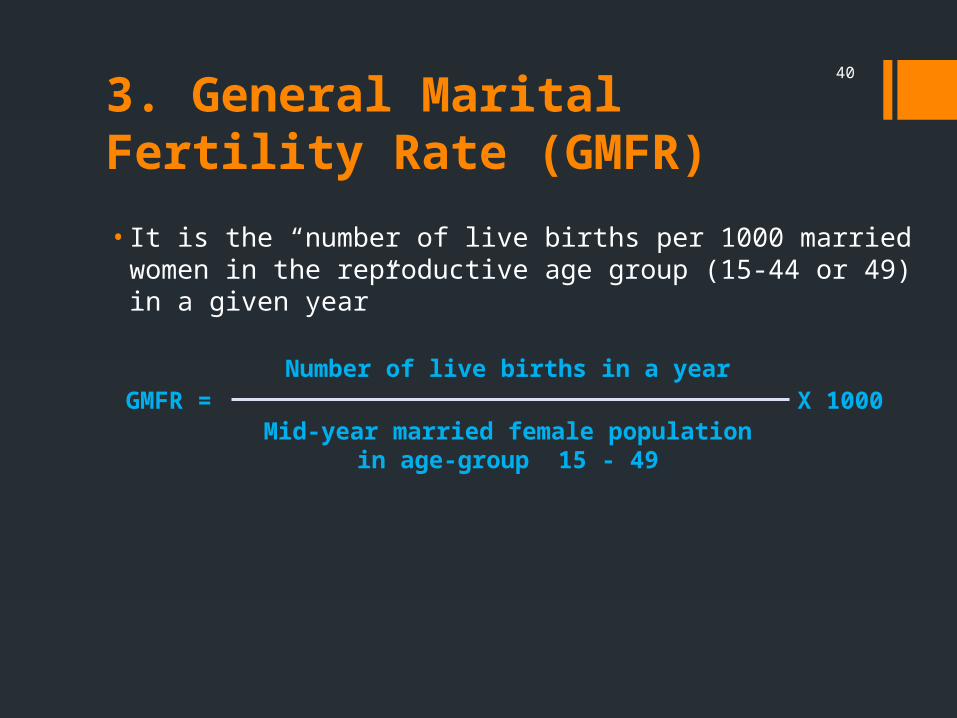
3. General Marital Fertility Rate (GMFR)
• It is the “number of live births per 1000 married women in the reproductive age group (15-44 or 49) in a given year”
Number of live births in a year
Mid-year married female population in age-group 15 - 49
X 1000GMFR =
41
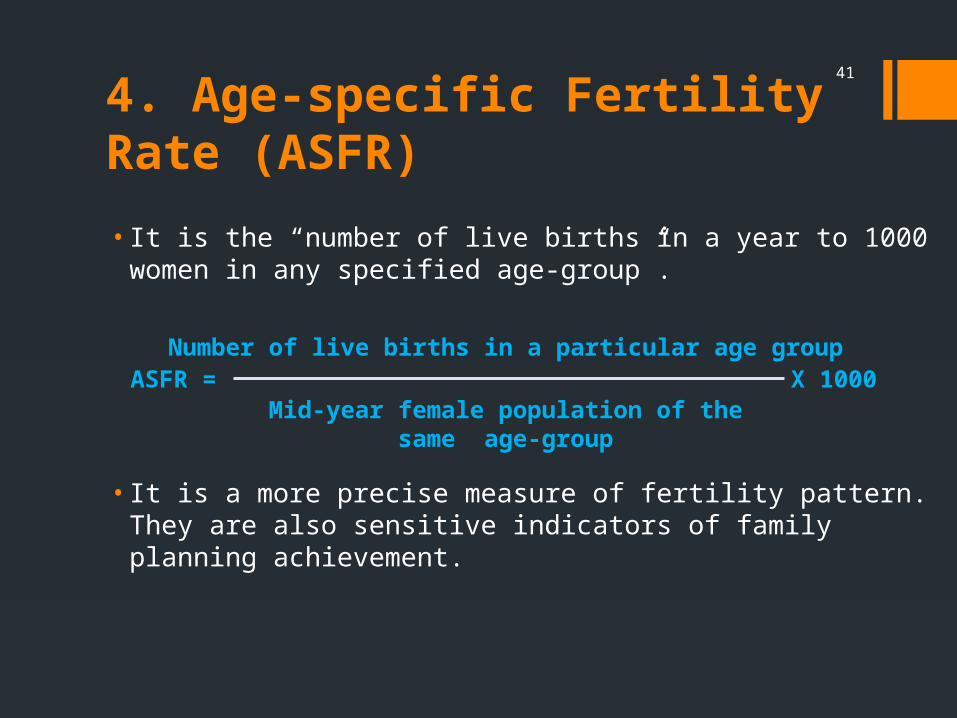
4. Age-specific Fertility Rate (ASFR)
• It is the “number of live births in a year to 1000 women in any specified age-group”.
• It is a more precise measure of fertility pattern. They are also sensitive indicators of family planning achievement.
Number of live births in a particular age group
Mid-year female population of the same age-group
X 1000ASFR =
42
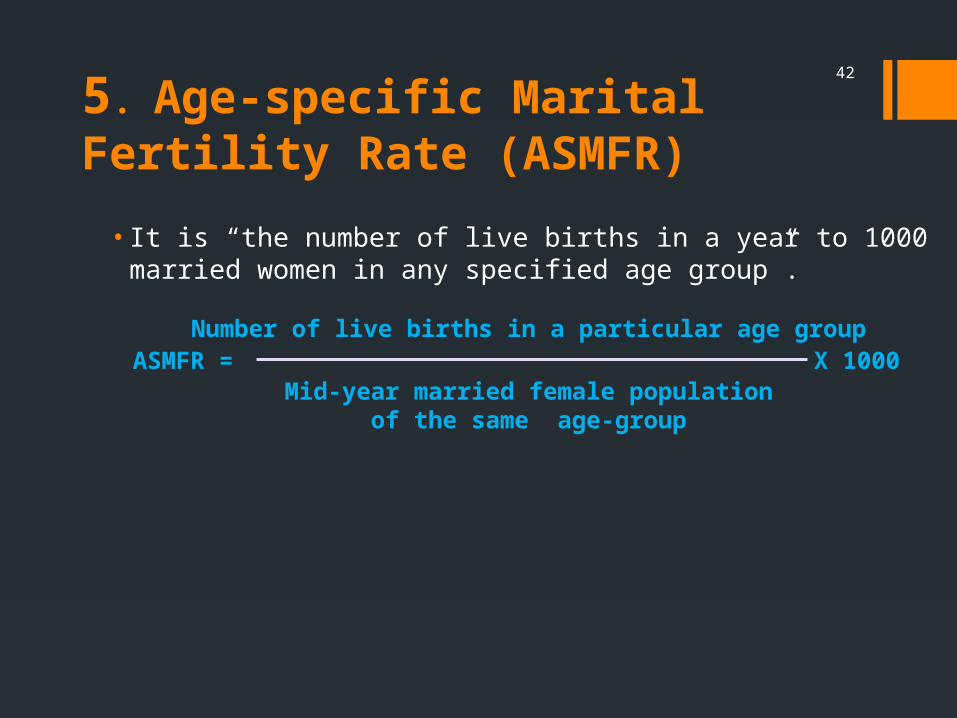
5. Age-specific Marital Fertility Rate (ASMFR)
• It is “the number of live births in a year to 1000 married women in any specified age group”.
Number of live births in a particular age group
Mid-year married female population of the same age-group
X 1000ASMFR =

43
6. Total Fertility Rate (TFR)
• It is the average number of children a woman would have if she were to pass through her reproductive years bearing children at the same rate as the women now in each age group.
• It is computed by summing the age-specific fatality rates for all ages; if 5-year age groups are used, the sum of the rates is multiplied by 5. This measure gives the approximate magnitude of “completed family size”.
40-49
5 X ∑ ASFR 15-19
1000TFR =
44
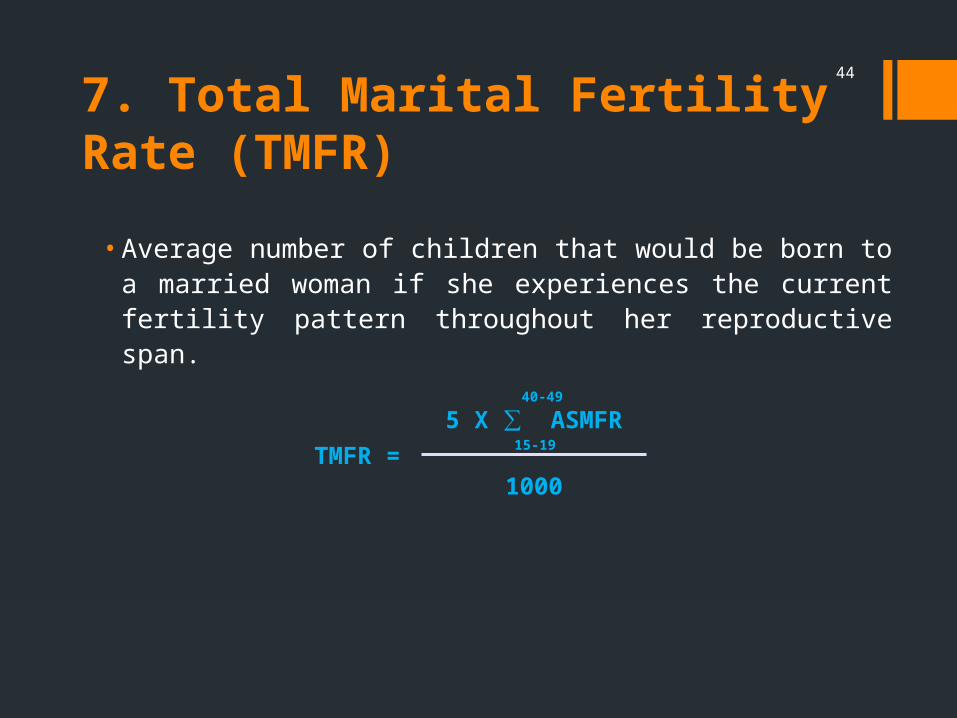
7. Total Marital Fertility Rate (TMFR)
• Average number of children that would be born to a married woman if she experiences the current fertility pattern throughout her reproductive span.
40-49
5 X ∑ ASMFR 15-19
1000TMFR =

45
8. Gross Reproduction Rate (GRR)
• Average number of girls that would be born to a woman if she experiences the current fertility pattern throughout her reproductive span (15-44 or 49 years), assuming no mortality.
40-49
5 X ∑ ASFR for female live births 15-19
1000TMFR =

46
9. Net Reproduction Rate (NRR)
• It is “the number of daughters a newborn girl will bear during her lifetime assuming fixed age-specific fertility and mortality rates” .
• It is a demographic indicator.
• NRR of 1 is equivalent to attaining approximately the 2-child norm. If the NRR is less than 1, then the reproductive performance of the population is said to be below replacement level.

47
10. Child-woman Ratio• It is the number of children 0-4 years of age per 1000 women of
child-bearing age, usually defined as 15-44 or 49 years of age.
• It is used where birth registration statistics either do not exist or are inadequate and is estimated through data derived from censuses
11. Pregnancy Rate• It is the ratio of number of pregnancies in a year to married
women in the age 15-44 (or 49) years.
• The “number of pregnancies” includes all pregnancies, whether these had terminated as live births, stillbirths or abortions or had not yet terminated.
48
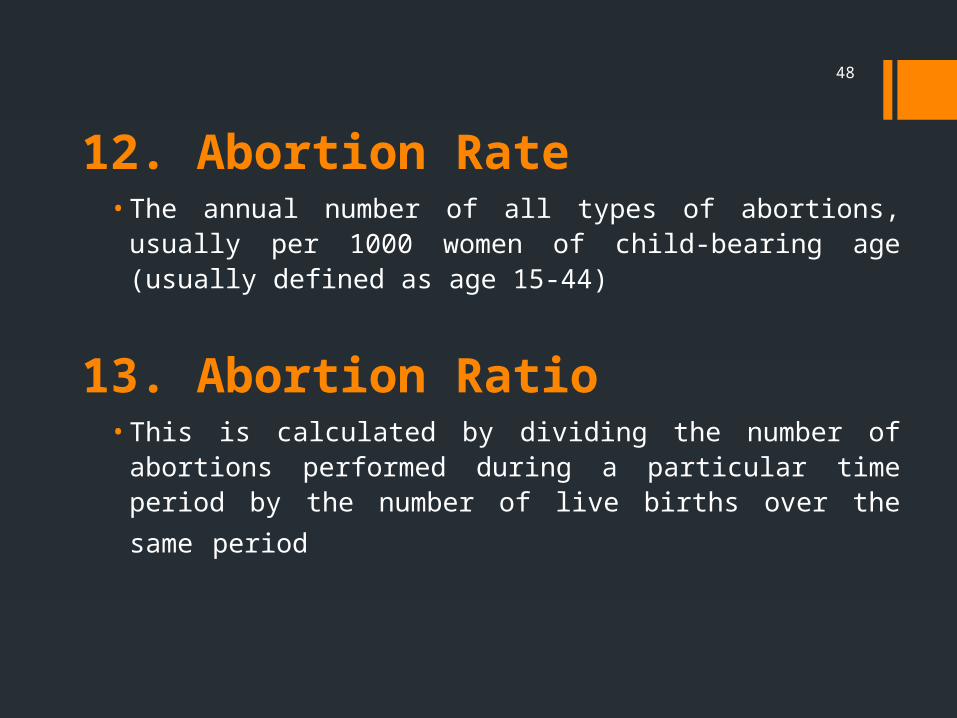
12. Abortion Rate• The annual number of all types of abortions, usually per 1000
women of child-bearing age (usually defined as age 15-44)
13. Abortion Ratio• This is calculated by dividing the number of abortions performed
during a particular time period by the number of live births over
the same period
49
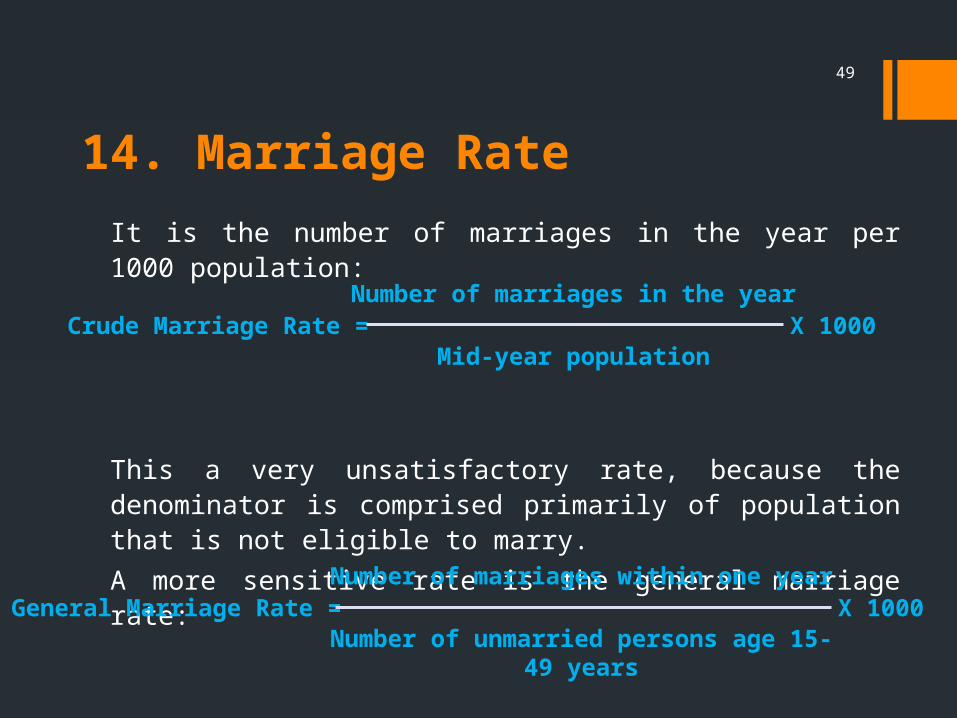
14. Marriage Rate
It is the number of marriages in the year per 1000 population:
This a very unsatisfactory rate, because the denominator is comprised primarily of population that is not eligible to marry.
A more sensitive rate is the general marriage rate:
Number of marriages in the year
Mid-year populationX 1000Crude Marriage Rate =
Number of marriages within one year
Number of unmarried persons age 15-49 years
X 1000General Marriage Rate =

50
THANKS