demystifying the turkish economic success under akp governance
TRANSCRIPT

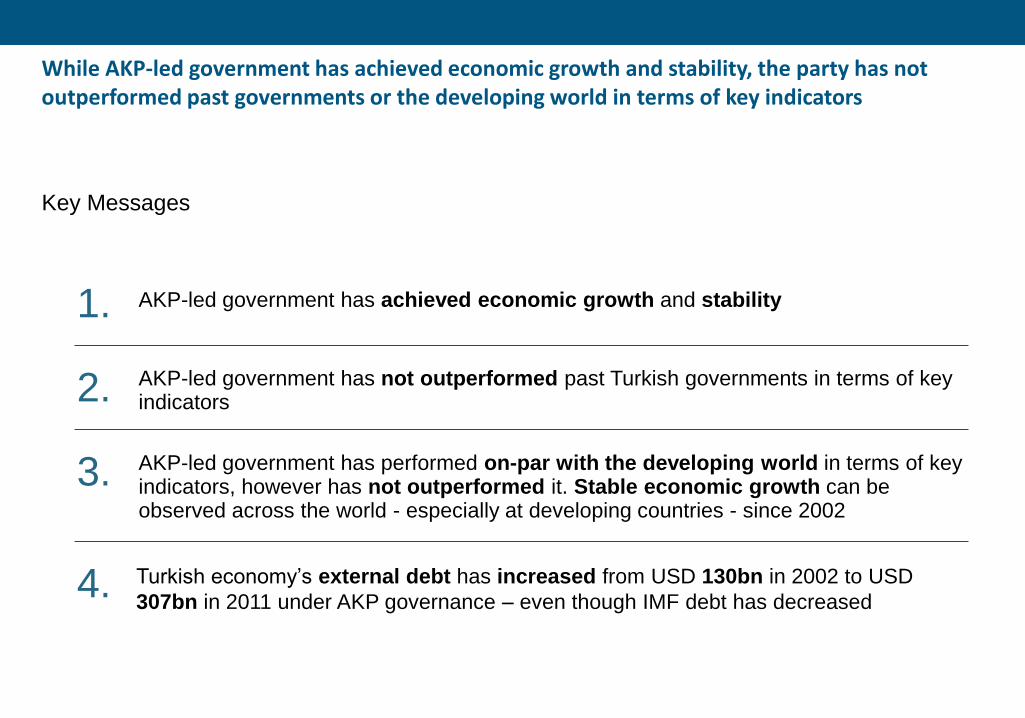
While AKP-led government has achieved economic growth and stability, the party has not outperformed past governments or the developing world in terms of key indicators
Key Messages
1. AKP-led government has achieved economic growth and stability
2.
3.
AKP-led government has not outperformed past Turkish governments in terms of key indicators
AKP-led government has performed on-par with the developing world in terms of key indicators, however has not outperformed it. Stable economic growth can be observed across the world - especially at developing countries - since 2002
Turkish economy’s external debt has increased from USD 130bn in 2002 to USD
307bn in 2011 under AKP governance – even though IMF debt has decreased
4.

GDP and GDP per capita have consistently increased between 2002-2011 – under AKP governance
Progression of Turkish Economy Main Indicators
Source: World Bank
GDP, constant 2000 USD exchange rate [USD bn]1)
5.25%
2011
422.8
2010
389.7
2009
357.0
2008
375.1
2007
372.6
2006
356.0
2005
333.0
2004
307.2
2003
280.9
2002
266.9
GDP per capita, constant 2000 USD exchange rate [USD bn]1)
4,078
3.87%
2011
5,741
2010
5,356
2009
4,969
2008
5,288
2007
5,324
2006
5,155
2005
4,887
2004
4,569
2003
4,235
2002
1 – ECONOMIC GROWTH AND STABILITY
1) AKP won the elections at the end of 2002 and have been leading the government since

Foreign Direct Investment has increased and inflation has stabilized at single-digit figures under AKP governance
Progression of Turkish Economy Main Indicators
Source: World Bank
Foreign Direct Investment inflow, current USD [USD bn] 1)
34.94%
2011
16.0
2010
9.0
2009
8.4
2008
19.5
2007
22.0
2006
20.2
2005
10.0
2004
2.8
2003
1.7
2002
1.1
Inflation, consumer prices [annual %] 1)
1 – ECONOMIC GROWTH AND STABILITY
2011
6.5
2010
8.6
2009
6.3
2008
10.4
2007
8.8
2006
10.5
2005
10.1
2004
10.6
2003
25.3
2002
45.0
1) AKP won the elections at the end of 2002 and have been leading the government since

• Inflation had reduced from 106% in 1994 to 45% in
2002 – there was a downward trend in inflation prior
to AKP governance. There was also a global trend
towards a stabilization of inflation across emerging
countries in the 2000s
• Turkish economy grew at 5.25% per annum
between 2002-2011, growth was at 4.6% p.a.
between 1960-2000
While AKP has achieved economic growth and stability, the party took advantage of favorable global trends and a recovered economy following the 2001 crisis
Key Facts and Implications for AKP-led Government
Source: World Bank
• Turkish economy was the 22nd biggest economy
in 1981, 21st in 1991, 17th in 2002 and again 17th
in 2011
• While past governments have been
successful in increasing Turkey’s GDP size
ranking from 22nd to 17th, under AKP’s
governance, ranking has stayed the same
KEY FACTS IMPLICATIONS FOR AKP-LED GOVERNMENT
A
B
C
2 – BENCHMARKING WITH PAST TURKISH GOVERNMENTS
• The plan to stabilize inflation was developed
under Kemal Dervis’ leadership and AKP
found a recovered economy «in their lap» at
the beginning of their term. A global trend
towards stabilized inflation also helped AKP
• Current government has achieved higher
growth rate compared to previous times.
However, while previous governments since
1960 have performed better than the
developing world in terms of growth, AKP
has not been able to do so
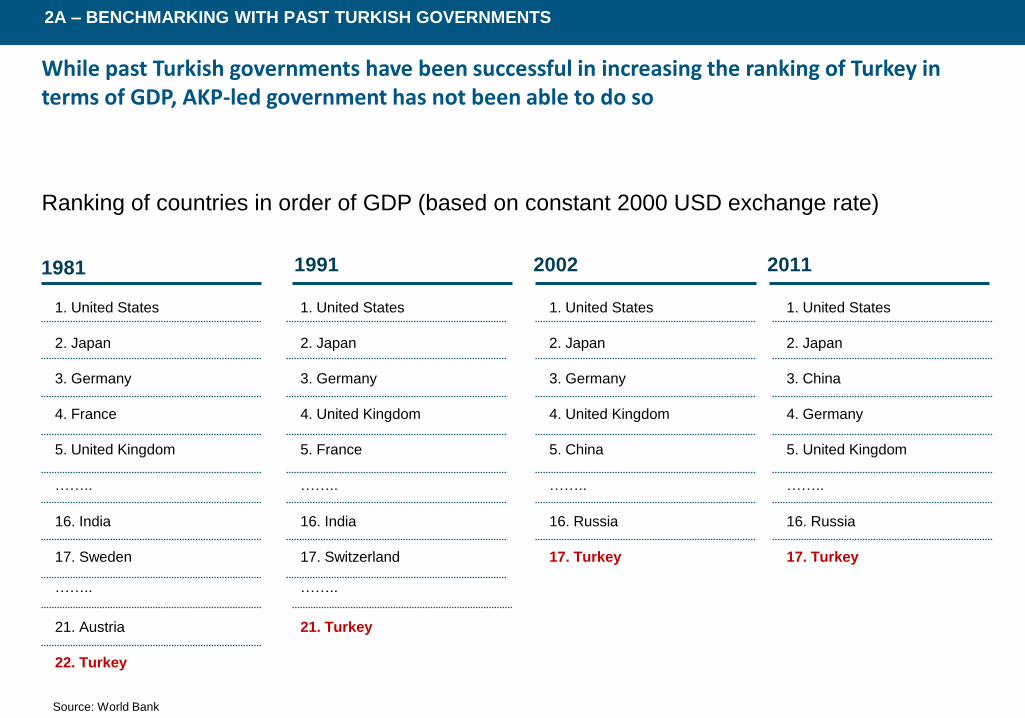
While past Turkish governments have been successful in increasing the ranking of Turkey in terms of GDP, AKP-led government has not been able to do so
Ranking of countries in order of GDP (based on constant 2000 USD exchange rate)
Source: World Bank
2A – BENCHMARKING WITH PAST TURKISH GOVERNMENTS
1981 1991 2002 2011
1. United States
2. Japan
3. Germany
4. France
5. United Kingdom
……..
16. India
17. Sweden
21. Austria
22. Turkey
……..
1. United States
2. Japan
3. Germany
4. United Kingdom
5. France
……..
16. India
17. Switzerland
21. Turkey
……..
1. United States
2. Japan
3. Germany
4. United Kingdom
5. China
……..
16. Russia
17. Turkey
1. United States
2. Japan
3. China
4. Germany
5. United Kingdom
……..
16. Russia
17. Turkey
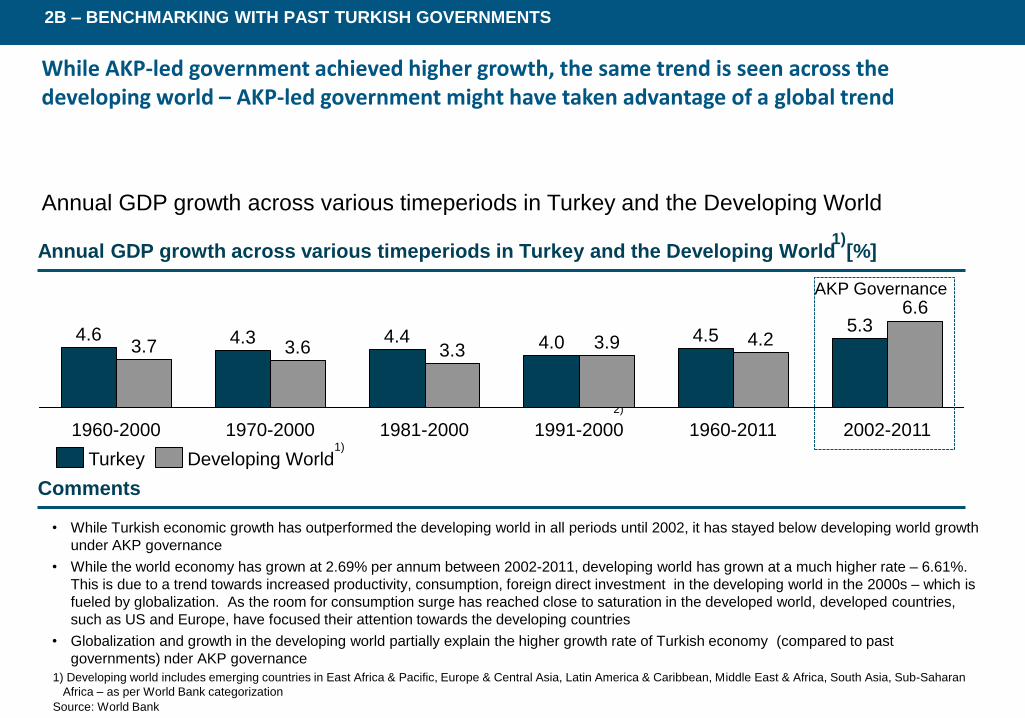
While AKP-led government achieved higher growth, the same trend is seen across the developing world – AKP-led government might have taken advantage of a global trend
Source: World Bank
2B – BENCHMARKING WITH PAST TURKISH GOVERNMENTS
Annual GDP growth across various timeperiods in Turkey and the Developing World [%]
1) Developing world includes emerging countries in East Africa & Pacific, Europe & Central Asia, Latin America & Caribbean, Middle East & Africa, South Asia, Sub-Saharan
Africa – as per World Bank categorization
Comments
• While Turkish economic growth has outperformed the developing world in all periods until 2002, it has stayed below developing world growth
under AKP governance
• While the world economy has grown at 2.69% per annum between 2002-2011, developing world has grown at a much higher rate – 6.61%.
This is due to a trend towards increased productivity, consumption, foreign direct investment in the developing world in the 2000s – which is
fueled by globalization. As the room for consumption surge has reached close to saturation in the developed world, developed countries,
such as US and Europe, have focused their attention towards the developing countries
• Globalization and growth in the developing world partially explain the higher growth rate of Turkish economy (compared to past
governments) nder AKP governance
Annual GDP growth across various timeperiods in Turkey and the Developing World
2) 1960-2000 1970-2000 1981-2000
4.6 3.7
4.3 3.6
4.4 3.3
1991-2000 1960-2011 2002-2011
4.0 4.5 5.3
3.9 4.2
6.6
Turkey Developing World
AKP Governance
1)
1)
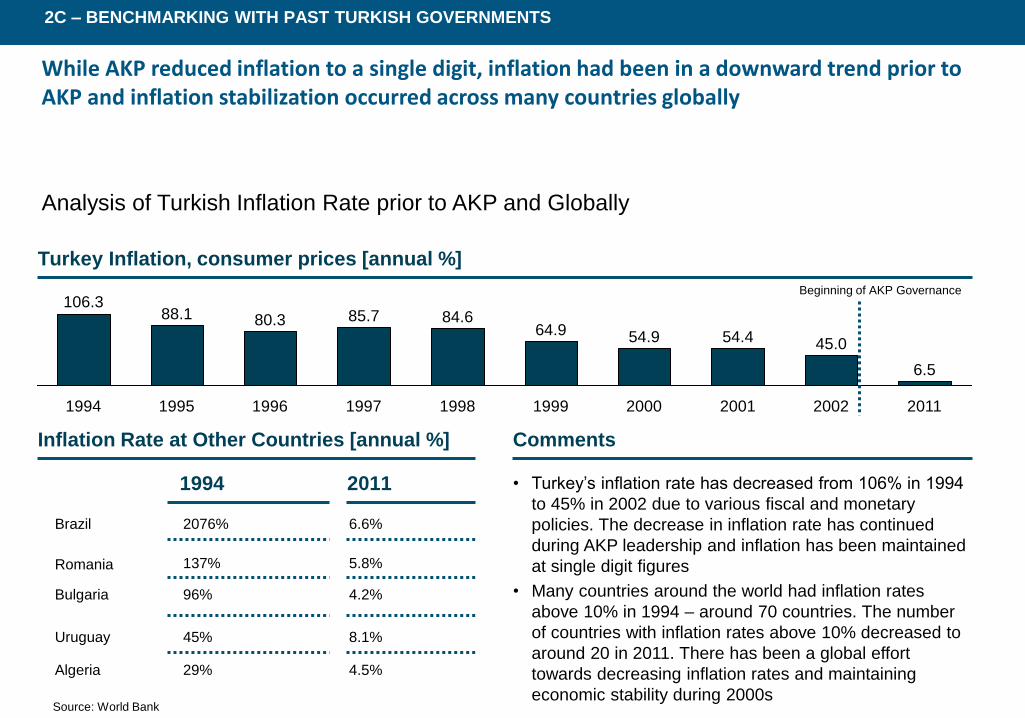
While AKP reduced inflation to a single digit, inflation had been in a downward trend prior to AKP and inflation stabilization occurred across many countries globally
Source: World Bank
2C – BENCHMARKING WITH PAST TURKISH GOVERNMENTS
Turkey Inflation, consumer prices [annual %]
54.4
2000
54.9
1999
64.9
1998
84.6
1997
85.7
1995
80.3
1996
88.1
1994
106.3
2001 2002
45.0
6.5
2011
Beginning of AKP Governance
Inflation Rate at Other Countries [annual %]
• Turkey’s inflation rate has decreased from 106% in 1994
to 45% in 2002 due to various fiscal and monetary
policies. The decrease in inflation rate has continued
during AKP leadership and inflation has been maintained
at single digit figures
• Many countries around the world had inflation rates
above 10% in 1994 – around 70 countries. The number
of countries with inflation rates above 10% decreased to
around 20 in 2011. There has been a global effort
towards decreasing inflation rates and maintaining
economic stability during 2000s
Analysis of Turkish Inflation Rate prior to AKP and Globally
1994 2011
Brazil 2076% 6.6%
Bulgaria 96% 4.2%
Uruguay 45% 8.1%
Romania 137% 5.8%
Algeria 29% 4.5%
Comments

Turkish economy has been the 4th fastest growing economy among the 10 countries selected – growth is lower than developing world average GDP growth
Source: World Bank
3 – GLOBAL BENCHMARKING
GDP Annual Growth at comparable countries, 2002-2011 [%]
3.9
Thailand
4.0
Russia
4.7
Egypt
4.9
Turkey
5.3
India
5.6
Indonesia
8.1
China
10.7
World Developing
World
Brazil South
Africa
3.5 2.4
Mexico
2.7
6.6
3,548 GDP, 2011 [USD bn]
1,047 293 423 163 434 188 945 194 722
Comments
• Asian economies (China, India, Indonesia) have performed better than the Turkish economy in terms of GDP growth. While Turkey’s growth,
between 2002-2011, is above the world GDP growth (as expected), it has not outperformed the developing world GDP growth
• Chinese and Indian economies make up a vast amount of the developing world GDP. Their high GDP growth rates have an impact on the
developing world average GDP growth
Turkey GDP Growth Benchmarking
2)
2) AKP won the elections at the end of 2002 and have been leading the government since
42,568 11,207
1)
1) Methodology to select comparable countries for benchmarking are explained in section 2 of the report

Turkish GDP per capita growth between 2002-2011 ranks 5th among the 10 countries selected
Source: World Bank
3 – GLOBAL BENCHMARKING
GDP Per Capita Growth, based on constant 2000 USD exchange rate, 2002-2011 [%]
2.8
Egypt
3.1
Thailand
3.1
Turkey
3.9
Indonesia
4.5
India
4.9
Russia
6.6
China
10.2
Brazil South
Africa
2.3
1.1
Mexico
1106 /
2640
GDP per Capita, (2002/2011) [USD]
Comments
• Turkey’s GDP per capita increased by 3.9% per annum between 2002 and 2011. It is on par with other developing countries. BRIC (Brazil-
Russia-India-China) have generally performed higher than Turkey while Turkey has perfrormed better than South Africa, Mexico and Thailand
• Turkey GDP per capita was the 2nd highest prior to AKP, in 2002, and was still the 2nd highest in 2011
Turkey GDP per Capita Annual Growth Benchmarking
1)
1) AKP won the elections at the end of 2002 and have been leading the government since
475 /
843
1968 /
3033
816 /
1207
4078 /
5741
2043 /
2699
1508 /
1977
3740 /
4803
3108 /
3825
5703 /
6288
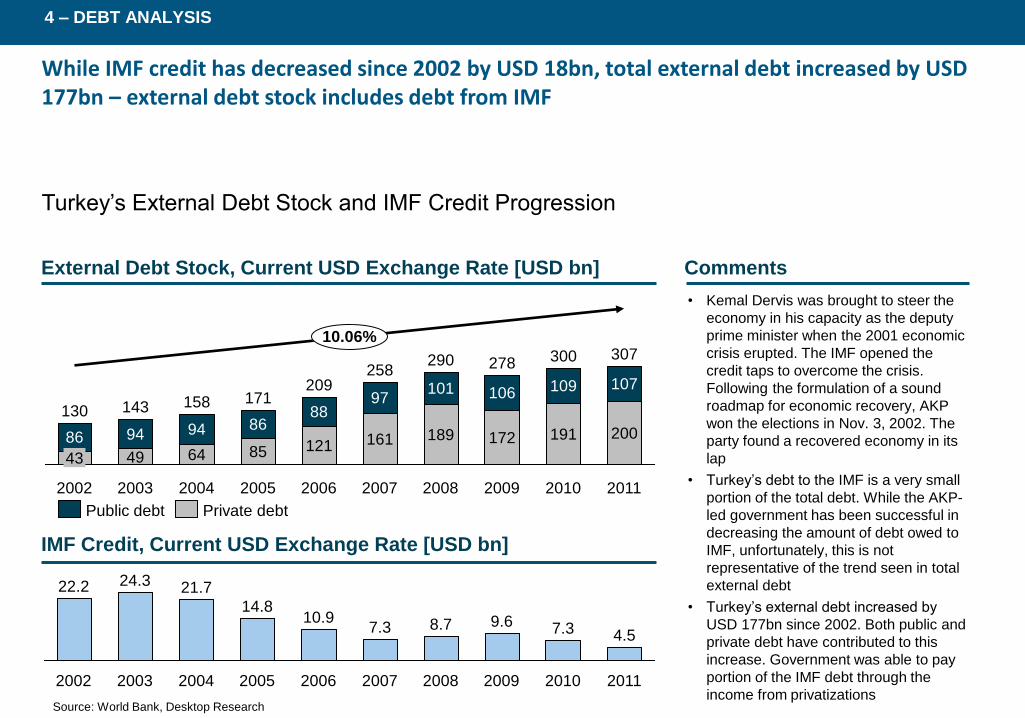
While IMF credit has decreased since 2002 by USD 18bn, total external debt increased by USD 177bn – external debt stock includes debt from IMF
Source: World Bank, Desktop Research
4 – DEBT ANALYSIS
10.06%
2011
307
200
107
2010
300
191
109
2009
278
172
106
2008
290
189
101
2007
258
161
97
2006
209
121
88
2005
171
85
86
2004
158
64
94
2003
143
49
94
2002
130
43
86
2011
4.5
2010
7.3
2009
9.6
2008
8.7
2007
7.3
2006
10.9
2005
14.8
2004
21.7
2003
24.3
2002
22.2
External Debt Stock, Current USD Exchange Rate [USD bn]
IMF Credit, Current USD Exchange Rate [USD bn]
Comments
• Kemal Dervis was brought to steer the
economy in his capacity as the deputy
prime minister when the 2001 economic
crisis erupted. The IMF opened the
credit taps to overcome the crisis.
Following the formulation of a sound
roadmap for economic recovery, AKP
won the elections in Nov. 3, 2002. The
party found a recovered economy in its
lap
• Turkey’s debt to the IMF is a very small
portion of the total debt. While the AKP-
led government has been successful in
decreasing the amount of debt owed to
IMF, unfortunately, this is not
representative of the trend seen in total
external debt
• Turkey’s external debt increased by
USD 177bn since 2002. Both public and
private debt have contributed to this
increase. Government was able to pay
portion of the IMF debt through the
income from privatizations
Turkey’s External Debt Stock and IMF Credit Progression
Private debt Public debt


World Economic Forum (WEF) Global Competitiveness Report has categorized countries into 5 groups – these groups represent various stages of development of a country (1/2)
Source: World Economic Forum, World Bank
Stages of Development Description
Sample List of
countries
Stage 1: Factor Driven Economies in the first stage are mainly factor-driven
and compete based on their factor endowments –
primarily low-skilled labor and natural resources.
Companies compete on the basis of price and sell
basic products or commodities, with their low
productivity reflected in low wages.
India, Kenya, Pakistan,
Ghana, Moldova,
Tajikistan, Vietnam…
Transition from Stage 1 to
Stage 2
Economies in transition from Stage 1 to Stage 2 Egypt, Saudi Arabia, Iran,
Philippines, Venezuela…
Stage 2: Efficiency Driven As a country becomes more competitive, productivity
will increase and wages will rise with advancing
development. Countries will then move into the
efficiency-driven stage of development, when they
must begin to develop more efficient production
processes and increase product quality because
wages have risen and they cannot increase prices
China, Indonesia, South
Africa, Thailand,
Colombia, Peru, Romania,
Ukraine…
Stages of Development
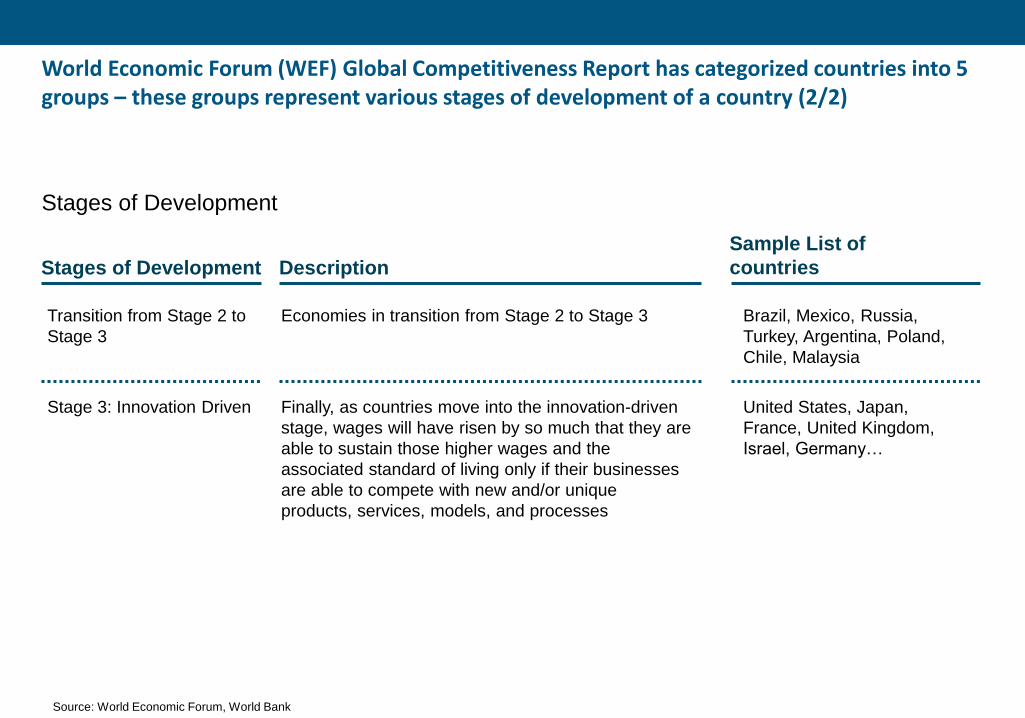
World Economic Forum (WEF) Global Competitiveness Report has categorized countries into 5 groups – these groups represent various stages of development of a country (2/2)
Source: World Economic Forum, World Bank
Stages of Development Description
Sample List of
countries
Transition from Stage 2 to
Stage 3
Economies in transition from Stage 2 to Stage 3 Brazil, Mexico, Russia,
Turkey, Argentina, Poland,
Chile, Malaysia
Stage 3: Innovation Driven Finally, as countries move into the innovation-driven
stage, wages will have risen by so much that they are
able to sustain those higher wages and the
associated standard of living only if their businesses
are able to compete with new and/or unique
products, services, models, and processes
United States, Japan,
France, United Kingdom,
Israel, Germany…
Stages of Development

The first four groups contain all of the developing countries – countries from each group have been selected for this benchmarking - based on size of economy in 2011
Source: World Economic Forum, World Bank
Stage 1 Stage 1 to 2 Stage 2 Stage 2 to 3
1. Brazil
2. Mexico
3. Russia
4. Turkey
5. Argentina
6. Poland
1. China
2. Indonesia
3. South Africa
4. Thailand
5. Colombia
6. Peru
2. Egypt
1. Saudi Arabia1)
3. Iran
4. Venezuela
5. Philippines
6. Algeria
1. India
2. Pakistan
3. Bangladesh
4. Nigeria
5. Vietnam
6. Kenya
Countries within each stage of development (category) has been ranked in terms of GDP. As «Stage 2»
countries are similar to «Stage 2 and 3», 4 countries from each category have been selected for benchmarking
purposes. One country each from «Stage 1» and «Stage 1 to 2» categories have been selected for
benchmarking
1) Saudi Arabia is a unique country in terms of governance and economy, therefore has not been included in the list of comparable countries
Comparable Country Selection