denmark´s convergence programme 2016
TRANSCRIPT

APRIL 2016
DENMARK S CONVERGENCE PROGRAMME 2016


APRIL 2016
DENMARK S CONVERGENCE PROGRAMME 2016


Index 1. Challenges and Economic Framework towards 2020 ............................................ 7 1.1 The macroeconomic scenario towards 2020 .................................................. 8 1.2 Limited fiscal space towards 2020 ................................................................. 13 2. Macroeconomic Scenario towards 2020 ................................................................ 23 2.1 Danish Economic Outlook for 2016 and 2017 ................................................ 24 2.2 Assumptions for the international economy and financial conditions ............. 27 2.3 Growth and employment towards 2020 .......................................................... 30 2.4 Housing prices and macroeconomic balances ............................................... 35 Appendix 2.1 Key figures for the Danish economy 2014-2020 .............................. 39 3 Budget Balance and Public Debt towards 2020 ..................................................... 41 3.1 The budget balance ........................................................................................ 42 3.2 Structural budget balance ............................................................................... 45 3.3 Public consumption, investment and fiscal space .......................................... 50 3.4 Public expenditures and revenues ................................................................. 54 3.5 Public debt ...................................................................................................... 60 Appendix 3.1 One-off factors in 2013-20 ................................................................ 62 4. Sensitivity Analysis and Comparison with CP15 .................................................... 65 4.1 Sensitivity analysis .......................................................................................... 65 4.2 Comparison with Convergence Programme 2015 ......................................... 69 5. Long-Term Projection and Fiscal Sustainability ..................................................... 73 5.1 Development beyond 2020 ............................................................................. 74 5.2 Changes in structural budget balance in 2020 and fiscal sustainability ......... 78 6. Public finances and Institutional Framework .......................................................... 83 6.1 Institutional framework .................................................................................... 83 6.2 The Budget Law and improved expenditure control ....................................... 85 Annex tables .................................................................................................................. 89

Kapitel 1
[Publikationens titel] · [måned, år] 1

Chapter 1
Denmark’s Convergence Programme 2016 · April 2016 7
1. Challenges and Economic Framework towards 2020 Nyt kapitel
The Danish economy is improving, although GDP growth has been moderate. The improve-ment is most evident in the labour market where private sector employment has increased by more than 80,000 persons since the end of 2012. In the coming years, employment is pro-jected to continue growing, and fewer idle resources are expected in the economy.
The robust employment growth is primarily made possible by reforms which increase labour supply and strengthen the growth potential in coming years. However, the basis for growth in the Danish economy is dampened by continued low productivity growth. On average, the GDP growth is expected to be approx. 1¾ per cent per annum in the period 2016-20.
With decreasing unemployment and a continued expansionary monetary policy, a gradual tightening of fiscal policy is planned but from an accommodative starting point. This contrib-utes to counteract the risks of a new heating of the economy. It also contributes to making progress in public finances towards the goal of balance between revenues and expenditures in 2020, which is aligned with the overall objective of fiscal sustainability.
In the coming years, the fiscal room for manoeuvre will be limited in absence of new measures. Falling oil prices reduce the expected fiscal space. The total fiscal space for new initiatives in the years 2017 to 2020 has been revised downwards from approx. DKK 15 bn. to approx. DKK 10 bn. since the former 2020 projection from September 2015. A fiscal space of approx. DKK 10 bn. over a four year period is limited in a historical perspec-tive and also relative to population trends. This should in particular be seen in light of the inflow of refugees which increases the underlying pressure on public services. The increased expenditure pressure must be met within the given fiscal space. In order to promote employment integration efforts, the government has reached agreements with the municipalities and the social partners in order to support the ambition of government that one out of two refugees should be employed after three years. In the absence of new initiatives, the room for manoeuvre in fiscal policy should cover the overall priorities for both tax cuts and expenditure growth in high-priority areas. The limited fiscal space increases the need for careful priorities in expenditure policy and ongoing productivity improvements in the public sector. The fiscal space also requires that the high level of public investment is normalized as assumed towards 2020. The medium-term public investment profile includes, among others, investments agreed upon in connection with Tog-fonden DK, which was established in 2013. Since then, oil prices have fallen markedly. The government will publish a new medium-term plan for the Danish economy this summer. The plan will provide the framework for fiscal policy towards 2025. In Denmark the medium-term plans are an important tool to address future economic policy challenges.

Chapter 1 Challenges and Economic Framework towards 2020
Denmark’s Convergence Programme 2016 · April 2016
8
1.1 The macroeconomic scenario towards 2020 The Danish economy is improving, although GDP growth has been moderate. Progress is most evident in the labour market where employment in the private sector has increased by more than 80,000 persons since the end of 2012. In the same period, unemployment has decreased by more than 40,000 persons. The improvement has been driven by the private sector. The difference between developments in GDP and employment, respectively, is partly due to weak productivity in the service sector, as well as the low employment content in North Sea production and maritime transport, where activity has declined recently.
In the coming years continued growth is expected. GDP growth is projected at 1.1 per cent in 2016 and 1.7 per cent in 2017 following 1.2 per cent in 2015, cf. figure 1.1. The GDP growth forecast has been revised downward compared to the outlook in the Economic Survey, De-cember 2015. The revision mainly reflects that exports in the second half of 2015 were weak-er than estimated and that slower growth in the global economy is expected.
The projections should not be considered as a new complete forecast but more as adjust-ments to the December forecast resulting from new information, cf. chapter 2. Despite lower GDP growth in 2015 and the following years than estimated in December, employment is still expected to increase and unemployment to decrease.
Towards 2020, employment is expected to grow at approximately the same rate as in the past three years. Employment and output gaps are assumed to be closed gradually towards 2019, cf. figure 1.2.
Growth is increasingly driven by domestic demand which is also expected to be the case until 2020. Among other things, this reflects that Danish households and companies have consoli-dated their balance sheets after the crisis, which has created room for growth in private con-sumption and investment. The labour market improvement together with rising house prices, low interest rates and increases in real wages strengthens the households’ economy.

Chapter 1 Challenges and Economic Framework towards 2020
Denmark’s Convergence Programme 2016 · April 2016 9
Given the expected growth in the Danish economy and a continued expansionary monetary policy, a gradual tightening of fiscal policy is planned but from an accommodative starting point. This contributes to support a sustainable recovery, dampening the risks of a new heat-ing of the economy.
The expectation of robust employment growth namely reflects the implemented structural reforms – particularly the agreed retirement reform from 2011 – which strengthen the growth potential in coming years. The bulk of reforms contribute to an estimated increase in total employment amounting to 150,000 persons from 2015 to 2020, primarily in the private sector, cf. figure 1.3. The reforms support that the significant increase in employment can be realized without widespread shortages of labour supply, which otherwise would lead to unsustainable wage and price inflation pressures. On the absence of the agreed reforms, further increases in employment would not have been sustainable.
Figure 1.1
Increasing GDP growth in the coming years
Figure 1.2
Output gap narrows towards 2019
Source: Statistics Denmark and own calculations.
-0.5
0.0
0.5
1.0
1.5
2.0
2.5
3.0
-0.5
0.0
0.5
1.0
1.5
2.0
2.5
3.0
10 11 12 13 14 15 16 17 18-20
Per cent Per cent
-4
-3
-2
-1
0
1
2
3
4
-4
-3
-2
-1
0
1
2
3
4
00 02 04 06 08 10 12 14 16 18 20
Per cent Per cent

Chapter 1 Challenges and Economic Framework towards 2020
Denmark’s Convergence Programme 2016 · April 2016
10
The increase in labour supply due to the agreed reforms contributes significantly to increas-ing the growth potential towards 2020. However, in a historical perspective the future growth potential is not high, and a significant slowdown is expected after 2022, where contribution tor growth from the implemented reforms abates, cf. figure 1.4. Furthermore, the Danish produc-tivity growth has been low for several years – both compared with previous periods and in an international context, cf. figure 1.5.
Figure 1.3
Increase in employment towards 2020
Figure 1.4
Moderate growth potential
Note: In figure 1.3 employment is incl. persons on leave. In figure 1.4 the contribution from productivity is calculated as a residual, i.e. changes in potential GDP that can not be explained by increasing structural employment (measured in hours).
Source: Statistics Denmark and own calculations.
2,500
2,600
2,700
2,800
2,900
3,000
2,500
2,600
2,700
2,800
2,900
3,000
00 02 04 06 08 10 12 14 16 18 20
Actual employment Structural employment
Struc. emp. without reforms
Development without reform effects
1,000 persons 1,000 persons
0.0
0.5
1.0
1.5
2.0
2.5
3.0
0.0
0.5
1.0
1.5
2.0
2.5
3.0
1990-2000 2001-15 2016-20 2021-22 2023-25
Contribution from employment Contribution from productivity
Per cent Per cent

Chapter 1 Challenges and Economic Framework towards 2020
Denmark’s Convergence Programme 2016 · April 2016 11
It is an important objective to strengthen the basis for future growth. This requires an eco-nomic policy that focuses both on adjustments, which can contribute to increasing private sector employment, and specific measures inducing better conditions for companies in order to boost productivity. However, it should be noticed that the terms of trade improvements and rising income from abroad have contributed to a major increase in the level of wealth in Denmark which is not captured by GDP, cf. box 1.1.
Figure 1.5
Productivity growth across OECD countries, 1995-2015
Note: Productivity growth is calculated as GDP per hours worked. Source: OECD.
0
1
2
3
4
5
0
1
2
3
4
5
ITA
ES
P
DK
ME
X
NO
R
BE
L
NZ
L
GR
C
NL
D
PR
T
CH
E
CA
N
DE
U
FR
A
AU
T
UK
ISR
JPN
FIN
AU
S
SW
E
US
A
TU
R
ISL
HU
N
CZ
E
IRL
PO
L
KO
R
Per cent Per cent

Chapter 1 Challenges and Economic Framework towards 2020
Denmark’s Convergence Programme 2016 · April 2016
12
Box 1.1
GDP growth and wealth developments in selected countries, 2005-2014
In the last 10 years GDP growth in Denmark has been modest compared to several neighboring countries
and the United States, cf. figure a. This is also true when GDP is calculated per capita, although the
difference compared to countries such as Sweden and the UK is smaller than if measured by the overall
GDP growth, cf. figure a. The modest GDP growth per capita in Denmark can lead to the impression that
Denmark in terms of wealth has fallen behind neighboring countries and the United States. However, this is
not unambiguously the case.
Wealth developments depend not only on GDP growth per capita measured in volumes. Terms of trade
changes imply that the value of exported goods and services is changing relatively to the value of imported
goods and services. Improved terms of trade leads to increasing purchasing power and wealth. Similarly,
wealth can be increased by an increase in net capital income from abroad. The wealth developments across
countries can be compared using GNI per capita figures, which are adjusted for differences in price levels
across countries (so-called PPP-correction). This measure of wealth includes in addition to GDP per capita
also changes in the terms of trade and net capital income from abroad. Thus, despite moderate GDP growth
per capita over the last 10 years, Denmark has had an increase in wealth as measured by PPP-corrected
GNI per capita which is higher than in a number of some neighbouring countries and the United States –
even though there are differences in the levels, cf. figure b. Real wage growth in Denmark of approx. 1 per
cent per annum has also been higher than in a number of neighbouring countries and the United States dur-
ing the period considered, although real wages has grown slower than in Sweden.
The contribution from higher net capital income from abroad both reflects that Denmark’s net external assets
has switched from a foreign debt in 2004 to foreign assets of approx. 45 per cent of GDP in 2014, and that
the return on Danish assets abroad has been higher than interest payments and returns on the liabilities
abroad. The terms of trade improvement is primarily due to a favourable development in export prices for
Danish export companies, while import price developments have been approximately similar across coun-
tries. This namely reflects the composition of Danish exports, which has a significant content of medicine,
food and machines which have had positive price developments in the period.
Figure a
GDP growth in volumes, 2005-2014
Figure b
Wealth per capita, 2004-2014
Note: In figure b growth in wealth per capita is calculated as GNI growth per capita measured in current prices and PPP-corrected.
Source: Statistics Denmark, OECD and own calculations.
DK DEU SWE FIN UK USA-1.0
-0.5
0.0
0.5
1.0
1.5
2.0
-1.0
-0.5
0.0
0.5
1.0
1.5
2.0
GDP GDP per capita
Per cent Per cent
30
35
40
45
50
55
60
30
35
40
45
50
55
60
04 05 06 07 08 09 10 11 12 13 14
Denmark Germany Sweden
Finland UK USA
USD 1,000 USD 1,000

Chapter 1 Challenges and Economic Framework towards 2020
Denmark’s Convergence Programme 2016 · April 2016 13
1.2 Limited fiscal space towards 2020 Fiscal policy is planned within the framework of the Danish Budget Law, the medium-term 2020-plan and the Stability and Growth Pact. This framework ensures credibility with respect to sound and responsible fiscal policy characterized by a moderate level of public debt. This contributes to a high degree of confidence in the Danish economy and low risk premiums on Danish government bonds.
According to the Danish Budget Law fiscal policy each year has to be planned in order to comply with a structural budget deficit limit of maximally 0.5 per cent of GDP and the adopted expenditure ceilings. The budget bill for 2016 included a consolidation of public finances amounting to DKK 5 bn. in order to ensure a margin to the Budget Law structural deficit limit.
Based on the planned fiscal policy for 2016 etc., the structural budget deficit is estimated at 0.4 per cent of GDP in 2016. For the years towards 2020, the budget deficit is planned to be gradually reduced in order to reach the structural balance target in 2020, cf. figure 1.6.
The assumed cyclical normalization and the consolidation of the structural balance imply that towards 2020 the actual budget deficit will show an increasing margin to the 3 per cent of GDP limit of the Stability and Growth Pact.
The improvement of the structural balance from 2016 to 2020 includes a fiscal room for ma-noeuvre amounting to DKK 10 bn. This is a substantial downward revision of the fiscal space compared to the former medium-term projection from September 2015 where the fiscal room for manoeuvre was calculated at approx. DKK 15½ bn. from 2016 to 2020, cf. figure 1.7 and box 3.2 in Chapter 3. The fiscal space is calculated relative to a scenario with zero real growth in public consumption expenditures.
Figure 1.6
Actual and structural balance progressing
towards balance target in 2020
Figure 1.7
Reduced fiscal space towards 2020
Note: In figure 1.6 fiscal space is based on the technical potential public consumption growth (excl. imputed depreciation) in 2017-2020.
Source: Statistics Denmark, Updated 2020-projection, September 2015 and own calculations.
-4
-3
-2
-1
0
1
2
-4
-3
-2
-1
0
1
2
10 11 12 13 14 15 16 17 18 19 20
Actual balance Structural balance
Per cent of GDP Per cent of GDP
0
5
10
15
20
0
5
10
15
20
Updated 2020-projection,September 2015
Convergence Programme2016
DKK 15½ bn.
DKK 10 bn.
DKK bn. DKK bn.

Chapter 1 Challenges and Economic Framework towards 2020
Denmark’s Convergence Programme 2016 · April 2016
14
The downward revision of the fiscal space should primarily be seen in the light of the de-crease in oil prices which ceteris paribus reduces the expected public revenues from oil and gas activities in the North Sea both presently and in the coming years, cf. box 1.2.
Box 1.2
Low oil price reduces expected public revenues and reduces the fiscal space
In recent years the expected revenues from oil and gas activities in the North Sea has been affected signifi-
cantly by oil price developments. Since Denmark's Convergence Programme 2013 (CP13) which formed
the basis for the determination of the original expenditure ceilings for 2014-17, the expected oil price in
2020 has been halved, cf. figure a. This reflects a substantial decline in oil prices in the second half of 2014
and a further decline in the autumn of 2015.
In CP13 an oil price of USD 148 was assumed in 2020. Before the decline in oil prices in the second half of
2015, an oil price of approx. USD 106 was assumed in Denmark’s Convergence Programme 2015 (CP15;
from April 2014). Since then the oil price assumption for 2020 has been gradually revised down from ap-
prox. USD 100 in the medium-term projection from September 2012 to currently approx. USD 72. The latest
downward revision reflects, among other things, that the International Energy Agency has revised its fore-
cast for the long-term oil price significantly in the latest projection from November 2015.
The revised oil price assumption implies that the estimated North Sea revenue I 2020 has been reduced to
approx. 0.15 per cent of GDP, cf. figure b. The lower North Sea revenues weakens the structural budget
balance and thus the fiscal space by approx. ¼ per cent of GDP in 2020 compared to the medium-term pro-
jection from September 2015. This corresponds to approx. DKK 5 bn. The weakening is large compared to
CP13 and CP15, respectively. North Sea revenues have in total been revised downwards by approx. DKK
19 bn. since CP13 – and by approx. DKK 8½ bn. since CP15.

Chapter 1 Challenges and Economic Framework towards 2020
Denmark’s Convergence Programme 2016 · April 2016 15
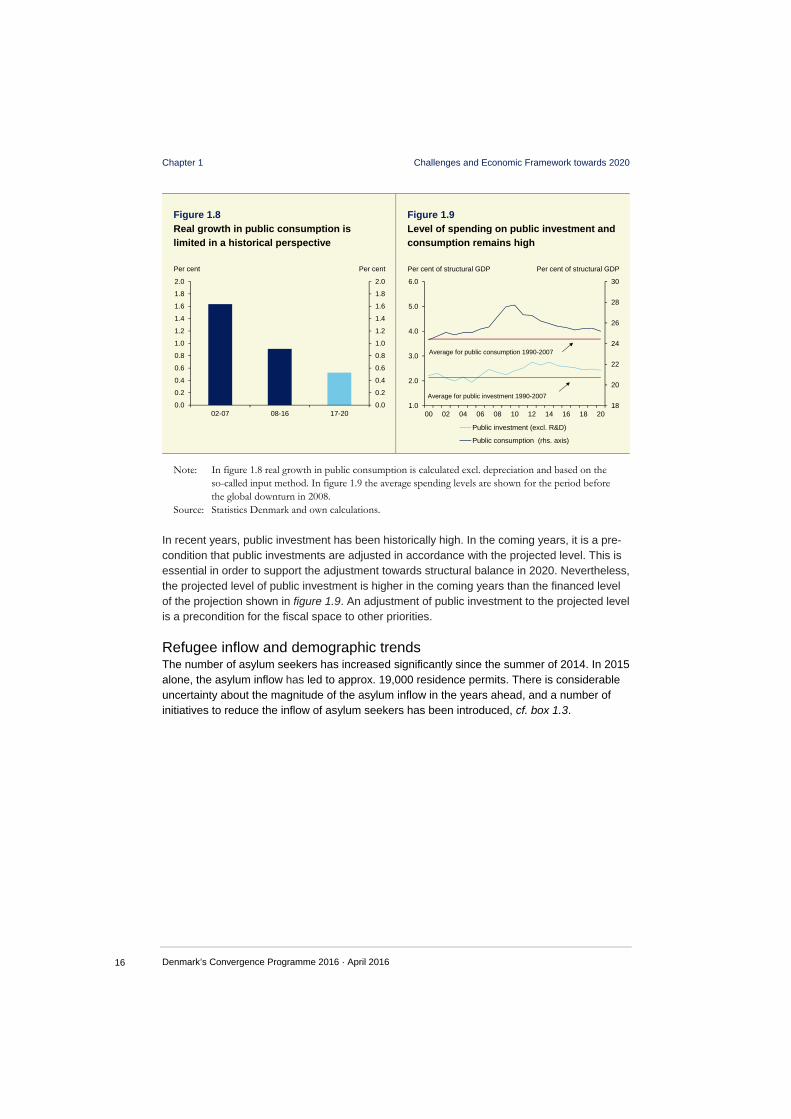
A fiscal room for manoeuvre of DKK 10 bn. over four years is limited in a historical perspec-tive. This is especially the case given a growing population – partly as a result of the large inflow of refugees, cf. below. In the absence of new measures and reforms, the fiscal space must cover the overall priorities for both tax cuts and growth in high-priority expenditure areas and furthermore finance unforeseen additional expenses etc. which may arise in the future. The specific use of the fiscal space will reflect political priorities. Technically in the medium-term projection, the fiscal space is included as public consumption – corresponding to an average real growth of 0.5 per cent per annum for the period 2017 to 2020, cf. figure 1.8. This real growth rate for public consumption in low by historical standards. At the same time, the demographic pressure on public services is estimated at 0.8 per cent per annum in the same period, cf. also chapter 3. The limited fiscal room for manoeuvre increases the need to make priorities and streamline public tasks. Despite a limited potential rate of growth in public consumption in the coming years, the level of public consumption remains high, cf. figure 1.9. Total public consumption is estimated at approx. DKK 530 bn. in 2016. Thus, the challenge namely is to use total ex-penditures as efficiently and effectively as possible.
Box 1.2 (continued)
Low oil price reduces the expected public revenues and reduces the fiscal space
Given projected North Sea revenues of only 0.15 per cent of GDP in 2020 (corresponding to approx. 3 bn.),
the downside risk for the fiscal space by an even further decline in oil prices is limited, cf. also Lavere
oliepriser reducerer det finanspolitiske råderum only available in Danish at www.fm.dk.
Figure a
Expectations for oil prices is downgraded …
Figure b
… which reduces the expected proceeds
from the North Sea by 2020
Note: From KP15 and onwards the oil price assumptionsare based both on the recent developments in market expectations for oil prices and relevant information about the expected supply and price developments in the longer term from the International Energy Agency (IEA) long-term prognosis.
Source: Denmark’s Convergence Programme 2013-2015, Updated 2020-forecast , September 2015.
0
20
40
60
80
100
120
140
160
0
20
40
60
80
100
120
140
160
10 11 12 13 14 15 16 17 18 19 20
CP13 CP14 CP15 September 2015 CP16
USD per barrel USD per barrel
0.0
0.2
0.4
0.6
0.8
1.0
1.2
0.0
0.2
0.4
0.6
0.8
1.0
1.2
CP13 CP14 CP15 September2015
CP16
Per cent of GDP Per cent of GDP
Chapter 1 Challenges and Economic Framework towards 2020
Denmark’s Convergence Programme 2016 · April 2016
16
In recent years, public investment has been historically high. In the coming years, it is a pre-condition that public investments are adjusted in accordance with the projected level. This is essential in order to support the adjustment towards structural balance in 2020. Nevertheless, the projected level of public investment is higher in the coming years than the financed level of the projection shown in figure 1.9. An adjustment of public investment to the projected level is a precondition for the fiscal space to other priorities.
Refugee inflow and demographic trends The number of asylum seekers has increased significantly since the summer of 2014. In 2015 alone, the asylum inflow has led to approx. 19,000 residence permits. There is considerable uncertainty about the magnitude of the asylum inflow in the years ahead, and a number of initiatives to reduce the inflow of asylum seekers has been introduced, cf. box 1.3.
Figure 1.8
Real growth in public consumption is
limited in a historical perspective
Figure 1.9
Level of spending on public investment and
consumption remains high
Note: In figure 1.8 real growth in public consumption is calculated excl. depreciation and based on the so-called input method. In figure 1.9 the average spending levels are shown for the period before the global downturn in 2008.
Source: Statistics Denmark and own calculations.
0.0
0.2
0.4
0.6
0.8
1.0
1.2
1.4
1.6
1.8
2.0
0.0
0.2
0.4
0.6
0.8
1.0
1.2
1.4
1.6
1.8
2.0
02-07 08-16 17-20
Per cent Per cent
18
20
22
24
26
28
30
1.0
2.0
3.0
4.0
5.0
6.0
00 02 04 06 08 10 12 14 16 18 20
Public investment (excl. R&D)
Public consumption (rhs. axis)
Average for public investment 1990-2007
Average for public consumption 1990-2007
Per cent of structural GDP Per cent of structural GDP

Chapter 1 Challenges and Economic Framework towards 2020
Denmark’s Convergence Programme 2016 · April 2016 17
If the inflow remains at a high level in the coming years, this will lead to a substantial increase in the population by 2020. Under the current assumptions, the population increases by almost 100,000 persons in 2020, or nearly 2 per cent, compared to the population projection from May 2015, cf. figure 1.10. For the projection in the current convergence programme, an ad-justed population projection has been prepared by DREAM, in which the number of non-Western immigrants have been adjusted in order to match the assumptions underlying the budget bill for 2016.1 The upward adjustment includes the budget bill assumptions regarding the number of residence permits for refugees and family reunification for refugees in the period from 2015 to 2019.
Newly arrived refugees put pressure on public finances through increased asylum and inte-gration expenditures, e.g. for accommodation and income transfers. The increased costs can partly be offset as part of the newly arrived refugees eventually will get a job. However, the experience in recent years concerning the newly arrived refugees and reunited family mem-bers of refugees is that only about 30 per cent of them are in employment after three years in
1 In the adjusted population projection additional immigration relative to the number of refugees and family reunited members of refugees has been included on top of the immigration already included in the population projection from May 2015.
Box 1.3
Initiatives regarding asylum seekers and migrants
In light of the extraordinary inflow of refugees and migrants to a number of European countries, including
Denmark, legislation has been adopted to make it less attractive to seek asylum in Denmark.
Specifically, this includes the following initiatives:
Introduction of integration allowance for resident and newly arrived refugees.
Limiting the duration of temporary residence permits for refugees to two years for refugees with
convention status and to one year for refugees with protection status.
Postponement of the right to family reunification for refugees with temporary protection status to three
years.
Tightening of access to permanent residency.
Tightening the rules concerning withdrawal of refugees residence permits etc.
Fee payments, such that fees on family reunification are reintroduced, and fee payment for application
for permanent residence for refugees etc. is introduced.
Increased own payment for asylum seekers in Denmark.
Reduction of economic allowances to asylum seekers by 10 per cent.
Rollback on the extraordinary asylum counselling.
Abolishment of the ability for asylum seekers to be accommodated in separate and special housing
outside the asylym centers etc.
Reintroduction of "the integration potential criteria" in selection of quota refugees.
Abolishment of public payment for transport of reunited family members to resident refugees.
Denmark has received a relatively large number of refugees relative to its size, when compared with a
number of European countries. As part of the bipartite and tripartite agreements with Local Government
Denmark (KL) and the social partners, respectively, the central government has created the framework for
a better integration of the refugees who are getting residence in Denmark.

Chapter 1 Challenges and Economic Framework towards 2020
Denmark’s Convergence Programme 2016 · April 2016
18
Denmark. This is significantly lower than for non-Western immigrants as a whole, where the employment rate is approx. 50 per cent, cf. figure 1.11.
With the current assumptions regarding inter alia the employment rate, the tax payments stemming from those of the newly arrived who are assumed to get a job, more or less offset the expected cost of integration allowances etc. for those who are not assumed to be em-ployed2, cf. also Den øgede flygtningetilstrømning lægger pres på de offentlige finanser only available in Danish at www.fm.dk. Thus, seen in isolation the funding for public services and investment is roughly left unchanged towards 2020.
However, the increase in the population will increase the pressure on public service spend-ing. Thus, the isolated effect of the refugee inflow is an increase in the underlying pressure on public services. The so-called demographic pressure on public consumption which is a technical measure for the spending pressure on public services due to population develop-ments has been revised up from 0.5 per cent to 0.8 per cent per annum in the period 2016-20203, cf. figure 1.10.
In light of the challenge concerning the inflow of refugees, the government has reached a bipartite agreement (March 2016) with Local Government Denmark (KL) in order to ensure that municipalities have the right, flexible framework to receive and integrate the large num-
2 The calculation of the impact on public finances is sensitive to the assumed asylum inflow in the coming years and may be revised when assumptions about immigration are updated. In addition, the effect on public finances depends on the underlying assumptions, including assumptions about employment rates and wage income for persons in employment. 3 The calculation of the demographic pressure is mechanical and should generally be interpreted with caution. Thus, the demographic pressure is included as one of several inputs forming the basis for expenditure policy.
Figure 1.10
Greater expected increase in population and
increased underlying spending pressures
Figure 1.11 The employment rate is low for refugees
Note: In figure 11.1 the employment rate for non-Western immigrants and persons of Danish origin is calculated for the total group (and not by the time of residence). The employment rate is shown for the 15-64 year old and calculated as an average for the period 2010-2013.
Source: DREAM, Statistics Denmark and own calculations.
0.0
0.1
0.2
0.3
0.4
0.5
0.6
0.7
0.8
0.9
0
50
100
150
200
250
300
Population growth Demographic trends (rhs.axis)
Population projection, May 2015
Adjusted population projection, April 2016
0.8 per cent
0.5 per centApprox.150,000 persons
Approx. 247,000 persons
1,000 persons Per cent
0
10
20
30
40
50
60
70
80
0
10
20
30
40
50
60
70
80
Refugees and unitedfamilies of refugees
(after 3 years)
Non-westernimmigrants
People of Danishdescent
Per cent Per cent

Chapter 1 Challenges and Economic Framework towards 2020
Denmark’s Convergence Programme 2016 · April 2016 19
ber of refugees. The agreement includes a number of initiatives, which relax the requirements for the municipalities with respect to integration. At the same time, the possibilities of the municipalities for residential placing of refugees are strengthened, and the municipalities will be granted central government financial support for the establishment of temporary accom-modation as well as new, small public housing.
Public finances will improve substantially if refugees to a larger extent are able support them-selves. In order to promote employment targeted integration, the government has as part of the bipartite and tripartite agreements with the municipalities and the social partners, respec-tively, created the framework for future efforts. The initiatives also support the ambition of government’s that one out two newcomer refugees should be employed after three years. A realization of this ambition is estimated to improve public finances by DKK 2½ bn. in 2020.
Pressure on public finances after 2020 The medium-term planning horizon for fiscal policy is currently 2020. In the scenario after 2020, the projection in the convergence programme is based on technical principles with respect to public expenditures and revenues, being used in order to assess whether fiscal policy is sustainable in the longer-term. This means whether economic policy can remain unchanged after 2020, without leading to an unsustainable increase in public debt.
For a period from approx. 2030 to 2060 the technical projection entails substantial budget deficits, which exceed the Budget Law limit, cf. figure 1.12. These deficits reflect the gradual increase in the number of elderly and a lower share of the population in employment after 2020-2025 and towards 2040, cf. figure 1.13. The pressure on public finances in this period partly reflects that life expectancy has increased compared to when the indexation of the pension age was adopted. Thus, the indexation of the state pension age is first expected to catch up with life expectancy developments after the middle of the current century.
Given an unchanged tax burden, demographic developments imply increasing budget deficits for a long period, if expenditure standards are kept unchanged compared to the general development in incomes.4 Furthermore, the demographic developments and a diminishing contribution to employment growth stemming from reforms also imply together with continued low productivity growth that the growth potential of the Danish economy will abate to approx. 1-1¼ per cent per annum for several years after 2020.
In the longer-term public finances are recovering – especially as a result of the indexation of retirement ages. Uncertainty connected the projections of the budget balance is increasing the longer the time horizon. The recovery of public finances requires that the retirement age is increased every fifth year for the rest of the century. This implies a gradually shorter retire-ment period towards the middle of the century compared to the generations retiring currently and in the next few decades.
The period characterized by large technically calculated budget deficits is also known as the "hammock challenge". In practice, tax and expenditure policies should be planned according
4 Calculated by technical principles, which inter alia imply that the number of users of public services grow ac-cording to demographics, and that nominal cost per user keeps pace with the general wage development.

Chapter 1 Challenges and Economic Framework towards 2020
Denmark’s Convergence Programme 2016 · April 2016
20
to what is affordable within a responsible fiscal framework, i.e. inter alia within the framework of the Danish Budget Law and EU's Stability and Growth Pact.
Besides the long-term sustainability requirement, fiscal policy in accordance with the Budget Law is also subject to an annual budget deficit constraint. This reflects the need for ongoing credibility concerning fiscal policy management. At the same time, a near-to-balance struc-tural budget entails room for manoeuvre in fiscal policy, which can come into effect in case of an economic downturn.
Moderate public debt and compliance with the fiscal framework are key elements in support-ing the continued high confidence in the Danish economy which results in low interest rates. High confidence in fiscal policy is particularly important in a small country like Denmark with a fixed exchange rate policy and furthermore being highly interest rate sensitive. Under normal cyclical conditions, the aim should in general be a balanced budget.
The government has announced that a 2025-plan for the Danish economy will be published this summer. Thus, the planning horizon will be extended to 2025, and economic policy tar-gets and ambitions will be set in order to address the future challenges of the Danish econo-my. This applies to the challenges connected to strengthen the basis for economic growth and when it comes to handling the expected pressure on public finances in the coming years. As part of the 2025-plan, a proposal for phase two of the JobReform will be presented. The first phase was launched in 2015. The government's overall goal is to make-work-pay better. Historically the medium-term plans have been central when planning a sound economic policy which in good time addresses future challenges.
Figure 1.12
Technically calculated deficits exceed the
Budget Law limit for a long period
Figure 1.13
Share of population in employment is
declining after 2020 without new reforms
Note: In figure 1.12 the development is based on the share of full-time employed relative to the
population. Source: Own calculations.
-2.0
-1.5
-1.0
-0.5
0.0
0.5
1.0
-2.0
-1.5
-1.0
-0.5
0.0
0.5
1.0
2015 2025 2035 2045 2055
Danish Budget Law deficit limit
Per cent of GDP Per cent of GDP
43.0
43.5
44.0
44.5
45.0
45.5
43.0
43.5
44.0
44.5
45.0
45.5
2015 2020 2025 2030 2035 2040
Inflow of refugees
Reforms
Demographic headwind
Per cent Per cent


Kapitel 1
[Publikationens titel] · [måned, år] 1

Chapter 2
Denmark’s Convergence Programme 2016 · April 2016 23
2. Macroeconomic Scenario towards 2020 Nyt kapitel
Economic activity has been increasing in Denmark since 2013. Economic progress is most visible in the labour market, with private sector employment growing steadily despite more muted GDP growth. Although the second half of 2015 was weaker than what was expected in Economic Survey, December 2015, the conditions for continued progress in the Danish economy are still in place. International economic growth is expected to continue, and do-mestic demand, in particular private consumption, is increasingly contributing to GDP growth.
Danish households and companies have made economic adjustments in wake of the crisis, which has created room for growth in private consumption and investment. At the same time, the economic situation of households has been strengthened by improved labour market conditions, low interest rates, increasing housing prices and real wage increases. Thus, continued economic expansion is expected, with GDP growth amounting to 1.1 per cent in 2016 and 1.7 per cent in 2017. Increasing economic activity is expected to lead to continued increases in private sector employment, as well as a moderate drop in unemployment, which is already at a low level in a historical perspective.
The starting point for the projection is Economic Survey, December 2015, which has been adjusted to incorporate new information. Notably, GDP growth in 2015 was somewhat weak-er than expected due to a weak second half of 2015. In combination with somewhat lower international economic growth this has led to a significant lowering of projected GDP growth for 2016 compared with the December estimate. However, the projections for labour market developments have only been adjusted marginally.
The price of crude oil has fallen further since the end of November 2015, when the December estimates were finalised. The drop in oil prices is due to strongly increasing stocks of oil as well as the outlook for continued high oil supply, among other things due to the removal of sanctions against Iran. At the same time long-term interest rates have fallen as a consequence of the prospects of very gradual increases in monetary policy interest rates in the U.S., and additional monetary stimulus in the euro area. Interest rates are expected to remain at low levels towards 2020, which will support continued increases in investment and housing prices.
The projection for the years from 2018 to 2020 is based on an overall assumption of cyclical improvement leading to a closing of the output gap by 2019. Employment could grow by up to 140,000 persons from 2015 to 2020, of which more than 90,000 persons reflect an increase in structural of employment primarily due to the bulk of reforms that have been implemented in Denmark since 2006. Moreover the increased inflow of asylum seekers etc. since 2014 implies an upward adjustment of the population projection towards 2020 amounting to almost 100,000 persons. Annual GDP growth of approximately 2 per cent is expected in 2018-20.

Chapter 2 Macroeconomic Scenario towards 2020
Denmark’s Convergence Programme 2016 · April 2016
24
2.1 Danish Economic Outlook for 2016 and 2017 The Danish economy has expanded over the last two years, albeit not strongly, and activity in the second half of 2015 was weaker than expected in Economic Survey, December 2015, cf. figure 2.1. Economic progress is especially evident in the labour market, with an increase in private sector employment of 82,000 persons (4¼ per cent) since the end of 2012, cf. figure 2.2. The differences in the trajectories for GDP and employment is among other things due to low productivity growth in the service sector, and the low employment input in North Sea oil production and merchant shipping, which has both been characterized by declining activity recently. Unemployment has decreased by 50,000 persons since the peak in mid-2012.
The conditions for continued economic expansion in Denmark are still present. In spite of increasing uncertainty in the beginning of 2016, global economic activity is expanding and domestic demand, especially private consumption, is again contributing to growth. Thus, progress in economic activity expected to continue at growth rates of 1.1 per cent in 2016 and 1.7 per cent in 2017. The higher economic activity is estimated to lead to an increase in private sector employment of more than 50,000 persons from 2015 to 2017 (i.e. 2.6 per cent).
Figure 2.1
Economic progress since spring 2013
Figure 2.2
Increased employment in the private sector
Note: Figure 2.2 shows employment incl. persons on leave. The dark blue horizontal lines indicate ex-pected annual averages.
Source: Statistics Denmark and own calculations.
The starting point for the projections is the assessment from the basically Economic Survey, December 2015, which has been adjusted in light of new information including preliminary national account figures for the fourth quarter 2015 as well as updated assumptions regard-ing export market growth, interest rates and oil prices, cf. box 2.1 and section 2.2. The esti-mated GDP growth rates for 2016 and 2017 have been lowered by 0.8 and 0.3 percentage points, respectively, due to lower-than-expected activity in the second half year of 2015 and somewhat slower expected global growth. On the other hand, employment in the second half of 2015 increased more rapidly than expected in the December Economic Survey and the estimated level of employment in the short-term is largely unchanged. Thus, a continued increase in employment is expected in the coming years while the number of unemployed is expected to decline further. The improvement of the labour market is expected to take place
1,700
1,750
1,800
1,850
1,900
1,950
2,000
1,700
1,750
1,800
1,850
1,900
1,950
2,000
04 05 06 07 08 09 10 11 12 13 14 15 16 17
Tus
ind
e
DKK bn. (Chained 2010-prices) DKK bn. (Chained 2010-prices)
1,850
1,900
1,950
2,000
2,050
2,100
2,150
1,850
1,900
1,950
2,000
2,050
2,100
2,150
06 07 08 09 10 11 12 13 14 15 16 17
1,000 persons 1,000 persons

Chapter 2 Macroeconomic Scenario towards 2020
Denmark’s Convergence Programme 2016 · April 2016 25
without any general tendency towards labour market tightness building up, which reflects the adopted reforms contributing to higher labour supply, cf. section 2.3. However, since unem-ployment is already at a low level by historical standards vigilance is needed vis-à-vis labour market developments in the coming years.
Despite increased uncertainty concerning the global economy, and the growth outlook has been slightly lowered compared to the December Economic Survey, the global economy, including the euro area, is still moving forward. Thus, exports are expected to contribute positively to economic growth in Denmark as a result of increasing external demand, also supported by the improvement of wage competitiveness in recent years, cf. figure 2.3.
At the same time, domestic demand is expected to increasingly contribute to higher growth towards 2020. Danish households and companies have made economic adjustments in the wake of the crisis and this has created room for future growth in private consumption and investment. Households have been cautious in recent years which led to a low level of con-sumption relative to income. This reflects a need for households to adjust to a more sustain-able level of consumption, and to lower their gross debt, which had increased significantly prior to the crisis. At the same time, labour market progress, low interest rates, increasing house prices as well as real wages have strengthened the finances of the households. With the expected progress in the labour and housing markets, private consumption is forecast to grow slightly faster than income in the coming years, cf. figure 2.4. However, this does not imply a return to the debt-fueled growth in private consumption and housing investments which prevailed in the mid-2000’s, and household debt is forecast to remain rather stable as a share of income. Weak demand, spare production capacity and uncertainty surrounding growth prospects have curbed investment growth in recent years. As demand grows in the coming years, increasing capacity utilisation will follow. This is expected to lead to increasing investments which are also supported by low interest rates.
Figure 2.3
Contributions to GDP growth
Figure 2.4
Slightly higher consumption growth than
income growth
Note: The GDP growth contributions shown in figure 2.3 are adjusted for the import content of exports and domestic demand. Core income in figure 2.4 includes labor income and income transfers.
Source: Statistics Denmark and own calculations.
-1.0
-0.5
0.0
0.5
1.0
1.5
2.0
-1.0
-0.5
0.0
0.5
1.0
1.5
2.0
2013 2014 2015 2016
Export Domestic demand
Per cent Per cent
-1.0
-0.5
0.0
0.5
1.0
1.5
2.0
2.5
-1.0
-0.5
0.0
0.5
1.0
1.5
2.0
2.5
11 12 13 14 15 16 17
Consumption Core income
Per cent Per cent

Chapter 2 Macroeconomic Scenario towards 2020
Denmark’s Convergence Programme 2016 · April 2016
26
Box 2.1
The adjusted economic forecast for 2015-2017 in Denmark’s Convergence Programme 2016
Since Economic Survey, December 2015, new information regarding the Danish and international economy
has been published, which has implications when assessing the economic outlook and public finances.
Most importantly, the preliminary national account figures for 2015 show slightly weaker growth for 2015
than esimated in December due to weak economic activity in the second half of 2015. GDP growth for 2015
was 1.2 per cent compared to the December estimate of 1.4 per cent. At the same time, recent forecasts for
the international economy point in the direction of slower growth in the global economy. Furthermore, the
international organizations assess that the downside risks regarding growth outlook has increased.
Thus, the following adjustments has been incorporated into the forecast (compared to December):
The estimated oil price is adjusted downwards by approx. USD 9.3 per barrel in 2016 and USD 7.9 per
barrel in 2017 to a level of USD 40.2 per barrel and 49.7 USD per barrel, respectively.
The estimated 10-year government bond yield have been reduced by approx. ¼ percentage point in
both 2016 and 2017 to 0.8 per cent in 2016 and 1.1 per cent in 2017.
Based on new estimates from the OECD and the EU Commission, the projected export market growth
for industrial goods has been revised down to 5.2 per cent in 2016 and 5.8 per cent in 2016 and 2017.
The downward revision amount 0.5 and 0.3 percentage points in 2016 and 2017, respectively.
The new information since the December forecast implies a downward revision of the forecasted export
growth in 2016 and 2017 and further slower growth in investments, which mainly reflect increased
uncertainty regarding future growth prospect. The downward revision also results in lower import growth
in both years.
Private employment performed better-than-expected in 2015 compared to the December forecast. Pri-
vate employment growth is currently estimated at 25,000 persons in 2016 (i.e. 2,000 persons lower than
December) and 27,000 persons in 2017 (i.e. 1,000 persons lower than in December).
The overall changes in the economic outlook and the direct effects of lower oil prices and interest rates
on the North Sea and pension yield tax revenues, respectively, have been incorporated in the
assessment of public finances.
In total, the technical adjustments imply a downward revision of GDP growth in 2015 from 1.4 per cent to
1.2 per cent, while growth rates are lowered from 1.9 per cent to 1.1 per cent in 2016 and from 2.0 per cent
to 1.7 per cent in 2017, cf. table a. This does not reflect a fully-fledged new forecast but only an adjustment
of the December estimates as a result of the new information. A new detailed outlook for the Danish
economy will be published in the Economic Survey, May 2016.
Table a
Comparison with Economic Survey December 2015
2015 2016 2017
CP16 ES Dec. CP16 ES Dec. CP16 ES Dec.
GDP growth, per cent 1.2 1.4 1.1 1.9 1.7 2.0
Employment, change 1,000 persons 31 26 27 29 26 27 Consumer price index, change in per cent 0.6 0.5 0.7 1.1 1.8 1.7
Source: Economic Survey December 2015 and own calculations.

Chapter 2 Macroeconomic Scenario towards 2020
Denmark’s Convergence Programme 2016 · April 2016 27
2.2 Assumptions for the international economy and financial conditions
The assumptions regarding the global economy in 2016 and 2017 have been updated with the latest projections from OECD and the EU Commission. Thus, the international growth estimates have been revised downwards compared to Economic Survey from December 2015. Among other things, the downward revision is due to increased uncertainty on financial markets and weaker-than-expected economic data for the second half of 2015, in particular for China and a number of emerging market economies.
However, the overall picture has not changed fundamentally and Danish export markets are still forecast to grow. The economic recovery is entrenched in markets close to Denmark such as the UK, Sweden and the euro area. Growth in the euro area continued through 2015 and in the fourth quarter of 2015 GDP was 1.5 per cent higher than one year ago. In addition, labour market conditions have improved with increasing employment and declining unem-ployment. Euro area economic growth is supported by low oil prices, and expansionary mon-etary policy combined with a transition from a relative tight fiscal stance, which was neces-sary in order to reinforce fiscal credibility and sustainability, to a more neutral fiscal policy stance. Similarly, growth in the UK and Sweden is being supported by expansionary mone-tary policy and low oil prices.
The recovery is further along in the US than in the euro area, and unemployment is back at its pre-crisis level. The US economy has experienced resilient growth over the past two years even though growth was weaker towards the end of 2015, which among other things should be seen in the light of a stronger dollar. Progress in the labour and housing markets are expected to support continued growth in private consumption, and business investment is expected to regain momentum after a temporary slowdown caused by the adjustments in the oil sector to lower oil prices.
Growth in emerging market economies has been declining. Especially in commodity-producing countries like Russia and Brazil the slowdown has been pronounced. Growth has also slowed down in China and the uncertainty about the economic outlook has increased. However, growth in China is still expected to remain at a relatively high level in the coming years.

Chapter 2 Macroeconomic Scenario towards 2020
Denmark’s Convergence Programme 2016 · April 2016
28
The oil price has decreased further since the end of November, when the assumptions for the December estimates were finalised. The decline is due to both persistent over-supply, which has led to significant growt in oil stocks, and the prospects for continued high supply as a result of, among other things, the lifting of the sanctions against Iran and high production in Saudi Arabia. On top of this, general concerns about global growth, partly due to the turmoil in the financial marktes in January and February, has also weighed on oil prices. Weaker than expected growth in the global economy will curb the growth in demand for oil and thus reduce the price. However, in March 2016 the oil price stabilised somewhat. Oil prices are likely to remain low for some time, even though severe cuts in oil industry investments are expected to lead to higher prices a few years ahead.
At the cut-off date, 31 March, for the external assumptions for Convergence Programme 2016, the oil spot price was approx. USD 39 per barrel compared to the trough of USD 27 USD per barrel on 20 January. In Denmark’s Convergence Programme 2016 the oil price projections are based on the usual method (described in Denmark’s Convergence Pro-gramme 2015) as the average of oil futures prices and a scenario in which oil prices adjust to the IEA estimate for oil prices in 2020.
Compared to the December estimates the oil price has been revised downward by USD 9.3 USD per barrel in 2016 and USD 7.9 per barrel in 2017, cf. figure 2.5. Compared to the former medium-term projection from September 2015 the oil price in 2020 has been revised downward by USD 28 per barrel, cf. figure 2.6.
Table 2.1
External assumptions
2015 2016 2017 2018 2019 2020
Real GDP, main trading partners1 2.3 2.1 2.3 2.2 2.2 2.1 Oil price (Brent), USD per barrel, 2010 prices 52.3 40.2 49.7 57.3 64.6 71.8 Dollar exchange rate, DKK per USD 6.73 6.67 6.63 6.51 6.38 6.25 Interest rate 10-year Danish treasury bonds, per cent 1.0 0.7 0.9 1.5 2.1 2.6
1) Includes OECD countries and the emerging market economies Brazil, Russia, India, China, South Africa, Turkey, Indonesia and Mexico.
Source: Statistics Denmark, OECD, Economic Survey December 2015 and own calculations.

Chapter 2 Macroeconomic Scenario towards 2020
Denmark’s Convergence Programme 2016 · April 2016 29
Continued moderate economic growth in the euro area and very low rate of inflation has prompted the ECB to lower the deposit rate to -0.4 per cent. The Danish deposit rate is also very low, cf. figure 2.7. The expectations that the ECB will keep the deposit rate low for an extended period of time have pushed long-term European interest rates down. Long-term interest rates are now lower than they were when finalizing the external assumptions Eco-nomic Survey December 2015, cf. figure 2.8. Thus, the yields on 10-year German and Danish government bonds have been revised down by almost 0.5 percentage points in 2016 and 2017, respectively.
The medium-term projection of interest rates follows an estimate for the monetary policy interest rate, which is aligned with the assumed developments in the euro area. This implies that the monetary policy interest rate in the euro area and Denmark amount to 3 per cent in 2025 and 3.3 per cent in equilibrium by 2030. The yields on 10-year government bonds are governed by he assumed path for short-term interest rates as well as term premia assump-tions. The equilibrium yield of a 10-year Danish government bond is assumed at 4.5 per cent in 2030. This implies that interest rates are currently assumed to reach their equilibrium val-ues five years later than previously expected. This should be seen in the light of recent ac-commodative measures by the ECB, which by itself gives rise to a more prolonged interest rate normalization.
Figure 2.5
Oil price, incl. estimates for 2016 and 2017
Figure 2.6
Medium-term projection of oil prices
Note: Figure 2.6 shows the medium-term projection in CP16 and alternative scenarios based on respectively futures prices (labeled: futures) and and adjustment towards IEA’s estimates for 2020 (labeled: IEA). Furthermore, for the sake of comparison the oil price assumtions used for the medium-term projection from September 2015 (labeled September) is also shown. The projection from September 2015 acted as the basis for the expenditure ceilings for 2019.
Source: Thomson Reuters Eikon and own calculations.
0
20
40
60
80
100
120
140
160
0
20
40
60
80
100
120
140
160
08 09 10 11 12 13 14 15 16 17
CP16 ES December
USD per barrel USD per barrel
0
20
40
60
80
100
120
0
20
40
60
80
100
120
14 15 16 17 18 19 20
September 2015 CP16 Futures IEA
USD per barrel USD per barrel

Chapter 2 Macroeconomic Scenario towards 2020
Denmark’s Convergence Programme 2016 · April 2016
30
2.3 Growth and employment towards 2020 In the medium-term projection towards 2020 it is assumed that the economic situation gradu-ally improves and that the output gap is closed by 2019, cf. figure 2.9. This is equivalent to a normalization of the economic situation by 2019, where the actual levels of production, em-ployment and unemployment correspond to their estimated structural levels. The estimate takes into account the effects of implemented reforms on the labor supply, cf. figure 2.10. From 2020 and onwards, it is assumed that growth in productivity and employment is equal to the structural growth rates.
Figure 2.7
Short-term monetary policy interest rates
Figure 2.8
10-year government bond yield
Source: Statistics Denmark, Danmarks Nationalbank and own calculations.
-2
0
2
4
6
8
10
12
14
-2
0
2
4
6
8
10
12
14
90 94 98 02 06 10 14 18 22 26 30
Historical Sept. 15 CP16
Per cent Per cent
-2
0
2
4
6
8
10
12
14
-2
0
2
4
6
8
10
12
14
90 94 98 02 06 10 14 18 22 26 30
Historical Sept. 15 CP16
Per cent Per cent

Chapter 2 Macroeconomic Scenario towards 2020
Denmark’s Convergence Programme 2016 · April 2016 31
Compared with previous periods of economic recovery this implies that a period of recovery that lasts up to ten years. This must be viewed in light of the historic downturn which followed the financial and debt crises in 2008-2009 and 2011, as well as the fact that the level of activ-ity and level of indebtedness was unsustainably high in the period leading up to the financial crisis. The assumption of a protracted period of recovery towards 2019 has remained un-changed since Denmark’s Convergence Programme 2013. The main part of the economic recovery is expected to take place by 2017, with further moderate contributions in 2018 and 2019. In the technical projections for 2018-2020 it is assumed that international economic growth continues, including the cyclical normalisation in the euro area.
The assumed economic recovery also implies a gradual normalization of the investment ratio in the private sector and roughly unchanged GDP-share of private consumption, cf. figure 2.11 and 2.12. The improvement in the labor market together with increasing house prices and real wages strengthens the economy of the households, thereby allowing for increased private consumption. After several years with a relatively low level of investment, business investment is expected to continue growing in 2018-2020 in line with increased capacity utilisation. Continued favourable loan rates will also support investment.
Figure 2.9
GDP growth and the output gap 2000-2020
Figure 2.10
Employment and structural employment
2000-2020
Note: The output gap is the difference between the actual level of GDP and the estimated level of GDP in a situation where normal business cycle conditions prevail. Similarly, the structural level of employment is the estimated level of employment in normal business cycle conditions.
Source: Statistics Denmark and own calculations.
00 02 04 06 08 10 12 14 16 18 20-6
-5
-4
-3
-2
-1
0
1
2
3
4
5
-6
-5
-4
-3
-2
-1
0
1
2
3
4
5
GDP growth Output gap (right axis)
Per cent Per cent of GDP
2,450
2,500
2,550
2,600
2,650
2,700
2,750
2,800
2,850
2,900
2,450
2,500
2,550
2,600
2,650
2,700
2,750
2,800
2,850
2,900
00 02 04 06 08 10 12 14 16 18 20
Employment Structural employment
1,000 persons 1,000 persons

Chapter 2 Macroeconomic Scenario towards 2020
Denmark’s Convergence Programme 2016 · April 2016
32
Employment is projected to increase by approximately 137,000 full-time employees from 2015 to 2020, of which 93,000 full-time employees reflects an increase in the structural level of employment, while the remaining 44,000 full-time employees is due to the continued eco-nomic recovery, cf. table 2.2.
Table 2.2
Contributions to changes in labor supply and employment, 2015-2020
Effect, number of
persons Effect, full-time persons
(incl. hours worked)
1,000 persons
Demographic contributions (age, gender, origin) etc. 37 35
Contributions from reforms 49 58
Total change in structural employment 85 93
Cyclical contribution 53 44
Total change in actual employment 137 137
- Of which private employment 135 133
Note: The difference between the effect measured in full-time persons and actual number of persons re-flects not only the effect on the average hours worked from different initiatives, but also the differ-ence between average hours worked and normal working time. Due to rounding, the total can dif-fer from the sum of contributions.
Source: Own calculations.
The structural employment increase in the coming years primarily reflects the impact of the reforms which were implemented in Denmark in the wake of the financial crisis. Among these
Figure 2.11
Private consumption as share of GDP
Figure 2.12
Gross investment as share of GDP
Source: Statistics Denmark and own calculations.
44
45
46
47
48
49
50
51
52
44
45
46
47
48
49
50
51
52
90 92 94 96 98 00 02 04 06 08 10 12 14 16 18 20
Per cent of GDP Per cent of GDP
10
15
20
25
10
12
14
16
18
20
22
24
26
90 92 94 96 98 00 02 04 06 08 10 12 14 16 18 20
Per cent of GDP Per cent of GDP

Chapter 2 Macroeconomic Scenario towards 2020
Denmark’s Convergence Programme 2016 · April 2016 33
reforms, the Fiscal Consolidation agreement (2010) and the Early Retirement reform (2011) have been crucial to secure structural public balance in 2020, cf. table 2.3.
The increased inflow of asylum seekers since 2014 also implies an upward revision of the population forecast towards 2020 of just under 100,000 persons, cf. box 2.2. Other things equal, this would have a positive effect on the structural employment of about 20,000 persons from 2015 to 2020.
Table 2.3
Effects of major reforms since 2008 on the labour supply in 2020 (full-time persons)
Reform Effect in 2020
Spring Package 2.0, 2009 18,000
Fiscal Consolidation agreement, 2010 12,000
Early Retirement reform, 2011 65,000
Tax reform, 2012 11,000
Reforms of anticipatory pensions, flexi-jobs scheme, cash benefits and the state education grant system, 2012
15,000
Total 121,000
Source: Own calculations.

Chapter 2 Macroeconomic Scenario towards 2020
Denmark’s Convergence Programme 2016 · April 2016
34
As a consequence of the recovery to a normal business cycle stance, gross unemployment is estimated to fall from just under 125,000 persons in 2015 to approximately 100,000 persons in 2020, a level which in line with the estimated structural level.
In total, average annual GDP growth of around 2 per cent is projected in 2018-2020, which is slightly higher than the assumed growth in the production potential, cf. table 2.4.
Box 2.2
The increased inflow of refugees since 2014 implies a considerable upward revision of the
population forecast
In the latest population forecast from DREAM and Statistics Denmark from May 2015, an average of
approximately 4,500 asylum seekers and family reunificated was assumed to be granted residence permits
each year in the period 2015-2020. This is significantly lower than the amount of residence permits that was
assumed for the government budget for 2016.
For Denmark’s Convergence Programme 2016 an adjusted population forecast has been incorporated with
an upward revision of the amount of non-western immigrants. This reflects the changed assumptions about
the number af refugees and family reunifications in the period 2015-2019, thus helping to ensure that the
adjusted forecast corresponds to the assumptions in the government budget for 2016. From 2020 and on-
wards the forecast relies on DREAM’s usual method implying that the immigration level is gradually normal-
ised. The adjusted population forecast takes into account re-migration, mortality and fertility.
In total the increased immigration implies an upward adjustment of the population in 2020 of approximately
97,000 persons compared with the forecast from May 2015, cf. table a. The adjusted population forecast is
based on the assumptions for granted residence permits in the government budget for 2016. However,
these assumptions are subject to uncertainty. Sensitivity analysis to changes in these assumptions is pre-
sented in chapter 4.
Table a
Upward adjustment of the population forecast due to increased inflow of refugees and family
reunifications
2015 2016 2017 2018 2019 2020
1,000 persons
Excess immigration compared to population forecast from May 2015
8 25 47 67 83 97
Note: The population is calculated as an average of the population at the end of the year and the end of the preceding year. Re-migration, mortality, fertility etc. is taken into account. The table differs from data for granted residence permits which is calcuted at year-end.
Source: DREAM based on data from the Ministry of Immigration, Integration and Housing, and own calculations.
Chapter 2 Macroeconomic Scenario towards 2020
Denmark’s Convergence Programme 2016 · April 2016 35
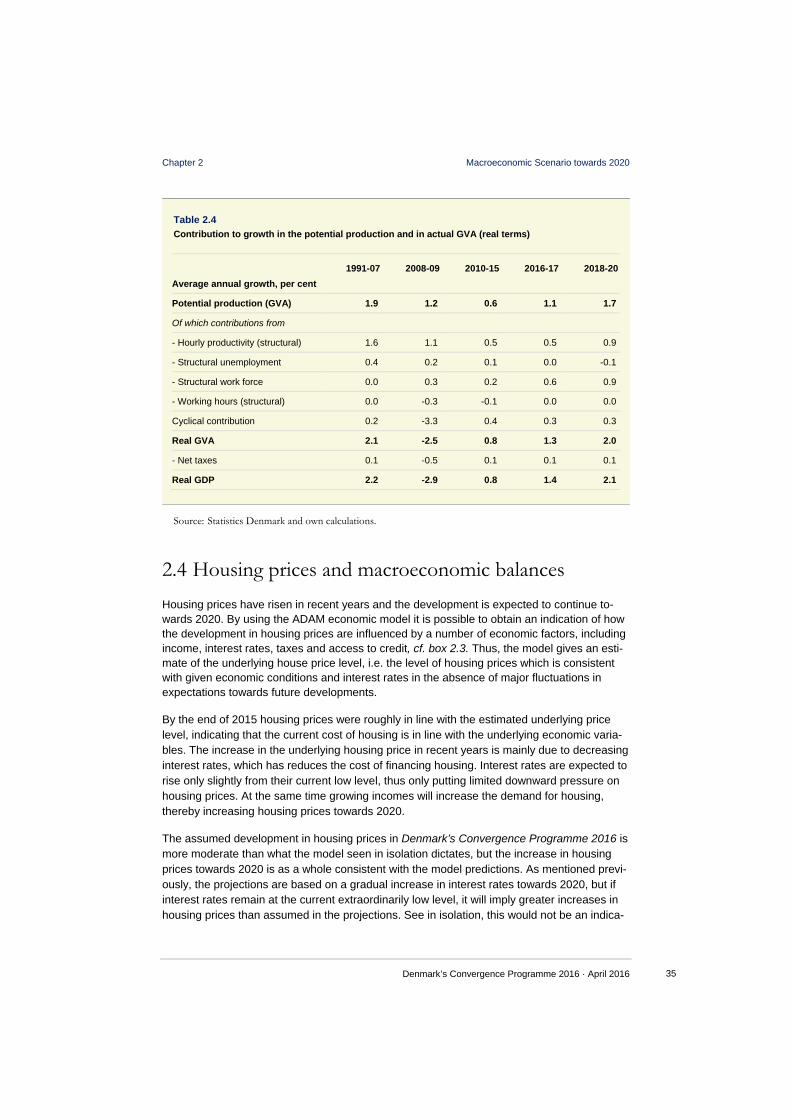
Table 2.4
Contribution to growth in the potential production and in actual GVA (real terms)
Average annual growth, per cent
1991-07 2008-09 2010-15 2016-17 2018-20
Potential production (GVA) 1.9 1.2 0.6 1.1 1.7
Of which contributions from
- Hourly productivity (structural) 1.6 1.1 0.5 0.5 0.9
- Structural unemployment 0.4 0.2 0.1 0.0 -0.1
- Structural work force 0.0 0.3 0.2 0.6 0.9
- Working hours (structural) 0.0 -0.3 -0.1 0.0 0.0
Cyclical contribution 0.2 -3.3 0.4 0.3 0.3
Real GVA 2.1 -2.5 0.8 1.3 2.0
- Net taxes 0.1 -0.5 0.1 0.1 0.1
Real GDP 2.2 -2.9 0.8 1.4 2.1
Source: Statistics Denmark and own calculations.
2.4 Housing prices and macroeconomic balances Housing prices have risen in recent years and the development is expected to continue to-wards 2020. By using the ADAM economic model it is possible to obtain an indication of how the development in housing prices are influenced by a number of economic factors, including income, interest rates, taxes and access to credit, cf. box 2.3. Thus, the model gives an esti-mate of the underlying house price level, i.e. the level of housing prices which is consistent with given economic conditions and interest rates in the absence of major fluctuations in expectations towards future developments.
By the end of 2015 housing prices were roughly in line with the estimated underlying price level, indicating that the current cost of housing is in line with the underlying economic varia-bles. The increase in the underlying housing price in recent years is mainly due to decreasing interest rates, which has reduces the cost of financing housing. Interest rates are expected to rise only slightly from their current low level, thus only putting limited downward pressure on housing prices. At the same time growing incomes will increase the demand for housing, thereby increasing housing prices towards 2020.
The assumed development in housing prices in Denmark’s Convergence Programme 2016 is more moderate than what the model seen in isolation dictates, but the increase in housing prices towards 2020 is as a whole consistent with the model predictions. As mentioned previ-ously, the projections are based on a gradual increase in interest rates towards 2020, but if interest rates remain at the current extraordinarily low level, it will imply greater increases in housing prices than assumed in the projections. See in isolation, this would not be an indica-

Chapter 2 Macroeconomic Scenario towards 2020
Denmark’s Convergence Programme 2016 · April 2016
36
tion of overheating. But vigilance will be needed to avoid tendencies towards a housing bub-ble, where housing prices are driven by expectations of continued increases without basis in underlying economic factors, which creates the risk of a subsequent housing market crash.
Box 2.3
Current housing prices are generally in line with underlying economic conditions
Demand for housing is among other things determined by income, interest rates, taxes and access to credit.
In the ADAM economic model a relation has been estimated between these economic figures and changes
in housing prices. This relation can be used to calculate an estimate of the underlying housing prices
implied by the economic conditions and interest rates in the absence of large fluctuations in expectations
about the future. Housing prices are determined by demand in the short run as supply of housing changes
slowly. In the long run housing prices are determined by developments in constructions costs, including
labour, materials and the price of land. If differences in the current and underlying housing prices are small,
the model predicts that the current prices are in accordance with the economic conditions. Historically the
underlying and actual housing prices have tracked each other relatively close. By the end of 2015 housing
prices was consistent with the estimated underlying prices, while there have previously been periods with
larger deviations, like in the years immediately following the beginning of the new millennium, cf. figure a .
Figure a
Actual and underlying housing prices
Figure b
Marginal contribution to changes in
underlying housing prices
The model predicts a noticeable increase in the underlying prices towards 2020 – especially for 2016 -
2017. This is due to rising income which puts upward pressure on the housing market. Assumed rising
interest rates by 2018 and an expansion of the housing stock will curb the trend in the underlying prices, cf.
figure b. For the five year period, 2016-2020, housing prices are expected to grow by 3.25 per cent per
annum. This is roughly a 1.5 per cent higher growth rate than the average rate since 1970. If interest rates
stay at the low level of 2015 until 2020, it can isolated result in real house price growth rates of 2.25 per
cent per annum higher than the base scenario, cf. figure a.
Note: The calculation of the underlying housing prices is based on the assumption that the housing on average has been in equilibrium in the estimation period 1970-2014. In the projections it is assumed that land prices increases by 4 per cent annaully, which is in line with the developments in the ten year period ending in 2004 before the overheating of the housing market. Mortgage credit contribution fees are assumed to be unchanged over the forecast horizon.
Source: Statistics Denmark, The Association of Danish Mortgage Banks and own calculations.
0
20
40
60
80
100
120
140
160
180
0
20
40
60
80
100
120
140
160
180
70 75 80 85 90 95 00 05 10 15 20Housing pricesProjected housing pricesUnderlying pricesUnderlying prices (low interest rates)
Index (2005=100) Index (2005=100)
-10
-8
-6
-4
-2
0
2
4
6
8
10
12
-10
-8
-6
-4
-2
0
2
4
6
8
10
12
10 11 12 13 14 15 16 17 18 19 20Model-dynamics Housing supplyConsumption (income) User costUnderlying prices
Per cent Per cent

Chapter 2 Macroeconomic Scenario towards 2020
Denmark’s Convergence Programme 2016 · April 2016 37
Macroeconomic balances There was a significant current account surplus of 7 per cent of GDP in 2015. This reflects a relatively large surplus on both the trade balance and net income from abroad, while current transfers to and from abroad weighs negatively, cf. figure 2.13.
The moderation in private domestic demand in the wake of the economic and financial crisis has led to increased private sector savings, cf. figure 2.14. The level is now significantly above the historical average.
Figure 2.13
Current account 2000-20
Figure 2.14
Net lending 2000-20
Note: Total net lending corresponds to the current account balance (except for the normally small net capital transfers abroad).
Source: Statistics Denmark and own calculations.
The surplus on the trade balance should also be seen in the light of the sustained improve-ment in the Danish terms of trade. In addition, net labour and investment income from abroad has significantly contributed to the growing current account surpluses. This is partly due to the increasingly large Danish net foreign asset position as a result of persistent current ac-count surpluses, and partly due to the composition of private and public sector assets and liabilities. A large share of the assets is placed in foreign direct investments, which historically has yielded a relatively high return, while a large share of liabilities consists of bonds, where yields have been very low in recent years.
The current account is expected to amount to approximately 7.5 per cent of GDP in 2016 and 2017. As current account surpluses translate into increased net foreign assets, it will contrib-ute to a further increase in net investment income in 2016 and 2017.
The balance of payments is a result of the overall economic activities and transactions in Denmark, and the current account can be calculated as total savings less total investment. The substantial current account surplus reflects a low level of investment, while gross savings remain high. One reason is the continuing build-up of pension assets. Rising corporate wealth are also contributing, cf. Economic Survey, December 2015. The savings surplus of
-4
-2
0
2
4
6
8
10
-4
-2
0
2
4
6
8
10
00 02 04 06 08 10 12 14 16 18 20Wages and capital incomeTrade balance (goods and services)Current transfersCurrent account
Per cent of GDP Per cent of GDP
-8
-6
-4
-2
0
2
4
6
8
10
-8
-6
-4
-2
0
2
4
6
8
10
00 02 04 06 08 10 12 14 16 18 20
Companies Households Public sector Total
Per cent of GDP Per cent of GDP

Chapter 2 Macroeconomic Scenario towards 2020
Denmark’s Convergence Programme 2016 · April 2016
38
households has helped to stabilize the household gross debt level, which had risen sharply in the years before the crisis.
As investments and consumption grows while energy production in the North Sea declines, a gradual reduction of private savings as a share of GDP from 2016 onwards is assumed, cf. table 2.5. The reduction of private sector savings surplus is partly offset by a declining gov-ernment deficit towards a balance on public finances in 2020.
The overall effect of the changes in public and private sector savings surplus is dominated by the reduction in the private sector, so that the current account surplus is expected to fall until 2020. The decline primarily reflects that the surplus on the trade balance is reduced from 6 per cent of GDP in 2014 to roughly 4.5 per cent of GDP in 2020.
Table 2.5
Savings, investments, current account and net assets against other countries
1990-2012
2013 2014 2015 2016 2017 2018 2019 2020
Per cent of GDP
Investment ratio, private sector 18.1 15.7 16.0 15.7 16.1 16.8 17.8 18.7 19.5
Savings ratio, private sector 21.3 23.6 21.8 24.4 26.0 26.2 26.7 26.7 25.9
Private financial savings 3.2 7.9 5.8 8.7 9.9 9.4 8.9 8.1 6.4
General government budget balance -0.4 -1.1 1.5 -2.1 -2.4 -2.3 -1.8 -1.3 0.0
Current account 3.1 7.1 7.7 7.0 7.7 7.5 7.1 6.7 6.3
Net assets, ultimo -12.0 36.0 45.7 44.7 51.5 57.3 62.2 66.4 70.1
Source: Statistics Denmark and own calculations.

Chapter 2 Macroeconomic Scenario towards 2020
Denmark’s Convergence Programme 2016 · April 2016 39
Appendix 2.1 Key figures for the Danish economy 2014-2020
Table 2.a
Key figures for the Danish economy 2014-2020
Medium-term scenario
Short-term forecast) Recovery Potential growth
2014 2015 2016 2017 2018-20192) 20203)
Output gap and real growth rates (per cent)
Output gap (per cent of GDP) -1.8 -1.4 -1.2 -0.7 -0.24) 0.0
GVA 1.3 0.9 1.0 1.6 2.1 1.8
GDP 1.3 1.2 1.1 1.7 2.2 1.9
Demand, real growth, per cent
Private consumption 0.5 2.1 1.8 1.8 2.3 1.9
Public consumption 0.2 0.6 1.1 0.0 1.0 0.2
Gross fixed capital formation 3.4 1.2 1.9 4.1 6.0 5.7
Change in inventories (per cent of GDP) 0.3 -0.3 0.1 0.0 0.14) 0.0
Export 3.1 -1.0 1.9 4.3 4.4 3.9
Import 3.3 -1.4 3.1 4.6 5.8 4.8
Labour market and productivity
Growth in labour force (per cent) 0.6 0.9 0.8 0.8 1.1 0.8
Growth in employment (per cent) 1.1 1.0 1.0 1.0 1.2 0.8
Structural gross unemployment (per cent of labour force) 3.7 3.6 3.5 3.5 3.74) 3.6
Registered (net) unemployment (per cent of labour force) 4.8 4.4 4.2 4.0 3.74) 3.6
Hourly productivity, entire economy 0.4 0.2 0.1 0.8 1.0 1.0
Growth in GVA per employed 0.3 -0.1 0.0 0.6 0.9 1.0
1) The forecast in 2016-17 is based on the technically adjusted economic forecast, cf. box 2.1. 2) Growth in 2018-19 is including the cyclical normalization. 3) From 2020 and onwards, GDP growth is expected to follow the historical trend. 4) Average in the period. Source: Statistics Denmark and own calculations.

Kapitel 1
[Publikationens titel] · [måned, år] 1

Chapter 3
Denmark’s Convergence Programme 2016 · April 2016 41
3. Budget Balance and Public Debt towards 2020 Nyt kapitel
In the coming years, the structural budget deficit has to be reduced gradually in order to meet the target of structural balance in 2020. From a structural deficit of 0.4 percent of GDP in 2016, the structural balance is improved towards 2020, when fiscal policy is planned accord-ing to the target of balance between public revenue and expenditure. The consolidation of public finances is also aligned with cyclical developments, where output and employment are approaching their structural levels.
The actual budget deficits are estimated to comply with the 3 per cent limit given by EU's Stability and Growth Pact, and the actual deficits are expected to decrease towards 2020 as the structural balance improves and the economic situation normalizes. The public EMU debt is estimated at about 35 per cent of GDP in 2020 i.e. keeping a broad safety margin to the debt limit of 60 per cent of GDP in the Stability and Growth Pact.
Within the target of structural balance, public consumption can (based on technical assump-tions) grow by approx. DKK 10 billion in the period 2016-2020, corresponding to approx. 0.5 per cent per annum (on average). This shows the room for manoeuvre in fiscal policy meas-ured relative to a scenario with real zero real growth in public consumption. The fiscal space is limited in a historical perspective and should in the absence of other measures cover cur-rent policy priorities, including tax cuts and expenditure growth in priority areas.
Public consumption expenditures are still high by historical standards. This is also the case regarding the level of public investment which was increased during the economic crisis in order to support economic activity. However, the increase has taken place with some delay compared to the planned course. Currently, the level of public investment is at the highest level in three decades. It is essential for the adjustment towards structural balance in 2020 that public investment is normalized and reduced to the financed level. The adjustment is a prerequisite for the calculated fiscal space to other priorities and is furthermore aligned with an improving economy. The labour market is improving for the fourth consecutive year with employment growing, while unemployment has fallen to approx. 4 per cent (gross unem-ployment national definition).

Chapter 3 Budget Balance and Public Debt towards 2020
Denmark’s Convergence Programme 2016 · April 2016
42
3.1 The budget balance Based on preliminary figures from Statistics Denmark the general government budget deficit amounted to DKK 41 bn. in 2015 corresponding to approx. 2.1 per cent of GDP. Based on the current assessment of the economic situation and the assumptions regarding fiscal poli-cy, the general government budget deficit is estimated to amount to 2.3 per cent of GDP in 2016 and 1.9 per cent of GDP in 2017, cf. table 3.1. Towards 2020 the actual budget balance is expected to improve further as the economy recovers.
Thus, the actual budget balance complies with the 3 per cent of GDP limit given by the Stabil-ity and Growth Pact.
Table 3.1
Overview of the public balance
2015 2016 2017 2018 2019 2020
Public balance, per cent of GDP -2.1 -2.3 -1.9 -1.8 -1.3 0.0
Public balance, DKK bn. -41.1 -46.7 -40.9 -39.5 -29.5 -0.3
1) The actual budget balance corresponds to the structural balance in 2020, where (among others) the revenue from the pension yield tax is assumed to correspond to the structural level.
Source: Statistics Denmark and own calculations.
Despite expected growth in both GDP and employment the budget deficit is expected to increase slightly between 2015 and 2016. This partly reflects that the actual balance in 2015 is affected by one-off revenues stemming from the Pension Package (2015) amounting to DKK 27 bn., which lapses in 2016. With the Pension Package the possibility of restructuring existing capital pensions was extended to 2015, while people over 60 years could either get their savings in LD paid out or convert the savings with a tax rebate.
On the other hand an extraordinary amortization and depreciation of tax arrears weakened the actual budget balance by approx. DKK 6 bn. in 2015. The amortization is related to a change in the treatment of tax arrears in the national accounts.
In 2013 and 2014, the actual budget balance was also affected by large temporary revenues from the restructuring the capital pension schemes and depreciation of tax arrears in the national accounts. Excluding the temporary revenues, the actual budget balance would have amounted to a deficit of 2¾ per cent of GDP in 2013, 1½ per cent of GDP in 2014 and 3 per cent of GDP in 2015, cf. figure 3.1 and appendix 3.1.

Chapter 3 Budget Balance and Public Debt towards 2020
Denmark’s Convergence Programme 2016 · April 2016 43
Budget balances by sector In Denmark it is basically only the central government, which need not balance the budget. The central government budget deficit is expected to be 2.3 per cent of GDP in 2016 and 1.9 per cent of GDP in 2017, cf. table 3.2. Towards 2020 the deficit will be reduced in line with the assumed consolidation and normalization of the economic situation, so that the central government budget is balancing in 2020.
Table 3.2
Budget balance by subsectors
Per cent of GDP 2014 2015 2016 2017 2018 2019 2020
Central government 1.3 -2.2 -2.3 -1.9 -1.8 -1.3 0.0
Local gov. (municipalities and regions) 0.2 0.1 0.0 0.0 0.0 0.0 0.0
Social funds 0.0 0.0 0.0 0.0 0.0 0.0 0.0
Source: Statistics Denmark and own estimates.
The budget balance of the municipalities and regions are technically considered to be bal-anced throughout the projection period. On a cash basis, local government sector (i.e. munic-ipalities and regions) finances should be in balance, but based on national account principles there may in some years be small surpluses or deficits. The budgets of the social security funds are also assumed to be balanced throughout the projection period.
Figure 3.1
Actual budget balance incl. and excl. specific temporary revenues in 2013-16
Note.: In figure 3.1 the actual budget balance excl. specific temporary revenues is corrected for one-off revenues due to restructuring of existing capital pensions, pay out and restructuring of savings in Lønmodtagernes Dyrtidsfond (LD), a reallocation in the pension sector from schemes with guaranteed yield to schemes based on market return, and advanced ordinary revenues from the taxation of capital pensions, cf. appendix 3.1.
Source: Own calculations.
-5
-4
-3
-2
-1
0
1
2
3
-5
-4
-3
-2
-1
0
1
2
3
2013 2014 2015 2016 2017
Actual budget balance Actual balance excl. temporary measures
Per cent of GDP Per cent of GDP
Actual budget balance limit of the Stability and Growth Pact

Chapter 3 Budget Balance and Public Debt towards 2020
Denmark’s Convergence Programme 2016 · April 2016
44
Revised budget balance estimates compared to December forecast Compared to the latest Economic Survey from December 2015 (available at www.uk.fm.dk) the estimate for the actual budget balance has improved by DKK 10 bn. 2016, while the estimate for 2017 is more or less unchanged, cf. table 3.3.
The improvement in 2016 primarily reflects that the expected revenue from the so-called pension yield tax has been revised upwards by DKK 10 bn. The upward revision is due to lower expected increases in the interest rate during 2016, while the stock market develop-ment in the beginning of the year pulls in the opposite direction.
Compared to the December outlook the estimated corporate tax revenues have been revised upwards in both 2016 and 2017, while the expected North Sea revenues have been reduced in both years.
The corporate tax revenues have been revised upwards by approx. DKK 4 bn. in 2016 and DKK 2¼ bn. in 2017, respectively. The upward revision should be seen in the light of ac-counting figures showing higher revenues in 2015 than estimated in December.1 The addi-tional revenue in 2015 carries over into 2016 and 2017.
The estimated North Sea revenues have been reduced by approx. DKK 3 bn. in 2016 and DKK 2 bn. in 2017. North Sea revenues have been reduced as a result of lower estimated oil prices.
Overall, other factors have contributed to a worsening the actual budget balance of approx. DKK 1½ bn. in 2016 (almost 0.1 per cent of GDP) and an improvement of approx. DKK 1½ bn. in 2017 (almost 0.1 per cent of GDP). Other factors include the total net effect of revised estimates for income taxes, VAT, income transfers, etc.
1 Based on information from The Ministry of Taxation

Chapter 3 Budget Balance and Public Debt towards 2020
Denmark’s Convergence Programme 2016 · April 2016 45
Table 3.3
Actual budget balance in 2016-17 and revision since December Economic Survey
DKK bn. 2016 2017
Economic Survey, December 2015 -56.6 -41.7
+ New estimate for pension yield tax +10.2 -0.4
+ New estimate for corporate tax +4.1 +2.3
+ New estimate for North Sea revenues -3.0 -2.7
+ Other factors -1.4 1.5
Denmark’s Convergence Programme 2016 -46.7 -40.9
Per cent of GDP
Economic Survey, December 2015 -2.8 -2.0
Denmark’s Convergence Programme 2016 -2.3 -1.9
Source: Own calculations.
3.2 Structural budget balance Fiscal policy is primarily planned on the basis of the structural balance, which is an estimated measure of the underlying position of the public finances (based on the fiscal policy stance for the given year). The budget balance requirement of the Danish Budget Law implies that the structural balance must not exceed a deficit of 0.5 per cent of GDP when the Budget Proposal for a given fiscal year is put forward. Fiscal policy planning towards 2020 is based on the target of balancing public revenue and expenditure.
The structural deficit is estimated at 0.6 per cent of GDP in 2015, although fiscal policy was planned within the framework of the Budget Law. Thus, the subsequent weakening relative to the basis for the Budget Bill for 2015 reflects revised estimates including attenuated structural North Sea revenue.
The Budget Bill for 2016 involved a consolidation of public finances by DKK 5 bn. in order to restore a margin against the Budget Law deficit limit. The structural deficit is estimated at 0.4 per cent of GDP in 2016 based on the strengthening of the public finances and other as-sumptions.
The structural deficit is estimated at 0.4 per cent of GDP in 2017. The estimate is in line with the assessment in Economic Survey, December 2015, assuming a technical reduction of the public consumption of DKK 2 bn. DKK in order keep a margin vis-à-vis the deficit limit of the Budget Law.

Chapter 3 Budget Balance and Public Debt towards 2020
Denmark’s Convergence Programme 2016 · April 2016
46
Towards 2020 fiscal policy is planned in order to reach the target of structural balance. The gradual reduction of structural deficits includes an assumed normalization of the current high level of public investment. Compared to the previous medium-term projection from Septem-ber 2015, in particular declining oil prices have led to an underlying weakening of the struc-tural balance through lower expected North Sea revenues. Hence, it has been necessary to adjust the fiscal room for manoeuvre by up to DKK 4 bn. in 2020 to comply with the target of structural balance, cf. section 3.3.
From actual to structural budget balance
The structural budget balance is calculated by correcting the actual balance for cyclical ef-fects and the impact of other temporary factors, including the often very large fluctuations in the pension yield tax and North Sea revenues. Thus, the structural budget balance in a given year is an estimate for the size of the general government surplus of deficit under normal conditions, i.e. in a situation where economic activity is neither particularly high nor low and where the public finances are not affected by temporary factors.
As an example, the calculated structural budget deficit of 0.4 per cent of GDP in 2017 is based on the estimated actual deficit of 1.9 per cent of GDP, cf. table 3.4 (row 1). As the current economic situation (as measured by a weighted output and employment gap) is esti-mated as being weaker than under normal circumstances, the actual balance is adjusted for the negative cyclical impact on public finances. The cyclical weakening of the budget balance is estimated at approx. 0.7 per cent of GDP (row 2). In addition, the actual balance is correct-ed for a number of fluctuations in specific budget items (rows 3-8), where the revenue from the North Sea, pension yield tax, corporate taxes and vehicle registration duty etc. in total is estimated to be approx. 0.9 per cent of GDP below the structural level in 2017. This correc-tion is mainly driven by low expected revenues from the North Sea and the pension yield tax.
Finally a correction is made for other factors (row 9), namely reflecting temporary factors, i.e. non-recurring events, which affect the actual balance in a given year without having signifi-cant importance for the fiscal room for manoeuvre.

Chapter 3 Budget Balance and Public Debt towards 2020
Denmark’s Convergence Programme 2016 · April 2016 47
Table 3.4
Structural budget balance
2015 2016 2017 2018 2019 2020
Per cent of GDP
1. Actual balance -2.1 -2.3 -1.9 -1.8 -1.3 0.0
Contribution from the actual budget balance:
2. Cyclical adjustment -1.3 -1.1 -0.7 -0.4 0.0 -
3. Corporate taxes1) 0.0 0.2 0.1 0.0 0.0 -
4. Vehicle registration duty 0.0 0.1 0.0 0.1 0.0 -
5. Pension yield tax 0.0 0.1 -0.4 -0.9 -0.9 -
6. North Sea revenues2) -0.7 -0.8 -0.5 -0.3 -0.2 -
7. Net interest payments1) -0.3 0.0 0.0 0.0 0.0 -
8. Special budget items 3) -0.2 -0.3 -0.1 0.0 0.0 -
9. Other factors 4) 1.0 -0.1 -0.1 -0.1 -0.1 -
10. Structural balance (1-2-3-4-5-6-7-8-9)5) -0.6 -0.4 -0.4 -0.3 -0.2 0.0
Memo item: Weighted cyclical gap -1.7 -1.4 -1.0 -0.5 0.0 -
1) Excl. revenue relating to North Sea activities. 2) The structural level for the years up to 2019 is based on the structural revenue as of Updated 2020-
projection, September 2015, adjusted for the effect on fiscal sustainability due to revised future North Sea revenues. The permanent effect of updated revenue estimates for 2015-19 corresponds to -0.06 per cent of GDP compared to the September projection and reflects lower expected oil prices.
3) Incl. operating and net capital transfers and adjustment for extraordinary depreciation and amorti-zation of tax arrears in 2015 of approx. DKK 18 bn. distributed over the period 2013-2015.
4) Incl. correction for the PSO-duty, and differences between the commitment level and pay-outs re-garding foreign aid. In addition, adjusted for the following non-recurring factors: One-off revenues of approx. DKK 27 bn. in 2015 stemming from the Pension Package from October 2014. Due to the tax rebate regarding the restructuring of existing capital pensions it is estimated that ordinary capital pension tax revenues of DKK 5 bn. in 2013 and more than DKK 2 bn. in 2014, respectively, have been carried-forward from the period 2015-19. In addition, a correction is made for the revised phasing-in of Denmark’s EU-rebate between 2015 and 2016 corresponding to the correction of the expenditure ceilings. Other factors also include a conversion of the structural balance as a share (in per cent) of actual GDP to a share of structural GDP. Furthermore, also adjusted for new infor-mation on government revenues in 2014 and 2015, which for the moment are not reflected in Sta-tistics Denmark's budget balance figures for 2014 and 2015.
5) The structural budget balance is recorded as a per cent of structural GDP. Source: Statistics Denmark and own calculations.
The Budget Law structural deficit limit of 0.5 per cent of GDP is set in order to ensure that the actual budget balance in a normal recession will comply with the deficit limit of the Stability and Growth Pact of 3 per cent of GDP with high probability. If the actual deficit exceeds the EU limit, Denmark will receive a new EDP-recommendation from EU in order to reduce the budget deficit within a given deadline and with a fixed consolidation requirement. This applies unless the EU considers the excessive deficit to be a temporary and limited effect.
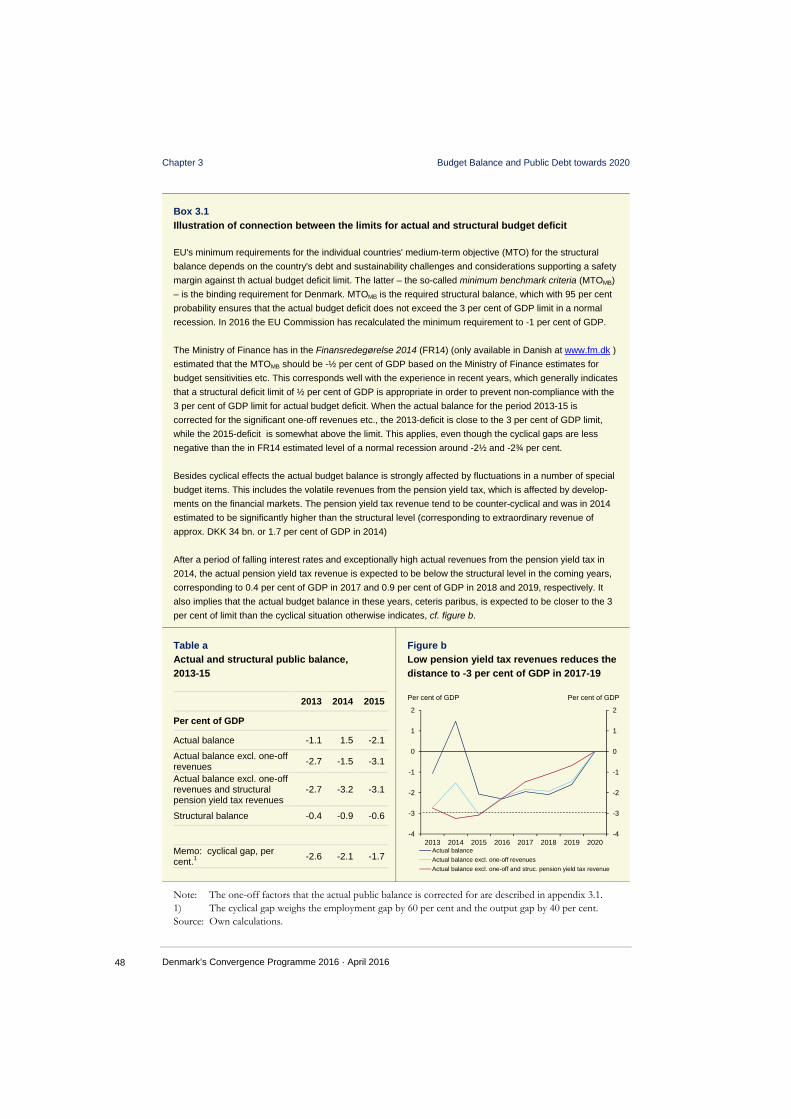
Chapter 3 Budget Balance and Public Debt towards 2020
Denmark’s Convergence Programme 2016 · April 2016
48
Box 3.1
Illustration of connection between the limits for actual and structural budget deficit
EU's minimum requirements for the individual countries' medium-term objective (MTO) for the structural
balance depends on the country's debt and sustainability challenges and considerations supporting a safety
margin against th actual budget deficit limit. The latter – the so-called minimum benchmark criteria (MTOMB)
– is the binding requirement for Denmark. MTOMB is the required structural balance, which with 95 per cent
probability ensures that the actual budget deficit does not exceed the 3 per cent of GDP limit in a normal
recession. In 2016 the EU Commission has recalculated the minimum requirement to -1 per cent of GDP.
The Ministry of Finance has in the Finansredegørelse 2014 (FR14) (only available in Danish at www.fm.dk )
estimated that the MTOMB should be -½ per cent of GDP based on the Ministry of Finance estimates for
budget sensitivities etc. This corresponds well with the experience in recent years, which generally indicates
that a structural deficit limit of ½ per cent of GDP is appropriate in order to prevent non-compliance with the
3 per cent of GDP limit for actual budget deficit. When the actual balance for the period 2013-15 is
corrected for the significant one-off revenues etc., the 2013-deficit is close to the 3 per cent of GDP limit,
while the 2015-deficit is somewhat above the limit. This applies, even though the cyclical gaps are less
negative than the in FR14 estimated level of a normal recession around -2½ and -2¾ per cent.
Besides cyclical effects the actual budget balance is strongly affected by fluctuations in a number of special
budget items. This includes the volatile revenues from the pension yield tax, which is affected by develop-
ments on the financial markets. The pension yield tax revenue tend to be counter-cyclical and was in 2014
estimated to be significantly higher than the structural level (corresponding to extraordinary revenue of
approx. DKK 34 bn. or 1.7 per cent of GDP in 2014)
After a period of falling interest rates and exceptionally high actual revenues from the pension yield tax in
2014, the actual pension yield tax revenue is expected to be below the structural level in the coming years,
corresponding to 0.4 per cent of GDP in 2017 and 0.9 per cent of GDP in 2018 and 2019, respectively. It
also implies that the actual budget balance in these years, ceteris paribus, is expected to be closer to the 3
per cent of limit than the cyclical situation otherwise indicates, cf. figure b.
Table a
Actual and structural public balance,
2013-15
2013 2014 2015
Per cent of GDP
Actual balance -1.1 1.5 -2.1
Actual balance excl. one-off revenues
-2.7 -1.5 -3.1
Actual balance excl. one-off revenues and structural pension yield tax revenues
-2.7 -3.2 -3.1
Structural balance -0.4 -0.9 -0.6
Memo: cyclical gap, per cent.1
-2.6 -2.1 -1.7
Figure b
Low pension yield tax revenues reduces the
distance to -3 per cent of GDP in 2017-19
Note: The one-off factors that the actual public balance is corrected for are described in appendix 3.1. 1) The cyclical gap weighs the employment gap by 60 per cent and the output gap by 40 per cent. Source: Own calculations.
-4
-3
-2
-1
0
1
2
-4
-3
-2
-1
0
1
2
2013 2014 2015 2016 2017 2018 2019 2020Actual balance
Actual balance excl. one-off revenues
Actual balance excl. one-off and struc. pension yield tax revenue
Per cent of GDP Per cent of GDP

Chapter 3 Budget Balance and Public Debt towards 2020
Denmark’s Convergence Programme 2016 · April 2016 49
The Budget law structural deficit limit corresponds to Denmark’s nationally set medium term objective (MTO) for public finances. The nationally set target is more ambitious than the European Commission’s minimum requirement, which for Denmark implies a MTO for the structural balance of at least -1.0 per cent of GDP. The developments of public finances in recent years indicate that the Budget Law limit of -0.5 per cent of GDP is appropriate to sup-port an actual budget balance not conflicting with the EU’s limit of 3 per cent of GDP, cf. box 3.1. Thus, the limit of the Budget law provides greater assurance that no fiscal policy adjust-ments are needed because of considerations regarding the actual balance, which is very volatile.
As part of the medium-term macroeconomic plans, Denmark has historically often set more ambitious targets for the structural balance than the minimum requirements in order to tackle future fiscal policy challenges, cf. figure 3.2 and table 3.5. As regards the 2010-plan and 2015-plan, respectively, the budget balance target towards 2010 was structural surpluses within the interval ¾-1¾ per cent of GDP on average. This reflected, among other things, the need for public savings before the baby boomers began retiring and was replaced by smaller generations in the labor market.
Figure 3.2
Structural budget balance
Table 3.5
Nationally set MTO in the medium-term
plan for the the Danish economy
National MTO
2010-plan1) Structural surplus of ¾-1¾ per cent of the GDP on average going towards 2010.
2015-plan2) Structural surplus of ¾-1¾ per cent of the GDP in the period 2007-10, and at least structural balance in 2011-15.
2020-plan Structural deficit of maximum 0.5 per cent of the GDP. 2020-target of, at least, structural balance.
1) Adjusted for Statistics Denmark's revised categorization of the ATP (Labour Market Supplemen-tary Pension; in Danish: Arbejdsmarkedets Tillægspension) and reorganization and the elimina-tion of the so-called SP scheme (the Special Pension scheme; in Danish: Særlig Pensionsopspar-ing) in order to make figures comparable with the current method of calculating the structural budget balance.
2) In 2009, in light of the financial crisis the target was replaced by a target of at least structural bal-ance in 2015, cf. Denmark’s Convergence Programme 2009.
Source: En holdbar fremtid – Danmark 2010 (from 2001), Mod nye mål – Danmark 2015 (from 2007) and own calculations.
-1.5
-1.0
-0.5
0.0
0.5
1.0
1.5
2.0
2.5
3.0
-1.5
-1.0
-0.5
0.0
0.5
1.0
1.5
2.0
2.5
3.0
00 02 04 06 08 10 12 14 16 18 20
Structural budget balance Target for the structural balance
Budget Law deficit limit
Per cent of GDP Per cent of GDP

Chapter 3 Budget Balance and Public Debt towards 2020
Denmark’s Convergence Programme 2016 · April 2016
50
3.3 Public consumption, investment and fiscal space Currently real growth in public consumption is estimated at 1.1 per cent in 2016, cf. figure 3.3. Thus, public consumption real growth has been revised upwards by 0.3 percentage points in 2016 compared to Economic Survey, December 2015. This is due to lower than expected public consumption in 2015 according to preliminary national accounts figures, as well as higher estimated public consumption expenditure for 2016.
Based on technical assumptions regarding fiscal policy in 2017, public consumption expendi-ture in real terms is assumed to be unchanged from 2016 to 2017.
For the period 2017-2020 public consumption real growth will be moderate compared to the period 2000-2015, where public consumption on average grew by 1¼ per cent per annum. However, in a historical perspective the level of public consumption is still high, cf. figure 3.4.
The improvement of the structural budget towards the target of at least balance in 2020 in-cludes that public consumption on average can grow (in real terms) by an average of 0.5 per cent per annum in 2017-2020.
This corresponds to public consumption growth of approx. DKK 10 bn. (in 2016-prices) to-ward 2020 compared to the 2016-level. This reflects the fiscal room for manoeuvre compared to a scenario with zero real consumption growth, cf. box 3.2. In historical perspective the
Figure 3.3
Real growth in public consumption
Figure 3.4
Level of public consumption
Note: Real growth in the public consumption is calculated according to the output method, which was implemented in the ESA-2010 revision of the national accounts carried out in autumn 2014. How-ever, it should be noted that concerning the estimated real growth in public consumption (i.e. for 2016-2020) it has so far been assumed that there is no difference between the previous input method and the new output method
Source: Statistics Denmark and own calculations.
0.0
0.2
0.4
0.6
0.8
1.0
1.2
1.4
1.6
1.8
2.0
0.0
0.2
0.4
0.6
0.8
1.0
1.2
1.4
1.6
1.8
2.0
Avg.00-15
2016 2017 2018 2019 2020
Average 2017-2020
Per cent Per cent
18
20
22
24
26
28
30
18
20
22
24
26
28
30
00 02 04 06 08 10 12 14 16 18 20
Per cent of structural GDP Per cent of structural GDP
Average public consumption, 1990-2007

Chapter 3 Budget Balance and Public Debt towards 2020
Denmark’s Convergence Programme 2016 · April 2016 51
fiscal space is limited, also in the light of the increasing number of refugees which increases the demographic pressure on public expenditure2.
For the period towards 2020, the demographic pressure on public services grows on average by 0.8 per cent per annum. Demographic pressure has been revised upwards compared to the previous medium-term projection from September 2015, reflecting the influx of refugees that increases the population, cf. box 3.3.
2 Refugee inflows are estimated to have an approximately neutral impact on the fiscal space, but because of the associated population growth it increases the underlying expenditure pressure on the fiscal space.

Chapter 3 Budget Balance and Public Debt towards 2020
Denmark’s Convergence Programme 2016 · April 2016
52
1) The increase in public consumption is estimated excl. depreciation. 2) Incl. disposal of proceeds stemming from the reimbursment reform and the effect of the
agreement on the unemployment benefit reform (from 2015). In the Economic Survey, December 2015, public consumption expenditure was revised upwards by approx. DKK 1½ bn. in 2016 as a consequence of the higher estimated number of refugees. The additional asylum cost in 2016 was largely financed by reallocating foreign aid resources, which are not included in public consumption expenditure. However, from 2018 and onwards it is assumed that the asylum costs which can be financed by reallocating foreign aid resources are unchanged compared to what was assumed in the Updated 2020-projection, September 2015. This implies partially that the increase in public consumption technically is DKK 1½ bn. lower from 2016 to 2020 than assumed in the September. New estimates for asylum expenditures etc. are being prepared on an ongoin basis, which means that the current forecast may change including in connection with the Budget Proposal for 2017.
Source: Own calculations.
Box 3.2
The increase in public consumption towards 2020 compared with the September projection
In the newly updated 2020-projection that serves as the basis for Denmark's Convergence Programme
2016, real public consumption grows by 0.5 per cent per annum on average in the period 2017-2020.
This implies that given the target of at least structural balance in 2020, there is a room for growth in public
consumption of approx. DKK 10 bn. DKK from 2016 to 2020, cf. table a. In the September projection there
was room for an increase of somewhat above DKK 15 bn.
The downward revision of the average growth in public consumption towards 2020 is primarily due to lower
expected oil prices that weaken the structural North Sea revenues by approx. DKK 5 bn. compared to the
projection from September 2015. Revised interest rate assumptions pull slightly in the opposite direction.
Overall in the current projection, there has been incorporated a reduction in public consumption of almost
DKK 4 bn. in 2020 in order to meet the target of structural balance in 2020.
In addition, in the Updated 2020-projection, September 2015 the proceeds from the so-called reimburse-
ment reform in 2018-2020, was technically included as fiscal space within public consumption, but as a part
of the agreement on the Budget Bill for 2016 the aforementioned proceeds was used to finance a lowering
of the gift and heritage tax regarding generational change in family-owned companies. This reduces public
consumption by approx. DKK ¾ bn. in 2020 compared to the Updated 2020-projection, September 2015.
Table a
Increase in public consumption1) from 2016 to 2020
DKK bn., 2016-prices Increase from 2016 to 2020
Updated 2020-projection, September 2015 15½
Denmark’s Convergence Programme 2015 10
Change -5½
Of which: adjustment of fiscal space in order to reach 2020-balance target -3½
Of which: other factors2) -2

Chapter 3 Budget Balance and Public Debt towards 2020
Denmark’s Convergence Programme 2016 · April 2016 53
Fiscal space towards 2020 requires normalization of public investment In later years public investment has been historically high in order to support economic activi-ty. In the coming years a gradual normalization is assumed being aligned with accelerating growth and increasing employment in the Danish economy. In the medium-term projection towards 2020 the level of public investment is assumed to be reduced from 3.7 per cent of GDP in 2015 to 3.3 per cent of GDP in 2020, cf. figure 3.5.
Box 3.3
Increased demographic pressure on of public services as a result of the inflow of refugees
The influx of refugees and family reunification implies a larger increase in the population than previously
expected, cf. chapter 1. Due to the larger influx, the current projection includes a population increase of al-
most 100,000 people towards 2020. In particular, the number of people in working ages and children are
increasing, cf. table a.
The increased inflow of refugees and family reunified implies a larger demographic pressure on public ser-
vices, cf. also Den øgede flygtningetilstrømning lægger pres på de offentlige finanser (only available in Dan-
ish at www.fm.dk). For instance, this is expressed by a greater demand for education, day care and health
care (individual public consumption) as well as police, defense and public administration (collective con-
sumption), cf. table a.
Calculations of the demographic pressure are of a purely mechanical nature and should generally be inter-
preted with caution. The calculations, e.g., do not take into account that the cost of an extra user may differ
from the average cost per user. Particularly in terms of collective consumption, an increase in the population
does not automatically cause a proportional increase in spending on defense, police, administration, etc.
Table a
Change in the population projection
2015 2016 2017 2018 2019 2020
1,000 persons
0-14 3 8 15 21 26 31
15-64 5 17 32 45 56 65
65+ 0 0 1 1 1 1
Total 8 25 47 67 83 97
Figure a
Demographic pressure in the period 2016-20
Anm.: Population is mediofided. The updated population projection includes the higher level of immigration compared to the previous population projection from May 2015. I.e., the total immigration of refugees and family reunifications in the adjusted population projection matches the assumptions of the Budget Bill for 2016 towards 2019. From 2020 and onwards DREAM’s general calculation principles are used. Emigration, mortality, etc. is taken into account.
Source: DREAM (Danish Rational Economic Agents Model-group) based on data from the Ministry of Immigration, Integration and Housing, Statistics Denmark and own calculations.
0.5 per cent
0.8 per cent
0.0
0.2
0.4
0.6
0.8
1.0
0.0
0.2
0.4
0.6
0.8
1.0
Demographic pressure inSeptember projection
Demographic pressure incl.increased influx
Per cent Per cent

Chapter 3 Budget Balance and Public Debt towards 2020
Denmark’s Convergence Programme 2016 · April 2016
54
However, the expected public investment exceeds the assumed levels in the projection. Thus in coming years, there is a need to adjust public investment to the financed level. This is key in order to maintain the improvement of public finances towards structural balance in 2020. The adjustment of public investment is a precondition for the calculated fiscal space regard-ing other priorities.
3.4 Public expenditures and revenues
Public expenditures Total public expenditures are estimated to fall from 54½ per cent of GDP in 2015 to 50½ percent in 2020, cf. table 3.6. The decline partly reflects the cyclical normalization, which increases GDP and reduces unemployment benefit expenditures etc. The decrease also highly reflects the adopted reforms, including the retirement reform (from 2011), which among other things reduce the voluntary early retirement pension expenditures and increase the labour supply and GDP. Furthermore, expenditure developments reflect a moderate growth in public consumption and the assumed normalization of public investment.
Figure 3.5
Public investment incl. research and
development
Figure 3.6
Public investment by sector
Source: Statistics Denmark and own calculations.
1.5
2.0
2.5
3.0
3.5
4.0
4.5
1.5
2.0
2.5
3.0
3.5
4.0
4.5
90 92 94 96 98 00 02 04 06 08 10 12 14 16 18 20
Public investment Average, 1990-2007
Per cent of GDP Per cent of GDP
0
10
20
30
40
50
60
0
10
20
30
40
50
60
07 08 09 10 11 12 13 14 15 16 17 18 19 20
Buildings etc. Research and development
DKK bn. (2016 prices) DKK bn. (2016 prices)

Chapter 3 Budget Balance and Public Debt towards 2020
Denmark’s Convergence Programme 2016 · April 2016 55
Table 3.6
Public expenditure
2015 2016 2017 2018 2019 2020
Per cent of GDP
Public expenditure (expenditure ratio)1) 54.5 53.5 52.5 51.7 51.1 50.4
Primary expenditures 52.9 52.3 51.3 50.5 49.9 49.2
- Public consumption 26.2 26.2 25.8 25.6 25.3 25.0
- Public investment2) 3.7 3.5 3.5 3.4 3.4 3.3
Of which building and installations etc. 1.0 0.9 0.9 0.9 0.9 0.9
Of which research and development 2.7 2.6 2.6 2.5 2.5 2.4
- Income transfers 17.8 17.7 17.4 17.1 16.8 16.5
- Subsidies 2.0 2.0 1.9 1.7 1.7 1.7
- Other primary expenditures 3.2 2.9 2.8 2.8 2.7 2.7
Interest expenditures 1.6 1.2 1.2 1.1 1.2 1.2
1) Total public expenditures (and revenues) differ from Statistics Denmark. Here the expenditure ra-tio is calculated on the basis of total expenditure figures that include all sub-elements of public con-sumption, including e.g. imputed expenditures in terms of depreciation and revenues from sales of goods and services. The budget balance is unaffected by these technical differences.
2) Public investment is calculated excl. net purchases of buildings etc. Since Statistics Denmark’s ESA2010-revision of the national accounts in autumn of 2014, public investment also includes re-search and development spending.
Source: Statistics Denmark and own calculations.
Public consumption expenditures accounted for 26.2 per cent of GDP in 2015 and are as-sumed to decrease gradually to approx. 25 per cent of GDP in 2020. The reduction should be seen in light of the subdued development in nominal public consumption expenditures and the expected increase in nominal GDP.
The preliminarily estimate of public investment as a share of GDP is 3.7 per cent in 2015. Following the extraordinarily high level in previous years, an adjustment of the public invest-ment level is planned for 2016 and with a continued normalization thereafter towards 2020.
Public spending on income transfers amounted to approx. 17¾ per cent of GDP in 2015 and is estimated to be reduced to a level of approx. 16½ per cent of GDP in 2020, cf. figure 3.7. The reduction partly reflects the expected cyclical normalization. In addition, the reduction reflects the effect of the retirement reform increasing the ages for voluntary early retirement and old age pensions and other reforms, including the tax agreement from June 2012 which included a lower regulation of public income transfers.

Chapter 3 Budget Balance and Public Debt towards 2020
Denmark’s Convergence Programme 2016 · April 2016
56
Figure 3.7
Total spending on income transfers
Figure 3.8
Income transfer recipients incl. and excl. old
age retirees and students (SU)
Source: Statistics Denmark and own calculations.
The subsidies are expected to be reduced slightly from 2 per cent of GDP in 2015 to approx. 1¾ per cent of GDP in 2020. The reduction of subsidy spending partly reflects the phasing-out of the old flexi-job scheme. Public interest payments are expected to decrease from 1½ per cent of GDP in 2015 to 1¼ per cent of GDP in 2020. The decline in public interest pay-ments should be seen in connection with the ongoing refinancing of existing debt at low in-terest rates.
Composition of public expenditure by function The composition of public expenditure by function (the functional distribution) shows that social protection spending is by far the largest expenditure item, cf. table 3.7. Social protec-tion spending amounts to approx. 24 per cent of GDP in the period 2012-15 and cover, among other things, the majority of income transfers (old age pension, disability pension, unemployment benefits, cash benefits etc.) as well as operating expenditures for day care etc. Health care and educational spending accounts for approx. 9 per cent and 7 per cent of GDP, respectively.
10
12
14
16
18
20
22
24
10
12
14
16
18
20
22
24
90 92 94 96 98 00 02 04 06 08 10 12 14 16 18 20
Per cent of GDP Per cent of GDP
0
500
1,000
1,500
2,000
2,500
3,000
0
200
400
600
800
1,000
1,200
1,400
90 92 94 96 98 00 02 04 06 08 10 12 14 16 18 20
Number of income transfer recipients excl. pension and SU
Number of income transfer recipients, total (rhs. axis)
1,000 persons 1,000 persons

Chapter 3 Budget Balance and Public Debt towards 2020
Denmark’s Convergence Programme 2016 · April 2016 57
Table 3.7
Public expenditure by function, 2012-2015
2012 2013 2014 2015
Per cent of GDP
General public services 9.21) 7.6 7.2 7.3
Military defence 1.4 1.3 1.2 1.2
Public order and safety 1.0 1.0 1.0 1.0
Economic affairs 3.7 3.5 3.6 3.8
Environment protection 0.4 0.5 0.5 0.4
Housing and community amenities 0.3 0.3 0.2 0.3
Health care 8.7 8.6 8.7 8.7
Recreation, culture and religion 1.8 1.8 1.8 1.8
Education 7.0 7.0 7.2 7.2
Social protection 24.7 24.9 24.5 24.1
Public expenditures in total2) 58.3 56.5 56.0 55.7
Note: 2012-14 reflects national account figures, while 2015 figures are based on preliminary national ac-count figures.
1) Spending on general public services includes the repayment of voluntary early retirement contribu-tions in 2012.
2) Calculation of the total public expenditures in Statistics Denmark differ from the calculations in Table 3.3 due to differences in the methodology (in Table 3.6 the imputed expenditures are recog-nized in terms of depreciation and revenues from sales of goods and services on the expenditure side, which is not the case in Statistics Denmark table 3.7).
Source: Statistics Denmark, own forecast and calculations.
The medium-term projections for the Danish economy do not include a distribution of expend-itures by function (COFOG). The projection includes estimated developments in real econo-my sub-components, e.g. public consumption, public investment and spending on income transfers.
Public revenues Public revenue amounted to almost 52½ per cent of GDP in 2015 and is estimated to fall to approx. 50½ per cent of GDP in 2020, cf. table 3.8. This reflects in particular that personal income taxes in 2015 were affected by temporary revenues, which expire in 2016.
The revenues from personal income taxes amounted to approx. DKK 436 bn., corresponding to 21.9 per cent of GDP in 2015. The revenues from personal income taxes in 2015 are influ-enced by temporary factors. Thus, the so-called Pension Package from October 2014 implied a prolongation to 2015 of the tax rebate linked to the restructuring of capital pensions and a similar tax rebate connected to pay-outs and restructuring of savings in Lønmodtagernes

Chapter 3 Budget Balance and Public Debt towards 2020
Denmark’s Convergence Programme 2016 · April 2016
58
Dyrtidsfond (LD) also in 2015.3 Based on the latest figures on restructuring of capital pen-sions, the Pension Package revenue increased personal income taxes by DKK 27 bn. in 2015, corresponding to almost 1.4 per cent of GDP. In 2016 and 2017 a normalization of personal income tax revenue is expected as a result of temporary factors expiring, and total revenue from personal individual taxes is estimated at approx. 20.8 per cent of GDP in both years.
The revenue from the pension yield tax amounted to approx. DKK 22½ bn. in 2015, corre-sponding to 1.1 per cent of GDP. Revenues have declined from a historically high level in 2014 of DKK 54½ bn., corresponding to 2.8 per cent of GDP. The relatively high pension yield tax revenues in recent years are partly caused by the fact that interest rates have fallen to historically low levels. Conversely, as interest rates gradually are expected to normalize in the coming years, a period of relatively low pension yield revenues can be foreseen. Thus, popularly speaking interest rate fluctuations “move” revenue between years. This may have a relatively large impact on the calculated tax burden and the actual budget balance in indi-vidual years, while the consequences for the real economy are insignificant. Based on the expected interest rate developments, the return on bonds and derivative assets of pension companies is estimated to be relatively low in both 2016 and 2017. Thus, the revenue from the pension yield tax is expected to fall to 0.7 per cent of GDP in 2017 and decline further in 2018. In 2020, revenues from the pension yield tax are assumed to be at the structural level.
VAT revenues amounted to almost DKK 190 bn. in 2015, corresponding to 9.5 per cent of GDP and are estimated to remain roughly at the same level until 2020.
Other indirect taxes primarily include excise duties, among others, in the form of the energy and environmental taxes, taxes on tobacco and spirits, gambling taxes and PSO revenues.4 In addition, indirect tax revenues include the vehicle registration tax, municipal property taxes (i.e. land tax etc.), motor vehicle weight duty from companies, duty on wage and salary costs and stamp duties. In total, other indirect tax revenues amounted to almost DKK 143 bn. in 2015, corresponding to 7.2 per cent of GDP, and are expected to decrease to approx. 6.8 per cent of GDP in 2020.
North Sea revenues amounted to approx. DKK 5 bn. in 2015, corresponding to 0.2 per cent of GDP. Subject to considerable uncertainty, North Sea revenues are estimated to decrease to approx. 0.1 per cent of GDP in 2016 and 2017. The revenues related to North Sea activi-ties are to a large degree affected by developments in the production of oil and gas and in oil prices (in DKK).
Public interest income amounted to DKK 16½ bn. in 2015, corresponding to 0.8 per cent of GDP. Public interest income is estimated to remain at roughly the same level until 2020.
3 As short description of Lønmodtagernes Dyrtidsfond (Foundation of LD) is available at www.ld.dk/english. 4 PSO is short for Public Service Obligation. PSO-revenues depend, among other things, on electricity price developments and the expansion of renewable energy (VE), since the PSO-rate is adjusted quarterly in order to correspond to the PSO-subsidies. This implies that the estimated PSO-revenues are subject to considerable uncertainty and can vary from year to year.

Chapter 3 Budget Balance and Public Debt towards 2020
Denmark’s Convergence Programme 2016 · April 2016 59
Table 3.8
Public revenue
2015 2016 2017 2018 2019 2020
Per cent of GDP
Personal income taxes etc.1) 21.9 20.8 20.8 20.9 20.7 20.6
Labour market contributions 4.4 4.5 4.5 4.5 4.5 4.5
Pension yield tax 1.1 1.2 0.7 0.2 0.3 1.0
Corporate taxes 2.5 2.5 2.5 2.3 2.3 2.3
- Corporate taxes on hydrocarbon manufacturing 0.1 0.0 0.1 0.1 0.1 0.1
- Other corporate taxes 2.4 2.5 2.4 2.2 2.2 2.2
VAT 9.5 9.5 9.5 9.6 9.6 9.7
Other indirect taxes 7.2 7.2 7.1 6.9 6.9 6.8
Other taxes2) 0.3 0.3 0.3 0.3 0.3 0.3
Taxes and duties (tax burden) 47.0 46.0 45.3 44.6 44.5 45.1
Interest income3) 0.8 0.7 0.7 0.7 0.8 0.8
Other revenues4) 4.8 4.7 4.7 4.8 4.7 4.7
Duties etc. to EU5) -0.2 -0.2 -0.2 -0.2 -0.2 -0.2
Public revenues6) 52.4 51.2 50.5 49.9 49.8 50.4
Memo item: North Sea revenues 7) 0.2 0.1 0.1 0.1 0.1 0.2
1) Personal taxes etc. include income tax, property value tax, motor vehicle weight duty from house-holds, gift and heritage tax and other personal taxes (including, among others, extraordinary reve-nues stemming for the tax rebate arrangements regarding restructuring of capital pensions and LD-funds in 2015).
2) Other taxes include a media license (primarily for Danish Radio) and mandatory pension contribu-tions for civil servants in publicly-owned companies, etc.
3) Incl. dividends and profits from Danmarks Nationalbank. 4) Other revenues include, among others, profits from public enterprises, operating and capital trans-
fers from other domestic sectors and the EU, as well as imputed (calculated) revenues from both the gross operating surplus and the contributions to civil servant pensions. Furthermore, it also in-cludes central government revenues from state participation in the oil and gas production in the North Sea and the hydrocarbon tax (in national accounts being categorized as rent).
5) According to national account principles these revenues are categorized as taxes and are therefore included in the tax burden, but since the revenues are going to the EU, they are not included in the revenue burden.
6) The calculation of total public revenues differs from Statistics Denmark, that among other attrib-utes the sale of public goods and services to the revenue side and not, as here, the expenditure side, as part of the total consumption expenditure. Total revenues are calculated incl. imputed gross op-erating surplus being matched by the imputed depreciation costs included in the calculation of pub-lic consumption.
7) Total North Sea revenues consist of hydrocarbon tax, corporation tax on hydrocarbon manufactur-ing and dividends from the Danish North Sea Fund. The North Sea revenues are included in cor-porate taxes, interest income and other revenues.
Source: Statistics Denmark and own calculations.

Chapter 3 Budget Balance and Public Debt towards 2020
Denmark’s Convergence Programme 2016 · April 2016
60
3.5 Public debt Overall, public gross debt (EMU definition) as a share of GDP has been declining since the European debt crisis in the summer of 2011, and the EMU debt amounted to approx. 40 per cent of GDP by the end of 2015, cf. table 3.9. Despite a budget deficit, EMU debt decreased by 3.6 per cent of GDP in 2015. This primarily reflects that the central government's account at Danmarks Nationalbank was reduced considerably, among others, as a result of the deci-sion to stop the issuance of government bonds during the period 30 January 2015 to 7 Octo-ber 2015. The balance of this account is not included in the calculation of the EMU debt, and thus the part of the budget deficit, which is covered by drawing on (i.e. reducing) the central government’s account at Danmarks Nationalbank, does not affect the EMU debt, cf. also box 3.4.
In the coming years, EMU debt is expected to decline further, and by 2020 the gross debt ratio is expected to be approx. 35 per cent of GDP as a result of the increase in nominal GDP. Thus, the EMU debt is keeping a broad safety margin against the 60 per cent of GDP limit of the Stability and Growth Pact.
Table 3.9
Overview of the public debt, end of year
2015 2016 2017 2018 2019 2020
Per cent of GDP
Gross debt (EMU definition) 40.2 38.9 38.0 37.9 37.1 35.1
Net public debt 5.0 7.2 8.9 10.0 10.7 10.1
Memo item: Actual budget balance -2.1 -2.3 -1.9 -1.8 -1.3 0.0
Source: Statistics Denmark, Danmarks Nationalbank and own calculations.
Net public debt is the central debt concept when assessing long-term fiscal sustainability. As a result of the estimated public budget deficits, net public debt is expected to increase from 5 per cent of GDP in 2015 to 10 per cent of GDP at the end of 2020. The projection of net public debt is uncertain, since the trajectory for net public debt not only reflects budget defi-cits but also depends on value adjustments of government assets and liabilities. However, the level of net debt is expected to remain low in 2020.

Chapter 3 Budget Balance and Public Debt towards 2020
Denmark’s Convergence Programme 2016 · April 2016 61
Box 3.4
Key public debt concepts
The various public debt concepts differ in terms of calculation methods and the definition of the public sec-
tor:
EMU debt – which covers the state, municipalities, counties/regions as well as social security funds – is
being applied in connection with the EU's Stability and Growth Pact. Overall, the debt criterion implies that
the EMU-debt-to-GDP ratio should not exceed 60 percent. The EMU debt primarily includes outstanding
bonds. This implies that the part of a given budget deficit, which is covered by drawing on (i.e. reducing) the
central government’s account at Danmark’s Nationalbank rather than by issuing bonds, does not affect
EMU debt.
EMU debt (and to some extent also the central government debt) is a so-called gross debt concept that pri-
marily includes public financial liabilities. By contrast, net public debt includes both financial assets and
liabilities. The net debt of central government, municipalities and regions is used when calculating long-term
fiscal sustainability.

Chapter 3 Budget Balance and Public Debt towards 2020
Denmark’s Convergence Programme 2016 · April 2016
62
Appendix 3.1 One-off factors in 2013-2020 In later years the actual budget balance has been affected by significant one-off factors:
The agreement on a tax reform (2012) introduced a possibility to restructure savings on existing capital pensions with a tax rebate in 2013. By Growth Plan DK (2013) the tax re-bate period was prolonged also to cover 2014. Overall the one-off revenues amounted to approx. DKK 29 bn. in 2013 and approx. DKK 59 bn. in 2014.
Due to the restructuring of existing capital pensions an advancement of ordinary reve-nues from the capital pension tax amounting to approx. DKK 5 bn. in 2013 and approx. 2 bn. in 2014 is estimated. This reflects that persons over 60 years to a large extent chose to pay-out their capital pension while the tax is lower. The carry-forward of ordi-nary revenues is assumed to take place uniformly from the period 2015-19.
Due to the Pension Package (October 2015) the possibility to convert capital pensions to so-called age-pensions with a tax rebate was expanded to include 2015. At the same time, persons over 60 years were given the opportunity to pay-out or restructure saved funds in Lønmodtagernes Dyrtidsfond (LD) also with a tax rebate. In total, the Pension Package is estimated to imply one-off revenues amounting to DKK 27 bn. in 2015, of which DKK 16 bn. can be attributed to the restructuring of capital pensions, while the re-maining DKK 11 bn. concerns one-off revenues from restructuring of LD-funds.
In 2013 and 2014 the pension yield tax revenues are temporarily increased by DKK 2 bn. due to a reallocation in the pension sector from schemes with a guaranteed yield each year to schemes in which each year’s yield reflect market return. However, the tempo-rary extra revenues are off-set by correspondingly lower revenues in the period 2017-2019.
In the opposite direction of one-off revenues pulls extraordinary amortization and depre-ciation of tax and duty arrears amounting to approx. DKK 6 bn. per annum in 2013-15. The amortization reflects a change in the way tax and duty arrears are handled in the national accounts. In the future, tax and duty arrears of citizens and companies are based on how many taxes it is actually realistic to collect.
The one-off factors listed are neutral vis-à-vis the structural budget balance.

Chapter 3 Budget Balance and Public Debt towards 2020
Denmark’s Convergence Programme 2016 · April 2016 63
Appendix table 3.1
One-offs factors affecting the actual public balance, 2013-20201)
DKK bn. 2013 2014 2015 2016 2017 2018 2019 2020
One-off revenue from the restructuring of the capital pension scheme
29¼ 58¾ 16 - - - - -
Advancement of ordinary revenue from the capital pension tax2) 5¼ 2¼ -1½ -1½ -1½ -1½ -1½ -
One-off revenue from pay-out and restruc-turing of LD-funds
- - 11 - - - - -
Reallocation of pension sector schemes3) 2 2 - - -1 -2 -2 -
Extraordinary depreciation and amortization of tax and duty arrears -64) -64) -6 - - - - -
Total, DKK bn. 30½ 57 19½ -1½ -2½ -3½ -3½ -
Total, per cent of GDP 1.6 2.9 1.0 -0.1 -0.1 -0.2 -0.2 -
1) In addition to the one-off factors of DKK 6 bn. per annum in 2013-15, there are tax arrear depreciations amounting to DKK 2 billion. kr. in 2016 (distributed uniformly by DKK ¾ bn. per annum in 2014-2016), which affects the structural balance.
2) Assumed to be carried-forward uniformly from the period 2015-2019. 3) Related to a reallocation in the pension sector from schemes with a guaranteed yield each year to
schemes in which each year’s yield reflect market return, there may be timing differences regarding the pension yield tax revenues.
4) Currently Statistics Denmark’s estimates include amortizations of DKK 5 bn. in 2013 and 2014, respectively.

Kapitel 1
[Publikationens titel] · [måned, år] 1

Chapter 4
Denmark’s Convergence Programme 2016 · April 2016 65
4. Sensitivity Analysis and Comparison with CP15 Nyt kapitel
Short-term risks for the Danish economy to a large extent reflect the challenges of the global economy. Uncertainty regarding global growth outlook and the risk of a global downturn are closely linked to developments in the oil price and interest rates; the paths of which impact significantly upon the Danish economy. Currently, the levels for both the oil price and interest rates are very low, which supports economic recovery in Denmark. If the gradual improve-ment in European economies stalls, the low oil price and interest rate levels are likely to prevail further into the future than assumed in the projection.
Furthermore, uncertainty surrounding the demographic outlook has increased. Along with other European countries, Denmark has experienced significant growth in the number of refugees and migrants over the past year. Asylum influx estimates are difficult to produce and highly uncertain. The effects of greater or lesser migration to Denmark are illustrated by sensitivity analysis.
The assumptions concerning the international economy and financial conditions being the basis for the Convergence Programme diverge somewhat from those of the European Com-mission. Primarily, the difference concerns the speed of normalisation of the interest rate. The European Commission estimates that the interest rate is kept at a significantly lower level in 2016 and 2017 than what is assumed in Denmark’s Convergence Programme. Using the European Commission’s external assumptions would imply higher economic growth I Denmark, while the budget balance is left more or less unaffected.
4.1 Sensitivity analysis Growth in a small, open economy such as the Danish is highly sensitive to developments in the rest of the world. First and foremost, exports (being high relative to GDP) are affected by changes in worldwide growth etc. In addition, export expectations may have an impact on domestic demand through investment and private consumption.
At present, the key risk for Denmark’s economic outlook is the global growth prospects. As uncertainty regarding several emerging economies e.g. China has increased, the risk of lower global growth is higher. The assumptions for international growth have been revised down-ward in the current Convergence Programme, cf. chapter 2. However, if a more protracted recovery leads to a downturn in the global economy, it will hamper Danish growth prospects notably. The very low oil price and interest rate levels add to the uncertainty regarding the economic outlook for the coming years. A gradual increase in both the oil price and interest

Chapter 4 Sensitivity Analysis and Comparison with CP15
Denmark’s Convergence Programme 2016 · April 2016 66
rates are assumed in the years to come. In the case of a widespread global downturn, this normalisation will, ceteris paribus, be deferred or protracted.
In the following sections an alternative scenario is presented. This scenario illustrates the sensitivity of the Danish economy with respect to altered assumptions for external growth, oil price and interest rates. The sensitivities are shown by comparing the Convergence Pro-gramme projection with an alternative based on the EU Commission’s assumptions concern-ing the international economy and financial conditions for 2016 and 2017, cf. the require-ments outlined in the Code of Conduct for Stability and Convergence Programmes.
Besides the factors mentioned above, there is significant uncertainty concerning demograph-ic developments in Denmark and several other European countries which are experiencing an increasing inflow of refugees and migrants. The magnitude of this migration is very difficult to predict, as it is sensitive to a range of geopolitical conditions. To illustrate the scope of this uncertainty, a separate calculation is presented, showing the consequences of greater or lesser migration than expected.
Finally, the projection of selected key figures for the Danish economy in the current Conver-gence Programme (CP16) is compared with the Convergence Programme from last year (CP15). The comparison covers the years towards 2020.
Scenario with the EU Commission’s external assumptions As an alternative scenario to the projection in CP16, a projection based on the European Commission’s external assumptions included in the Spring 2016 Economic Forecast has been established, cf. table 4.1. The assumptions regarding growth in export markets in CP16 are somewhat higher than the corresponding forecast by the European Commission. In par-ticular, the EU Commission furthermore assumes a somewhat lower oil price especially in 2017. Both the European Commission and CP16 assume low interest rates in the coming years, but the European Commission forecasts a somewhat slower normalization of interest rates in 2017 compared to CP16.
Table 4.1
External assumptions
2015 2016 2017
CP16 EU CP16 EU
Growth in export markets, per cent1) 5.4 5.9 5.6 6.0 5.8
Crude oil price, USD per barrel 52.4 40.2 39.7 49.7 45.3
Short-term interest rate, percentage point2) -0.02 -0.27 -0.25 -0.27 -0.33
Long-term interest rate, percentage point2) 0.5 0.4 0.3 0.7 0.4
1) Growth in export markets concern industrial goods and is shown as real growth in per cent. 2) Numbers refer to European interest rates. The levels of the corresponding Danish rates have been
modified in order to ensure that the spread to the Euro area remains unchanged relative to the assumptions in CP15.
Source: Own calculations and the European Commission.

Chapter 4 Sensitivity Analysis and Comparison with CP15
Denmark’s Convergence Programme 2016 · April 2016 67
The alternative scenario based on the European Commission’s external assumptions implies slightly higher Danish GDP growth in 2016 and 2017 compared to CP16, cf. table 4.2.
This difference is primarily caused by diverging interest rate levels in the two scenarios. The positive effect on growth due to a lower interest rate is partly countered by the lower export market growth in the European Commission’s outlook. The higher growth implies an increase in employment and a lower unemployment rate in the alternative scenario. Furthermore, this pulls in the direction of smaller budget deficits in 2016 and 2017. Higher revenues from the pension yield tax due to lower interest rates, and thus smaller losses from revaluation of bonds, also contributes to improved public finances. On the other hand, lower oil prices as assumed by European Commission’s, weakens the budget balance. Overall, the budget balance is more or less unchanged in the alternative scenario. Thus, the public gross debt (EMU definition) also follows the same path in both projections.
Alternative scenarios for asylum influx Since the summer 2014, Denmark has experienced a marked increase in the number of refugees and migrants. For Denmark’s Convergence Programme 2016, a modified demo-graphic projection has been incorporated, in which the number of non-western immigrants has been adjusted upward. This reflects the assumptions in the budget bill for 2016 regarding the number of residence permits given to asylum seekers and family reunifications for refu-gees already residing in Denmark, cf. chapter 2. The modified demographic projection implies
Table 4.2
Alternative scenario based on the external assumptions of the European Commission
2015 2016 2017
Convergence Programme 2016
GDP growth, per cent 1.2 1.1 1.7
Employment, 1,000 persons 2,796 2,823 2,849
Unemployment, per cent of labour force 4.4 4.2 4.0
Budget balance, per cent of GDP -2.1 -2.3 -1.9
Public gross debt (EMU definition), per cent of GDP 39.4 37.6 38.4
Alternative scenario based on the external assumptions of the European Commission
GDP growth, per cent 1.2 1.2 1.9
Employment, 1,000 persons 2,796 2,824 2,854
Unemployment, per cent of the labour force 4.4 4.1 3.8
Budget balance, per cent of GDP -2.1 -2.3 -1.9
Public gross debt (EMU definition), per cent of GDP 39.4 37.6 38.4
Note: The table shows the effect on registered gross unemployment. Source: Statistics Denmark and own calculations.

Chapter 4 Sensitivity Analysis and Comparison with CP15
Denmark’s Convergence Programme 2016 · April 2016 68
a population increase of roughly 100,000 persons in 2020 compared to the demographic projection from May 2015, cf. figure 4.1.
However, estimating the asylum influx in the coming years is subject to significant uncertain-ty. Therefore, two alternative scenarios have been established, in order to illustrate the sensi-tivity of public finances to various projections. The two scenarios cover a case with lower inflow of asylum seekers to Denmark as well as a case with higher influx, relative to the base-line in CP16, cf. table 4.3.
In the projection with fewer asylum seekers, the inflow is set to diminish faster beyond 2017 than assumed in the CP16 baseline. Thus, the population increases by 28,000 persons less towards 2020 compared to CP16, cf. figure 4.1.
In the projection with more asylum seekers, the inflow is set to remain at an elevated level beyond 2016. In total, the population increases by an additional 26,000 persons towards 2020.
The alternative scenarios for the asylum influx primarily affect the number of integration bene-fit recipients, since only a minor part of refugees are expected to be employed by 2020. In the scenario with larger inflow, the number of integration benefit recipients is increased by 14,000 persons by 2020 – and more or less the opposite in the scenario with lower inflow. Public consumption and investment expenditure is assumed unchanged in the calculations.
Figure 4.1
Population change compared to the May
2015 demographic projection
Table 4.3
Assumptions underlying the alternative
scenarios and CP16
2015 2016 2017 2018 2019
Lesser inflow
Asylum seekers 20 25 10 7.5 7.5
Residence permits 20 25 25 9 9
Greater inflow
Asylum seekers 20 25 25 25 25
Residence permits 20 25 29 29 29
CP16
Asylum seekers 20 25 15 15 15
Residence permits 20 25 28 20 19
Source: Own calculations.
0
30
60
90
120
150
0
30
60
90
120
150
2015 2016 2017 2018 2019 2020
CP16 Greater inflow Lesser inflow
1,000 persons 1,000 persons

Chapter 4 Sensitivity Analysis and Comparison with CP15
Denmark’s Convergence Programme 2016 · April 2016 69
Table 4.4
Alternative projections for migration to Denmark – effects in 2020
CP16 Lesser inflow Greater inflow
Change relative to CP16
Population (1,000 persons) 5,891 -28 26
Employment (1,000 persons) 2,848 -4 3
Integration benefit recipients (1,000 persons) 46.2 -15 14
Budget balance (DKK bn., current prices) 0 0.4 -0.4
Source: Own calculations.
The alternative scenarios for the inflow of migrants and refugees have only marginal effects on the budget balance, when public consumption and investment expenditure is assumed unchanged. The scenario with higher influx weakens public finances by about DKK 0.4 bn. in 2020, corresponding to approx. 0.02 per cent of GDP, cf. table 4.4. The weakening is mainly caused by more recipients of integration benefits, implying higher spending on income trans-fers. This is partially offset by higher tax revenue from increased employment. Conversely, in the other scenario with lower influx, the budget balance is improved by DKK 0.4 bn. in 2020. Growth in demographic pressure concerning public services corresponds to 0.8 per cent per annum in the baseline CP16 scenario, which is increased by almost 0.1 percentage point per annum in the scenario with higher influx and reduced by approx. 0.1 per cent per annum in the scenario characterized by lower immigration.
4.2 Comparison with Convergence Programme 2015 GDP growth in 2015 turned out somewhat weaker than expected in CP15. Furthermore, growth expectations for 2016 and 2017, respectively, have been revised downward relative to previous projections, cf. also chapter 2. Despite a slightly weaker outlook, growth is still pro-jected to pick up in the coming years, resulting in a gradual closing of the output gap towards 2019, cf. table 4.4.
Despite lower growth the output gaps for 2015 and 2016 have narrowed compared to CP15. This reflects that employment increased more than expected in 2015 and has been adjusted upward in 2016. As a consequence, the employment gap – measured by the difference be-tween actual and structural employment – has narrowed in recent years. Since the method used by the Ministry of Finance in order to calculate the output gap is closely linked to esti-mated slack in the labour market, the employment developments, ceteris paribus, are of significant importance when estimating the output gap.
In CP16 the budget balance (as share of GDP) estimates for 2016 and 2017 have improved by 0.3 and 0.7 percentage points, respectively, compared to CP15. Especially lower spending

Chapter 4 Sensitivity Analysis and Comparison with CP15
Denmark’s Convergence Programme 2016 · April 2016 70
on income transfers and higher tax revenue (reflecting the higher employment estimate) contribute to an improved budget balance in 2016. Furthermore, in both years revenue from the pension yield tax has been revised upwards in light of a more gradual normalization of interest rates than expected in CP15.
Lower public consumption expenditure also contributes to an improved budget balance in 2017. In CP16, public gross debt (EMU-definition) is estimated to be stable below 40 per cent of GDP, i.e. with a broad margin to the 60 per cent of GDP limit given by EU’s Stability and Growth Pact. This is in line with projection in CP15.
Table 4.5
Changes compared to Convergence Programme 2015
2013 2014 2015 2016 2017 2018 2019 2020
Real GDP growth, per cent
CP15 -0.5 1.0 1.6 2.0 1.9 2.4 2.4 1.8
CP16 -0.2 1.3 1.2 1.1 1.7 2.2 2.2 1.9
Change 0.2 0.3 -0.4 -0.9 -0.1 -0.2 -0.3 0.1
Employment (incl. leave of absence), 1,000 persons
CP15 2,749 2,768 2,792 2,817 2,848 2,884 2,920 2,938
CP16 2,743 2,765 2,796 2,823 2,849 2,887 2,921 2,945
Change -6.0 -3.3 3.3 5.4 0.7 3.1 0.6 7.2
Output gap, per cent of GVA
CP15 -2.8 -2.2 -1.9 -1.4 -1.0 -0.5 0.0 0.0
CP16 -2.6 -1.7 -1.3 -1.1 -0.8 -0.4 0.0 0.0
Change 0.2 0.5 0.6 0.3 0.2 0.1 0 0
Budget balance1), per cent of GDP
CP15 -1.1 1.9 -1.6 -2.6 -2.7 -1.8 -1.1 0.0
CP16 -1.1 1.5 -2.1 -2.3 -1.9 -1.8 -1.3 0.0
Change 0.0 -0.4 -0.4 0.3 0.7 0.1 -0.2 0.0
Public gross debt (EMU definition), per cent of GDP
CP15 45.1 45.1 39.0 38.5 39.0 38.3 37.0 36.7
CP16 44.7 44.8 40.2 38.9 38.0 37.9 37.1 35.1
Change -0.5 -0.4 0.4 0.3 -1.0 -0.3 0.1 -1.6
1) Including temporary revenue from e.g. the restructuring of the capital pensions scheme in 2013-15. Source: Statistics Denmark and own calculations.


Kapitel 1
[Publikationens titel] · [måned, år] 1

Chapter 5
Denmark’s Convergence Programme 2016 · April 2016 73
5. Long-Term Projection and Fiscal Sustainability Nyt kapitel
Economic policy is planned in accordance with the overall medium-term fiscal objective of structural budget balance in 2020 and fiscal sustainability.
Towards 2020, fiscal policy is planned within the room for manoeuvre given by the structural balance target. After 2020, the projection is based on technical principles in order to assess whether the economic policy can be maintained beyond the planning horizon (i.e. 2020) without leading to a persistent and unsustainable increase in the public debt ratio. In the current projection, the fiscal room for manoeuvre has been adjusted in order to comply with the objective of structural balance by 2020. The fiscal sustainability indicator is estimated at 0.5 per cent of GDP.
Although the fiscal sustainability indicator is positive, the projection entails a period from approx. 2030 to 2055 where structural deficits are larger than the Budget Law limit of ½ per cent of GDP. In the longer term, the budget balance improves, and the deficits turn into sur-pluses. This holds when the retirement age is increased every fifth year to a high level, as laid out by the Welfare Agreement. However, it will take several years before the increase in the retirement age has caught up on the increase in life expectancy which has already taken place and is expected to continue in the projection. This profile for the budget balance over time is also known as the so-called hammock challenge, characterised by an initial worsening of the budget balance, followed by an improvement.
One of the factors weakening the government balance for an extended period after 2020 is that people retiring currently and towards the middle of this century can expect a longer aver-age retirement period than both previous and later generations. This reflects a significant increase in life expectancy for the older population. In 2015, a 60-year old is expected to live until 83 years of age. When the Welfare Agreement was settled in 2006, it was assumed that such a life expectancy for a 60-year old would not occur until 2040.
The medium-term planning period extends to 2020 only. Thus, the technical budget deficits for the following prolonged period do not represent planned policy; rather, it highlights the necessity of adjusting either expenditure or revenue relative to the technical projection as-sumptions. Economic policy as determined by future medium-term plans will address these demographic challenges within the boundaries of the Danish Budget Law as well as the supranational EU budget rules.

Chapter 5 Long-Term Projection and Fiscal Sustainability
Denmark’s Convergence Programme 2016 · April 2016
74
5.1 Development beyond 2020 The starting point for the long-term projection is a medium-term trajectory characterized by structural budget balance by 2020. After 2020, the projection is based on technical principles including assumptions concerning demographic developments and the gradual depletion of the Danish oil and gas resources in the North Sea, cf. box 5.1. Furthermore, the gradual increase in the retirement age is taken into account in accordance with the life expectancy indexation rules given by the Welfare Agreement from 2006 and the Retirement Reform Agreement from 2011.
Box 5.1
Principles for the projection after 2020
The projection principles after 2020 generally reflect an extrapolation of the structures of the economy as
they appear in 2020, with the addition of agreed initiatives that have an effect also after 2020:
Nominal public consumption expenditures are projected based on an assumption that expenditures per
user grow in line with wages, while the number of users of public services evolves in line with the calcu-
lated impact of changing demographics. Public sector wages grow in line with private wages, and pub-
lic net purchases of goods and services from the private sector make up a constant share of public
consumption expenditures.
Social benefits (income transfers) are assumed to rise in line with private sector wages so that re-
placement rates overall remain constant (e.g., in case of unemployment or retirement).
From the outset, labour participation rates, and the propensities at which various social benefits are re-
ceived, are assumed to be constant across age, gender and origin. However, the ratios are adjusted for
the expected effects of changes in education composition as well as adopted reforms in particular in re-
lation to retirement
Gross public investment is projected in order to ensure that the growth in the public capital stock (gross
and efficiency corrected) is equal to the increase in a weighted development in gross value added
(GVA) in the public and private sector. The weights are 70 per cent for public GVA and 30 per cent for
private GVA. The private sector share reflects public investment directed towards infrastructure.
Public subsidies and net foreign transfers are constant relative to GDP.
Besides the effects of adopted tax policy, the tax burden is projected to be unchanged after 2020, so
tax rates in per cent remain constant, while excise duties etc. set in nominal terms are technically as-
sumed to increase in line with price developments. Property taxes are assumed to follow the value of
the total housing stock, corresponding to a roughly unchanged share of GDP from 2020.
The revenues from the North Sea activities are based on The Danish Energy Authority’s longterm pro-
jection of oil and gas production. Long-term oil price assumptions are described in Chapter 2.
A gradual improvement in energy efficiency is assumed for both consumption and production, which
reflects the ongoing improvements in energy efficiency as well as the energy agreement from 2012.
A gradual normalization of interest rates is assumed. Thus the 10-year interest rate on government
bonds is assumed to increase to 3.3 per cent in 2020 and further to 4.5 per cent in 2025, and remain
unchanged thereafter.

Chapter 5 Long-Term Projection and Fiscal Sustainability
Denmark’s Convergence Programme 2016 · April 2016 75
Fiscal sustainability implies that planned policies can be maintained in the long-term, tech-nical projection after 2020 without implying a persistent and unsustainable increase in public debt as share of GDP. This applies at an unchanged tax burden and technical assumptions concerning public spending such that expenditures per person (at a given age) grow in line with wage developments (though corrected for partial healthy ageing).
In the technical long-term projection, the structural deficits comply with the Budget Law limit of ½ per cent of GDP towards 2028. For the subsequent period, given unchanged economic policy, the structural deficits are projected to gradually to increase to approx. 1¼ per cent of GDP in 2045 and then decrease again – the so-called hammock challenge, cf. figure 5.1. The current fiscal planning period extends to 2020 only. Thus, the projected deficits in the longer-term neither reflect planned policy nor expected deficits which do not comply with Budget Law limit. In future medium-term plans economic policy will be determined in order to ensure compliance with the Budget Law within the whole planning horizon.
Therefore, in addition to fiscal sustainability requirement, the Budget Law limit for the annual structural budget deficit reflects the need ensure ongoing credibility of the pursued fiscal policy. Fiscal credibility is also supported by continued moderate public debt and compliance with EU’s budgetary rules. In other words, fiscal sustainability is an important – but not nec-essarily a sufficient – condition for credible fiscal policy.
This should not least be seen in light of the fact that the uncertainty surrounding budget bal-ance projections generally increase as the time horizon is extended. Thus, the projected improvement of the budget balance beyond 2050 is based on an increase in the retirement age every fifth year to a high level and also hinges – among others – on technical assump-tions regarding employment rates among older cohorts as the retirement age edges upward.
Figure 5.1
Structural budget balance
Figure 5.2
Public gross debt (EMU definition)
Source: Statistics Denmark and own calculations.
-2
-1
0
1
2
-2
-1
0
1
2
10 15 20 25 30 35 40 45 50 55 60
Per cent of GDP Per cent of GDP
0
10
20
30
40
50
60
70
0
10
20
30
40
50
60
70
10 15 20 25 30 35 40 45 50 55 60
Per cent of GDP Per cent of GDP

Chapter 5 Long-Term Projection and Fiscal Sustainability
Denmark’s Convergence Programme 2016 · April 2016
76
Another factor weakening the structural balance in the longer run is the gradual depletion of oil and gas resources in the North Sea. As a consequence, public revenue from this source is set to cease after 2060. Over time, the increasing revenue from taxation of private pension pay-outs will pull in the opposite direction and contribute to an improving budget balance.
Towards 2020, public gross debt (EMU definition) is projected to reach a level of approx. 35 per cent of GDP. After 2030, the technical projection involves a gradual increase in the EMU debt (as share of GDP). In the longer-term the EMU debt ratio is projected to diminish due to general government budget surpluses. Throughout the projection period a margin against the Stability and Growth Pact’s public debt limit of 60 per cent of GDP is maintained, cf. figure 5.2.
A moderate debt level during normal cyclical conditions contributes to create a safety margin vis-à-vis the EU’s threshold of 60 per cent of GDP in the case of an economic downturn. For instance, EMU debt increased by approx. 20 per cent of GDP from 2007 to 2011, i.e. during the deep recession in wake of the global financial crisis.
The hammock challenge reflects a marked increase in life expectancy The hammock challenge reflects, among other things, a decreasing share of the population in employment, and an increasing number of retirees for a lengthy period. From 2030 to approx. 2045, the influx to the group of prime working age (here illustrated by the 20 to 67-year-olds) is smaller than the number of persons exiting this group, since relatively small cohorts are replacing relatively large ones (baby boomers), cf. figure 5.3. Not until around 2045 this im-balance is expected to be reverted, with the inflow again exceeding the exits from the prime working age group.
Based on the population projection produced by DREAM and Statistics Denmark, life expec-tancy for the 60-year-olds is assumed to increase from 83 years to almost 85 years by 2025, and adding another 2 years by 2040. In combination, rising average life expectancy and large cohorts imply that the number of people being older than 65 years is going to increase rather rapidly towards 2050. In 2015, there are 1.1 bn. persons older than 65 years, equivalent to approx. 19 per cent of total population. By comparison, the population projection indicates that there will be 1.6 bn. persons over 65 years by 2050, corresponding to approx. 25 per cent of the population.

Chapter 5 Long-Term Projection and Fiscal Sustainability
Denmark’s Convergence Programme 2016 · April 2016 77
By the Welfare Agreement 2006 it was decided that increasing life expectancy for 60-year olds should be reflected in an increasing number of years in the labour market. Thus the retirement age should be indexed by life expectancy. This principle was maintained in the Retirement Reform 2011. This reform entails that the voluntary early retirement age is in-creased by half a year for each year from 2014 to 2019, and further again in 2022-23, such that the voluntary early retirement age is 64 years by 2023. Similarly, the state pension age is to be increased by half a year each year in 2019-22, such that it reaches 67 years by 2022. From 2027 and 2030 respectively, the age limits for early retirement benefits and state pen-sions will be gradually increased, in line with life expectancy for 60-year olds, resulting in a gradual reversal to a 14½-year pension period on average. As a consequence of the sharp rise in life expectancy after 1995, the adjustment of the pension period via changes in the age limits for voluntary early retirement and state pension, respectively, will not be fully phased-in until after 2050.
The rather long phasing-in is caused by the rules of the Welfare Agreement stating that the state pension age may only be raised by one year every fifth year. As mentioned, the first hike in the state pension age is in 2019, i.e. 25 years after the marked increase in average life expectancy for the older part of the population. Not until 2030 will the state pension age exceed the 67-year age threshold, which prevailed for the period 1958-2004. In the interven-ing years, life expectancy for 60-year olds has risen from 79½ years in 1995 to expected 85½ years in 2029, i.e. approximately by 6 years.
In 2015, the life expectancy for a 60-year old was somewhat above 83 years. When the Wel-fare Agreement was reached in 2006, the assumption was that a life expectancy of this mag-nitude for a 60-year old would not be realised until 2040, cf. figure 5.4.
Figure 5.3
In- and outflow regarding prime working age
group, 2020-2050
Figure 5.4
Development in life expectancy for 60-years
old, 1990-2100
Note: In figure 5.4, life expectancy when the Welfare Agreement was reached (in 2006) is based on DREAM’s population projection 2005.
Source: Statistics Denmark, the Welfare Commission and own calculations.
50
55
60
65
70
75
80
85
90
50
55
60
65
70
75
80
85
90
2020 2025 2030 2035 2040 2045 2050
Inflow (20-years old) Outflow (67-years old)
1,000 persons 1,000 persons
76
78
80
82
84
86
88
90
92
76
78
80
82
84
86
88
90
92
1990 2000 2010 2020 2030 2040 2050 2060
Latest population projection Welfare agreement (2006)
Life expectancy in 2013Life expectancy in 2040 according to Welfare Agreement
Years Years

Chapter 5 Long-Term Projection and Fiscal Sustainability
Denmark’s Convergence Programme 2016 · April 2016
78
Thus, based on the developments in life expectancy new retirees can look forward to a rather long pension period. The indexation of the retirement ages imply that people retiring today and in the coming several years can look forward to more years on pension than both previ-ous generations and cohorts reaching the retirement age around and after 2050, cf. figure 5.5. This holds until the retirement ages for both voluntary early retirement and state pension fully catch up on the increase in life expectancy which has already taken place and further-more is expected to take place in the future.
5.2 Changes in structural budget balance in 2020 and fiscal sustainability The key medium-term objective for fiscal policy is at least structural budget balance in 2020 and fiscal sustainability.
Estimates for the structural balance in 2020 and the sustainability indicator (HBI) were updat-ed in September 2015, cf. Updated 2020-projection (only available in Danish as Opdateret 2020-forløb: Grundlag for udgiftslofter 2019 at www.fm.dk). I CP15 the structural balance was estimated at 0.0 per cent of GDP in 2020 and the sustainability indicator at 0.2 per cent of GDP. The Budget Bill for 2016 involved a fiscal tightening of ¼ per cent of GDP, in order to reduce the structural deficit to 0.4 per cent of GDP in 2016 and make progress towards struc-tural balance. Overall, the adjustments concerning the economic projection and economic policy resulted in an unchanged structural balance in 2020 and a more or less unaltered sustainability indicator of approx. 0.2 per cent of GDP, as in CP15, cf. table 5.1.
Figure 5.5
Retirement age, life expectancy and expected pension period, 1990-2080
Note.: The life expectancy is calculated for 60-year olds. Based on life expectancy at the relevant retirement age, the pension period is longer than shown in the chart, while the shortening of the pension period over time is somewhat smaller.
Source: DREAM’s population projection 2015 and own calculations.
57
60
63
66
69
72
75
78
81
84
87
90
93
57
60
63
66
69
72
75
78
81
84
87
90
93
1990 1995 2000 2005 2010 2015 2020 2025 2030 2035 2040 2045 2050 2055 2060 2065 2070 2075 2080
Voluntary early retirement age State pension age Life expectancy for 60-years old
Age (years) Age (years)
Cohort 196018¼ years
Cohort 198016¾ years
Cohort 194818½ yearsCohort 1930
13 years
Cohort 200015¾ years

Chapter 5 Long-Term Projection and Fiscal Sustainability
Denmark’s Convergence Programme 2016 · April 2016 79
Since the September 2015 medium-term projection, the structural balance in 2020 has pri-marily been affected by lower than expected oil prices, cf. chapter 2. This implies lower ex-pected revenue from oil and gas production in the North Sea, which weakens the structural balance in 2020 by approx. ¼ per cent of GDP, cf. box 2.1. The fiscal sustainability indicator (HBI) is also affected, but to a lesser degree, since North Sea revenue lapses as oil and gas reserves are depleted, cf. table 5.1.
Table 5.1
Changes to the fiscal sustainability indicator (HBI) from CP15 to CP16
Structural
balance in 2020 HBI
Pct. of GDP Pct. of GDP
Convergence Programme 2015 0.0 0.2
Total incl. population projection, education behaviour, oil and gas production, adjustment of fiscal space etc., Sep 15 0.0 0.0
Updated 2020-projection, September 2015 0.0 0.2
Lower North Sea revenue -0.25 -0.05
Deferred normalisation of interest rates +0.10 0.00
Updated population projection (revised refugee influx) 0.00 +0.15
Assumptions regarding private consumption and savings -0.10 +0.10
Other factors (total) +0.05 -0.10
Projection prior to adjustment of fiscal space towards 2020 -0.2 0.3
Adjustment of public consumption expenditure +0.2 +0.2
Convergence Programme 2016 0.0 0.5
Source: CP15, Updated 2020-projection, September 2015 and own calculations.
Furthermore, the structural balance in 2020 is affected by a number of other updates and computational assumptions:
Interest rates are expected to remain low for a longer period than assumed in CP15. This contributes to lower interest deductions for households, which in isolation increases tax revenues in 2020, as well as lower public interest payments. In the longer-term, the as-sumptions regarding interest rates are unchanged, and the sustainability indicator is left more or less unchanged.
The greater influx of refugees, which has been included in the population projection, has a neutral effect on the budget balance in 2020, when real public consumption and in-vestment expenditure is left unchanged. The introduction of the integration benefit scheme curbs spending related to passive provision for the newcomers, who are not in employment. Meanwhile, the larger population intensifies pressures on the already ap-proved 4-year expenditure ceilings. Given the technical assumptions, the larger popula-

Chapter 5 Long-Term Projection and Fiscal Sustainability
Denmark’s Convergence Programme 2016 · April 2016
80
tion is estimated to have a slightly positive effect on the sustainability indicator. A pre-requisite for this is that the employment rate for refugees is gradually increasing in line with the time spent in Denmark, and that a higher employment rate applies for descend-ants of refugees, corresponding to the observed rates for other non-western descend-ants. In addition, it is assumed that employment rates for descendants of refugees after two generations reaches the same level as for native Danes. Thus, relative to 2020 the ratio between employed and unemployed regarding the newly added population is shift-ing in a more favourable direction over time. It should be noted that influx of refugees in general weakens public finances in the long run. The positive effect on the sustainability indicator is a result of the fact that public consumption ceteris paribus is assumed un-changed towards 2020 in order to reach structural balance.
A slightly lower future growth rate in private consumption than previously assumed will have a dampening effect on revenue from duties (incl. VAT), which is expected to weak-en the budget balance by approx. 0.1 per cent of GDP in 2020. In the longer-term it is assumed that the built-up of labour market pensions only partially crowds out private savings outside the pensions system. Specifically, it is assumed that ¼ of the built-up of labour market pension crowd out other savings (after tax etc.). This is broadly in line with historical experience, and more recent empirical evidence on the relationship between pension savings and other savings. Thus, pension savings boost total savings and wealth over time, which increases the base for capital income taxation. In total, this strengthens the fiscal sustainability indicator by approx. 0.1 per cent of GDP.
All in all, the updated assumptions underlying CP16 implies a weakening of the budget bal-ance in 2020 (approx. 0.2 per cent of GDP), while the sustainability indicator is slightly im-proved.
Therefore, in order to meet the structural balance target in 2020 the level of public consump-tion expenditure in 2020 has been revised downward by DKK 2½ bn. corresponding to ap-prox. 0.2 per cent of GDP. Using the updated assumptions, the structural balance is estimat-ed at 0.0 per cent of GDP in 2020.
Overall, the fiscal sustainability indicator is improved by 0.3 per cent of GDP compared to CP15. The lower oil prices weaken the structural balance in 2020 by ¼ per cent of GDP, while having a limited negative effect on the sustainability indicator.
The positive sustainability indicator rests, among other things, on the assumption that the state pension age will be increased every fifth year for the rest of the century, and that this increase results in higher labour supply and employment. Furthermore, it is assumed that the average unemployment rate over the coming decades corresponds to somewhat above 3½ per cent of the labour force.
The deterioration of the budget balance toward 2045 – the so-called hammock challenge – has been reduced compared to CP15, cf. figure 5.6. First and foremost, this reflects that the lowering of public consumption expenditure in order to meet the structural balance target in 2020 entails a lasting improvement of the budget balance, while the weakening of public finances due to lower oil prices as mentioned above will lapse gradually.

Chapter 5 Long-Term Projection and Fiscal Sustainability
Denmark’s Convergence Programme 2016 · April 2016 81
Figure 5.6
Structural balance, 2010-2060
Source: DREAM’s population projection 2015 and own calculations.
-2
-1
0
1
2
-2
-1
0
1
2
10 15 20 25 30 35 40 45 50 55 60
CP16 CP15
Per cent of GDP Per cent of GDP

Kapitel 1
[Publikationens titel] · [måned, år] 1
Chapter 6 Public finances and Institutional Framework
Denmark’s Convergence Programme 2016 · April 2016 83
As part of the budget bill for 2016 expenditure ceilings for the new fourth year 2019 has been adopted as well as adjusted expenditure ceilings for 2015-18. The expenditure ceilings reflect the central government’s economic policy and priorities, including the consolidation of public finances in order to ensure a margin against the Budget Law structural deficit. Furthermore, the expenditure ceilings for 2016-19 reflect an annual reprioritization contribution in munici-palities and regions.
6.1 Institutional framework With the Budget Law from 2012 a structural budget deficit limit has been adopted. Thus, the structural budget balance as the key measure in planning and monitoring fiscal policy has been fixed by law. The balance requirement of the Fiscal Compact is operationalized by the Budget Law, since the annual structural deficits must not exceed ½ per cent of GDP, which also corresponds to Denmark's nationally set MTO. Furthermore, the Budget Law also intro-duced binding and multiannual expenditure ceilings for central government, municipalities and regions, respectively, starting from 2014. Key elements of the Danish Budget Law are described in box 6.1 and in greater detail in Denmark’s Convergence Programme 2014 and 2015.
6. Public finances and Institutional Framework Nyt
Economic policy is planned within the framework given by the Danish Budget Law, the 2020-plan and the Stability and Growth Pact. The framework specifies concrete ob-jectives for public finances in the form of long-term sustainable public finances and at least structural budget balance in 2020. The goals are supported by multi-annual expenditure ceil-ings, which are set for a continuous four year forward looking period for central government, municipalities and regions, respectively. The expenditure ceilings are based on a precaution-ary principle, and thus only incorporate the impact of reforms and initiatives agreed upon by a majority in the Danish Parliament. The expenditure ceilings are subject to continuous evaluation and monitoring to ensure com-pliance. Economic sanctions support compliance with the adopted expenditure ceilings, and compliance with approved budgets has improved in recent years.

Kapitel 6 Public finances and Institutional Framework
Denmark’s Convergence Programme 2016 · April 2016 84
Box 6.1
Key elements of the Danish Budget Law
Within the framework of a sustainable fiscal policy, a budget balance requirement is introduced.
The annual structural budget balance must not exceed a deficit of ½ per cent of GDP
at the time of the budget proposal for a given fiscal year unless extraordinary circumstances are
present. Moreover, an automatic correction mechanism is activated in case of a significant
estimated deviation from the budget balance requirement.
Expenditure ceilings support compliance with the overall fiscal policy targets. The ceilings set legally bind-
ing limits for expenditures in central government, municipalities and regions,
respectively. The expenditure ceilings are to be adopted by the Danish Parliament (Folketinget) and cover
a continuous forward looking period of 4 years. Improved budget management and economic sanctions
support compliance with the expenditure ceilings.
The Danish Economic Council continually (annually) assesses long-term fiscal sustainability and the
medium-term development in the budget balance, and further that the expenditure ceilings are complied
with and aligned with the medium-term fiscal objectives.
The key focal points for Danish economic policy – the fixed exchange rate policy and stability oriented fiscal policy – are as follows: Since 1982 Denmark has pursued a fixed exchange rate policy, initially against the German /Deutsch Mark (DEM) and since 1999 against the euro (EUR). Due to the fixed exchange rate policy the Danish monetary policy is solely aimed at maintaining a stable level of the krone vis-à-vis the euro. A responsible and stability-oriented economic policy contributes to a credi-ble fixed exchange rate policy, which supports continued low interest rates. Fiscal policy is planned in order to ensure that annual structural budget deficits does not ex-ceed ½ per cent of GDP, and that gradual progress is made towards the target of at least structural balance in 2020. Fiscal policy is planned in order to achieve a long-term sustaina-ble development in public finances (i.e. the so-called sustainability indicator HBI must always be positive). As stated in the Budget Law, fiscal policy is subject to a precautionary principle, which implies that planned development of public spending can rely only on reforms and initi-atives which is backed by a majority in the Danish Parliament. The expenditure policy supports compliance with the fiscal policy objectives through expendi-ture ceilings for central government, municipalities and regions that cover approx. ¾ of total public expenditures. The expenditure ceilings underpin that public expenditure evolves in compliance with medium-term fiscal objectives and priorities. Tax policy is based on a tax and burden stop and a number of political agreements, including the tax reform from June 2012, the Agreements on Growth Plan DK (from 2013) and the agreements related to Growth Package 2014 (from 2014). Furthermore, tax policy is planned in order to implement a JobReform with the overall purpose to make-work-pay better. As part of the agreement on social assistance/cash benefit (November 2015) and the agreement on

Chapter 6 Public finances and Institutional Framework
Denmark’s Convergence Programme 2016 · April 2016 85
introducing an integration allowance (July 2015) it was agreed that the proceeds are re-served to finance tax cuts in JobReform phase II in 2016.1 Furthermore, with the agreement on the budget bill for 2016 the proceeds from the so-called reimbursement reform (i.e. central government reimbursements of municipal expenditure) has been used to finance a reduction of the inheritance tax applicable to generational changes in small family-owned companies.
6.2 The Budget Law and improved expenditure control The introduction of binding and multiannual expenditure ceilings for central government, mu-nicipalities and regions contribute to strengthen expenditure control. Expenditure ceilings have currently been determined by law for the years up to and including 2019. The expenditure ceilings are determined in line with fiscal policy objectives and based on the precautionary principle. Thus, financed growth in public consumption expenditure in the me-dium-term projection is closely related to the expenditure policy defined by the specific ex-penditure ceilings. This fundamentally contributes to a credible financing of future public ex-penditures. Compliance of expenditure ceilings is supported by economic sanctions. The sanction mech-anisms are described in further detail in Denmark’s Convergence Programme 2015. The expenditure ceilings were met by a certain margin in 2014, cf. table 6.1. The final ex-penditure control for central government – based on central government accounts for 2015 – shows that the two separate central government expenditure ceilings were complied with in 2015. Likewise, local government accounts for 2015 show that both municipal and regional expenditure ceilings were complied with in 2015.
1 The agreements are only available in Danish as Aftale om et kontanthjælpssystem, hvor det kan betale sig at arbejde – Job-reform fase I (November 2015) and Aftale om indførelse af integrationsydelse for nytilkomne og herboende udlændinge (July 2015) at www.bm.dk.

Kapitel 6 Public finances and Institutional Framework
Denmark’s Convergence Programme 2016 · April 2016 86
According to the budgets for 2016 central government, municipal and regional expenditure comply with expenditure ceilings in 2016. The law proposals for adjusted expenditure ceilings in 2015-18 and expenditure ceilings for the new fourth year 2019 were adopted in December 2015 along with the budget bill for 2016. The specific expenditure ceilings for central government, municipalities and regions for 2016-19 are shown in table 6.2. The adjusted expenditure ceilings for 2015-18 are due to the change of government and re-flect the government’s economic policy and priorities. Furthermore, new information in August 2015 weakened public finances and as a consequence public finances have been consoli-dated as part of the budget bill for 2016. Thus, the central government sub-ceiling for operat-ing expenditures was reduced by DKK 5 bn. in 2016 and 2017 and DKK 3 bn. in 2018.
Table 6.2
Expenditure ceilings for central government, municipalities and regions 2016-19
DKK bn. (2016 prices) 2016 2017 2018 2019
Central government sub-ceiling for operating expenditures 182.2 190.4 199.7 205.8
Central government sub-ceiling for income transfers 257.4 257.5 254.5 252.6
Municipal expenditure ceiling 237.4 235.0 232.7 230.4
Regional sub-ceiling for health expenses 107.4 107.4 107.3 107.2
Regional sub-ceiling for development 3.0 3.0 2.9 2.9
Source: Budget bill for 2016.
The adopted expenditure ceilings for the period 2016-19 reflect an annual reprioritization con-tribution of 1 per cent in municipalities and 1 per cent regarding regional spending on devel-opment and administrative cost in the health care sector. The reprioritization contribution in municipalities and regions are included in the central government sub-ceiling for operating
Table 6.1
Expenditures and expenditure ceilings, 2014-16 – ceilings stated in brackets
DKK bn. (current prices) 2014 2015 2016
Central government sub-ceiling for operating expenditure 178.8 (185.3) 179.3 (188.4) 182.2 (182.2)
Central government sub-ceiling for income transfers 247.8 (252.3) 250.9 (257.7) 254.3 (257.4)
Municipal expenditure ceiling 227.8 (230.2) 231.5 (233.2) 237.2 (237.4)
Regional sub-ceiling for health expenses 102.3 (102.6) 104.6 (104.7) 107.4 (107.4)
Regional sub-ceiling for development 2.9 (2.9) 3.0 (3.0) 3.0 (3.0)
Note: The expenditures in 2014-15 are based on account figures, while the expenditures in 2016 are based on budgets for 2016.

Chapter 6 Public finances and Institutional Framework
Denmark’s Convergence Programme 2016 · April 2016 87
expenditures in accordance with standard practice. As part of the annual block grant to local governments it is possible to reprioritize between central government and municipal and re-gional operating expenditures. In order to maintain a structural deficit of 0.4 per cent of GDP in 2017 a technical downward adjustment of public consumption expenditure amounting to DKK 2 bn. in 2017 is incorpo-rated in the forecast. This corresponds to a technically assumed lower consumption with re-spect to the central government sub-ceiling for operating expenditures in 2017. The details on fiscal policy for 2017 will be carried out during 2016 including the central government budget bill for 2017 and the annual agreements with municipalities and regions on their economy for the coming year. Fiscal policy planning for 2017 – and the implications for deployment of ex-penditure ceilings – will rely on an overall assessment of public finances in 2017.

Kapitel 1
[Publikationens titel] · [måned, år] 1

Annex tables according to the EU’s “Code of Conduct”
Denmark’s Convergence Programme 2016 · April 2016 89
Table 1a
Macroeconomic prospects
2015 2015 2016 2017 2018 2019 2020
DKK bn. Rate of change, per cent
Real GDP 1,858.11) 1.2 1.1 1.7 2.2 2.2 1.9
Nominal GDP 1,985.8 2.2 2.3 3.5 4.2 4.2 4.1
Components of real GDP
Private consumption 888.91) 2.1 1.8 1.8 2.2 2.3 1.9
Government consumption 489.11) 0.6 1.1 0.0 1.2 0.7 0.2
Gross fixed capital formation 362.11) 1.2 1.8 4.1 5.5 6.4 5.7
Changes in inventories2) -0.3 0.1 0.0 0.2 0.0 0.0
Export of goods and services 992.51) -1.0 1.9 4.3 4.2 4.5 3.9
Import of goods and services 881.11) -1.4 3.1 4.6 5.7 5.9 4.8
Contributions to real GDP growth Percentage points
Final domestic demand 1.4 1.5 1.7 2.5 2.6 2.2
Changes in inventories2) -0.3 0.1 0.0 0.2 0.0 0.0
External balance of goods and services 0.1 -0.4 0.1 -0.5 -0.5 -0.3
1) Based on chained 2010-prices. Growth rates are also based on chained indices. 2) Contribution of change in stock to GDP growth. Source: Statistics Denmark and own calculations.
Annex tables according to the EU’s “Code of Conduct”

Annex tables according to the EU’s “Code of Conduct”
Denmark’s Convergence Programme 2016 · April 2016 90
Table 1b
Price developments
2015 2015 2016 2017 2018 2019 2020
Level Rate of change, per cent
GDP-deflator 106.9 1.0 1.1 1.7 2.0 2.0 2.2
Private consumption deflator 107.1 0.6 0.7 1.7 1.5 1.6 1.7
Consumer price index 107.2 0.5 0.7 1.7 1.7 1.7 1.9
HICP 106.3 0.2 0.6 1.6 1.6 1.6 1.7
Net price index 106.9 0.7 1.2 1.9 1.6 1.7 1.8
Public consumption deflator1 106.3 1.0 1.1 1.9 2.2 2.4 2.6
Investment deflator 104.5 0.9 1.1 2.5 2.2 2.0 2.2
Export price deflator 106.6 3.1 0.9 1.2 2.0 2.0 2.1
Import price deflator 105.7 2.8 0.4 1.5 1.8 1.7 1.9
Note: For all price indices 2010=100. Source: Statistics Denmark and own calculations.
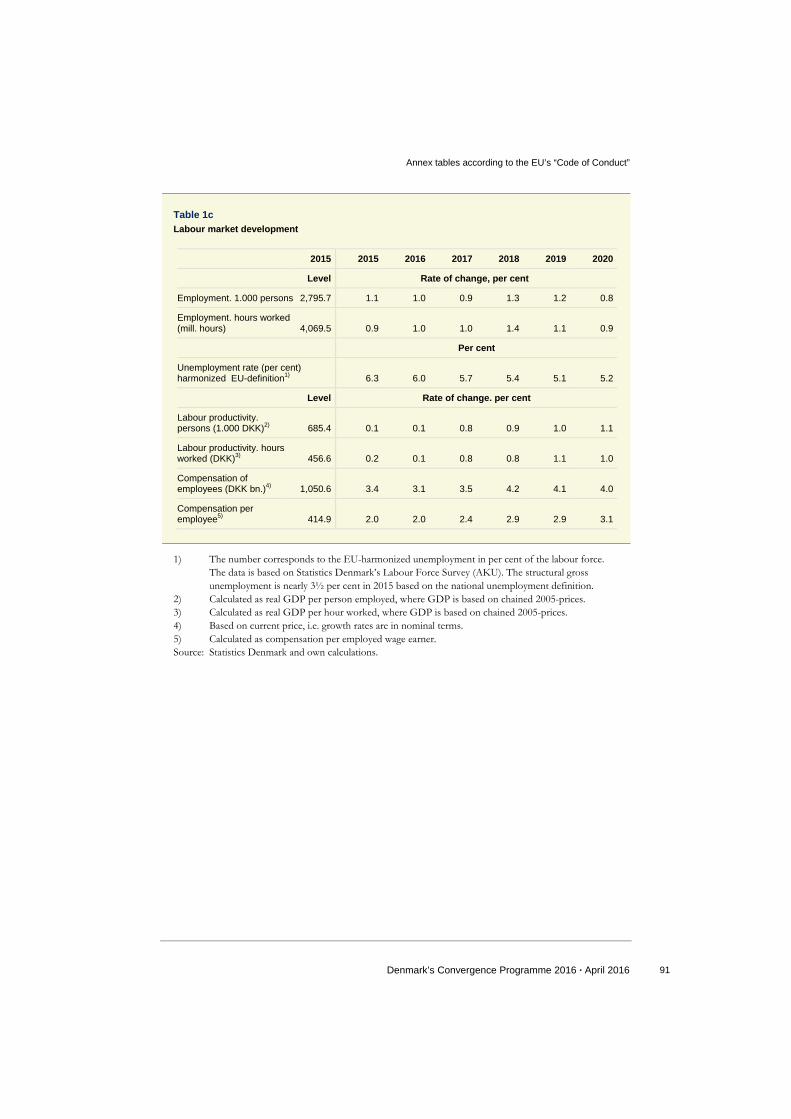
Annex tables according to the EU’s “Code of Conduct”
Denmark’s Convergence Programme 2016 · April 2016 91
Table 1c
Labour market development
2015 2015 2016 2017 2018 2019 2020
Level Rate of change, per cent
Employment. 1.000 persons 2,795.7 1.1 1.0 0.9 1.3 1.2 0.8
Employment. hours worked (mill. hours) 4,069.5 0.9 1.0 1.0 1.4 1.1 0.9
Per cent
Unemployment rate (per cent) harmonized EU-definition1) 6.3 6.0 5.7 5.4 5.1 5.2
Level Rate of change. per cent
Labour productivity. persons (1.000 DKK)2) 685.4 0.1 0.1 0.8 0.9 1.0 1.1
Labour productivity. hours worked (DKK)3) 456.6 0.2 0.1 0.8 0.8 1.1 1.0
Compensation of employees (DKK bn.)4) 1,050.6 3.4 3.1 3.5 4.2 4.1 4.0
Compensation per employee5) 414.9 2.0 2.0 2.4 2.9 2.9 3.1
1) The number corresponds to the EU-harmonized unemployment in per cent of the labour force. The data is based on Statistics Denmark’s Labour Force Survey (AKU). The structural gross unemployment is nearly 3½ per cent in 2015 based on the national unemployment definition.
2) Calculated as real GDP per person employed, where GDP is based on chained 2005-prices. 3) Calculated as real GDP per hour worked, where GDP is based on chained 2005-prices. 4) Based on current price, i.e. growth rates are in nominal terms. 5) Calculated as compensation per employed wage earner. Source: Statistics Denmark and own calculations.

Annex tables according to the EU’s “Code of Conduct”
Denmark’s Convergence Programme 2016 · April 2016 92
Table 1d
Sectoral balances
2015 2016 2017 2018 2019 2020
Per cent of GDP
Net lending/borrowing vis-a-vis the rest of the world 7.0 7.7 7.5 7.1 6.7 6.3
Of which:
- Balance of goods and services 6.4 6.1 5.9 5.4 4.9 4.7
- Balance of primary incomes and transfers 0.6 1.7 1.6 1.7 1.8 1.7
- Capital account 0.0 0.0 0.0 0.0 0.0 0.0
Net lending of the private sector 9.0 10.0 9.5 8.9 8.0 6.4
Net lending of general government -2.1 -2.3 -1.9 -1.8 -1.3 0.0
Statistical discrepancy 0.0 0.0 0.0 0.0 0.0 0.0
Source: Statistics Denmark and own calculations.

Annex tables according to the EU’s “Code of Conduct”
Denmark’s Convergence Programme 2016 · April 2016 93
Table 2a
General government budgetary prospects (EDP-basis)
2015 2015 2016 2017 2018 2019 2020
DKK bn. Per cent of GDP
Net lending (EDO B.9) by sub-sector
General government (EDP-form) -41.1 -2.1 -2.3 -1.9 -1.8 -1.3 0.0
Central government -43.6 -2.2 -2.3 -1.9 -1.8 -1.3 0.0
Local government 2.4 0.1 0.0 0.0 0.0 0.0 0.0
Social security funds 0.1 0.0 0.0 0.0 0.0 0.0 0.0
General government (S13)
Total revenue 1,041.1 52.4 51.2 50.5 49.9 49.8 50.4
Total expenditure 1,082.2 54.5 53.5 52.5 51.7 51.1 50.4
Net lending -41.1 -2.1 -2.3 -1.9 -1.8 -1.3 0.0
Interest expenditures 31.6 1.6 1.2 1.2 1.1 1.2 1.2
Primary balance1)
-9.5 -0.5 -1.1 -0.8 -0.7 -0.1 1.2
One-off effects2)
-0.2 -0.8 -0.8 -1.2 -1.1 0.0
Selected components of revenue
Total taxes3)
929.4 46.8 45.8 45.2 44.4 44.3 45.0
Taxes on production and imports 328.5 16.5 16.5 16.4 16.3 16.3 16.3
Current taxes on income and wealth etc. 594.3 29.9 29.1 28.5 27.8 27.8 28.4
Capital taxes 5.2 0.3 0.2 0.2 0.2 0.2 0.2
Social contributions4)
1.4 0.1 0.1 0.1 0.1 0.1 0.1
Property income5)
20.3 1.0 0.8 0.8 0.8 0.8 0.8
Other (residual) 6)
91.4 4.6 4.6 4.6 4.7 4.7 4.6
Total revenue 1,041.1 52.4 51.2 50.5 49.9 49.8 50.4
p.m.: Tax burden7)
932.7 47.0 46.0 45.3 44.6 44.5 45.1

Annex tables according to the EU’s “Code of Conduct”
Denmark’s Convergence Programme 2016 · April 2016 94
Table 2a (continued)
General government budgetary prospects (EDP-basis)
2015 2015 2016 2017 2018 2019 2020
DKK bn. Per cent of GDP
Selected components of expenditure 509.7 25.7 25.6 25.2 25.0 24.8 24.5
Compensation of employees and intermediate consumption 326.8 16.5 16.4 16.1 16.0 15.8 15.6
- compensation of employees 182.9 9.2 9.2 9.1 9.1 9.0 8.9
- intermediate consumption 383.3 19.3 19.2 18.9 18.5 18.2 18.0
Total social transfers 30.3 1.5 1.5 1.5 1.5 1.5 1.5
- social transfers in kind6)
353.0 17.8 17.7 17.4 17.1 16.8 16.5
- other than in kind 31.6 1.6 1.2 1.2 1.1 1.2 1.2
Interest expenditures 39.9 2.0 2.0 1.9 1.7 1.7 1.7
Subsidies 71.7 3.6 3.5 3.4 3.2 3.2 3.2
Gross fixed capital formation 8.9 0.4 0.4 0.3 0.3 0.2 0.3
Capital transfers 59.5 3.0 2.6 2.6 2.7 2.6 2.6
Other (residual) 6)
1,082.2 54.5 53.5 52.5 51.7 51.1 50.4
Total expenditure 519.7 26.2 26.2 25.8 25.6 25.3 25.0
p.m.: Public consumption
1) Defined as the EDP-definition the net lending plus EDP-definition of the interest expenditures. 2) Based on the calculation of the structural budget balance and includes temporary variations in
revenues from pension yield taxation, North Sea activities, net interest, corporate taxes and other special items. The structural budget balance is not calculated on EDP-basis. The calculations of the structural budget balance are based on public finances according to national account principles.
3) Defined as the sum of taxes on production and imports, current taxes on income, wealth, etc. and capital taxes. Does not include compulsory social contributions, which are traditionally included in the tax burden.
4) Does not include voluntary and imputed social contributions, since these are not included in the tax burden.
5) Incl. interest income and dividends and land rent etc. 6) Statistic Denmark does not publish figures for all the subgroups
(P.11+P.12+P.131+D.39+D.7+D.9 (other than D.91) D.6311. D.63121. D.63131. D.29+D.4 (other than D.41) +D.5+D.7+D.9+P.52+P.53+K.2+D.8), and no estimates are available for these individual components in the projections.
7) Defined as the sum of taxes on production and imports (incl. those collected by the EU), current taxes on income, wealth etc. and capital taxes and compulsory social contributions.
Source: Statistics Denmark and own calculations.

Annex tables according to the EU’s “Code of Conduct”
Denmark’s Convergence Programme 2016 · April 2016 95
1) The cyclical unemployment benefit expenditure consists of the cost of unemployment benefits and social assistance for unemployed (both excluded the cost of people in activation programmes).
Source: Statistics Denmark and own calculations.
Table 2b
No-policy change projections
2015 2015 2016 2017 2018 2019 2020
DKK bn. Per cent of GDP
Total revenue at unchanged policies 1,041.1 52.4 51.2 50.5 49.9 49.8 50.5
Total expenditure at unchanged policies 1,082.2 54.5 54.0 53.5 52.4 51.8 51.4
Table 2c
Amounts to be excluded from the expenditure benchmark
2015 2015 2016 2017 2018 2019 2020
DKK bn. Per cent of GDP Expenditure on EU programmes fully matched by EU funds revenue 0.0 0.0 0.0 0.0 0.0 0.0 0.0 Cyclical unemployment benefit expenditure1) 18.7 0.9 0.9 0.8 0.8 0.7 0.7
Effect of discretionary revenue measures 0.9 0.0 -0.1 0.1 0.0 0.0 -0.1
Revenue increases mandated by law 0.0 0.0 0.0 0.0 0.0 0.0 0.0

Annex tables according to the EU’s “Code of Conduct”
Denmark’s Convergence Programme 2016 · April 2016 96
Table 3
General government expenditure by function
COFOG 2014 2015
Per cent of GDP
General public service 1 7.2 7.3
Defence 2 1.2 1.2
Public order and safety 3 1.0 1.0
Economic affairs 4 3.6 3.8
Environmental protection 5 0.5 0.4
Housing and community amenities 6 0.2 0.3
Health 7 8.7 8.7
Recreation. culture and religion 8 1.8 1.8
Education 9 7.2 7.2
Social protection 10 24.5 24.1
Total expenditures1)
TE 56.0 55.7
Note: Short-term and longer-term projections do not include general government expenditures by function. The focus of both short-term and longer-term projections is public expenditures by type of transaction. 2014 is based on accounting figures while 2015 is based on budget figures.
1) The estimate for the total expenditure-to-GDP ratio in Statistics Denmark’s calculation deviates from the estimate in table 2a due to definitional differences in the approach of calculation (table 2a includes depreciations in public consumption, which is not the case in Statistics Denmark’s approach).
Source: Statistics Denmark and own calculations.

Annex tables according to the EU’s “Code of Conduct”
Denmark’s Convergence Programme 2016 · April 2016 97
Table 4
General government debt developments
2015 2016 2017 2018 2019 2020
Per cent of GDP
Gross debt 40.2 38.9 38.0 37.9 37.1 35.1
Change in gross debt ratio1)
-4.6 -1.3 -0.9 0.0 -0.9 -2.0
Change in gross debt2)
-3.6 -0.4 0.4 1.5 0.7 -0.5
Contributions to change in gross debt
Primary balance3)
-0.5 -1.1 -0.8 -0.7 -0.1 1.2
Interest expenditure4)
1.6 1.2 1.2 1.1 1.2 1.2
Stock-flow adjustment5)
-4.7 -0.6 0.0 1.0 -0.5 -2.8
p.m. implicit interest rate on debt6)
3.6 3.1 3.1 3.1 3.3 3.3
Other relevant variables
Central government account in Danmarks Nationalbank 7.9 5.1 3.6 3.4 3.3 3.2
Public net debt7)
5.0 7.2 8.9 10.0 10.7 10.1
Net debt in central and local governments
7) 5.0 7.2 8.9 10.1 10.7 10.1
1) Change in gross debt ratio is defined as Dt/GDPt – Dt-1/GDPt-1, where D is public debt measured in nominal terms (DKK).
2) Change in gross debt is defined as Dt/GDPt – Dt-1/GDPt, where D is public debt measured in nominal terms (DKK).
3) As defined in table 2a. 4) As defined in table 2a. 5) At present information is not available to split stock-flow adjustment into subgroups. 6) Proxied by interest expenditures divided by the debt level of the previous year. 7) In the estimate of the public net debt and the net debt in central and local governments, the central
governments deposit in Danmarks Nationalbank together with the central governments additional assets are subtracted.
Source: Statistics Denmark and own calculations.

Annex tables according to the EU’s “Code of Conduct”
Denmark’s Convergence Programme 2016 · April 2016 98
Table 5
Cyclical developments
2015 2016 2017 2018 2019 2020
Per cent
Real GDP growth 1.2 1.1 1.7 2.2 2.2 1.9
Per cent of GDP
General government balance -2.1 -2.3 -1.9 -1.8 -1.3 0.0
Interest expenditure1)
1.6 1.2 1.2 1.1 1.2 1.2
One-off effects2)
-0.2 -0.8 -0.8 -1.2 -1.1 0.0
Per cent
Potential GDP growth3) 0.8 0.9 1.3 1.8 1.8 1.9
Percentage points
Of which, contribution from:
- Labour 0.3 0.3 0.4 0.4 0.5 0.5
- Of which labour force 0.4 0.3 0.3 0.5 0.4 0.5
- Capital 0.2 0.3 0.5 0.6 0.8 0.8
- Total factor productivity 0.2 0.4 0.4 0.8 0.6 0.7
Per cent of GDP
Output gap -1.4 -1.2 -0.7 -0.3 0.0 0.0
Cyclical component4)
-1.3 -1.1 -0.7 -0.4 0.0 0.0
Structural budget balance5)
-0.6 -0.4 -0.4 -0.3 -0.2 0.0
Primary structural budget balance
5) -0.2 0.0 0.1 0.2 0.3 0.4
1) As defined in table 2. 2) Based on the calculation of the structural budget balance and includes temporary variations in
revenues from pension yield taxation, North Sea activities, net interest, corporate taxes and other special items.
3) Including a contribution from indirect taxes (in real terms). 4) The calculation of the cyclical component is based on the output gap. 5) The structural budget balance is not calculated on EDP-basis. The calculations of structural budget
balance are based on public finances according to national account principles. The primary structural budget balance is based on an actual primary balance defined via net interest expenditures and not gross interest expenditures.
Source: Statistics Denmark and own calculations.

Annex tables according to the EU’s “Code of Conduct”
Denmark’s Convergence Programme 2016 · April 2016 99
Table 6
Divergence from previous update
2015 2016 2017 2018 2019 2020
Rate of change, per cent
Real GDP growth
- Previous update 1.6 2.0 1.9 2.4 2.4 1.8
- Current update 1.2 1.1 1.7 2.2 2.2 1.9
- Difference -0.4 -0.9 -0.1 -0.2 -0.2 0.1
Per cent of GDP
Output gab (per cent of GVA)
- Previous update -1.9 -1.5 -1.0 -0.5 0.0 0.0
- Current update -1.4 -1.2 -0.7 -0.3 0.0 0.0
- Difference 0.5 0.3 0.3 0.2 0.0 0.0
Actual budget balance1)
- Previous update -1.6 -2.6 -2.7 -1.8 -1.1 0.0
- Current update -2.1 -2.3 -1.9 -1.8 -1.3 0.0
- Difference -0.4 0.3 0.7 0.0 -0.2 0.0
Gross debt level
- Previous update 39.8 39.4 39.0 38.3 37.0 36.7
- Current update 40.2 38.9 38.0 37.9 37.1 35.1
- Difference 0.4 -0.5 -1.0 -0.3 0.1 -1.6
Source: Own calculations.

Annex tables according to the EU’s “Code of Conduct”
Denmark’s Convergence Programme 2016 · April 2016 100
Table 7
Long-term sustainability of public finances
2005 2010 2020 2030 2040 2050 2060 2070
Per cent of GDP
Total expenditure 50.3 55.9 50.4 51.0 52.4 52.3 50.7 50.0
Of which:
- Age-related expenditure 26.9 30.3 28.3 28.4 28.9 28.6 27.5 27.4
- Pension expenditure 9.2 10.0 9.5 9.2 8.9 8.4 7.6 7.5
- Social security pension 7.1 7.8 7.6 7.2 6.9 6.1 5.2 5.0
- Old-age and early pensions 2.1 2.2 1.8 1.9 2.0 2.3 2.5 2.5
- Other pensions - - - - - - - -
- Occupational pensions 5.4 6.3 6.4 6.7 6.9 6.9 6.6 6.6
- Health care1) 2.0 2.3 2.4 2.9 3.5 3.9 4.1 4.1
- Long-term care1) 5.1 5.6 5.6 5.3 5.6 5.6 5.3 5.3
- Education expenditure 5.1 6.0 4.4 4.3 4.0 3.8 3.8 3.8
- Other age-related expenditures 2.1 1.9 1.2 1.7 2.1 2.3 2.1 1.6
Total Revenue 55.3 53.2 50.4 50.4 51.5 51.5 50.9 51.0
Of which:
- Property income2) 2.1 2.4 0.8 1.3 1.6 1.4 1.3 1.3
- Revenue from pension payouts net -1.0 -0.8 0.0 0.1 0.4 0.6 0.4 0.5
Pension reserve fund assets 125.4 140.3 169.3 180.3 194.1 198.3 200.0 206.7
Of which:
- Public pension fund assets 0.0 0.0 0.0 -0.1 -0.3 -0.5 -0.7 -1.0

Annex tables according to the EU’s “Code of Conduct”
Denmark’s Convergence Programme 2016 · April 2016 101
Table 7 (continued)
Long-term sustainability of public finances
2005 2010 2020 2030 2040 2050 2060 2070
Per cent
Assumptions
Labour productivity growth 0.4 3.9 1.0 1.3 0.7 1.0 1.0 0.8
Real GDP growth3)
2.4 1.6 1.9 1.7 1.4 1.7 1.4 1.2
Participation rate males (aged 20-64) 83.0 80.1 80.1 80.6 81.3 81.2 81.7 82.0
Participation rate females (aged 20-64) 76.5 75.0 75.7 76.5 76.9 77.1 77.5 77.9
Total participation rate (aged 20-64) 79.8 77.5 77.9 78.5 79.1 79.2 79.7 80.0
Unemployment rate4) 6.8 6.2 3.8 3.8 3.8 3.8 3.9 3.9
Structural unemployment 4.7 3.2 3.1 3.2 3.2 3.2 3.2 3.1
Population aged 65+, 1.000 persons 817.0 917.4 1,174.4 1,396 1,563 1,581 1,655 1,761
1) The cost of nursing homes is included in long-term care. 2) Includes public revenues from interest income and dividends. 3) In some years after 2025 GDP growth is effected by the regulation of early- and old age person
ages in line with longevity. 4) Registered gross unemployment (including people in activation programmes). Source: Statistics Denmark and own calculations.
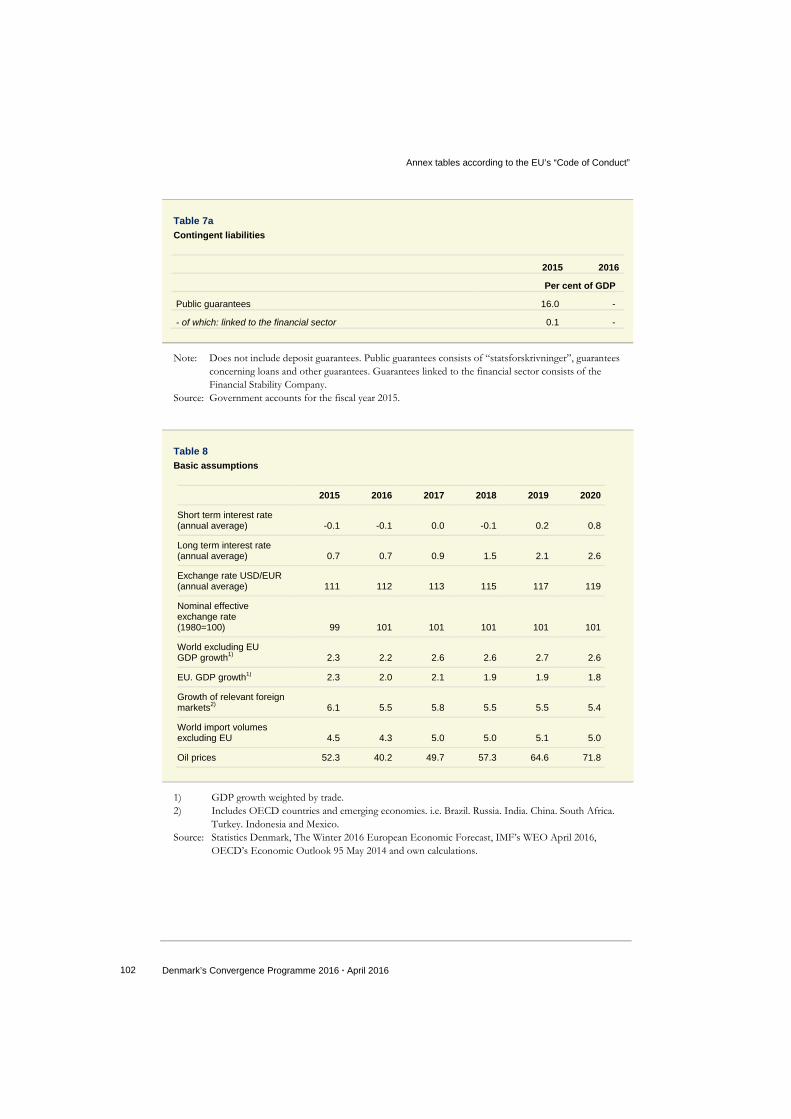
Annex tables according to the EU’s “Code of Conduct”
Denmark’s Convergence Programme 2016 · April 2016 102
Table 8
Basic assumptions
2015 2016 2017 2018 2019 2020
Short term interest rate (annual average) -0.1 -0.1 0.0 -0.1 0.2 0.8
Long term interest rate (annual average) 0.7 0.7 0.9 1.5 2.1 2.6
Exchange rate USD/EUR (annual average) 111 112 113 115 117 119
Nominal effective exchange rate (1980=100) 99 101 101 101 101 101
World excluding EU GDP growth1) 2.3 2.2 2.6 2.6 2.7 2.6
EU. GDP growth1) 2.3 2.0 2.1 1.9 1.9 1.8
Growth of relevant foreign markets2) 6.1 5.5 5.8 5.5 5.5 5.4
World import volumes excluding EU 4.5 4.3 5.0 5.0 5.1 5.0
Oil prices 52.3 40.2 49.7 57.3 64.6 71.8
1) GDP growth weighted by trade. 2) Includes OECD countries and emerging economies. i.e. Brazil. Russia. India. China. South Africa.
Turkey. Indonesia and Mexico. Source: Statistics Denmark, The Winter 2016 European Economic Forecast, IMF’s WEO April 2016,
OECD’s Economic Outlook 95 May 2014 and own calculations.
Table 7a
Contingent liabilities
2015 2016
Per cent of GDP
Public guarantees 16.0 -
- of which: linked to the financial sector 0.1 -
Note: Does not include deposit guarantees. Public guarantees consists of “statsforskrivninger”, guarantees concerning loans and other guarantees. Guarantees linked to the financial sector consists of the Financial Stability Company.
Source: Government accounts for the fiscal year 2015.

DENMARK´S CONVERGENCE PROGRAMME 2016
2015/16:9
In tables numbers do not necessarily sum to totals due to rounding.
Enquiries regarding this publication can be addressed toMinistry of FinanceChristiansborg Slotsplads 11218 Copenhagen KT 3392 3333
ISBN Electronic publication978-87-93214-89-7
Cover designKontrapunkt
The publication can be downloaded at fm.dk
5041 Printedmatter 0457
Rosendahls

Ministry of FinanceChristiansborg Slotsplads 11218 Copenhagen K
T 3392 3333fm.dk