department of agriculture and food annual report 2007
TRANSCRIPT

Annual Report 2007Department of Agriculture and Food

The Honourable Kim Chance, MLC Minister for Agriculture and Food; Forestry Parliament House PERTH WA 6000
Sir
In accordance with section 61 of the Financial Management Act 2006, I hereby submit for your information and presentation to Parliament, the Annual Report of the Department of Agriculture and Food for the financial year ended 30 June 2007.
The Annual Report has been prepared in accordance with the provisions of the Financial Management Act 2006.
Yours sincerely
Ian Longson
DIRECTOR GENERAL
DEPARTMENT OF AGRICULTURE AND FOOD
ISSN 1835-2383
Department of Agriculture and Food 3 Baron-Hay Court SOUTH PERTH WA 6151
Tel: (61) 9368 3333 Fax: (61) 9368 1205 Internet: www.agric.wa.gov.au
Department of Agriculture and Food, Western Australia Annual Report 2007
Letter from the Director General
Department of Agriculture and Food, Western Australia Annual Report 2007 1
Executive Summary 2Department Profi le 5Our Environment 6Department Structure 7Corporate Executive 7People and Finances 8Sectoral Snapshot 10Outcome Based Management Framework 11
Report on Operations 12Agency Performance 12
Signifi cant Issues and Trends 14Food and Fibre Industry Development Achievements 15Rangelands 15Grains 16Horticulture 18Animal Industries 20Trade and Development 21Agricultural Resource Management Achievements 22Biosecurity Achievements 24
Disclosures and Legal Compliance 27Performance Indicators 27Financial Statements 57Ministerial Directives 97Other Financial Disclosures 98Governance Disclosures 99Other Legal Requirements 100Government Policy Requirements 105
AppendicesAppendix 1 – Corporate Governance 108Appendix 2 - Statement from the Commissioner of Soil and Land Conservation 110Appendix 3 - Legislation 115Appendix 4 – Department Offi ces 118
Table of Contents

Department of Agriculture and Food, Western Australia Annual Report 20072
Executive Summary
The 2006/07 fi nancial year was a challenging one for both the Department of Agriculture and Food (DAFWA) and for the State’s primary producers. Western Australia experienced a diffi cult growing season and the agriculture sector continued to be confronted with a range of issues.
The farmers of Western Australia faced some of the toughest seasonal conditions in the State’s history due to a lack of rainfall. As a response, DAFWA established a Dry Season Incident Management Team to ensure that timely, consistent and appropriate advice was passed to all sectors of the agricultural industry. Feedback from farmers was very positive towards the Department’s Dry Season management and support.
On top of the diffi cult seasonal conditions the State also experienced an outbreak of Australian Plague Locusts in late 2006. As a result the Department put in place a response program to identify priority target zones for action, and to assist farmers to undertake their own spraying outside of these zones. With over 7,000 properties surveyed and over 500,000 hectares on more than 1,000 properties treated, the program was very successful in minimising the impact of these pests on the State’s agricultural and metropolitan areas. Farmers and local shire offi cials in the effected areas acknowledged the Department’s efforts and passed on their appreciation.
The State’s producers continued to operate in a challenging environment with the high value of the Australian dollar impacting on the competitiveness of WA’s exports; the increasing costs of production affecting business profi tability; the continuing failure of World Trade Organisation (WTO) talks to deliver liberalised trade in agricultural products; and increasing competition in global markets, especially from China. These challenges will continue to impact on the State’s rural businesses into the foreseeable future and DAFWA is committed to working collaboratively with producers and industry to enhance the viability of the State’s agriculture, food and fi bre sector.
The Department supported the State’s agri-food and fi bre industries through the delivery of three main high level services. The Food and Fibre Industry Development service continued to generate world class research and development, providing signifi cant benefi ts for Western Australian producers, the food industry sector and consumers. The $88 million invested in this area contributed to the development of value-added products through innovation and science, which has the potential to deliver real opportunities for the State’s agri-food export capacity. This service also contributed to meeting the increasing demand that effi cient market assurance and food integrity processes are in place to guarantee the standard, safety and quality of products of the State’s agri-food industries in local and international markets.
The transition in April 2006 to become the Department of Agriculture and Food has consolidated the Department’s efforts to assist the agricultural industry move from a commodity focus, to one of a partner in the production of higher value products for its customers - a through chain approach. Key achievements in its fi rst year included the start up of a new technology transfer service FoodNET Solutions; the provision of WA Food Industry Development Grants to enable industry innovation; and seed funding for the Food Industry Association of WA, to create a peak, united body to represent the interests of the WA food industry.
In late 2006/07 consultation work commenced on the development of a Food Strategy for Western Australia. This whole-of-government Strategy will encompass eight key areas which have the potential for positive and signifi cant impact on the State, being health, sustainability, food integrity, careers and skills, regional food development, business and investment, global focus and innovation.

Department of Agriculture and Food, Western Australia Annual Report 2007 3
Executive Summary
The three key outcomes of the Strategy include:
a highly developed food industry capable of responding to the challenges and opportunities of a globalised marketplace;
a healthy WA population that values its food industry; and
a sustainable regional community that supports, and is supported by its local food industry
The Agricultural Resource Management service is tasked with generating, integrating and applying knowledge which, together with appropriate policy and regulation, develops the capacity of rural communities and industries to profi t from environmentally responsible agriculture. The Department delivered this service through an investment of $39 million in its research, development and extension activities for developing and supporting sustainable agriculture and managing $98 million of grants for a range of joint Commonwealth/State programs.
The last service, Biosecurity, aims to develop policy and maintain regulations to ensure agriculture and related resources are protected and that safety and quality standards are upheld. With an investment of $81 million in this area, the Department continued to provide an effective barrier against biosecurity incursions from overseas and interstate passenger and freight movements into the State. This also contributed to protecting the State’s access to export markets because of our freedom from many major agricultural plant and animal pests and diseases.
Whilst working with primary producers to overcome the challenges that confront the State’s agri-food and fi bre sector, the Department achieved signifi cant progress in ensuring it has the capability to continue to assist them into the future. Agricultural Research Western Australia (ARWA) continues to move forward with the incorporation of CSIRO’s Floreat-based Centre for Environmental and Life Sciences group as a fi fth member of the alliance. This alliance involves a major research program being developed in regard to climate change; and the growing prospect of a collaborative research precinct based at CSIRO’s Floreat site and the adjoining UWA Shenton Park Research Station.
The Climate Initiative focuses on providing farmers and others with the capacity to assess the risks of a changing climate to their individual enterprises and to make effective responses to those risks. The initiative is likely to lead the overall Western Australian response to climate change, with much of the information and methodologies likely to be adapted for use across all of the state’s industry sectors, communities and regions.
In addition, the Department has signed a Statement of Intent with Murdoch University to secure land for the Department to move its headquarters from its current South Perth location to the Murdoch campus. Building will commence on the new facilities in 2008 with an expected completion date of 2011. As well as these new, modern facilities Murdoch is also the planned location for the State Biosecurity Centre.
In terms of ensuring the Department has a modern legislative base to manage the services it delivers, the Biosecurity and Agricultural Management (BAM) Bill was also introduced and is currently proceeding through Parliament. The BAM Bill, which will replace 17 existing Acts within the Agriculture portfolio, is aimed at improving WA’s capacity to prevent harmful pests and diseases from impacting the State’s primary industries, and improving the effi cient regulation of the State’s agri-food sector. If enacted, this new legislation will provide the Department with the tools it needs to continue to support the State’s primary producers.

Department of Agriculture and Food, Western Australia Annual Report 20074
Executive Summary
In conclusion, I would fi rst like to take this opportunity to express my appreciation for the genuine support the Department continues to receive from our Minister of Agriculture and Food, the Hon Kim Chance MLC, and the leadership he provides. I would like to especially thank our staff for the effort and initiative they have contributed throughout the year demonstrated through the numerous awards and accolades our staff have received, both locally and nationally. This professional recognition, together with positive feedback from farmers and agri-businesses, is evidence that the Department is continuing to make an important contribution to the sustainable future of the State’s agriculture, food and fi bre industries which support WA’s economy and underpin many of its regional and rural communities.
Ian LongsonDirector General
Department of Agriculture and Food

Department of Agriculture and Food, Western Australia Annual Report 2007 5
Department Profi le
Government’s Vision
“Western Australia will be a creative, sustainable and economically successful State that embraces the diversity of its people and values its rich natural resources. The Western Australian public sector will work towards providing the best opportunities for current and future generations to live better, longer and healthier lives.
It is the responsibility of the public sector to make decisions for tomorrow, not just for today.”
Our Vision
Making a difference - through excellence and innovation to grow Western Australia’s world class agriculture and food sector.
Outcomes
The Government expects our Department to deliver the following high-level outcomes:
Improved competitiveness and profi tability of agriculture, food and fi bre industries;
Improved sustainable management of agricultural resources; and
Effective management of biosecurity.
Our Values
We are committed to making a difference in all areas in which we work.
We value our customers’ requirement for high quality service delivery.
We work as a team, being supportive of each other, appreciative of others’ inputs and respecting their differences.
We encourage creativity, are receptive to new ideas, strive for continuous learning and improvement and share our knowledge.
We are honest and open in our communication and accept accountability for our dealings with others.
We value and respect the health and safety of our people.

Department of Agriculture and Food, Western Australia Annual Report 20076
Our Environment
Challenges
Facing Industry
Increasing consumer expectation for safe, quality, ethically and environmentally friendly produced food and fi bre products.
Increasing move towards consolidation of processing and retail businesses.
Cost-price squeeze.
Climate variability and climate change.
Loss of productive agricultural land and availability of suitable water supplies.
Increasing biosecurity threats.
Labour and skills shortages.
Access to suitable public infrastructure.
Scale of our agriculture and food sector (very small).
Rapidly changing international competition.
Facing the Department
Developing and maintaining a resource base (staff, budgets, knowledge and technology).
Ability to demonstrate value.
Ability to infl uence key stakeholders.
Being able to deliver services to the greatest need and in the most effi cient manner.
Opportunities
For Industry
Developments in food and fi bre technologies.
Increasing global demand for renewable energy and alternative fuel sources.
Preferred market access through the highest bio-safety status in the world.
International trade reform.
Development of functional foods.
Changing ownership and consolidation of farm businesses – introduction of alternative sources of funding.
Streamlining regulation.
For the Department
Agricultural Research Western Australia alliance.
Building on our leading edge research and development through collaborative partnerships.
Food industry development.
Regional Leadership role.
Delivery of rural services for Government.
Extending project management to operate across the whole Department.

Department of Agriculture and Food, Western Australia Annual Report 2007 7
Department Structure
Corporate Executive
Director GeneralMr Ian Longson
Executive Director Biosecurity and ResearchMr Rob Delane
Executive Director Industry and Rural Services Mr Roger O’Dwyer
Executive Director Natural Resource Management Mr David Hartley
Executive Director Food and TradeDevelopmentMr Henry Steingiesser
Executive Director Business ServicesMr Mike Marsh
The Hon Kim Chance MLCMINISTER FOR AGRICULTURE AND FOOD; FORESTRY
DIRECTOR GENERAL DEPARTMENT OF
AGRICULTURE AND FOOD
Agriculture Protection Board Rural Business Development Corporation
Internal Audit
Policy and Planning Biosecurity and Research
Industry and Rural Services
Natural Response Management
Food and Trade Development
Business Services
Planning and Evaluation
Policy Development
Legislation
Animal BiosecurityAnimal Industries
DevelopmentState NRM Program
DevelopmentMarket and Trade
DevelopmentFinance
Border Biosecurity and Emergency Responce
Horticulture Industry Development
Natural Resource Science Agri-industry Opportunity Asset Management
Grain Industries Development
Strategic NRM Analysis Food Industry Development Human Resources
Public Affairs
Animal Research
Farm Business Development
NRM Regional Delivery Soil and Land Conservation Act
AgWest International Information Services
Chief Economist
Project Management
Crop Research
Central Agricultural Region NRM - Integration Shared Services Implementation
ARWA
Intensive Plant ResearchSouthern
Agricultural Region
Northern Agricultural Region
Rangelands
Modelling and Economic Development
Plant Biosecurity
Invasive Species
South WestAgricultural Region
Agricultural Systems Research

Department of Agriculture and Food, Western Australia Annual Report 20078
People and Finances
The State Government remains the major source of funding for the Department of Agriculture and Food. Other major sources of funding are the Commonwealth Government, a range of industry sources (including industry research and development corporations), fees for services rendered and MOU agreements.
The following charts detail how the Department allocates its expenditure amongst its 3 main high level services that it delivers for Government, plus services it provides to the Rural Business Development Corporation. The three high level services are:
Food and Fibre Industry Development;1.
Agricultural Resource Management; and2.
Biosecurity.3.
The second chart illustrates how the Food and Fibre Industry Development service’s expenditure is broken down amongst industry areas.
24% Cwealth grants
15% Research grants
4% Other revenues
Revenue from State Govt 48%
5% MOU APB/APC/RBDC
4% Sale goods and services
34% Grants
8% Other expenses
Employee expenses 37%
14% Supplied and services
Depreciation 3%
Capital user charge 4%
Chart 2: Departmental Budget Allocation by Category
Chart 1: Sources of the Department’s Funding
2% Services provided to Rural Business Development Corp
44% Agricultural Resource Management
Biosecurity 26%
Food and Fibre Industry Development 28%
43% Grain Programs
13% WoolMeat 8%
Dairy and Apiculture 3%
New Industries 3%
Trade and Market Development 10%
Horticulture 20%
Chart 3: Departmental Budget Allocation by Service
Chart 4: Food and Fibre Industry Development Service Allocation by Industry Area

Department of Agriculture and Food, Western Australia Annual Report 2007 9
People and Finances
Below is a snapshot of the Department’s FTE levels taken at the 30th June for the last 5 years, and a breakdown of staff by categories. The Department’s staff numbers rose in 2006/07 due to a number of programs to address Australian Plague Locusts, European House Borer and European Starlings.
Chart 5: Department FTE totals as at 30 June 2007
Chart 6: FTE allocations by categories
1400
1450
1500
1550
1600
1650
1700
1750
06/0705/0604/0503/0402/03
Agen
cy F
TE
703 Professional
Admin and clerical 336
Technical 431
Wages 53
Inspectorial 137

Department of Agriculture and Food, Western Australia Annual Report 200710
Over most of the past 17 years the output growth for the State’s agriculture has exceeded the national agricultural output growth. Although the productivity growth for WA agriculture has declined in recent years it has continued to remain above the national average growth per annum.
Despite rapid expansion in the mining and construction sectors the State’s agricultural sector maintained its Gross State Product growth share above the average for all industries. It has been the third largest growth industry of the WA economy. Growth in the agriculture sector benefi ts the manufacturing (e.g. food processing and fertilizer, chemicals and machineries), transport, marketing and services sectors through forward and backward linkages.
Sectoral Snapshot
Chart 9: Employment in WA by sector - 2006/07
Chart 11: Exports of WA Agri-food and fi bre 2006/07 - A$4.2 billion
Chart 10: Production of WA Agri-food and fi bre 2006/07 - A$5.5 billion
Outp
ut In
dex
Western Australia (WA)Growth rate p.a.
= 4.4%AUSWA = 5.1%
Australia (AUS)
200180160140120100
80604020
089/90 90/91 91/92 92/93 93/94 94/95 95/96 96/97 97/98 98/99 99/00 00/01 01/02 02/03 03/04 04/05 05/06
Chart 7: Agricultural output (total factor income) trends in WA and Australia, 1989/90 to 2005/06 (Index 1989/90 = 100).
Note Australia includes WA.
Chart 8: Five-year average output (GSP) growth in WA by sectors 2001/02 to 2005/06
02468
10121416
EHWFIBTSCTARCONEGWMANMINAFF
Grow
th ra
te %
per
ann
um
AFF: Agriculture, forestry and fishing; MIN: Mining; MAN: Manufacturing; EGW: Electricity, gas and water; CON: Construction; TAR: Wholesale and retail trade, accommodation and recreation; TSC: Transport, storage and communication; FIB: Finance, insurance and business services and EHW: Education, health, welfare and other. (manufacturing includes food processing)
WA GSP growth (9.8%)
Industry Sectors
18% Wholesale and retail trade
Education 7%
Transport, communication and hospitality 5%
Other (incl. fisheries and recreational) 7%
Finance and business 14%
10% Construction
6% Public sector administration and utilities
Health and community services 10%
9% Agriculture and related industries
5% Mining
9% Manufacturing
Wool A$590m 11%
Meat and animals A$1,228m 22%
44% Cereals A$2,398m
8% Pulses, pastures and oilseeds A$419m
Horticulture(incl. sugar) A$646m 12%
3% Dairy, honey and eggs A$185m
Pulses, pastures and oilseeds A$196m 5%
Meat and animals A$926m 22%
Wool A$521m 13%
54% Cereals A$2,292m
Horticulture (incl. sugar) A$150m 4% 2% Dairy, honey and eggs A$83m

Department of Agriculture and Food, Western Australia Annual Report 2007 11
Outcome Based Management Framework
The State Government has outlined fi ve high level goals in terms of delivering services to the community in its “Better Planning: Better Futures” framework. These are Better Services, Jobs and Economic Development, Lifestyle and the Environment, Regional Development and Governance and Public Sector Improvement. The Department of Agriculture and Food delivers services to achieve outcomes across the following goals.
a. The achievements within the Food and Fibre Industry Development service, mostly of an industry research and development nature, are detailed on page 15.
b. The Department provides services to the Rural Business Development Corporation (RBDC) under a contract for services, services delivered are detailed within the RBDC’s Annual Report.
c. The achievements within the Agricultural Resource Management service, mainly related to the Department’s Natural Resource Management (NRM) activities, are detailed on page 22.
d. The achievements within the Biosecurity service, mainly related to the Department’s control of plant and animal pests and diseases and emergency response activities, are detailed on page 24.
Changes to Outcome Based Management Framework
The Department of Agriculture and Food’s Outcome Based Management Framework did not change during 2006/07
Shared Responsibilities with Other Agencies
The National Action Plan (NAP) for Salinity and Water Quality is jointly funded by the Australian Government and State Government. It brings governments and communities together, through Regional Natural Resource Management groups, to manage and improve salinity and water quality on a regional scale.
Under NAP, the Department of Agriculture and Food is the lead agency, together with the Department of Environment and Conservation, aiming to ensure that Western Australia has an environment in which resources are managed, developed and used sustainably, biological diversity is preserved and habitats protected. Specifi cally the target is to address the issue of salinity, which threatens signifi cant areas of the States natural resources as well as built assets and industries.
Government Goals
To develop a strong economy that delivers more jobs, more
opportunities and greater wealth to Western Australians by creating the conditions required
for investment and growth.
To ensure that Western Australia has an environment
in which resources are managed, developed and
used sustainably, biological diversity is preserved.
To ensure that regional Western Australia is strong
and vibrant.
Agency level Government desired outcome
Increased competitiveness and profi tability of
agriculture, food and fi bre industries.
Improved ecological sustainable development
of the agri-industry.
Effective management of biosecurity.
Service
1. Food and Fibre Industries Development a
4. Services provided to Rural Business Development
Corporation b
2. Agricultural Resource Management c
3. Biosecurity d

Department of Agriculture and Food, Western Australia Annual Report 200712
Outcome Based Management Framework
Five Western Australian regions - the South Coast, South West, Avon, Ord and Northern Agricultural - are earmarked for action under the plan. Regional NRM groups for these regions have developed, and are implementing strategies and investment plans which form the blueprint for achieving improved salinity, water quality and other NRM outcomes. The strategies have been accredited by both State and Australian Governments and projects that address priority management actions are currently being rolled out.
Report on OperationsAgency Performance
a. As specifi ed in the budget statements for the year 2006/07.
b. More details of the effectiveness indicators are in the Key Performance Indicator section.
c. A sample of indicators are displayed. More detail can be found within the Key Performance Indicator section of this report.
Government Desired Outcomes, Key Effectiveness Indicators and Targets
2006-07Targeta
2006/07Actualb
Variation
Desired Outcome: Increased competitiveness and profi tability of agriculture, food and fi bre industries.
Uptake of Department Varieties N/A 81% N/A
Exports to Select Markets from Trade and Development $272,600 m $287,739 m $15,139
Select Profi tability measures:
Carrot Exports $34 m $40 m $6 m
Potato Exports $1.4 m $1.2m -$0.2 m
Strawberry exports $9.5 m $6.2 -$3.3 m
Average diameter of wool sold at auction in Western Australia 21 21 0
Desired Outcome: Improved ecological sustainable development of agri-industry.
Average adoption of selected sustainable land management practices c:
Agronomy Practices (Farmed to soil type) 75% 73% 2%
Land Conservation Management (Tree/shrub planting)
65% 74% 9%
Resource Monitoring (Regular soil testing for nutrient levels) 75% 74% 1%
Surface Water Management (Water on sloping land) 55% 58% 3%
Desired Outcome: Effective management of biosecurity.Identifi cation of notifi able animal diseases 23 3 20
Number of animal diseases 6 2 4
Interceptions of signifi cant pests, diseases and weeds 305 180 125
Number of pests, diseases and weeds 72 53 19
Removal of properties from quarantine 103 142 39
Department of Agriculture and Food, Western Australia Annual Report 2007 13
Report on Operations
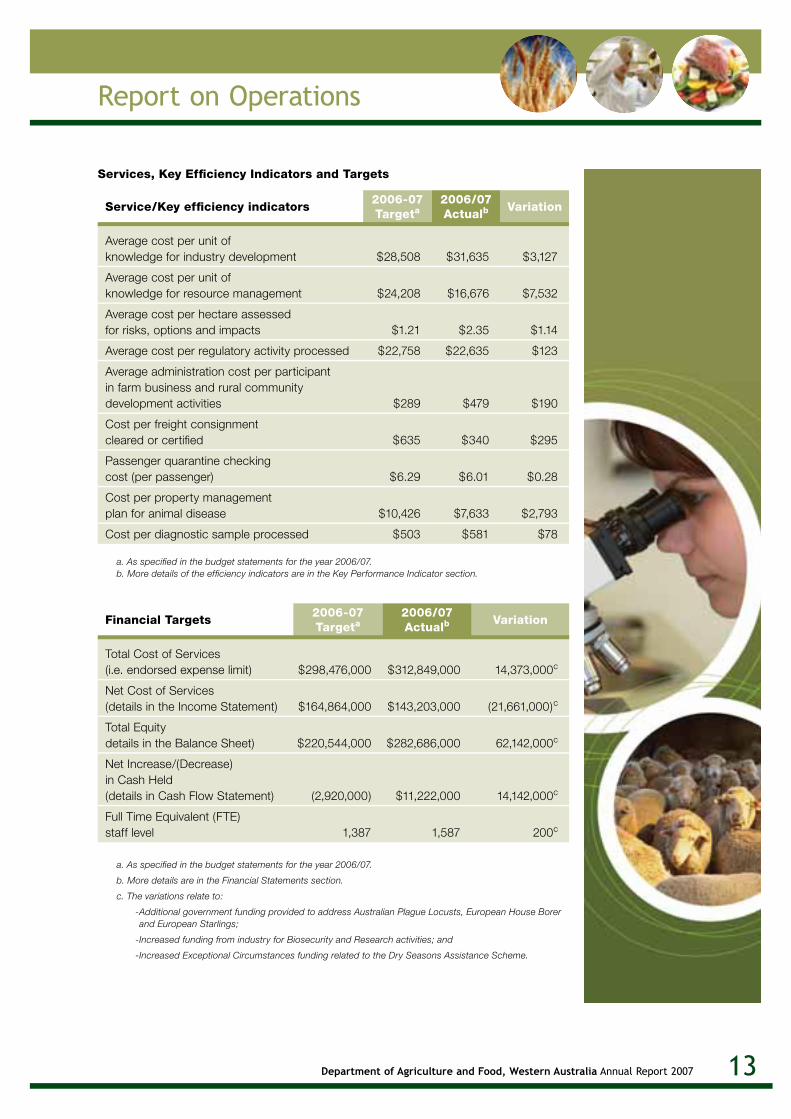
Services, Key Effi ciency Indicators and Targets
a. As specifi ed in the budget statements for the year 2006/07.b. More details of the effi ciency indicators are in the Key Performance Indicator section.
a. As specifi ed in the budget statements for the year 2006/07.
b. More details are in the Financial Statements section.
c. The variations relate to:
- Additional government funding provided to address Australian Plague Locusts, European House Borer and European Starlings;
- Increased funding from industry for Biosecurity and Research activities; and
- Increased Exceptional Circumstances funding related to the Dry Seasons Assistance Scheme.
Service/Key effi ciency indicators2006-07Targeta
2006/07Actualb
Variation
Average cost per unit of knowledge for industry development $28,508 $31,635 $3,127
Average cost per unit of knowledge for resource management $24,208 $16,676 $7,532
Average cost per hectare assessed for risks, options and impacts $1.21 $2.35 $1.14
Average cost per regulatory activity processed $22,758 $22,635 $123
Average administration cost per participant in farm business and rural community development activities $289 $479 $190
Cost per freight consignment cleared or certifi ed $635 $340 $295
Passenger quarantine checking cost (per passenger) $6.29 $6.01 $0.28
Cost per property management plan for animal disease $10,426 $7,633 $2,793
Cost per diagnostic sample processed $503 $581 $78
Financial Targets2006-07Targeta
2006/07Actualb
Variation
Total Cost of Services (i.e. endorsed expense limit) $298,476,000 $312,849,000 14,373,000c
Net Cost of Services (details in the Income Statement) $164,864,000 $143,203,000 (21,661,000)c
Total Equity details in the Balance Sheet) $220,544,000 $282,686,000 62,142,000c
Net Increase/(Decrease) in Cash Held (details in Cash Flow Statement) (2,920,000) $11,222,000 14,142,000c
Full Time Equivalent (FTE) staff level 1,387 1,587 200c

Department of Agriculture and Food, Western Australia Annual Report 200714
Signifi cant Issues and Trends
The Department of Agriculture and Food, in supporting the State’s agricultural, food and fi bre industries, takes account of the following signifi cant issues and trends when undertaking its strategic and project planning.
World population growth is stabilising, however, changing consumer trends coupled with economic growth and rising incomes will see changes in consumption patterns between and within regions, creating new opportunities.
Consumer demand is leading to international and national agreements, which increasingly specify standards for the consistent supply of safe, quality, environmentally friendly and ethically produced food and fi bre products.
Global sourcing of food and fi bre products and progressive deregulation of international trade will intensify competition for market share and premiums. There is an increasing move towards consolidation of processing and retail businesses.
The impact of greenhouse policies and dryland salinity will continue to adversely effect agricultural productivity and the area of land available for traditional agriculture. However, opportunities exist for new innovative forms of agriculture.
Strong pressure on both extensive and intensive agricultural land uses to control environmental impacts, and concerns over the loss of productive agricultural land and availability of suitable water supplies will necessitate innovative management solutions for sustainable development.
International trading policies, which require trading partners to scientifi cally justify biosecurity barriers will provide an opportunity for increased market access, while placing Western Australia’s biosecurity measures under close scrutiny.
Adoption of new food and fi bre production biotechnology coupled with more intensive production techniques will become a major driver for change. The introduction of functional foods will become progressively important in the market place opening up many opportunities.
Rapid development in communications technology will radically alter the way that information is stored and retrieved and the way both commercial and government business is conducted.
Regional communities continue to experience population decline and an associated reduction in core infrastructure.
Competing community demand for services at the State and Federal level will place pressure on availability of funds. Increased scale will be a driver for effective research and development. Partnerships and alliances between governments, countries, industry and academia will become increasingly important.
The concept of multifunctionality in agriculture will see countries supporting their agricultural businesses for non-economic objectives. This will continue to distort markets, making it increasingly diffi cult to gain entry to some major markets.
The cost-price squeeze will continue to affect farm profi tability. Real prices for farm commodities will keep on declining. Price infl ation will persist affecting the prices paid by farmers for their inputs. Farm operations have also become larger and more complex, requiring new skills and innovative techniques.
Management of risks will become increasingly critical to an effective agriculture, food and fi bre sector. Risks from climate variations, disease incursions, price fl uctuations, transmission of disease from livestock to humans, etc. will all require the development of risk management techniques.
Climate change has emerged as an issue with long-term implications for the agricultural and pastoral industry. The need to plan so that industries and farming systems can adapt to adverse changes in rainfall and temperature over the longer term has substantially increased.

Department of Agriculture and Food, Western Australia Annual Report 2007 15
Food and Fibre Industry Development Achievements
Rangelands
The Department’s New Opportunities for Tropical and Pastoral Agriculture (NOTPA) project identifi ed opportunities for expanded agricultural development in the West Kimberley and Pilbara. Major achievements to date include establishing strong linkages with horticultural growers, indigenous communities, environmental groups and other agencies. A Baseline Study was completed in June 2007, outlining the issues, opportunities and impediments that effect future development in the regions.
The Kimberley Indigenous Management Support (KIMS) project has expanded and is currently providing management support to 14 Indigenous pastoral leases. KIMS milestones during the 2006/07 fi nancial year include: Establishing a contractual relationship to allow free movement of Community Development Employment Program (CDEP) labour between pastoral properties; a partnership with the Halls Creek District High School to develop school based trainees agreements, in principle, with Argyle Diamonds, Halls Creek Shire and Kidman & CO to establish a pastoral training centre in the Halls Creek and East Kimberley region.
Pilbra Indigenous Management Support (PIMS) project is engaged with fi ve indigenous pastoral properties in the region. It provides a similar service to Aboriginal land managers to that of the KIMS project engaging in pastoral management activities, business management and planning, marketing, industry training, governance and capacity building. Within the fi rst year of operation, demand for services of this nature to Pilbara Aboriginal land managers has signifi cantly increased and PIMS has successfully leveraged additional external funds to meet this demand. The project intends to increase the level of assistance from fi ve properties to twelve within the next year.
Funding approval for Phase II of the Carnarvon Artesian Basin Rehabilitation Program was successfully fi nalised with the Australian Government, with the operational phase to commence in 2007/08. This program will bring the total amount of water saved to over 100 GL each year.
A signifi cant R&D project that is piloting the use of the saved artesian water in Carnarvon was commissioned late in 2006/07. This project will determine the feasibility of using artesian water for irrigated pastures and agriculture and will if successful see up to 10 GL of the water saved through the rehabilitation program. The expectation is to establish a 1000 hectare irrigated agriculture precinct that underpins the meat industry supply chain in the region. It is anticipated this precinct will be critical in the reopening of the Carnarvon abattoir and provide the necessary infrastructure to support animals for the live export trade.
The Department also completed the necessary drilling program to prove-up the water resource at both the proposed Meedo and Brickhouse Horticulture Precincts. These two precincts are estimated to create an additional $40 million of gross value of agriculture product and some 400 jobs to the Northern Agricultural region. Finalisation of the water and land requirements is expected by the end of 2007 when the areas are anticipated to be offered to commercial expression of interest for their development.
In association with the Kimberley Beef Research Committee and supported by funding from Meat & Livestock Australia (MLA), DAFWA has begun development of the Grazing Land Management package for the Kimberley Region. This package provides a linkage to producer groups across Northern Australia, providing Kimberley producers with greater opportunities to interact with their counterparts across the north.
With fi nancial support from Land & Water Australia and the Indigenous Land Corporation, the Department completed a landmark study into the integration of Indigenous cultural aspiration with traditional natural resource management in enterprise development on Indigenous managed land. With over 30 of the 96 pastoral leases in the Kimberley region managed by Indigenous groups, the outcomes of this project are particularly relevant and provide signifi cant opportunities for Indigenous development.

Department of Agriculture and Food, Western Australia Annual Report 200716
Food and Fibre Industry Development Achievements
MLA has acknowledged the value of the Department’s publication ‘Pastoral Stock Water Workbook’ as a signifi cant contribution to infrastructure development for the northern beef industry. In association with DAFWA, MLA will republish the booklet in with the intention of expanding the analysis of remote technologies for the management of stock water for cattle under the extensive grazing situations in the rangelands. The publication has also received widespread acceptance from the pastoral industry and is being used for investment decisions by pastoralists in infrastructure development.
The fi nal report was submitted to the MLA on Diet quality and performance of grazing cattle in Northern WA. This project reported on changes in body condition of breeder cattle grazed on pasture communities in the Pilbara and Kimberley over a 3 year period. The project has provided a valuable information resource for decision making and more productive grazing management systems for the northern Western Australian cattle industry.
The Department has introduced new knowledge of landscape and rumen ecology so that pastoralists can clearly identify how to re-design livestock production systems to be both profi table and sustainable. Landscape ecologists have identifi ed land management strategies and infrastructure re-design to ensure that rainfall is retained in the landscape to grow pastures instead of running off into the salt lakes or the ocean. The Department has obtained signifi cant external funding to support the adoption of these improved systems.
The Department has developed working relationships with the CSIRO to bolster the research effort in the southern rangelands. A collaborative study with CSIRO has commenced to investigate the potential of using GPS tracking to study animal behaviour and distance walked, as an indicator of available stock feed. This technology may prove that GPS tracking can assist land managers in the decision-making process of adjusting stocking rate to carrying capacity.
Grains
The Department liaised with key elements of the Japanese fl our milling industry to maintain the capacity of the WA industry to produce premium soft grained wheats for the one Mt Udon Noodle market in Japan. The collaborative program, conducted jointly with AWB Ltd cereal chemists and Japanese technical experts, has resulted in the release of the variety Binnu in August 2006, with fi rst commercial plantings by growers in 2007. Binnu has wide adaptation to much of the central and northern wheatbelt with high yield, improved stripe and leaf rust resistance and excellent quality for noodle manufacture.
The Department initiated new areas of wheat agronomy research in partnership with the Grains Research and Development Corporation (GRDC). Variety specifi c R&D has consolidated research to assist farmers manage production risks (frost, meeting premium grade delivery specifi cations, drought). The fi rst year of this R&D program has been integrated into other variety related information and published as a new Department Bulletin 4704 “Wheat variety guide 2007 Western Australia”. Researchers in systems agronomy are also developing strategies to improve productivity in situations of environmental or soil type constraint, within the overall needs of the farming system.
The Department’s barley breeding program has been successfully engaged as the ‘Western Node’ of the national barley breeding program, Barley Breeding Australia (BBA). BBA has been established to nationally co-ordinate state-based breeding programs to ensure an internationally competitive breeding capacity exists to meet requirements of growers for agronomically better varieties and malting and feed end-users for quality grain. Following the success of the DAFWA bred malting varieties in recent years, a program to provide improved feed barley varieties is on track with releases planned for 2007 and 2008.
DAFWA lupin breeding released the fi rst ‘Hi-Pro’ narrow-leafed lupin variety Coromup in August 2006. The new lupin is a niche variety for processing and

Department of Agriculture and Food, Western Australia Annual Report 2007 17
Food and Fibre Industry Development Achievements
for high protein food ingredient and feed markets such as the aquaculture sector. Coromup has a typical protein content of 34 percent compared to Belara (30%) and Mandelup (31%). It also has larger and more uniform seed size making it very suitable for de-hulling. The release of this variety was in response to industry demand for varieties that could meet the protein requirements of niche markets.
Work on developing an agronomically suitable variety of the high protein yellow lupin type currently grown in Europe, and developing a low alkaloid, high protein and high oil pearl lupin, a species native to South America continues. Key traits important for domestication in both species are being identifi ed prior to incorporation into the breeding program.
The Western Australian Government has an objective to return to no detectable GM canola present in the WA canola crop as soon as possible. Activities undertaken during 2006/07 to ensure the level of GM canola in the WA commercial canola crop is reduced to below detectable limits included:
- regulatory testing of canola seed-lots sown WA in 2006 for the presence of the Offi ce of the Gene Technology (OGTR) approved events (InVigor® and Roundup Ready®). No evidence of the events was detected;
- regulatory testing of canola seed-lots sown in WA in 2007 for the presence of OGTR approved events. No evidence of events has been detected to date;
- surveillance testing on samples supplied by CBH from the 2005 CBH canola crop for the presence of OGTR approved events. No evidence of the events was detected; and
- surveillance testing on samples supplied by CBH of the 2006 canola crop for the presence of OGTR approved events. No evidence of the events has been detected to date.
DAFWA provided fi nancial and technical supported to a Department of Fisheries led project which has demonstrated the benefi t of lupins as a substitute for soybean in aquaculture feeds. The project has identifi ed a range of market opportunities where lupins have a competitive advantage over soybean and signifi cant quantities of lupins have already been shipped to premium paying markets by CBH Ltd.
The Department’s involvement in the new Western Australia Centre for Food and Genomic Medicine has contributed to a signifi cant medical publication in 2006 demonstrating that eating lupin-enriched bread increased satiety and reduced energy intake in humans. The publication has stimulated commercial interest in lupin fl our from a major US food company which has requested samples for pilot evaluation.
An electronic directory “Tools to Assist Decision Making” was produced by DAFWA on its website to provide farmers and advisors with over 40 tools for decision-making on various aspects of farming, to ask ‘what-if’ questions and to evaluate different production, economic and natural resource management scenarios.
Considerable progress was made in the epidemiology of blackleg disease in canola, so that regional variability in blackleg stem canker expression in Western Australia can be explained more easily. The prediction (using Blackleg Sporacle and SporacleEzy models) for location and seasonal variability of the onset of seasonal ascospore release as it relates to blackleg in canola is being tested in other states (New South Wales, Victoria and South Australia). National blackleg forecasting will now be done using the Western Australia developed models.
In anticipation that weeds would develop higher levels of herbicide resistance the “Integrated Weed Management in Australian cropping systems: A training resource for farm advisors”, was published in February 2007. The manual, originally initiated by DAFWA offi cers in 1998, has subsequently been developed further by the

Department of Agriculture and Food, Western Australia Annual Report 200718
Food and Fibre Industry Development Achievements
Cooperative Research Centre for Australian Weed Management and given a national focus to meet the needs of all farmers. DAFWA offi cers have been actively involved in presenting and designing a series of training courses for farm advisers, based on the information in the manual.
In experiments in the Northern Agricultural region (NAR), non-host crops were demonstrated to signifi cantly reduce the numbers of Cereal Cyst Nematode (CCN) in one season, even where the initial numbers were very high. Non-host crops were more effective than resistant cereal crops. However, in paddocks where CCN has been identifi ed, growers will need to monitor the levels in the following one or two seasons of susceptible crops as the numbers can rapidly increase to damaging levels.
Defi nition and quantifi cation of the relative infl uence of sea surface temperature (SST) patterns in the Indian Ocean and indicators of El Nino/Southern Oscillation (ENSO) were undertaken in the past year. Incorporation of Indian Ocean SST pattern information into the Department’s ENSO Sequence System (providing the basis for the long-lead climate forecast capacity) has been further developed and allows for greater defi nition of analogue years in developing the monthly Growing Season Outlook which is published on the Department’s website. These further developments have enhanced the reliability of climate forecasting.
In order to understand the future impacts of low rainfall four global climate models were compared in terms of simulated monthly rainfall, and maximum and minimum temperature, for 8 selected locations in the State’s grainbelt. Simulated future yields showed a yield decline in most locations. Some yield increases were observed in some high rainfall locations due to the combined positive effects of increased carbon dioxide levels and waterlogging reduction.
A new book titled “Perennial Pastures for Western Australia” was released in June 2007 by the Department. This substantial publication details the current state of knowledge and the prospects of perennial pastures in Western Australia. Topics include cultivars and pasture management of temperate and sub-tropical grasses and legumes, herbs and fodder shrubs.
Three new pasture legume cultivars developed by members of the Pasture Improvement program were released in 2006. ELECTRATM purple clover (Trifolium purpureum) and Flamenco sulla (Hedysarum coronarium) were developed as part of a University of Western Australia CLIMA-managed project and were released at the Department’s 2006 Agribusiness Sheep Updates. Both are dual purpose grazing and fodder plants.
A survey of acidity in the Avon River catchment revealed that 50 percent of the catchment has soils with a pH profi le that indicates the application of lime would be profi table. Seventy fi ve percent of topsoils (0-10cm) have pH<5.5; 40 percent of subsoils (10-20cm) have pH<4.8 and 25 percent of deeper subsoil (20-30cm) has a pH<4.5. So far, this survey has tested 3,000 sites. Large scale liming demonstrations installed in 2006 showed little benefi t because of the dry to droughted conditions. Experiments at Corrigin are showing that deep placement of nutrients stimulates crop growth and production in soils without physical subsoil constraints in seasons where rainfall is suffi cient to wet deeper soil layers.
Horticulture
The Department now has a substantial project in place to address the requirements for production of horticultural crops on the Gnangara Mound. Reduction in irrigation water use and minimization of nutrient leaching are key targets, being met through implementation of improved farming practices developed through research activities. The future of horticulture on the Mound will also be strongly infl uenced by competing uses for land and water. A study has been initiated, in partnership with growers and other community and government organizations, to assess the feasibility of using recycled waste water in association with the development of a horticultural precinct close to metropolitan Perth.

Department of Agriculture and Food, Western Australia Annual Report 2007 19
Food and Fibre Industry Development Achievements
A ‘Good Practice Guide’ focusing on nutrient and water management for the Swan Coastal Plain has been published by vegetablesWA in association with the Department, with support from the National Heritage Trust and the Swan Catchment Council. It incorporates Department research fi ndings and will assist growers in improving profi tability while minimizing impact on the environment, through the use of practical farming strategies. Growers can access the Guide through the recently developed vegetables WA website.
The ‘vegetablesWA’ website has been developed in partnership with the Department, with support from the Swan Catchment Council and the Premier’s Water Foundation Grant, as a medium for providing growers with access to information and interactive on-line support for irrigation management. The fi rst stage of the website has been completed with information available on current recommended practice for irrigation. The second stage is underway and will deliver an easy to use computer/web based system capable of calculating and guiding effi cient irrigation and nutrient management for vegetable production on sandy soils. It will allow growers to input factors specifi c to their farming operations to obtain information tailored to individual crop requirements.
Innovative practices have been developed for managing the reduction of nutrient losses to groundwater, associated with irrigation of leafy and heading vegetable crops. These are based on non traditional fertiliser application techniques and rates beyond the fi rst 14 days after planting, in conjunction with current best practice irrigation. This research has demonstrated that vegetable yields can be as much as tripled by strategic application of mineral fertilisers on sandy coastal soils, with water application, nutrient leaching and fertiliser costs reduced signifi cantly. It is expected that this technology will be rapidly adopted by growers.
Research initiated by the Department on smoke taint in wine grapes has created interest at the national level. A better understanding of the impact of smoke generated fl avour taints in grapes and wine will be developed along with the mechanisms involved. This will include a study of the stage at which grapes are most likely to be affected and smoke components responsible, allowing development of amelioration techniques and management strategies for use by the wine industry and for prescribed burning situations.
Trials to verify the effi cacy of cold treatments to satisfy Japanese quarantine requirements for imported red fl eshed grapefruit have been completed. Results have confi rmed that treatment at higher temperatures than previously allowed is effective in meeting disinfestation requirements for Mediterranean fruit fl y as specifi ed by Japan. Higher temperatures also improved the quality of the fruit at the point of sale. Approval for access to the Japanese market using protocols based on higher temperatures will open up a signifi cant marketing opportunity for the red fl eshed grapefruit industry which is in the early stages of development in the north of Western Australia. Similar work to allow access to the Japanese market for other citrus fruit has also been completed recently.
A landmark publication ‘NORpak – Cotton production and management guidelines for the Ord River Irrigation Area (2007)’ was launched by the Cotton Catchment Communities Cooperative Research Centre (CRC). Produced by the Department, it provides guidelines for the commercial production of cotton in the Ord region and is based on extensive research over the last decade, investigating crop husbandry, pest management and environmental issues.
Community demand for healthier food has driven the development of a new initiative on ‘Horticulture and Health’ using biotechnology to enhance the level of healthy compounds in horticultural products. Research will develop a better understanding of the nutritional compounds in fruit and vegetables and the potential for enhancing those levels through breeding. Initial work will identify Australian-bred apple and plum varieties with attributes suitable for enhancement. A partnership has been developed with the University of Western Australia to progress these activities.
Department of Agriculture and Food, Western Australia Annual Report 200720
Food and Fibre Industry Development Achievements
Animal Industries
The Department, in partnership with their Agricultural Research Western Australia (ARWA) partners, made a successful bid for a new Sheep Cooperative Research Centre (CRC) – Sheep Industry Innovation. The CRC will involve about $10 million of new investment in sheep research in Western Australia over the next 7 years. From July 2007 the Commonwealth Department of Education, Science and Training, Meat and Livestock Australia and Australian Wool Innovation will invest in WA-based activities relating to:
- post farm gate R&D into whole-garment comfort produced from wool;
- new research into increased yield of meat from lambs, while retaining eating quality and value adding to health aspects such as ‘omega 3 fatty acids’;
- expansion of R&D activities aimed at providing sheep producers with viable alternatives to the chemical management of stomach worms; and
- establishment of an ‘Information Nucleus Flock’ at the Katanning Research Centre as part of a large progeny testing scheme for both wool and meat sires linked to similar fl ocks in each of the other sheep producing states of Australia.
The Department completed work on the establishment of objective benchmarks that describe consumer’s perception of meat colour during shelf display with a major retailer. In addition, the validation of the effects of medium voltage stimulation, ageing, vitamin supplementation and cut on retail display life and eating quality of lamb meat.
The fi rst year’s research on “Breeding breech strike resistant Merino sheep”, which investigated breeding Merino sheep that are resistant to breech strike and do not require mulesing, has been completed. Results showed that unmulesed animals selected on key indicator traits for breech strike resistance had a similar incidence of breech strike to normal mulesed animals. The project was urgently required to address major animal welfare issues, together with the self-imposed industry ban on mulesing operations by 2010 and potential threats to international trade of sheep products.
Western Australian “fi ne ends” wool fabric was released in Italy in July 2006. This new product received wide praise at yarns trade fares in Europe. If the algorithm for sourcing this product, developed by the Department, is taken up by industry it has the potential to lift the demand for WA wool at auction. A similar approach has been used to develop a “non allergenic” wool fabric that was released in Europe in September 2006.
A major upgrade to the dairy facilities to support research and development for the dairy industry was completed at the Vasse Research Centre in April 2007. The dairy cows involved in the Greener Pastures project which investigates Nitrogen turnover in dairy systems are now being milked in the new state-of-the-art facility with technology using individual electronic identifi cation of cows linked to individual milk measurement and supplementary feeding.
With fi nancial support from industry, and in response to animal welfare concerns, an alternative system to farrowing crates was established at the WA Pig Skills Centre. Evaluation of the system, in comparison to conventional farrowing crates, will be completed by the end of 2007 and a report made available to industry on the cost-benefi t of the system that has some welfare advantages for the sow and its progeny.
The fi rst calving results from a large Beef CRC project investigating maternal productivity in beef cows, which differ in feed effi ciency and body fat characteristics, is nearly completed. Groups are run at two different levels of nutrition at the Vasse Research Centre, which is one of only two locations in Australia for this project. The project has three more years of research to complete.

Department of Agriculture and Food, Western Australia Annual Report 2007 21
Food and Fibre Industry Development Achievements
A signifi cant Beef CRC project recently completed at Vasse Research Centre with 200 beef animals selected on the basis of specifi c gene markers, investigated the function of genes controlling post-mortem tenderisation of beef. The work tests the effect of the genes for tenderness in terms of shear force and Meat Standards Australia (MSA) consumer taste panel scores, in an attempt to determine the biochemical and physiological mechanisms underpinning the effects of the genes. Most of the cattle were Brahmans because of the variety of gene markers that exist within that breed. A comprehensive range of samples for meat quality and biochemical analyses were collected and are currently being analysed.
Trade and Development
The Department continued the development of agri-food trade and investment opportunities in various markets including the Middle East and Asia generating exports valued at approximately AUD$140 million for Western Australian companies.
Seven businesses were selected as recipients of the $500,000 WA Food Industry Development (WAFID) Fund grants. Five businesses successfully completed their projects, which is estimated to result in Total Gross Sales of $32 million over 3 years.
An active innovation strategy was implemented to assist local food producers to differentiate their products. This strategy provided a combination of grant funds (through the WAFID Fund program) and services to guide technology transfer, through in-house skills and a membership alliance with Leatherhead Food International.
The Department worked on reducing the burden of the food regulatory environment, providing input to the national debate on topics such as fortifi cation of food and labelling for origin.
Initiatives were developed to enhance the capacity of the local industry to attract and apply investment capital. These include the aggregation of capital across the sector (through assistance and guidance for the formation of cooperative businesses) and the infl ux of capital from outside the sector (such as through major food processing investment attraction projects).
The Department provided executive support to the Grain Licensing Authority (GLA) including advice on policy and operational procedures and conducted market research and analysis to assist the GLA in its assessment of applications for special export licences.
The Biofuels Taskforce completed its interim report in February 2007 with the fi nal report completed in April 2007. The biofuel industry development activity included research on alternative oilseeds; design of an industrial wheat breeding program, establishment of a biofuel website and preparation of several articles on biofuel.
The Department assisted a company to establish two ethanol plants in WA, each with a production capacity of 190 million litres (ML) and each plant requiring 500,000 tonnes of grain feedstock.
There was continued involvement with the Department of Industry and Resources (DOIR) in the process for development of additional land in Ord Stage II. The selection process, which commenced in September 2006, has been extended.
The Department won and successfully managed a number of international training and consultancy projects in Asia and the Middle East. Signifi cant projects included: AusAID, Rehabilitation Assistance Facility Iraq (RAFI); Agricultural Iraq Human Resource Development, a major soil survey for the Abu Dhabi Emirate in the United Arab Emirates, contracts to review operations and provide capacity building for the Abu Dhabi Environment Agency, a contract to undertake a review of operations for a major meat importing and processing company in Qatar and biosecurity training for quarantine offi cers from Indonesia and Botswana.

Department of Agriculture and Food, Western Australia Annual Report 200722
Agricultural Resource Management Achievements
The Department has taken a lead role in coordinating and managing the delivery of the National Action Plan for Salinity and Water Quality (NAP), the extension of the Natural Heritage Trust (NHT2) and the National Landcare Program (NLP) in Western Australia. Together, these programs involve an investment by State and Australian Governments totaling approximately $400 million between 2002/03 and 2007/08. A signifi cant proportion of these funds are delivered through the regional model.
The Department has been actively involved with the six Regional NRM groups in WA providing technical leadership and guidance for the development of programs and delivery of outcomes.
The Department’s role has been:
- to provide support to the Regional NRM groups with the development of their Investment Plans and on-going review and refi nement of their Strategies;
- to effectively manage, and participate in, investment decision processes. All second year Investment Plans have been approved by State and Commonwealth Ministers. Third year Investment Plans for all regions are currently being considered by Governments with the exception of the Rangelands whose third Plan is expected in October 2007;
- to continue to implement arrangements that lead to improved Regional group governance and accountability for funding. These have included: the refi nement of contracting arrangements; helping Regional groups improve their business systems, processes and business capabilities through a series of auditing, evaluation and benchmarking exercises; and facilitating training courses and advice in business governance; and
- to continue to implement improved arrangements for monitoring and reporting the performance of investments.
During 2006/07, over $55 million of NAP and NHT2 funds were invested in community partnerships to achieve NRM outcomes under the regional delivery model. These funds were invested in a range of strategic projects identifi ed in plans developed by six regional NRM groups. The Department has implemented various aspects of the Hicks Review of NRM arrangements that have been agreed by government. These have included: facilitating the establishment of a revamped State NRM Council; developing a State NRM strategy and investment framework in collaboration with other agencies; improving accountability and governance arrangements and processes, developing and implementing a state level monitoring and evaluation plan and helping regions develop their regional monitoring and evaluation plans.
Catchment-scale land salinity and native vegetation targets were set with fi ve groups in the South West. As a direct outcome, all groups received NAP funding for planning and/or on-ground works in the second investment plan. The process has been documented in two technical reports. Regional scale technical targets for land salinity based on an analysis of ground trends and salinity risk and hazards have also been developed for the low and medium rainfall zones for the South West NRM region.
During the year the role, structure and operation of Land Conservation District Committees (LCDC) operating under the regional delivery model was investigated. LCDCs continue to attract and retain the members required by their Establishment Orders, however, the widening gap between the statutory functions of district committees and the broad scope of activities carried out on behalf of the Regional NRM groups was also identifi ed.

Department of Agriculture and Food, Western Australia Annual Report 2007 23
Agricultural Resource Management Achievements
As part of this process the Department:
- reviewed the status of the 29 LCDCs established in the Northern Agricultural Catchment Council region and the feasibility of amalgamating up to nine districts into a single large district with a new district committee was investigated; and
- wound up the affairs and abolished the committees of 14 LCDCs, 14 LCDCs were reappointed and 16 Establishment Orders were amended by the Governor in Executive Council. LCDCs will be reinvigorated or abolished where ongoing community support is lacking.
The ‘Farming for the Future’ sustainability management initiative developed a baseline for broad use across agriculture that identifi es current recommended practices for agricultural sustainability. This information was used to develop a self assessment tool that is available to farmers and industry to demonstrate and plan for sustainable agriculture at the farm level.
Assessments of the Geographe and Ellenbrook catchments have been partially completed and include the collation of information on the adoption of management practices to reduce nutrient export as well as a detailed assessment of the nutrient balance for a range of enterprises. This information has been combined with revised landuse mapping to produce provisional nutrient export maps and summaries. This provisional information will be updated throughout the remainder of the project, but in the interim will be used to identify major landuse risks in these catchments and as the basis to allocate resources of local catchment groups for remediation works.
Water quality monitoring was conducted in coastal agricultural areas that were mapped as having a high risk of acid sulfate soils to assess the impact of agriculture for disturbing acid sulfate soils. The results showed that agriculture is having minimal impacts, with only small localized occurrences of disturbance. Techniques developed in the mining industry to manage and treat acid drainage, such as permeable reactive barriers and vertical fl ow systems, are being trialled to manage acid drainage from agricultural land.
On-ground assessments for the Department’s fi ve-year Rapid Catchment Appraisal project have been completed. Department staff have now commenced training in catchment water management planning for a follow on project and the fi rst batch of four priority catchments to be planned have been selected – one in each agricultural NRM Region.
A pilot methodology and process for benchmarking surface water structures has been developed and tested in the Lake Grace shire this year, assessing water management structures across soil systems. The pilot has considered a range of spatial information including surface water management history in the area. The project has been useful in evaluating how different datasets can be used for surface water management.
The barriers and benefi ts to surface water management were assessed in the Central region based on the perceived needs of farmers to use these management practices. A survey was conducted in the Lake Grace area to assess impediments to adoption of surface water management structures, and a state-wide assessment completed of the utility of the water management tool kits.
A new monitoring project was initiated to evaluate surface-groundwater interaction in wetland systems in co-operation with the Department of Environment and Conservation. The project is monitoring effectiveness of surface water management on goundwater recharge, and instrumentation has been installed for the long term monitoring of impacts in land salinity.
A study of the impacts of climate change has been completed collating views of all major sectors across the community in the South West Land Division of WA. The investigation looked at the perceptions of vulnerability to the impacts of past climate change and on the capacity of sectors to adapt to future change.

Department of Agriculture and Food, Western Australia Annual Report 200724
Biosecurity Achievements
The Biosecurity and Agriculture Management (BAM) Bill was passed by the Legislative Assembly and introduced in the Legislative Council of Parliament.
A Biosecurity Review undertaken by the Department, in partnership with the Agriculture Protection Board, Department of Environment and Conservation, Department of Fisheries and Forest Products Commission is in its fi nal stages, pending environmental and social economic justifi cation. Once this has been completed, the passage for the State Biosecurity Strategy will be identifi ed. This review assisted in the development of the AusBIOSEC National Biosecurity Systems.
The state’s border biosecurity services continued to effectively operate quarantine entry checkpoints into WA, such as Eucla and Kununurra road checkpoints, Perth domestic and regional airports, disembarkation points, interstate rail and shipping, freight surveillance at road, rail and sea cargo depots. During the year 114,502 vehicles entered the state via Eucla and Kununurra checkpoints with a total of 23,825 kg of quarantine risk material seized from travellers. Over 1.7 million interstate air passengers have been inspected in WA with 2,486 kg of fruit and vegetables seized and 13,111 kg of Quarantine Risk Material placed in amnesty bins. A total of 216,881 containers were imported from interstate, comprising 150,837 via rail and 66,044 via coastal cargo. A total of 39,313 livestock entered the state via Kalgoorlie and Kununurra checkpoints, including 3,049 horses.
The Department responded to a total of 60 animal and plant pest and disease incidents in regional and metropolitan locations. Incidents ranged from plant pest and diseases such as olive lace bug and cherry aphids in the South West to animal diseases such as Bovine Johne’s disease and Babesia felis on the south coast and in the metropolitan area. Vertebrate pests included sparrows at Port Hedland and Indian Ringneck Parakeets around the metropolitan area. The number of incursions of invasive pest bird species increased in metropolitan and regional locations during the year. National and statewide incidents included Australian Plague Locust, Chinese auger beetle and khapra beetle where the national PlantPlan (emergency management plan) was activated. The Department also assisted Fire and Emergency Services Authority during the 2006 Dwellingup fi res.
A Biosecurity Compliance and Investigations section has been formed to increase the capacity and capability to deal with non compliance to current and future legislation. The section investigated 296 reported border quarantine breaches, with 81 infringements issued. A post border prosecution under ARRPA has also commenced.
The Pest and Disease Information Service (PaDIS) effectively responded to approximately 14,500 community enquiries on animal and plant pests, diseases and weeds. Of these enquiries 69 were positively identifi ed as pests of biosecurity concern such as Acacia karoo, exotic wood borers, noogoora burr, olive lace bug, boneseed, European wasp, Chinese auger beetle, salvinia, Indian ringneck parakeets, surphur crested cockatoos, sparrows and downy mildew of impatiens.
AGWEST Plant Laboratories (APL) analysed 7,100 commercial, quarantine and regulatory seed and plant samples for identifi cation of weeds and diseases. Staff inspected 554 seed crops totaling 3,975 hectares for the varietal purity and presence of weed and seed borne diseases.
The Department developed a new world fi rst bulk seed test to detect wheat streak mosaic virus in wheat seed. The test was developed in less than 12 months by the Department in conjunction with the Grains Research and Development Corporation and was made available to industry.
A national cost-sharing arrangement has contributed to the ongoing surveillance and containment program, with a view to eradication of European House Borer (EHB) from Western Australia. Extensive surveillance of 300,000 ha of pine trees was conducted in the Perth metropolitan area and the South West, with the pest being

Department of Agriculture and Food, Western Australia Annual Report 2007 25
Biosecurity Achievements
confi ned to the Perth metropolitan region. A total of 115 infested sites were identifi ed in two main clusters, six isolated sites and eight pine plantations. A targeted communications campaign to educate key stakeholders has been an integral part of the program.
The Department investigated approximately 250 cases of suspected post quarantine detections of exotic threats reported by the public, with 80 being determined as exotic pests of signifi cance such as Chinese auger beetle and khapra beetle.
Production of 1.5 million sterile males Medfl ys per week was maintained at or above international quality standards as per the Department’s contract with South Australia. Research into the use of Ginger Root Oil has effectively improved responses to Medfl y outbreaks.
Freedom from key exotic pests of the grain and horticultural industries was maintained and assisted in market access for plant and plant products from Western Australia. A number of early warning systems are in place to detect incursions of exotic insects through the use of pheromone traps.
The GrainGuard and HortGuard initiatives coordinated several large scale incident responses in accordance with national and state emergency management guidelines during the year. Both wheat streak mosaic virus and khapra beetle, represented serious exotic incursions of production and trade signifi cance for the grains industry. Signifi cant pest threats managed under HortGuard included Potato Spindle Tuber Viroid (in tomato, but of signifi cant threat also to the WA potato industry), peacock spot disease and olive lace bug in olives, cherry aphid, and currant lettuce aphid.
Input was provided into state and national chemical policy that included the Department of Health’s Review of Pesticide Legislation, Chemicals of Security Concern, the Globally Harmonised System of Classifi cation and Labelling of Chemicals, National Training and Accreditation Scheme for Higher Risk Agvet Chemicals and Reviews of Maximum Residue Limits.
The Department assisted farmers dealing with animal welfare issues arising from the drought in northern and eastern agricultural areas with advice on animal and feed management. The Department also initiated and contributed to the work of the Western Australian Livestock Welfare Reference Group aimed at addressing livestock welfare issues in partnership with industry and government stakeholders.
The Department’s preparedness for emergency animal diseases (EAD) was enhanced with the appointment of two new district veterinary offi cers, and through specifi c training and competency accreditation for staff, private veterinarians and industry representatives. Department personnel played key roles in the development and implementation of national preparedness and response strategies for emergency animal diseases, and assisted industry organisations in developing their own EAD response plans.
Animal health laboratory testing was conducted on 1,153 investigations of animal diseases during the year. There were 91 exotic disease exclusions in avian, equine, ovine and bovine species. Three notifi able diseases (ovine and bovine Johne’s disease, and equine liver fl uke) were reported. Foot and mouth disease, avian infl uenza and Newcastle disease were amongst the exotic diseases excluded. A diagnosis of an endemic disease was made in all cases.
The National Livestock Identifi cation System (NLIS) for sheep and goats was fully implemented in WA. The system in WA continues to lead the other states in effective traceability for sheep and goat movement.
A successful statewide Australian Plague Locust control program was undertaken during 2006 with 7,634 properties surveyed and 572,000 hectares of high density locust populations being treated on a total of 1,182 properties.

Department of Agriculture and Food, Western Australia Annual Report 200726
Biosecurity Achievements
Industry groups congratulated the Department on the high levels of landholder compliance during the skeleton weed search season. A small increase of three infested properties corresponded with a 20 percent increase in the infested area of 2,256 hectares. Over 1,100 properties were inspected for skeleton weed duringthe year.
The State Government committed additional funding towards the starling eradication program. A total of 629 starlings were removed from the eradication area between Condingup and Hopetoun during 2006/07. Six indigenous staff members commenced work in early 2007 to conduct surveillance of the coastal reserves between Stokes Inlet and Hopetoun and the swamp systems within the reserve.

Department of Agriculture and Food, Western Australia Annual Report 2007 27
Disclosures and Legal Compliance
Performance IndicatorsCertifi cation of Key Performance Indicators
As proscribed by Treasurer’s Instruction 904, the Key Performance Indicators provide information to assist readers to assess the performance of the Department of Agriculture and Food in meeting its mission and outcomes.
I hereby certify that the performance indicators are based on proper records, are relevant and appropriate for assisting users to assess the Department of Agriculture and Food’s performance, and fairly represent the performance of the Department of Agriculture and Food for the fi nancial year ended 30 June 2007.
Ian LongsonDIRECTOR GENERAL
DEPARTMENT OF AGRICULTURE AND FOOD

Department of Agriculture and Food, Western Australia Annual Report 200728
Performance Indicators
AUDITOR GENERAL
Page 1 of 2
4th Floor Dumas House 2 Havelock Street West Perth 6005 Western Australia Tel: 08 9222 7500 Fax: 08 9322 5664
INDEPENDENT AUDIT OPINION
To the Parliament of Western Australia
DEPARTMENT OF AGRICULTURE AND FOOD FINANCIAL STATEMENTS AND KEY PERFORMANCE INDICATORS FOR THE YEAR ENDED 30 JUNE 2007
I have audited the accounts, financial statements, controls and key performance indicators of the Department of Agriculture and Food.
The financial statements comprise the Balance Sheet as at 30 June 2007, and the Income Statement, Statement of Changes in Equity, Cash Flow Statement, Schedule of Income and Expenses by Service, and Summary of Consolidated Account Appropriations and Income Estimates for the year then ended, a summary of significant accounting policies and other explanatory Notes.
The key performance indicators consist of key indicators of effectiveness and efficiency.
Director General’s responsibility for the Financial Statements and Key Performance IndicatorsThe Director General is responsible for keeping proper accounts, and the preparation and fair presentation of the financial statements in accordance with Australian Accounting Standards (including the Australian Accounting Interpretations) and the Treasurer’s Instructions, and the key performance indicators. This responsibility includes establishing and maintaining internal controls relevant to the preparation and fair presentation of the financial statements and key performance indicators that are free from material misstatement, whether due to fraud or error; selecting and applying appropriate accounting policies; making accounting estimates that are reasonable in the circumstances; and complying with the Financial Management Act 2006 and other relevant written law.
Summary of my Role As required by the Auditor General Act 2006, my responsibility is to express an opinion on the financial statements, controls and key performance indicators based on my audit. This was done by testing selected samples of the audit evidence. I believe that the audit evidence I have obtained is sufficient and appropriate to provide a basis for my audit opinion. Further information on my audit approach is provided in my audit practice statement. Refer "http://www.audit.wa.gov.au/pubs/Audit-Practice-Statement.pdf".
An audit does not guarantee that every amount and disclosure in the financial statements and key performance indicators is error free. The term “reasonable assurance” recognises that an audit does not examine all evidence and every transaction. However, my audit procedures should identify errors or omissions significant enough to adversely affect the decisions of users of the financial statements and key performance indicators.

Department of Agriculture and Food, Western Australia Annual Report 2007 29
Performance Indicators
2
Department of Agriculture and Food Financial Statements and Key Performance Indicators for the year ended 30 June 2007
Audit Opinion In my opinion,
(i) the financial statements are based on proper accounts and present fairly the financial position of the Department of Agriculture and Food at 30 June 2007 and its financial performance and cash flows for the year ended on that date. They are in accordance with Australian Accounting Standards (including the Australian Accounting Interpretations) and the Treasurer’s Instructions;
(ii) the controls exercised by the Department provide reasonable assurance that the receipt, expenditure and investment of money, the acquisition and disposal of property, and the incurring of liabilities have been in accordance with legislative provisions; and
(iii) the key performance indicators of the Department are relevant and appropriate to help users assess the Department’s performance and fairly represent the indicated performance for the year ended 30 June 2007.
JOHN DOYLE ACTING AUDITOR GENERAL 21 September 2007
Page 2 of 2

Department of Agriculture and Food, Western Australia Annual Report 200730
Performance Indicators
Output 1: Food and Fibre Industry DevelopmentOutcome: Increased competitiveness and profi tability of Agriculture, Food and Fibre Industries
Service description: Generation, integration and application of knowledge which together with appropriate industry policy increases the international competitiveness and market opportunities for State agriculture food and fi bre industries.
Effectiveness Indicators
PI 1 The benefi t-cost ratio and net present value of the agency’s research and development activity
To achieve the outcome of increased market competitiveness and profi tability, programs of the Department of Agriculture and Food apply benefi t cost analysis as one objective procedure to assist in the allocation of funds to areas likely to make positive contributions to the State’s rural economy. Programs also use ex post analyses to learn from completed projects. The information generated in the course of the ex post analyses is used to improve the assessment of future projects.
Table 1 shows the results of nine recently or partly completed projects. This year projects were selected for analysis from among the projects not reported before. The analyses are representative of both the effectiveness of agency expenditure and the effi ciency of funds spent.
Table 1. Project benefi t cost analyses in 2006/07
In the initial allocation of resources to projects, programs undertake ex ante analyses to determine the likely returns to each project. Projects that return benefi t cost ratios less than 1.0 are not funded unless they have a strong community service obligation. The ex post analyses were used to evaluate the assumptions of ex ante analyses. This provides an indication of the effectiveness of ex ante analysis in increasing the likelihood that projects undertaken will result in substantial benefi ts to the agriculture, food and fi bre industries. In this reporting year, no evaluated projects fell below a break even benefi t cost ratio of 1.0.
Program and projectBenefi t cost
ratioNet present value
($ million)
Grains
Annual Pasture Legumes Breeding Program 2.7 26
Barley Breeding Project 4.0 43
Barley Improvement 3.9 63
Animals
Southern Rangeland Livestock Productivity 2.4 4.8
Kimberley Supplement Project 4.2 0.6
Pilbara Heifer Management 2.4 0.4
Horticulture
Premium Wine Production 2.5 6.6
Variety Development for the Western Australian Strawberry Industry
9.6 5.5
National Action Plan for Salinity and Water Quality: Demonstrating Sustainable Farm Management Systems
2.7 1.9

Department of Agriculture and Food, Western Australia Annual Report 2007 31
Performance Indicators
The primary objective in assessing projects is to determine whether an increase in the market competitiveness and profi tability of agri-industry has occurred. The high returns of some projects and medium returns of others provide an indication of the projects contribution to agri-industry.
PI 2 Uptake of crop varieties developed by the Department of Agriculture and Food
Variety choice with regard to crop production is a major contributor to market competitiveness and profi tability. The ability to select varieties specifi cally suited to our soil and climate, as well as offering benefi ts in terms of disease resistance and end-product quality, results in increased production and lower input costs for growers. The Department of Agriculture and Food is the main provider of new varieties for the dominant export crops grown in Western Australia (eg wheat, lupins and barley) despite growers having the option to select varieties bred by other breeders (predominantly from interstate and overseas).
The following table shows the Department maintained its strong market share of crop varieties sown for season 2006. In most of the major categories of crops listed the Department of Agriculture and Food lines maintained an 80% or greater level of usage, although in total there has been a general decline between season 2005 and 2006. In an increasingly competitive market the Department’s share of wheat varieties has also fallen, however, the Department continues to have six of the top seven varieties grown. These results continue to provide a strong indication that the Department bred varieties provide the majority of producers with the best opportunity for competitiveness and profi tability.
Table 2: Uptake of crop varieties developed by the Department of Agriculture and Food
PI 3 The extent to which new market opportunities are developed or maintained for Western Australian agricultural produce
The Department of Agriculture and Food is committed to developing the trade for agri-food products and increasing investment into the Western Australian agri-food industry. One of the Department’s key roles is to assist companies in the identifi cation and development of markets for export. This requires long-term relationship building with overseas buyers and often takes many years to produce tangible results. Table 3 shows a range of products the Department has focused its efforts on in various markets over a number of years. Efforts to develop export markets can be impacted by a range of adverse measures including, the outbreak of diseases in other countries, currency fl uctuations and global confl icts and uncertainty.
Variety
% of WA crop area sown to crop varieties
developed by the Department
Season hectares planted
(ha)
% of WA crop area sown to crop varieties developed by
the Department
Season hectares planted
(ha)
2005 2006
Wheat 81 3,931,167 76 3,166,540
Barley 95 874,423 96 869,097
Oats 97 75,859 98 178,897
Lupins 100 399,195 100 360,480
Field Peas 8 58,155 2 64,515
Chickpeas 84 2,056 58 1,077
Total 84 5,340,855 81 4,640,606

Department of Agriculture and Food, Western Australia Annual Report 200732
Performance Indicators
Table 3: Trade opportunities developed in export markets
Source: ABS
* Due to a change in the reporting requirements, the export trade data from 2005 on will now be reported on a calendar year basis rather than a fi nancial year basis. This should be taken into account when comparing trends.
** Due to the Department changing the focus of its efforts in some markets and so reallocating resources, these products/markets will not be reported on in 2007/08.
*** These products/markets are being reported for the fi rst time as the Department has been active in these sectors, and will be included in future reports.
This year, the Department has engaged in a number of on-going activities that have contributed to Western Australian agri-food producers and companies securing new export opportunities. The Department has continued with its efforts to encourage and develop stronger trading relations for Western Australian producers with markets in the Middle East and Asia.
Japan
The outbreak of bovine spongiform encephalopathy (BSE) in the United States (US) in December 2003 led Japan to ban imports of all beef products from the US. As an alternative meat, consumption of lamb has grown strongly. To assist Western Australian producers to capture a slice of this new market the Department successfully facilitated the export of lamb from major WA businesses valued at approximately AUD 5.5 Million.
The Department assisted a Japanese tomato farmer to establish tomato farms in Perth under the “Made by Japanese Project” resulting in an investment of almost AUD 500,000 into the WA agri-food industry.
The Department was able to assist a Japanese company in promoting WA non-GMO canola (AUD 1.7 Million) and barley (AUD 55.5 Million) by updating Non-GMO status, Minimal Risk Levels (MRL) of chemicals and crop situation in Western Australia. It also assisted a WA company to export canola to Japan valued at around AUD 23 Million.
Commodity Destination2002/03($’000)
2003/04($’000)
2004/05($’000)
2005 *($’000)
2006($’000)
Pork Total exports 26,985 30,267 34,029 32,287 31,653
Singapore 23,996 27,966 29,607 28,629 30,358
Beef Japan 14,017 36,353 51,950 42,260 29,468
Taiwan** 4,768 5,331 4,857 5,868 5,472
South Korea 12,188 16,351 26,038 29,466 42,365
Kuwait** 2,539 4,407 3,783 3,821 3,057
Wheat Jordan** 12,713 0 0 0 0
Lamb Japan 3,099 5,956 6,267 9,788 10,096
South Korea*** 508 150 686 960 1,779
UAE*** 4,268 3,797 5,098 5,571 7,636
Apples India** 333 110 219 219 118
Milk Singapore** 14,638 13,106 12,292 12,345 12,356
Taiwan** 1,693 2,718 2,827 2,489 2,628
Malaysia 1,581 2,068 2,199 2,328 2,984
Hong Kong 6,835 7,779 7,484 8,663 8,173
Hay Japan 82,945 69,156 69,394 80,603 99,634
South Korea 1,948 4,216 7,385 6,861 7,479
Cereal Straw Japan** 1,519 1,277 2,381 3,372 1,898
Strawberries*** Thailand 0 0 113 141 242

Department of Agriculture and Food, Western Australia Annual Report 2007 33
Performance Indicators
Middle East
In partnership with GRM International, DAFWA is part way through delivering an AUD 3.5 million contract for a major soil survey in Abu Dhabi.
The Department assisted in the negotiations between a WA company and the Turkish General Directorate of Agriculture Enterprises (TIGEM) regarding an animal export opportunity resulting in the quotation for a fi rst shipment of 2,000 head of cattle.
The Department assisted a Western Australian company to fi nalise a contract to export AUD 8 million worth of livestock to Libya, signifying the fi rst export for the past decade.
DAFWA facilitated a trade inquiry from a UAE buyer resulting in the fi rst container of honey being exported to UAE. This was valued at around AUD 122,000 with the buyer indicating interest in purchasing 12 containers for the year, with the potential value of AUD 480,000 per annum.
South Korea
In conjunction with the Western Australian Trade Offi ce (WATO), Meat and Livestock Australia (MLA) supported a beef promotion in July 2006 to a major supermarket. During the promotion period, sales of WA beef were valued at approximately AUD 1.2 Million.
The Department worked with WA agri-food companies to increase sales of beef and lamb to the Korean market valued at around AUD 2.8 Million.
Singapore/Thailand
Organised a WA pavilion at Food and Hotel Asia (FHA) Singapore representing 16 WA agri-food companies. The initial sales reported by WA companies were approximately AUD 1.3 million.
Assisted a WA trading company in securing meat contracts with Thai importers valued at almost AUD 2 million.
Facilitated trade inquiries and organised various visits for Thai buyers (major importers and leading supermarkets) to meet with potential Western Australian agri-food exporters/ manufacturers, resulting in exports to the value of over AUD 1 million.
Together with industry and a major supermarket in Thailand organised a plum promotion to promote WA plums in the Thai market in February 2007. The successful promotion resulted in an increase of almost 200% of plums sold in Tops stores during the 2 week promotion period compared to the same period in 2006.
China/HongKong/Taiwan
Within its capacity to promote agriculture and food export opportunities, the Department assisted the Western Australian lobster industry to export approximately AUD 30 million to Taiwan.
Together with Austrade and the WATO in China, the Department assisted in developing new trade for olive oil (5 containers), wine (13.5 containers), fruit juice (15 containers) and others to the value of AUD 600,000.
Others
Seven businesses were selected as recipients of the $500,000 WA Food Industry Development (WAFID) Fund grants. Five businesses successfully completed their projects, which is estimated to result in Total Gross Sales of $32 million over 3 years.

Department of Agriculture and Food, Western Australia Annual Report 200734
Performance Indicators
Assisted 31 WA agri-food companies to participate at Fine Food Australia, the largest trade exhibition for the retail, food service and hospitality industries in Australia. The Department worked closely with Austrade to attract 320 buyers which contributed to the total of 1,765 international buyers that attended the event.
Organised the WA Food and Beverage pavilion at Fine Food Perth (25-27 March 2007). The WA Food and Beverage display incorporated 22 Western Australian companies. The Department together with Austrade attracted 27 international buyers. Individual meetings were set up between the buyers and WA companies resulting in number of potential commercial negotiations. Initial orders to WA companies were valued at over AUD 200,000.
PI 4 The extent to which the outcomes of research, development and extension projects improve the profi tability or potential profi tability of rural industries
The Department undertakes research, development and extension activities across a range of agri-industries aimed at improving or maintaining the profi tability of rural industries. The following industry sectors provide examples of the outcomes of this work.
Strawberries
The strawberry industry in WA continues to account for over a third of Australia’s strawberry exports by value. However, the value and volume of exports from WA in 2006 returned to similar levels as in 2003/04. This result has mainly been due to the sustained high value of the Australian dollar vs the US dollar eroding international competitiveness; to stricter inspection procedures being put in place on consignments to the United Arab Emirates (UAE) leading to a number being rejected; and to a disease which attacks the roots of plants that has reduced the yields of the WA strawberry crop.
The Department of Agriculture and Food has maintained a close working relationship with the strawberry industry since the late 1980’s including work on integrated pest management, breeding and selection, irrigation and nutrition and quality assurance. The variety favoured for export, Camarosa was fi rst identifi ed and promoted to WA growers in Department of Agriculture and Food trial plots in 1998 on grower properties. Adoption of this highly productive variety is a direct result of Department of Agriculture and Food’s collaborative research and extension with the strawberry industry in W.A. Research is continuing to identify the next generation of high yield and quality strawberry varieties and the Department is also working with the strawberry industry and the WA Trade Commission in the UAE to negotiate a solution to quarantine restriction issues and with the industry and the University of WA to overcome the impact of the root disease problem.

Department of Agriculture and Food, Western Australia Annual Report 2007 35
Performance Indicators
Figure 1: Volume and value of Strawberry exports (A$)
Source: ABS
Note: Due to a change in the reporting requirements, the export trade data from 2005 on will now be reported on a calendar year basis rather than a fi nancial year basis. This should be taken into account when comparing trends.
Carrots
In 2006 the value and volume of carrot exports from Western Australian recovered strongly after a series of challenging years. Qatar, Saudi Arabia, the UAE, Malaysia and Singapore in particular showed signifi cant growth in their markets. WA carrots have an outstanding reputation for quality and reliability. The Department has assisted carrot producers and exporters to focus on costs, quality and product differentiation. Product differentiation has been on the basis of quality and food safety into discerning markets. The Department continues to work closely with the carrot industry to develop highly effi cient productions systems to improve yield and packouts, thereby reducing unit production costs and increasing international competitiveness. Irrigation and nutrient use effi ciency are currently the focus of the Department’s industry funded R&D projects. This work underpins the development of environmental assurance systems.
Figure 2: Volume and value of Carrot exports (A$)
Source: ABS
Note: Due to a change in the reporting requirements, the export trade data from 2005 on will now be reported on a calendar year basis rather than a fi nancial year basis. This should be taken into account when comparing trends.
500
1000
1500
2000
2500
2006200504/0503/0402/0301/0200/0199/0098/9997/9896/97
Tonn
es
$ M
illio
n
Tonnes$ Million
0 0
2
4
6
8
10
12
05/0604/0503/0402/0301/0200/0199/0098/9997/9896/9795/9694/9593/94
Tonn
es
$ M
illio
n
Tonnes$ Million
5 10 15 20 25 30 35 40 45 50
0
10000
20000
30000
40000
50000
60000
70000
80000

Department of Agriculture and Food, Western Australia Annual Report 200736
Performance Indicators
Potatoes
WA has a competitive advantage in this high-value, international market because of our State’s freedom from major potato diseases. However, the export of seed potatoes from WA had declined in recent years because of a range of challenges including Indonesian quarantine issues, which have now been resolved, the continuing high value of the Australian dollar and reduced supply due to fl ood damage to WA seed crops in early 2005. In 2006 there was no fl ooding in Albany resulting in a good crop which assisted the improved export results, and with international demand still outstripping available supply, with further good seasons and continued efforts to develop new markets it is expected that the steady growth trend shown from 1999 to 2002 will resume.
The Department of Agriculture and Food has assisted the development of the export seed potato market with projects to demonstrate the performance of WA seed in new markets. One example of this was an export development project with PT Indofood, the major Indonesian food processing company, and Western Potatoes. The project demonstrated that the State’s seed potatoes had the ability to improve the productivity of the Indonesian potato processing industry. This work has led to the Department becoming the lead agency in the Australian Centre for International Agricultural Research (ACIAR) development project Optimising the productivity of the potato/Brassica cropping system in Central and West Java.
Figure 3: Exports of Seed potatoes from Western Australia (A$)
Source: ABS
Note: Due to a change in the reporting requirements, the export trade data from 2005 on will now be reported on a calendar year basis rather than a fi nancial year basis. This should be taken into account when comparing trends.
Diversifi cation of Wheat Grades
The Department of Agriculture and Food has been innovative in developing and enhancing the value of the WA wheat industry. During the 1980’s and early 1990’s concerns were expressed about the decline in wheat quality, particularly as the area sown increased, wheat was established on more marginal soil types and tighter crop rotations. International markets became more discriminating in terms of quality and began to apply discounts for poor quality and offer premiums for some quality characteristics.
The Department responded to these market signals and jointly invested with the Grains Research Development Corporation to develop agronomic packages and premium quality wheat varieties for specifi c market requirements and products. The Department of Agriculture and Food also worked jointly with the Australian Wheat Board (AWB) to develop appropriate grain segregations and quality testing procedures. Below is a
500
1000
1500
2000
2500
2006200504/0503/0402/0301/0200/0199/00
Tonn
es
$ M
illio
n
Tonnes$ Million
0 0
0.5
1
1.5
2.5
2

Department of Agriculture and Food, Western Australia Annual Report 2007 37
Performance Indicators
summary of the Australian Wheat Board wheat grade data from 1991/92 to 2006/07 which shows a transition from the position in the early 90’s, when ASW wheat grades dominated, to a more balanced, and diversifi ed spread currently.
Figure 4: Percentage of wheat grades delivered to AWB
Source: AWB
Western Australian wheat yields
The Department of Agriculture and Food has worked to increase the yields by the State’s wheat producers through a range of activities. These include promoting a high input/high yield package and many better climate risk management techniques e.g. early sowing with more nitrogen, better rotations, better disease control. As shown in KPI 2 the Department has also developed higher yielding varieties which have had a high rate of adoption by the state’s wheat industry.
These activities have resulted in a marked increase in the rate of crop yield improvement over the last 25 years. Between 1930-1981 wheat yields increased by 7 kg/ha/year, but this has increased to 20 kg/ha/year between 1982-2006. This is nearly a three fold increase in the rate of technological improvement in yields in recent decades. For the eastern states of Australia an increased yield variability in recent years has caused the trend in yields to decrease from 15 kg/ha/year (1930-1981) to 9 kg/ha/year (1982-2006). This means that Western Australia has had twice the rate of technological improvement in yields to that in eastern Australia since 1982. It should be pointed out that climate variability and subsequently yield variability in Western Australia has increased dramatically since 2000 and this has slowed the rate of increase in yields. The need to invest in better risk management (e.g. seasonal forecasting systems, risk management tools) is now critical if farmers are to take advantage of good seasons and minimize losses in dry years.
10
20
30
40
50
60
70
80
04/05 05/06 06/0703/0402/0301/0200/0199/0098/9997/9896/9795/9694/9593/9492/9391/92
% o
f w
heat
del
iver
ies
AHAPH APW ASW ASWN AGP FeedSoftWheat grades

Department of Agriculture and Food, Western Australia Annual Report 200738
Performance Indicators
Figure 5: Average wheat yields in Western Australia (T/Ha/Yr)
Source: ABS
Wool
The Woolmark Company has highlighted that the fastest growing textile fi bre market in the world is for luxury fi ne wool. The demand and volume of this wool from Australia has more than doubled over the past 12 years and its value has tripled clearly indicating where consumer preference lies. Over time, there has been a substantial shift in the diameter of the WA wool clip, decreasing from being the second highest to now being the equal fi nest wool clip in Australia. WA has also risen back to being the State with the second largest wool clip overtaking Victoria, but still smaller than NSW. The decreasing trend in diameter of the WA wool clip is the most dramatic change in the wool clip that has ever occurred.
The Department has contributed to this by running a series of workshops on Wool Market Awareness to improve the understanding of the market by wool producers, and conducted sheep selection workshops to show the effectiveness of using measurements in the selection of sheep that have better quality wool and deliver high profi tability. Previous economic analysis has clearly shown that those producers with productive fl ocks of Merino sheep with fi ner wool had a 20% improvement in profi t for a 10% decrease in diameter.
The increasing levels of fi ner diameter wool means that more than a third of the WA clip is now in the superfi ne category of below 19.5 micron. The production has grown at about 11% per annum over the past decade, but volume demand has grown by 8% and the value demand by 7%. This has dampened the price of fi ner wool, but has allowed the steady increase in the segment of the market.
Since mid 2000 fi bre diameter has continued to decline. This is being achieved through a combination of improved selection for fi ne wool, and the adoption of prime lamb production which has driven the merino fl ock to be ewe dominant. This change in diameter equates to a 7% increase in price at March 2007 prices. However, seasonal conditions, both within and particularly between years, do infl uence fi bre diameter. This is demonstrated by the large spike in diameter in early 2006 (caused by the exceptionally good growing season experienced in 2005) followed by the rapid drop caused by very tough conditions in 2006.
0.4
0.6
0.8
1.0
1.2
1.4
1.6
1.8
2.0
2.2
2000 1980 1960 1940
Yiel
d (t/
ha)
Year

Department of Agriculture and Food, Western Australia Annual Report 2007 39
Performance Indicators
Figure 6: Average diameter of wool sold at auction in WA
Source: Dept of Agriculture and Food and Australian Wool Exchange (AWEX) auction data
Effi ciency Indicator
PI 5 Average cost per unit of knowledge
The Food and Fibre Industry Development output is described as the generation, integration and application of knowledge that increases the international competitiveness and market opportunities for the State’s agriculture food and fi bre industries.
R & D organisations tend to have particular diffi culty determining meaningful and measurable units of output in order to report effi ciency. It is not cost effective to measure each individual piece of R&D and the component processes. In this regard, the output produced is knowledge, and this can take many forms each requiring different resources and commitment. Some organisations, such as the Bureau of Rural Sciences, have elected to count variations in person days or hours committed to research. This is input focused and not a true determinant of effi ciency (ie. Inputs to outputs).
To fulfi l our reporting requirements, in 1998/99, the Department of Agriculture and Food instituted a process to enable annual collection of numbers of publications and other outputs produced by Department staff associated with Food and Fibre Industry development. Publications are considered the most suitable means of capturing - in the form of units of output - the knowledge produced. In addition, another key form of knowledge generation, integration and application are the key strategies directly related to improving the productivity and competitiveness of producers.
The following graph presents the results of this effi ciency measure for the past nine years.
Figure 7: Average cost per unit of knowledge 1997/98 - 2006/07
19.5
20.5
21.5
22.5
23.5
Jun 06Jun 04Jun 02Jun 00Jun 98Jun 96Jun 94Jun 92Jun 90Jun 88
Ave
rage
Fib
re D
iam
eter
(mic
ron)
0
5000
10000
15000
20000
25000
30000
35000
40000
06/0706/0705/0604/0503/0402/0301/0200/0199/0098/9997/98
$
Target

Department of Agriculture and Food, Western Australia Annual Report 200740
Performance Indicators
In 2006/07, the Department’s effi ciency in generating units of knowledge declined within the Food and Fibre Industry Development output. This was principally due to a reduction in the number of information products produced. Given the nature of the Department’s operations, where research projects can have time frames of 5 to 10 years, the outputs of research and development will fl uctuate between years depending upon the complexity of the research.
Output 2: Agricultural Resource ManagementOutcome: Improved ecological sustainable development of agri-industry
Service description: Generation, integration and application of knowledge which, together with appropriate policy and regulation, develops the capacity of rural communities and industries to profi t from environmentally responsible agriculture.
Effectiveness Indicators
The ecological sustainability of agri-industry will be improved if primary producers are able to:
adopt sustainable land management practices;
sustainably and profi tably manage their businesses; and
be responsive to change and open to opportunities
The Agricultural Resource Management (ARM) output contributes to all these areas.
PI 6 The impact of Department activity on the adoption of management practices that address off-site environmental impact or contribute to the long-term sustainability of the natural resource base
The adoption of management practices that address off-site environmental impacts or contribute to the long-term sustainability of the natural resource base is crucial to the development of profi table agricultural industries in Western Australia. A 2004/05 nationwide natural resource management survey by ABS (4620.0) asked farmers to report the extent of NRM issues and activity. The survey found:
the majority (92%) of agriculture establishments performed some form of NRM activity;
weed and pest management were the most common natural resource management activities farmers undertook nationally;
Western Australian agricultural establishments undertaking NRM activities were found to have spent more on an individual basis than other States; and
a number of farmers preventatively managed their holdings in order to avoid NRM issues affecting their land.
The Department is involved in raising awareness of sustainability issues and assisting in the uptake of sustainable management practices through development and extension activities. PI 6 includes information on a number of measures that refl ect the Department’s effectiveness in achieving increased adoption of sustainable management practices.

Department of Agriculture and Food, Western Australia Annual Report 2007 41
Performance Indicators
Agricultural extension research proposes that an increase in the levels of farmer knowledge and skills contribute to an increase in the adoption rates of recommended practice. The 2006/07 NRM1 survey found that, of those who had attended at least one Department extension event in the last 12 months, 75 percent (an increase from 68% in 2005/06) felt that the event had improved their understanding of landcare and natural resource management issues.
In the South West and Agricultural regions, the proportion of farms using any of the fi ve key groups of NRM practices remained steady in the last 12 months except for an increase in the proportion of Agricultural region farms that are using revegetation and biodiversity management practices (a peak result of 74%). In the Pastoral region, the use of most NRM practices has remained fairly steady.
These results suggest that while the Department has continued to have an impact on levels of knowledge and skills of a high proportion of farmers, and therefore on the adoption rate of management practices that contribute to the long-term sustainability of the natural resource base, the diffi cult 2006/07 seasonal conditions have impacted on farmers ability to implement some of these sustainable land management practices.
Tables 4, 5 and 6 list a suite of management practices that the Department promotes through its publications and its work with primary producers. The fi gures presented are fi ndings from Department-commissioned surveys of primary producers each year from 2001/02 to 2006/07. In the surveys, conducted in May/June of each year, producers were asked which practices they used in the last 12 months. Thus the responses in June 2007 relate to practices in the 2006 growing season and ensuing summer and autumn.
1 This is now named NRM Survey to refl ect the change in the name of the Department’s Program, which in turn refl ects role as lead agency in NRM.

Department of Agriculture and Food, Western Australia Annual Report 200742
Performance Indicators
Table 4: Percentage of Western Australian primary producers in the Sheep/Wheat agricultural areas who used selected sustainable land management practices
Source: NRM survey
Denotes a statistical increase at 95% confi dence level
Denotes a statistical decrease at 95% confi dence level
Agricultural (%)
2002
(n=201)
2003
(n=200)
2004
(n=200)
2005
(n=216)
2006
(n=232)
2007
Target
2007
(n=280)
Agronomy Practices
Planted non-irrigated perennial pasture species 34 31 36 36 40 40 39
Planted saltland pasture species 23 15 21 17 32 30 29
Planted trees for commercial production (e.g. oil mallees, pines & bluegums) 15 11 10 14 20 N/A 18
Stubble retention or mulching practices 62 48 71 60 64 65 51
Farmed to soil type 71 68 75 66 72 75 73
Revegetation and Biodiversity Management
Tree/shrub planting 63 57 56 63 69 65 74
Preserve or enhanced areas of conservation value 61 59 66 61 80 70 73
Livestock Management
Excluded stock from areas impacted by land degradation 62 66 72 68 69 75 66
Protected river or creek frontages from grazing animals 42 50 44 50 49 55 51
Resource Monitoring
Regular soil testing for nutrient levels 71 58 74 69 74 75 74
Regular soil testing for pH 71 59 74 69 76 75 74
Regular soil testing for compaction 13 16 13 10 11 N/A 15
Regular monitoring of the water table 38 32 38 37 34 N/A 35
Regular monitoring of pasture/vegetation cover on sandy/light soils 57 53 60 55 58 55 49
Surface Water Management
Water on sloping land (e.g. grade banks) 57 48 61 53 73 55 58
Water on the valley fl oors using surface drains 32 29 41 31 49 30 28
Water on the valley fl oor using deep drains 17 12 16 13 27 15 23

Department of Agriculture and Food, Western Australia Annual Report 2007 43
Performance Indicators
The hot, dry climate conditions in 2006/07 experienced in this region reduced the immediate need for activity by wheatbelt farmers in surface water management, and also reduced their capacity to fund such works. The decline in stubble retention and monitoring of pasture and vegetation was also a symptom of the lack of growth due to dry seasonal conditions. Overall the proportion of farmers using sustainable land management practices remained relatively similar, particularly in the agronomy practices of soil testing and farming to soil types. Generally the results show there is a high proportion of farmers who continue to use sustainable practices refl ecting ongoing Department activity in this area over a number of years.
As the lead agency for NRM, the Department has played a major facilitation and coordination role in the development of regional NRM strategies and investment plans. In addition, the Department has performed a lead function in the administration of the National Action Plan for Salinity and Water Quality (NAP) and Natural Heritage Trust (NHT2) funding programmes and will continue this role when NHT3 is implemented in 2008. A major focus of these funding programmes, and the regional NRM strategies, is the revegetation and conservation of areas of natural value and the management of livestock to protect rivers and land areas susceptible to land degradation. The survey results show the continued adoption of these agricultural conservation practices, refl ecting the infl uence of the Department of Agriculture and Food on farming practices.

Department of Agriculture and Food, Western Australia Annual Report 200744
Performance Indicators
Table 5: Percentage of Western Australian primary producers in High Rainfall agricultural areas who used selected sustainable land management practices.
Source: NRM survey
Denotes a statistical increase at 95% confi dence level
Denotes a statistical decrease at 95% confi dence level
Table 5 shows a slight decrease overall in 2006/07 in the adoption of sustainable management practices by primary producers in the high rainfall region, which includes the Shires of Murray, Boddington, Collie, Bridgetown, Manjimup and all those to the west of them. However, the key agronomy practices of soil testing for nutrients and pH and the consequent farming to soil type in both the South West and Agricultural regions has maintained a consistently high trend in these farming management practices over the last six years.
South West (%)
2002
(n=95)
2003
(n=90)
2004
(n=90)
2005
(n=91)
2006
(n=92)
2007
(n=90)
Agronomy Practices
Planted non-irrigated perennial pasture species 39 41 51 47 49 41
Planted trees for commercial production (e.g. oil mallees, pines & bluegums) 10 10 7 9 20 14
Farmed to soil type 56 49 58 53 55 55
Revegetation and Biodiversity Management
Tree/shrub planting 50 48 51 46 60 54
Preserve or enhanced areas of conservation value 50 50 46 48 58 58
Livestock Management
Excluded stock from areas impacted by land degradation 39 34 40 35 39 35
Protected river or creek frontages from grazing animals 48 41 41 38 45 41
Resource Monitoring
Regular soil testing for nutrient levels 52 61 66 58 68 65
Regular soil testing for pH 54 67 66 58 63 59
Regular monitoring of the water table 33 28 28 22 22 28
Regular monitoring of pasture/vegetation cover on sandy/light soils 42 34 52 32 41 26
Surface Water Management
Water on sloping land (e.g. grade banks) 22 28 27 26 36 29
Water on the valley fl oor using deep drains 8 12 13 11 27 14

Department of Agriculture and Food, Western Australia Annual Report 2007 45
Performance Indicators
In 2006/07, high rates of grower adoption were revealed in the following areas:
Regular soil testing for nutrient levels (65%).
Regular soil testing for pH (59%).
Preserving/enhancing areas of conservation value (58%).
Farming to soil type (55%).
Tree/shrub planting (54%).The Department’s focus on conservation and revegetation of native species over this period can be seen as an important infl uence in the continued high use of these sustainable practices.
Table 6: Percentage of Western Australian primary producers in the Rangelands who use selected sustainable land management practices
Source: NRM survey Denotes a statistical increase at 95% confi dence level
Denotes a statistical decrease at 95% confi dence level
Pastoral (%)
2002
(n=110)
2003
(n=110)
2004
(n=110)
2005
(n=110)
2006
(n=89)
2007
(n=61)
Permanent control methods on stock water supplies 68 69 76 74 62 89
Rotational pasture spelling during plant growth season 50 51 53 48 53 47
Fencing to land systems 53 56 64 56 57 63
Conduct a prescribed burn for management purposes 34 30 33 27 43 42
Preserve or enhanced areas of conservation value 46 46 54 40 49 61
Excluded stock from areas impacted by land degradation 70 64 73 65 64 65
Protected river or creek frontages from grazing animals 27 29 39 31 33 26
Formal monitoring of vegetation/pasture conditions 80 77 82 74 79 82
Specifi cally spelled pasture for subsequent use by export cattle 24 17 24 22 28 30

Department of Agriculture and Food, Western Australia Annual Report 200746
Performance Indicators
The signifi cantly high number of pastoralists and graziers who have increased permanent control methods on stock water supplies is the result of a combination of high rainfall in many Rangeland regions in 2006, national and State funding assistance and the Department’s work in developing and extending effective technology and practices.
Overall the results in Table 6 show there is a high proportion of primary producers who continue to use sustainable management practices in the rangelands. This refl ects the Department’s efforts to promote the adoption of sustainable management practices in the pastoral areas, especially in the areas of fencing to land systems, formal monitoring of vegetation/pasture condition, conservation of natural vegetation and exclusion of stock from areas impacted by land degradation.
PI 7 The impact of Department activity on improving the capacity of primary producers to sustainably and profi tably manage the agricultural resource base
The adoption of a continuous learning culture, innovation and improved business management skills are key drivers in building the self reliance, competitiveness and capacity of Australia’s primary producers to meet the challenge of global change.
A survey initiated by the Department of Agriculture and Food in 2005 to fi nd infl uences on decision-making in NRM in the Avon River Basin, found that farmers form stronger opinions of natural resource management strategies when infl uenced by DAFWA extension offi cers, particularly for practices where they have had little experience or knowledge. The report also found that many farmers do not belong to Landcare or catchment groups and prefer learning from their own trials. Therefore one-on-one assistance undertaken by DAFWA extension offi cers focusing on practical, actionable on-ground activities has been particularly important, especially on larger farms.
A slight increase in training participation is refl ected in Table 7 that shows the percentage of primary producers that undertook FarmBis training in specifi c areas. The Department actively promotes and administers FarmBis, which is a Commonwealth/State Government funded training programme. The number of participants in 2006/07 was affected by the diffi cult season and a shortage of networkers/staff as the new FarmBis 3 programme commenced. However, the Department expects participation numbers to improve in 2007/08. The Department has also undertaken extensive work in developing and implementing farm and catchment planning workshops and farm business planning that incorporates natural resource risk containment strategies and contingency planning.

Department of Agriculture and Food, Western Australia Annual Report 2007 47
Performance Indicators
Table 7: Percentage of the primary producers participating in training that undertook formal training in the FarmBis programme
Source: FarmBis report
Table 8 shows the percentage of respondents to the Department’s NRM Survey who undertook training by regions over six years. The survey revealed a signifi cant increase in all three regions in the number of respondents who have undertaken some form of formal training in 2006/07. Around half of farmers (47%) have undertaken formal training in people management, natural resource management or business management compared with only around one quarter (26%) in 2005/06.
Table 8: Percentage of respondents who undertook formal training by region
Source: NRM survey
Denotes a statistical increase at 95% confi dence level
Denotes a statistical decrease at 95% confi dence level
Table 9 also shows a signifi cant increase in the uptake of a range of NRM/Landcare training options across all regions and farming types. The large increase in the uptake of formal training, refl ected in the NRM survey, indicates that as well as accessing a range of training opportunities provided by the Department, farmers are also participating in external NRM training opportunities independent of public funding, which is a desirable long term outcome.
Training course category
2002 (%)
2003 (%)
2004 (%)
2005 (%)
2006 (%)
2007 (%)
People Management 8 9 18 24 10 30
Financial Management 7 3 4 7 23 12
General Business Management (including Quality Assurance) 72 49 28 30 42 23
Marketing 0 7 5 4 2 7
Production Management (including Adverse Seasons) 12 27 38 27 20 26
Natural Resource Management and Biodiversity 1 5 7 9 4 1
TOTAL 100 100 100 100 100 100
Total participant numbers 4,583 4,512 5,192 4,260 3,091 3,228
2002 (%)
2003 (%)
2004 (%)
2005 (%)
2006 (%)
2007 (%)
South West Region 23 34 19 38 15 37
Agricultural Region 41 29 36 33 29 50
Pastoral Region 26 34 38 40 26 57
Total 37 30 33 35 26 47

Department of Agriculture and Food, Western Australia Annual Report 200748
Performance Indicators
Table 9: Percentage of Western Australian primary producers that undertook formal training in the areas specifi ed.
Source: NRM survey
Denotes a statistical increase at 95% confi dence level
Denotes a statistical decrease at 95% confi dence level
PI 8 The impact of Department activity on the capacity of agri-industry to manage change and respond to opportunities
To profi tably and sustainably manage the agricultural resource base in the long term, in the face of declining terms of trade in agriculture and increasing community and market demands for environmentally responsible agriculture, it is important that agri-industry have the capacity to adapt to change and respond to opportunities. In response, the Department actively promotes risk management strategies as a means of building capacity in this area through its publications and its work with primary producers. Table 10 presents results from the 2006/07 NRM Survey in which respondents were asked if they had used at least one of four risk management strategies. These are –
Drought proofi ng through management of farm water supplies;
Succession planning;
Price risk management (eg, futures control); and
Off farm investment.
Table 10: Percentage of Western Australian primary producers who have adopted one of four risk management strategies
Source: NRM survey
Denotes a statistical increase at 95% confi dence level
Denotes a statistical decrease at 95% confi dence level
Survey results in Table 10 reveal a high proportion of primary producers continue to adopt risk management strategies. The pattern of fl uctuations coincides with changes in farmers’ economic conditions due to both seasonal and market factors. Commodity
Training course category
2002 (n=406)
2003 (n=400)
2004 (n=400)
2005 (n=417)
2006 (n=412)
2007 (n=446)
People Management (e.g. human resource management, communication, leadership, negotiation) 11% 9% 8% 7% 5% 19%
Natural Resource Management /Landcare 19% 12% 16% 19% 10% 29%
Business Management (e.g. marketing, quality assurance, benchmarking) 29% 22% 23% 22% 19% 32%
2000/01 2001/02 2002/03 2003/04 2004/05 2005/06 2006/07
Percentage of respondents 86 88 80 87 81 80 79

Department of Agriculture and Food, Western Australia Annual Report 2007 49
Performance Indicators
price trends and farm business liquidity affect both the value of hedging on wool and grain futures markets and the cash available for off-farm investment. In aggregate, the percentage of respondents who have adopted one of four risk management strategies have remained similar throughout the seven years.
An emerging risk to be managed by agriculture is consumer confi dence in the sustainability of the food production system. Farming for the Future is a Department initiative focused on demonstrating sustainability of Western Australia’s agricultural production systems. The programme provides methods to link important local, regional, statewide and national natural resource management priorities to existing Quality Assurance/Environmental Management Systems (QA/EMS). Farming for the Future was endorsed by the Environmental Protection Authority in December 2005 as a high level policy framework that leads to the certifi cation of agri-business practice, delivering better environmental, economic and social outcomes.
Table 11 shows the level of adoption of QA/EMS or Code of Practice to guide management decisions has been similar for the past four years. In 2006/07 the Pastoral and Agricultural regions have maintained the use of certifi cation and management systems but there has been a signifi cant fall in the number of South West respondents using these systems to guide their management decisions.
However, as a result of continued Department investment in this area, it is anticipated that the adoption will increase across all regions in the future.
Table 11: Percentage of Western Australian primary producers who have adopted a Quality Assurance, Environmental Management System or Code of Practice to guide their management decisions by region.
Source: NRM survey
Denotes a statistical increase at 95% confi dence level
Denotes a statistical decrease at 95% confi dence level
NB: Pre-2006 the question asked “In the last 12 months, have you participated in a formal assessment of your management practices, such as Quality Assurance (QA), Environmental Management System (EMS) or Code of Practice?” In May/June 2007 the question was asked “In the past 12 months, have you used a QA, EMS or Code of Practice to guide your management decisions?”
Effi ciency Indicators
The Agricultural Resource Management output accounts for a large number of activities that can be summarised as:
information products and services;
hectares assessed for risks, options and impacts;
regulatory actions under the Soil and Land Conservation Act;
Landcare grant administration; and
farm business development and rural community development.
2003/04 2004/05 2005/06 2006/07
South West Region 53 48 50 31
Agricultural Region 28 26 30 34
Pastoral Region 26 20 12 11
Total 33 31 34 32

Department of Agriculture and Food, Western Australia Annual Report 200750
Performance Indicators
The PIs for effi ciency of the ARM output relate directly to the above activities. In most cases, the effi ciency indicators consist of aggregate data from a number of different activities contributing to the same sub-output, e.g. an information product or service.
The fi gures in the following tables were allocated from the total ARM output cost of $136,769,000. Note that this amount includes the total value of grants approved and advanced to community members of $97,804,100. While contributing to the total cost of the output, this fi gure does not form part of effi ciency determinations.
PI 9 Average cost per information product
This was calculated by recognising that information products produced by the output are manifold and can be divided into the following categories:
publications which include serials, monographs and refereed papers;
cartographic products;
contributions to corporate publications; and
audio visual products such as CD ROMs and videos.
In all, 13 projects within the Department contributed to this indicator in 2007 and the average cost per information product is better than the 2007 target. As was forecast in last years KPI report, the reduction in funds allocated to this indicator is due to a reallocation towards meeting the Department’s obligation to NRM regional groups.
Table 12: Average cost per information product
Source: Project Managers, ARM Program, Department of Agriculture and Food
PI 10 Average cost per hectare assessed for risks, options and impacts
Dryland salinity, waterlogging, soil erosion by wind and surface water are examples of land degradation which may be caused by agricultural practices in Western Australia. These problems affect not only farm land, but public assets such as streams and rivers, native vegetation, nature reserves, road and rail infrastructure and rural towns. Under the Western Australian Government’s State Salinity Strategy (2000) the Department of Agriculture and Food undertook to provide all landholders in the agricultural areas with:
an assessment of current status of, and degradation risks to, natural resources in the south-west;
options for reducing those risks and their likely impacts; and
help in accessing further information.
This is a major initiative for the Department with a 5-year target of 19 million hectares and is being facilitated through the Rapid Catchment Appraisal project. The cost per hectare has risen in 2007 because fewer hectares were assessed than anticipated. This is because a large number of the remaining catchment appraisals being undertaken occurred in the South West where, because of agricultural and public land variability,
2005 20062007
Target2007
Total number of information products 786 696 720 756
Total Cost ($) 21,676,530 19,631,064 17,429,528 12,606,761
Average cost per information product ($) 27,578 28,206 24,208 16,676

Department of Agriculture and Food, Western Australia Annual Report 2007 51
Performance Indicators
the reports usually cover smaller areas and yet there is just as much work involved in preparing an appraisal for a small catchment area as for a large one. Because of this the effi ciency fi gure has returned to a similar level to that of 2005.
Table 13: Average cost per hectare assessed for risks, options and impacts
Source: Project Managers, ARM Program, Department of Agriculture and Food
* The NRM output attracted additional funds via contracting with NRM Regional Groups. These funds were allocated to this KPI and this is refl ected in the Total Cost being higher than targeted.
PI 11 Average cost per regulatory activity processed
The Department of Agriculture and Food is responsible for implementing the Soil and Land Conservation Act 1945. Key activities include conducting land degradation risk assessment for land clearing and drainage controls, investigation of complaints of poor land management and protection of native vegetation through covenants registered on land title. Land degradation risk assessments for clearing applications are provided to the Department of Environment and Conservation and the Department of Industry and Resources.
In 2007 there was a 4% decline in the number of land clearing proposals assessed and more signifi cantly the number of complaints registered and investigated declined by 30% compared to 2006. This was offset by increased drainage activity.
Table 14: Average cost per regulatory activity processed
Source: Register maintained by the Commissioner of Soil and Land Conservation
PI 12 Average cost per Landcare grant administered
The Department provides an important service to the community and agency through the administration of Landcare grants on behalf of the Commonwealth and State Governments and the larger than anticipated number of grants processed in 2007 has resulted in an increase in effi ciency over 2006. This increase in the number of Landcare
2005 2006 2007Target
2007
Total number hectare assessed for risks, options and impacts 3 million 7.6 million 5 million 3.1 million
Total Cost ($) 6,831,783 7,679,355 6,034,796 7,281,619*
Average cost per hectare assessed for risks, options and impacts ($) 2.28 1.01 1.21 2.35
2005 2006 2007Target
2007
Total number of regulatory actions processed 370 268 300 285
Total Cost ($) 8,156,242 7,479,234 6,827,419 6,450,895
Average cost per regulatory action processed ($) 22,044 27,908 22,758 22,635

Department of Agriculture and Food, Western Australia Annual Report 200752
Performance Indicators
grants processed is a refl ection of a near four fold increase in the value of the funds being provided for natural resource management. The increased cost of this output since 2005 is a result of the increased management and processing role associated with the administration of the Natural Heritage Trust (NHT)/National Action Plan (NAP)/National Landcare programme (NLP) funding programmes. It is expected that in the future increased monitoring and evaluation efforts will occur in this area. This will result in increase effectiveness of grant administration but may result in reduced effi ciency gains.
Table 15: Average cost per Landcare grant administered
Source: Natural Heritage Trust Secretariat
PI 13 Average administrative cost per participant in farm business and rural community development activities
This indicator demonstrates the effi ciency in delivering farm business development and rural community development activities. The lower than expected number of participants in 2007 was due to the dry season experienced across Western Australia and also to a shortage of networkers as the new FarmBis 3 program was commencing. This has resulted in an effi ciency improvement over 2006, but falls short of the 2007 target. Increased promotion of FarmBis should see improved involvement within the program in 2007/08.
Table 16: Average administrative cost per participant in farm business and rural community (FB/RC) development activities
Source: FarmBis Coordinator, Department of Agriculture and Food
* Whereas in previous years the Department of Agriculture and Food managed the entire FarmBis Program, with the commencement of the new program in 2006 the Rural Business Development Corporation has taken over management responsibilities, whilst the Department now only provides an administrative function under a Service for Contract. Hence the total cost for this indicator has been reduced as from now on it will only measure the administrative cost per participant of the program. This should be taken into account when comparing previous trends and also the targets in the 2006/07 budget statements.
2005 2006 2007
Total number of Landcare grants processed 351 388 459
Total Cost ($) 1,526,241 2,736,967 2,694,046
Average cost per Landcare grant processed ($) 4,348 7,054 5,869
2005 2006*2007
Target2007
Total number of participants in FB/RC development activities 3,999 3,097 4,000 3,355
Total Cost ($) 4,883,725 1,861,130 1,155,193 1,607,922
Average administrative cost per participants in FB/RC development activities ($) 1,221 601 289 479

Department of Agriculture and Food, Western Australia Annual Report 2007 53
Performance Indicators
Note 1
Comments on surveys used to obtain performance indicator information: population and sample sizes, response rates and levels of sampling error.
NRM Survey
In 2006/07, a survey was commissioned by the Natural Resource Management Program and conducted by market research company – Synovate. A total of 446 telephone interviews were conducted with Western Australian primary producers. The sample was drawn from Department of Agriculture and Food’s Client Resource Information System database of primary producers as a random stratifi ed sample.
The population of commercial primary producers in Western Australia is estimated at some 10,000 (ABARE 1997/98). The total sample of the general farming community had an associated maximum sampling error of ± 4.55% at the 95% confi dence level. That is, if the entire population was sampled, there would be 95% confi dence that the results fell within ± 4.55% of those quoted for the whole sample.
A stratifi ed sample was constructed and a sample was drawn from each region. The fi nal “overall” WA results were weighted to ensure that total survey results were representative of the population.
Respondents were telephoned and asked if they agreed to participate in the survey, and if they met the specifi ed criteria. An interview response rate of 22% was achieved.
The response rate was calculated as follows:
Prior to the commencement of the data analysis, the data was weighted to refl ect the actual distribution of farming properties both regionally and by main activity. As such, any of the aggregate results quoted are representative of Western Australia as a whole.
In more detail, the sample was quota’d to ensure that the sample was representative and of suffi cient size to comment on individual program areas and individual regions (minimum sub-samples were 50). The data was weighted based on information provided in a producer-by-program table entitled ‘WA Farms by Industry by Agriculture WA Region 1998/99’ supplied by the Department’s Marketing Economics and Rural Adjustment Unit.
Area Number of farms Survey sampleWeights for population
South West 2,577 90 1.149
Agricultural 7,942 295 1.080
Pastoral 619 61 0.401
TOTAL 11,138 446
%
Total contacts 2,368
Total in scope 2,087
Not suitable/incorrect numbers/ insuffi cient English to complete survey
494 23.7
Refusal 1,096 52.5
Terminated 31 0.01
Interviews 466 22.3

Department of Agriculture and Food, Western Australia Annual Report 200754
Performance Indicators
Output 3: BiosecurityOutcome: Effective management of biosecurity
Service description: Generation, integration and application of knowledge, policy and regulation to ensure agriculture and related resources are protected and that safety and quality standards are upheld.
Effectiveness Indicators
Key output areas of the protection program include those activities which prevent, or ensure early detection of, incursions by exotic pests, diseases and other biological and chemical threats. These threats have the potential to cause serious damage through loss of market access, productivity losses or cost increases.
A certain frequency of incursions is inevitable, to which the response is to remove or minimise the risk of spread or damage. Removal of properties from quarantine signifi es the effective local eradication or management of a pest or chemical threat.
Three streams of recorded activities are used to demonstrate program effectiveness. These refl ect the diversity of activities but also focus on matters of greater signifi cance to the industry.
PI 14 Animal disease identifi cation
PI 15 Pest interceptions by interstate and international barrier quarantine activities.
PI 16 Quarantine releases
The aggregated statistics are shown in Table 17. The table includes numbers of pests and diseases as well as numbers of identifi cations and interceptions. This to some extent corrects for the exaggerated infl uence of multiple occurrences associated with a single incident.
Table 17: Indicators
PI 14 Animal Diseases
For animal disease identifi cation, early identifi cation is critical to successful control of a disease. A primary focus is the identifi cation of potentially serious diseases. A disease is designated as being notifi able if it matches a set of criteria that relate to the likely scale of impact on agriculture and human health.
Output measure 2003/04 2004/05 2005/062006/07Target
2006/07
1Identifi cations of notifi able animal diseases
25 23 3 23 3
2 Number of animal diseases
5 5 3 6 2
3Interceptions of signifi cant pests, diseases & weeds
364 297 192 305 180
4 Number of pests 60 78 59 72 53
5Removal of properties from quarantine
119 106 101 103 142

Department of Agriculture and Food, Western Australia Annual Report 2007 55
Performance Indicators
The list of Notifi able Stock Diseases of Western Australia was modifi ed considerably between 2002 and 2006 to bring the State list into line with changes to the National list. This reduction in the list of notifi able diseases has also resulted in a reduction in the number of animal diseases and the identifi cations of these diseases over time. The fi nal changes occurred after the 2006/07 target was set, and so as this year’s numbers are comparable with those of 2005/06 they should be considered the new benchmark for this indicator.
PI 15 Interception of signifi cant pests, diseases and weeds
The total excludes interceptions of insects from international sources, which are reported to the Commonwealth Government. Indicator 4 - number of pests, diseases and weeds - is meant to minimise undue infl uence of individual pest species on the total, this indicates that 53 individual pests, diseases and weeds were intercepted a total of 180 times.
For pest interceptions by interstate and international barrier quarantine activities, effectiveness is the exclusion of quarantine risk material. Sampling indicates successful exclusion of insect pests, plant diseases and weeds. A given pest is deemed signifi cant when it is capable of infl icting a high damage cost. The number of pests as well as the interceptions of those pests was fewer than the target for the 2006/07 year, which is a positive result for the State, and is broadly in line with 2005/06. This measure does fl uctuate from year to year in the normal course of business.
PI 16 Quarantine
For quarantine releases, two activities - footrot eradication and chemical residues - were included to demonstrate effectiveness. When a property, fl ock or herd is released from quarantine, which may be by the issue of a permit, this signifi es either freedom from a pest threat or control of the problem by virtue of management arrangements in place. Progressive releases indicate wider freedom from the threat, and thereby reduce the number of properties or fl ocks subject to future release.
Overall, there was a further reduction in the total number of properties quarantined because of footrot or chemical contamination. In 2006/07 98 properties were removed from chemical residue quarantine and 44 from footrot quarantine. The 44 properties released from footrot are slightly less than last year’s number of 54 and there were 10 properties placed in quarantine. The 98 properties released from chemical residue are over double the fi gure of 47 for last year. The number of properties under management plans has continued to decline steadily over time from 724 in 2001/02 to 507 in 2006/07 which is also an indicator of the effectiveness of the project.
PI 17 Cost per freight consignment cleared or certifi ed
PI 18 Passenger quarantine checking cost (per passenger)
PI 19 Cost per property management plan for animal disease
PI 20 Cost per diagnostic samples processed (animal and plant disease and plant pest)
The activities relating to the Agriculture Protection service have generally been classifi ed according to the key areas of:
Providing barrier quarantine and export standards;
Managing animal and plant pests and diseases; and
Surveillance and preparedness activities (systems to detect incursions and outbreaks and take appropriate action).

Department of Agriculture and Food, Western Australia Annual Report 200756
Performance Indicators
Table 18: Agriculture protection service cost measures
The fi gures in Table 18 were allocated from the total service cost of $52.785 million (2006/07), $48.618 million (2005/06) and $43.714 million (2004/05). The total amount of funds spent by the Department for agricultural protection was $81.449 million, but includes approximately $28.664 million from the Agricultural Protection Board (APB) under a Memorandum of Understanding and Contract for Service with the Department. This expenditure is accounted for in the Board’s Annual Report.
The following observations and conclusions were drawn from the 2006/07 results.
PI 17 Cost per Freight Consignment
The 2006/07 cost per freight consignment fi gure is lower than the target for 2006/07 and approximately the same as 2005/06. The number of consignments cleared in 2006/07 was 31,470 compared to 29,667 in 2005/06, which is an increase of approximately 6%.
PI 18 Cost per passenger
The number of domestic passenger arrivals (via air, rail, sea and vehicle) subject to quarantine checks in 2006/07 was 2,215,922, an increase of 11% on the previous year. The numbers of passengers entering the State fl uctuates from year to year and this variation contributed to the actual cost per passenger being slightly below the target set in the 2006/07 budget statements.
PI 19 Cost per property management plan
The average cost per inspection to monitor property management plans decreased by 37% in 2006/07, however, the fi gures now include management plans for properties with Tuberculosis, Organo Chlorines, Footrot as well as newly counted properties with Liverfl uke and Bovine Johnes Disease. The fi gures for 2005/06 and the target for 2006/07 were based on property management plans for just the initial three conditions.
PI 20 Cost per Diagnostic sample
The average cost per diagnostic sample processed in 2006/07 increased by 49% from the previous year. This was largely as a result of the number of plant samples being down 57% from 2005/06 as there were 17,494 tests conducted for Wheat Streak Mosaic Virus (WSMV) last year, generated by an extensive surveillance campaign conducted throughout WA as part of an emergency response to the detection of WSMV in the State, whilst none were conducted this year.
Average cost per service ($) 2004/05 2005/062006/07Target
2006/07
Cost per freight consignment cleared or certifi ed 354 349 635 340
Passenger quarantine checking cost (per passenger) 5.60 5.52 6.29 6.01
Cost per property management plan for animal disease 9,177 12,166 10,426 7,633
Cost per diagnostic sample processed 384 390 503 581

Department of Agriculture and Food, Western Australia Annual Report 2007 57
Financial Statements
Certifi cation of Financial Statements
The accompanying fi nancial statements of the Department of Agriculture and Food have been prepared in compliance with the provisions of the Financial Management Act 2006 from proper accounts and records to present fairly the fi nancial transactions for the fi nancial year ending 30 June 2007 and the fi nancial position as at 30 June 2007.
At the date of signing we are not aware of any circumstances which would render any particulars included in the fi nancial statements misleading or inaccurate.
Ian Longson
ACCOUNTABLE OFFICER
31 August 2007
Mike Marsh CPA
CHIEF FINANCE OFFICER
31 August 2007

Department of Agriculture and Food, Western Australia Annual Report 200758
Financial Statements
Income Statementfor the year ended 30 June 2007
Note 2007$’000
2006$’000
COST OF SERVICES
ExpensesEmployee benefi ts expense 7 116,839 106,922 Depreciation and amortisation expense 8 8,449 7,713 Supplies and services 9 42,552 50,061 Other expenses 10 25,370 18,558 Grants and subsidies 11 107,213 108,902 Capital user charge 12 12,426 12,439
Total cost of services 312,849 304,595
IncomeRevenueUser charges and fees 13(a) 28,591 37,148 Commonwealth grants and contributions 13(b) 78,460 57,580 Grants and subsidies from non-Government sources 13(c) 49,673 41,631 Interest revenue 13(d) 2,845 1,296 Other revenue 9,894 13,369
Total revenue 169,463 151,024
Gains/(Losses)Gain on disposal of non-current assets 14 55 3 Gains (Losses) arising from changes in fair value- Livestock 118 49 Other gains 10 74
Total Gains 183 126
Total income other than income from State Government 169,646 151,150
NET COST OF SERVICES 143,203 153,445
INCOME FROM STATE GOVERNMENT 15
Service Appropriation 162,008 157,677 Resources received free of charge 353 840 Liabilities assumed by the Treasurer 2,913 1,735
Total income from State Government 165,274 160,252
SURPLUS/(DEFICIT) FOR THE PERIOD 22,072 6,807
The Income Statement should be read in conjunction with the accompanying notes.

Department of Agriculture and Food, Western Australia Annual Report 2007 59
Financial Statements
Balance Sheetas at 30 June 2007
Note2007$’000
2006$’000
ASSETSCurrent Assets
Cash and cash equivalents 16 30(a) 7,336 12,733Restricted cash and cash equivalents 17 30(a) 75,379 58,458Biological assets 18 1,877 2,274 Agricultural produce 343 310Inventories 19 1,776 2,017Receivables 20 14,081 10,579Amounts receivable for services 21 7,300 6,115Other current assets 22 1,507 1,623
Total Current Assets 109,599 94,109
Non-Current AssetsRestricted cash and cash equivalents 17 30(a) 605 199Amounts receivable for services 21 29,409 24,967Property, plant and equipment 24 178,585 152,114Other non-current assets 22 5,971 1,503
Total Non-Current assets 214,570 178,783
TOTAL ASSETS 324,169 272,892
LIABILITIESCurrent Liabilities
Payables 26 9,044 14,549Provisions 28 25,902 23,488Other current liabilities 27 395 1,632
Total Current Liabilities 35,341 39,669
Non-Current LiabilitiesProvisions 28 6,142 7,005
Total Non-Current liabilities 6,142 7,005
TOTAL LIABILITIES 41,483 46,674
NET ASSETS 282,686 226,218
EQUITY 29Contributed equity 16,304 4,382Reserves 168,711 146,237Accumulated surplus/(defi cit) 97,671 75,599
TOTAL EQUITY 282,686 226,218
TOTAL LIABILITIES AND EQUITY 324,169 272,892
The Balance Sheet should be read in conjunction with the accompanying notes.

Department of Agriculture and Food, Western Australia Annual Report 200760
Financial Statements
Statement of Changes in Equityfor the year ended 30 June 2007
Note2007$’000
2006$’000
Balance of equity at start of period 29 226,218 204,483
CONTRIBUTED EQUITYBalance at start of period 4,382 851
Capital Contribution 4,050 3,531Other contributions by owners 8,204 - Distributions to owners (332) -Balance at end of period 16,304 4,382
RESERVESAsset Revaluation ReserveBalance at start of periodInvestments 301 361Non-current assets 145,936 133,771
146,237 134,132 Gains/(losses) from asset revaluation- Investments 206 (60)
206 (60)Gains/(losses) from asset revaluation- Barrier fence 1,896 (60)- Land 21,413 6,501- Buildings (1,040) 5,663
22,269 12,164Total Gains/(losses) from asset revaluation 22,475 12,104
Balance at end of period Investments 507 301Non-current assets 168,204 145,936
168,711 146,237
ACCUMULATED SURPLUS(RETAINED EARNINGS)Balance at start of period 75,599 69,500Prior period errors - (708)Restated balance at start of period 75,999 68,792Total income for the period 22,072 6,807Balance at end of period 97,671 75,599
Balance of equity at end of period 29 282,686 226,218
Total income and expenses for the period 22,072 6,807
The Statement of Changes in Equity should be read in conjunction with the accompanying notes.

Department of Agriculture and Food, Western Australia Annual Report 2007 61
Financial Statements
Cash Flow Statementfor the year ended 30 June 2007
Note2007$’000
2006 $’000
CASH FLOWS FROM STATE GOVERNMENTService appropriations 149,641 150,331 Capital Contribution 4,050 3,531 Holding account drawdowns 21 1,345 1,471
Net cash provided by State Government 155,036 155,333
Utilised as follows:
CASH FLOWS FROM OPERATING ACTIVITIES Payments
Employee benefi ts (90,743) (94,343)Communications (1,966) (2,180)Services & contracts (39,245) (43,887)Capital User Charge (12,426) (12,439)GST payments on purchases (17,968) (17,036)Other payments (39,583) (19,220)Grants, subsidies & transfer payments (106,576) (105,830)
ReceiptsSales of goods and services 152,726 162,912 GST receipts on sales 7,041 7,356 GST receipts from taxation authority 10,954 8,886
Net cash provided by/(used in) operating activities 30 (b) (137,786) (115,781)
CASH FLOWS FROM INVESTING ACTIVITIESPurchase of non-current physical assets (5,470) (5,167)Proceeds from sale of non-current physical assets 150 78
Net cash provided by/(used in) investing activities (5,320) (5,089)
Net increase/(decrease) in cash and cash equivalents 11,930 34,463
Cash assets transferred from (to) other sources 29 - - Cash and Cash equivalents at the beginning of period 71,390 36,927
Cash and Cash Equivalents at the end of period 30 (a) 83,320 72,098
The Cash Flow Statement should be read in conjunction with the accompanying notes.

Department of Agriculture and Food, Western Australia Annual Report 200762
Financial StatementsSc
hedu
le o
f In
com
e an
d Ex
pens
es b
y Se
rvic
eFo
r th
e ye
ar e
nded
30
June
200
7Food a
nd
Fib
re I
nd
ust
ry
Deve
lop
men
t B
iose
cu
rity
Agri
cu
ltu
ral
Reso
urc
e
Man
agem
en
t
Serv
ices
pro
vid
ed t
o
Ru
ral
Bu
sin
ess
D
eve
lop
men
t C
orp
ora
tion
Tota
l
20
07
$’0
00
2
00
6$
’00
0
20
07
$’0
00
2
00
6$
’00
0
20
07
$’0
00
2
00
6$
’00
0
20
07
$’0
00
2
00
6$
’00
0
20
07
$’0
00
2
00
6$
’00
0
CO
ST
OF
SE
RV
ICE
S
Exp
ense
s E
mpl
oyee
ben
efi ts
exp
ense
51,1
21
49,5
71
40,6
08
34,9
87
24,5
36
21,8
95
574
469
116,
839
106,
922
Dep
reci
atio
n &
am
ortis
atio
n ex
pens
e3,
802
3,54
8 2,
788
2,46
8 1,
859
1,69
7 -
- 8,
449
7,71
3 S
uppl
ies
and
serv
ices
12,6
13
12,4
83
17,6
30
15,3
12
6,26
0 6,
174
6,04
9 16
,092
42
,552
50
,061
O
ther
exp
ense
s10
,676
9,
226
10,2
59
5,67
9 4,
213
3,48
1 22
1 17
2 25
,370
18
,558
G
rant
s, s
ubsi
dies
& t
rans
fer
paym
ents
3,98
3 3,
551
6,06
3 6,
082
97,1
67
99,2
69
- -
107,
213
108,
902
Cap
ital U
ser
Cha
rge
5,59
2 5,
722
4,10
1 3,
980
2,73
4 2,
737
- -
12,4
26
12,4
39
Tota
l co
st o
f se
rvic
es
87,7
87
84,1
01
81,4
49
68,5
08
136,
769
135,
253
6,84
4 16
,733
31
2,84
9 30
4,59
5
Inco
me
Rev
enu
e U
ser
char
ges
and
fees
5,
173
4,77
3 15
,194
14
,223
1,
380
1,41
8 6,
844
16,7
33
28,5
91
37,1
48
Com
mon
wea
lth g
rant
s an
d co
ntrib
utio
ns
438
411
627
442
77,3
95
56,7
27
- -
78,4
60
57,5
80
Gra
nts
and
subs
idie
s fro
m n
on-G
over
nmen
tso
urce
s 25
,874
19
,212
6,
056
3,66
1 17
,743
18
,758
-
- 49
,673
41
,631
Inte
rest
rev
enue
26
2 31
8 44
0 21
8 2,
143
760
- -
2,84
5 1,
296
Oth
er r
even
ue
2,93
4 5,
142
4,89
2 2,
132
2,06
8 6,
095
- -
9,89
4 13
,369
To
tal r
even
ue
34,6
81
29,8
56
27,2
09
20,6
76
100,
729
83,7
58
6,84
4 16
,733
16
9,46
3 15
1,02
4 G
ain
s G
ain
on d
ispo
sal o
f non
-cur
rent
ass
ets
25
1 18
1
12
1 -
- 55
3
Gai
ns a
risin
g fro
m c
hang
es in
fair
valu
e-
Live
stoc
k53
23
39
16
26
9
- -
118
49
Oth
er G
ains
5 32
3
27
2 15
10
74
To
tal G
ain
s 83
56
60
44
40
25
-
- 18
3 12
6
Tota
l in
com
e o
ther
th
an in
com
e fr
om
S
tate
Go
vern
men
t 34
,764
29
,912
27
,269
20
,720
10
0,76
983
,784
6,84
416
,733
169,
646
151,
150
NE
T C
OS
T O
F S
ER
VIC
ES
53
,023
54
,189
54
,179
47
,788
36
,000
51
,469
-
- 14
3,20
2 15
3,44
5

Department of Agriculture and Food, Western Australia Annual Report 2007 63
Financial StatementsSc
hedu
le o
f In
com
e an
d Ex
pens
es b
y Se
rvic
e(c
onti
nued
)Fo
r th
e ye
ar e
nded
30
June
200
7
Food a
nd
Fib
re I
nd
ust
ry
Deve
lop
men
t B
iose
cu
rity
Agri
cu
ltu
ral
Reso
urc
e
Man
agem
en
t
Serv
ices
pro
vid
ed t
o
Ru
ral
Bu
sin
ess
D
eve
lop
men
t C
orp
ora
tion
Tota
l
20
07
$’0
00
2
00
6$
’00
0
20
07
$’0
00
2
00
6$
’00
0
20
07
$’0
00
2
00
6$
’00
0
20
07
$’0
00
2
00
6$
’00
0
20
07
$’0
00
2
00
6$
’00
0
IN
CO
ME
FR
OM
STA
TE
GO
VE
RN
ME
NT
S
ervi
ce A
ppro
pria
tions
47,1
71
49,5
24
61,8
13
62,1
69
53,0
24
45,9
84
- -
162,
008
157,
677
Res
ourc
es r
ecei
ved
free
of c
harg
e15
9 38
6 11
6 26
9 78
18
5 -
- 35
3 84
0 Li
abilit
ies
assu
med
by
the
Trea
sure
r1,
311
798
961
555
641
382
- -
2,91
3 1,
735
To
tal I
nco
me
fro
m S
tate
Go
vern
men
t 48
,641
50
,708
62
,890
62
,993
53
,743
46
,551
-
- 16
5,27
4 16
0,25
2
Su
rplu
s/(d
efi c
it)
for
the
per
iod
(4
,382
) (3
,481
)8,
711
15,2
05
17,7
43
(4,9
18)
- -
22,0
72
6,80
7
The
Sch
edul
e of
Inco
me
and
Exp
ense
s by
Ser
vice
sho
uld
be
read
in c
onju
nctio
n w
ith t
he a
ccom
pan
ying
not
es.

Department of Agriculture and Food, Western Australia Annual Report 200764
Financial StatementsSu
mm
ary
of C
onso
lidat
ed F
und
App
ropr
iati
ons
and
Inco
me
Esti
mat
esfo
r th
e ye
ar e
nded
30
June
200
7 N
ote
20
07
Est
imate
$
’00
0
20
07
Actu
al
$’0
00
V
ari
ati
on
$
’00
0
Note
20
07
Actu
al
$’0
00
20
06
Actu
al
$’0
00
V
ari
ati
on
$
’00
0
Item
48
Net
am
ou
nt
app
rop
riat
ed t
o d
eliv
er s
ervi
ces
161,
653
161,
743
90
161,
743
157,
522
(4,2
21)
Am
ount
aut
horis
ed b
y O
ther
Sta
tute
s -
Sal
arie
s &
Allo
wan
ces
Act
197
5 15
9 26
5 10
6 26
5 15
5 (1
10)
Tota
l ap
pro
pri
atio
ns
pro
vid
ed t
o d
eliv
er s
ervi
ces
35.1
161,
812
162,
008
196
35.1
016
2,00
8 15
7,67
7 (4
,331
)
DE
TAIL
S O
F E
XP
EN
SE
S B
Y S
ER
VIC
E
Food
and
Fib
re In
dust
ry D
evel
opm
ent
35.2
88,3
53
87,7
87
(566
)35
.11
87,7
87
84,1
01
(3,6
86)
Agr
icul
tura
l Res
ourc
e M
anag
emen
t 35
.314
6,92
9 13
6,76
9 (1
0,16
0)
35.1
213
6,76
9 13
5,25
3 (1
,516
)
Bio
secu
rity
35.4
60,0
71
81,4
49
21,3
78
35.1
381
,449
68
,508
(1
2,94
1)
Ser
vice
s P
rovi
ded
to R
ural
Bus
ines
s D
evel
opm
ent
Cor
pora
tion
35.5
3,12
3 6,
844
3,72
1 35
.14
6,84
4 16
,733
9,
889
Tota
l Cos
t of
Ser
vice
s 29
8,47
6 31
2,84
9 14
,373
31
2,84
9 30
4,59
5 (8
,254
)
Less
Tot
al in
com
e 35
.6 (1
33,6
12)
(169
,463
) (3
5,85
1)35
.15
(169
,463
)(1
51,0
24)
18,4
39
N
et C
ost
of S
ervi
ces
164,
864
143,
386
(21,
478
)14
3,38
6 15
3,57
1 10
,185
Adj
ustm
ents
(i)
(3
,052
)18
,622
(2
1,67
4)
18,6
22
4,10
6 (1
4,51
6)
Tota
l ap
pro
pri
atio
ns
pro
vid
ed t
o d
eliv
er s
ervi
ces
161,
812
162,
008
196
162,
008
157,
677
(4,3
31)

Department of Agriculture and Food, Western Australia Annual Report 2007 65
Financial StatementsSu
mm
ary
of C
onso
lidat
ed F
und
App
ropr
iati
ons
and
Reve
nue
Esti
mat
es (
cont
inue
d)fo
r th
e ye
ar e
nded
30
June
200
7 N
ote
20
07
Est
imate
$’0
00
20
07
Actu
al
$’0
00
V
ari
ati
on
$
’00
0
Note
20
07
Actu
al
$’0
00
20
06
Actu
al
$’0
00
V
ari
ati
on
$’0
00
CA
PIT
AL
Item
143
Cap
ital
Co
ntr
ibu
tio
n
Cap
ital
Exp
end
itu
re
Pur
chas
e of
non
-cur
rent
phy
sica
l ass
ets
35.7
11,3
15
9,71
4 (1
,601
)9,
714
5,71
2 (4
,002
)A
djus
tmen
t fo
r ot
her
fund
ing
sour
ces
(6,
115)
(9,7
14)
(3,5
99)
(9,7
14)
(2,1
81)
7,53
3
Cap
ital
Co
ntr
ibu
tio
n (a
pp
rop
riat
ion
) 5,
200
- (5
,200
)-
3,53
1 3,
531
AD
MIN
IST
ER
ED
TR
AN
SA
CT
ION
S
Item
39
Am
ou
nt
pro
vid
ed f
or
Ad
min
iste
red
Gra
nts
,S
ub
sid
ies
and
Tra
nsf
er P
aym
ents
Adm
inis
tere
d ca
pita
l app
ropr
iatio
ns
35.8
- 4,
292
4,29
2 35
.16
4,29
2 1,
226
(3,0
66)
Tota
l Ad
min
iste
red
tra
nsa
cti
on
s
- 4,
292
4,29
2
4,29
2 1,
226
(3,0
66)
GR
AN
D T
OTA
L O
F A
PP
RO
PR
IAT
ION
S
167,
012
166,
300
(712
)16
6,30
0 16
2,43
4 (3
,866
)
DE
TAIL
OF
INC
OM
E E
ST
IMA
TE
S
Inco
me
disc
lose
d as
Adm
inis
tere
d In
com
e35
.983
324
3(5
90)
243
38(2
05)
(i) A
djus
tmen
ts a
re r
elat
ed to
mov
emen
ts in
cas
h ba
lanc
es a
nd o
ther
acc
rual
item
s su
ch a
s re
ceiv
able
s, p
ayab
les
and
supe
rann
uatio
n.
The
Sum
mar
y of
Con
solid
ated
Fun
d A
ppro
pria
tions
, Var
ianc
es to
Bud
get
and
Act
ual s
houl
d be
rea
d in
con
junc
tion
with
the
acc
ompa
nyin
g no
tes.
This
Sum
mar
y pr
ovid
es t
he b
asis
for
the
Exp
lana
tory
Sta
tem
ent
Info
rmat
ion
requ
irem
ents
of
Trea
sure
r’s In
stru
ctio
n, T
I 945
, set
out
in n
ote
35.

Department of Agriculture and Food, Western Australia Annual Report 200766
Financial Statements
1 Departmental mission and funding The Department of Agriculture and Food will accelerate the success of agriculture, food and fi bre
industries through information, science and innovation, responsible management of the resource base, policy and regulation across all elements of the supply chain.
The Department is predominantly funded by Parliamentary appropriations. The fees charged are determined by prevailing market forces. The fi nancial statements encompass all funds through which the Department controls resources to carry on its functions.
2 Australian equivalents to International Financial Reporting Standards
General
The Department’s fi nancial statements for the year ended 30 June 2007 have been prepared in accordance with Australian equivalents to International Financial Reporting Standards (AIFRS), which comprise a Framework for the Preparation and Presentation of Financial Statements (the Framework) and Australian Accounting Standards (including the Australian Accounting Interpretations).
In preparing these fi nancial statements the Department has adopted, where relevant to its operations, new and revised Standards and Interpretations from their operative dates as issued by the Australian Accounting Standards Board (AASB) and formerly the Urgent Issues Group (UIG).
Early adoption of standards The Department cannot early adopt an Australian Accounting Standard or Australian Accounting
Interpretation unless specifi cally permitted by TI 1101 ‘Application of Australian Accounting Standards and Other Pronouncements’. No Standards and Interpretations that have been issued or amended but are not yet effective have been early adopted by the Department for the annual reporting period ended 30 June 2007.
3 Summary of signifi cant accounting policies The following accounting policies have been adopted in the preparation of the fi nancial statements. Unless
otherwise stated these policies are consistent with those adopted in the previous year.
(a) General Statement
The fi nancial statements constitute a general purpose fi nancial report which has been prepared in accordance with the Australian Accounting Standards, the Framework, Statements of Accounting Concepts and other authoritative pronouncements of the Australian Accounting Standards Board as applied by the Treasurer’s Instructions. Several of these are modifi ed by the Treasurer’s instructions to vary application, disclosure, format and wording.
The Financial Management Act 2006 and the Treasurer’s Instructions are legislative provisions governing the preparation of fi nancial statements and take precedence over the Accounting Standards, the Framework, Statements of Accounting Concepts and other authoritative pronouncements of the Australian Accounting Standards Board.
Where modifi cation is required and has a material or signifi cant fi nancial effect upon the reported results, details of that modifi cation and the resulting fi nancial effect are disclosed in the notes to the fi nancial statements.
(b) Basis of preparation
The fi nancial statements have been prepared in accordance with Accounting Standard AAS 29 ‘Financial Reporting by Government Departments’ on the accrual basis of accounting using the historical cost convention, modifi ed by the revaluation of land, buildings and infrastructure which have been measured at fair value. The accounting policies adopted in the preparation of the fi nancial statements have been consistently applied throughout all periods presented unless otherwise stated. The fi nancial statements are presented in Australian dollars rounded to the nearest thousand dollars ($’000).

Department of Agriculture and Food, Western Australia Annual Report 2007 67
Financial Statements
(c) Reporting entity
Administered assets, liabilities, expenses and revenues are not integral to the Department in carrying out its functions and are disclosed in the notes to the fi nancial statements, forming part of the general purpose fi nancial report of the Department. The administered items are disclosed on the same basis as is described above for the fi nancial statements of the Department. The administered assets, liabilities, expenses and revenues are those which the Government requires the Department to administer on its behalf. The assets do not render any service potential or future economic benefi ts to the Department, the liabilities do not require the future sacrifi ce of service potential or future economic benefi ts of the Department, and the expenses and revenues are not attributable to the Department.
The Department administers assets, liabilities, income and expenses on behalf of Government which are not controlled by, nor integral to the function of the Department. These administered balances and transactions are not recognised in the principal fi nancial statements of the Department but schedules are prepared using the same basis as the fi nancial statements and are presented at note 44 (i) ‘Administered expenses and income’ and note 44 (ii) ‘Administered assets and liabilities’.
(d) Contributed Equity
UIG Interpretation 1038 ‘Contributions by Owners Made to Wholly-Owned Public Sector Entities’ requires transfers in the nature of equity contributions to be designated by the Government (the owner) as contributions by owners (at the time of, or prior to transfer) before such transfers can be recognised as equity contributions. Capital contributions (appropriations) have been designated as contributions by owners by Treasurer’s Instruction (TI) 955 ‘Contributions by Owners made to Wholly Owned Public Sector Entities’ and have been credited directly to Contributed Equity.
Transfer of net assets to/from other agencies are designated as contributions by owners where the transfers are non discretionary and non reciprocal.See note 29 ‘Equity’.
(e) Income
Revenue recognition Revenue is measured at the fair value of consideration received or receivable.
Revenue is recognised for the major business activities as follows:
Sale of goods Revenue is recognised from the sale of goods and disposal of other assets when the signifi cant risks
and rewards of ownership control transfer to the purchaser and can be measured reliably.
Rendering of ServicesRevenue is recognised on delivery of the service or by reference to the stage of completion of the transaction.
InterestRevenue is recognised as the interest accrues.
Service AppropriationsService Appropriations are recognised as revenues in the period in which the Department gains control of the appropriated funds. The Department gains control of appropriated funds at the time those funds are deposited into the Department’s bank account or credited to the holding account held at Treasury. See note 15 ‘Income from State Government’ for further details.
Net Appropriation Determination The Treasurer may make a determination providing for prescribed receipts to be retained for services
under the control of the Department. In accordance with the determination specifi ed in the 2006/07 Budget Statements, the Department retained $170.54 million in 2007 ($179.15m in 2006) from the following:
- proceeds from fees and charges;- Commonwealth specifi c purpose grants and contributions;- one-off revenues with a sale of less than $10,000 derived from the sale of property other than
real property;- revenues from services provided though the establishment of Memorandum of Understandings; and- other Departmental revenue.

Department of Agriculture and Food, Western Australia Annual Report 200768
Financial Statements
Grants and Other Contributions Revenue Revenue is recognised at fair value when the Department obtains control over the assets comprising the
contributions which is usually when cash is received.
Other non-reciprocal contributions that are not contributions by owners are recognised at their fair value. Contributions of services are only recognised when a fair value can be reliably determined and the services would be purchased if not donated.
Where contributions recognised as revenues during the reporting period were obtained on the condition that they be expended in a particular manner or used over a particular period, and those conditions were undischarged as at the balance sheet date, the nature of, and amounts pertaining to, those undischarged conditions are disclosed in the notes.
Gains Gains may be realised or unrealised and are usually recognised on a net basis. These include gains
arising on the disposal of non-current assets and some revaluations of non-current assets.
(f) Property, Plant and Equipment Initial recognition and measurement The cost method of accounting is used for all acquisitions of assets. Cost is measured as the fair value
of the assets given up or liabilities undertaken at the date of acquisition plus incidental costs directly attributable to the acquisition.
Assets acquired at no cost or for nominal consideration, are initially recognised at their fair value at the date of acquisition.
Capitalisation/expensing of assets Items of property, plant and equipment and infrastructure costing over $1,000 are recognised as assets
and the cost of utilising assets is expensed (depreciated) over their useful lives. Items of property, plant and equipment and infrastructure costing less than $1,000 are immediately expensed direct to the Income Statement (other than where they form part of a group of similar items which are signifi cant in total).
Subsequent measurement After recognition as an asset, the Department uses the revaluation model for the measurement of land,
buildings and infrastructure and the cost model for all other property, plant and equipment. Land, buildings and infrastructure are carried at fair value less accumulated depreciation on buildings and infrastructure and accumulated impairment losses. All other items of property, plant and equipment are carried at historical cost less accumulated depreciation and accumulated impairment losses.
Where market evidence is available, the fair value of land and buildings is determined on the basis of current market buying values determined by reference to recent market transactions. When buildings are revalued by reference to recent market transactions, the accumulated depreciation is eliminated against the gross carrying amount of the asset and the net amount restated to the revalued amount.
Where market based evidence is not available, the fair value of land and buildings is determined on the basis of existing use. This normally applies where buildings are specialised or where land use is restricted. Fair value for existing use assets is determined by reference to the cost of replacing the remaining future economic benefi ts embodied in the asset, ie. the depreciated replacement cost. Where the fair value of buildings is dependent on using the depreciated replacement cost, the gross carrying amount and the accumulated depreciation are restated proportionately.
Independent valuations of land and buildings are provided annually by the Western Australian Land Information Authority (Valuation Services) and recognised with suffi cient regularity to ensure that the carrying amount does not differ materially from the asset’s fair value at the balance sheet date. The most signifi cant assumptions in estimating fair value are made in assessing whether to apply the existing use basis to assets and in determining estimated useful life. Professional judgment by the valuer is required where the evidence does not provide a clear distinction between market type assets and existing use assets.
Refer to note 24 ‘Property, plant and equipment’ for further information on revaluations.

Department of Agriculture and Food, Western Australia Annual Report 2007 69
Financial Statements
Depreciation All non-current assets having a limited useful life are systematically depreciated over their useful lives in a
manner which refl ects the consumption of their future economic benefi ts.
Depreciation is provided for on the straight line basis, using rates which are reviewed annually. Useful life of each class of depreciating asset is:
Buildings 20 - 40 years Vehicles & Transportation Equipment 8 years IT Equipment 4 years Furniture & Fittings 10 years Plant & Equipment 5 - 10 years Offi ce Equipment 5 - 10 years Farm Equipment 10 years Laboratory & Scientifi c Equipment 5 years
(g) Impairment of Assets
Property, plant and equipment are tested for any indication of impairment at each reporting date. Where there is an indication of impairment, the recoverable amount is estimated. Where the recoverable amount is less than the carrying amount, the asset is considered impaired and is written down to the recoverable amount and an impairment loss is recognised. As the Department is a not-for-profi t entity, unless an asset has been identifi ed as a surplus asset, the recoverable amount is the higher of an asset’s fair value less costs to sell and depreciated replacement cost.
The risk to impairment is generally limited to circumstances where an asset’s depreciation is materially understated or where the replacement cost is falling or where there is a signifi cant change in useful life. Each relevant class of asset is reviewed annually to verify that the accumulated depreciation / amortisation refl ects the level of consumption or expiration of the asset’s future economic benefi ts and to evaluate any impairment risk from falling replacement costs.
For assets identifi ed as surplus assets, the recoverable amount is the higher of fair value less costs to sell and the present value of future cash fl ows expected to be derived from the asset. Surplus assets carried at fair value have no risk of material impairment where fair value is determined by reference to market-based evidence. Where fair value is determined by reference to depreciated replacement cost, surplus assets are at risk of impairment and the recoverable amount is measured. Surplus assets at cost are tested for indications of impairment at each reporting date. See note 25 “Impairment of Assets”.
(h) Non-Current Assets (or Disposal Groups) Classifi ed as Held for Sale
Non-current assets (or disposal groups) held for sale are recognised at the lower of carrying amount and fair value less costs to sell and are presented separately in the Balance Sheet. Assets classifi ed as held for sale are not depreciated or amortised.
All land holdings are Crown land vested in the Department by the Government. The Department for Planning and Infrastructure (DPI) is the only agency with the power to sell Crown land. The Department transfers Crown land and any atttaching buildings to DPI when the land becomes available for sale.
Refer note 23 “Non-Current assets classifi ed as held for sale”
(i) Inventories
Inventories comprising livestock and fi eld crops are valued at net realisable value. See note 18 “Biological assets”. Raw material and stores are measured at the lower of cost and net realisable value. See note 19 “Inventories”.

Department of Agriculture and Food, Western Australia Annual Report 200770
Financial Statements
(j) Provisions
Provisions are liabilities of uncertain timing and amount and are recognised where there is a present legal, equitable or constructive obligation as a result of a past event and when the outfl ow of resources embodying economic benefi ts is probable and a reliable estimate can be made of the amount of the obligation. Provisions are reviewed at each balance sheet reporting date. See note 28 ‘Provisions’.
Provisions - Employee benefi ts (i) Annual Leave and Long Service Leave
The liability for annual and long service leave expected to be settled within 12 months after the end of the balance sheet date is recognised and measured at the undiscounted amounts expected to be paid when the liabilities are settled. Annual and long service leave expected to be settled more than 12 months after the end of the reporting date is measured at the present value of amounts expected to be paid when the liabilities are settled. Leave liabilities are in respect of services provided by employees up to the reporting date.
When assessing expected future payments consideration is given to expected future wage and salary levels including non-salary components such as employer superannuation contributions. In addition, the long service leave liability also considers the experience of employee departures and periods of service.
The expected future payments are discounted using market yields at the reporting date on national government bonds with terms to maturity that match, as closely as possible, the estimated future cash outfl ows.
A liability for long service leave is recognised after an employee has completed four years of service. An actuarial assessment of long service leave undertaken by PricewaterhouseCoopers Actuaries in 2007 determined that the liability measured using the short-hand method was not materially different from the liability measured using the present value of expected future payments.
(ii) Superannuation
The Government Employees Superannuation Board (GESB) administers the following superannuation schemes.
Employees may contribute to the Pension Scheme, a defi ned benefi t pension scheme now closed to new members or the Gold State Superannuation Scheme (GSS), a defi ned benefi t lump sum scheme also closed to new members. The Department has no liabilities for superannuation charges under the Pension or the GSS Schemes as the liability has been assumed by the Treasurer.
Employees who are not members of either the Pension or the GSS Schemes become non contributory members of the West State Superannuation Scheme (WSS), an accumulation fund. The Department makes concurrent contributions to GESB on behalf of employees in compliance with the Commonwealth Government’s Superannuation Guarantee (Administration) Act 1992. These contributions extinguish the liability for superannuation charges in respect of the WSS Scheme.
The GESB makes all benefi t payments in respect of the Pension and GSS Schemes, and is recouped by the Treasurer for the employer’s share. See note 7 “Employee benefi t expense”.
(iii) Provisions - Other
Employee benefi t on-costsEmployment on-costs, including workers’ compensation insurance, are not employee benefi ts and are recognised separately as liabilities and expenses when the employment to which they relate has occurred. Employment on-costs are included as part of ‘Other expenses’ and are not included as part of the Department’s ‘Employee benefi ts expense’. See note 7 “Employee benefi t expense”

Department of Agriculture and Food, Western Australia Annual Report 2007 71
Financial Statements
(k) Superannuation expense
The following elements are included in calculating the superannuation expense in the Income Statement: (a) Defi ned benefi t plans - Change in the unfunded employer’s liability (i.e. current service cost and,
actuarial gains and losses) assumed by the Treasurer in respect of current employees who are members of the Pension Scheme and current employees who accrued a benefi t on transfer from that Scheme to the Gold State Superannuation Scheme (GSS); and
(b) Defi ned contribution plans - Employer contributions paid to the West State Superannuation Scheme (WSS), and the equivalent of employer contributions to the GSS.
Defi ned benefi t plans - in order to refl ect the true cost of services, the movements (i.e. current service cost and, actuarial gains and losses) in the liabilities in respect of the Pension Scheme and the GSS Scheme transfer benefi ts are recognised as expenses directly in the Income Statement. As these liabilities are assumed by the Treasurer (refer note 15 III), a revenue titled ‘Liabilities assumed by the Treasurer’ equivalent to the expense is recognised under Income from State Government in the Income Statement. See note 15 ‘Income from State Government’.
Defi ned contribution plans - in order to refl ect the Department’s true cost of services, the Department is funded for the equivalent of employer contributions in respect of the GSS Scheme (excluding transfer benefi ts). These contributions were paid to the GESB during the year and placed in a trust account administered by the GESB on behalf of the Treasurer. The GESB subsequently paid these employer contributions in respect of the GSS Scheme to the Consolidated Account.
(l) Financial instruments
The Department has two categories of fi nancial instrument: • Loans and receivables (cash and cash equivalents, receivables); and
• Non trading fi nancial liabilities (fi nance leases, payables, Treasurer’s advance).
Initial recognition and measurement of fi nancial instruments is at fair value which normally equates to the transaction cost or the face value. Subsequent measurement is at amortised cost using the effective interest method.
The fair value of short-term receivables and payables is the transaction cost or the face value because there is no interest rate applicable and subsequent measurement is not required as the effect of discounting is not material. See note 41 ‘Financial Instruments’
(m) Leases
The Department has entered into a number of operating lease arrangements for motor vehicles, buildings and offi ce equipment where the lessors effectively retain all of the risks and benefi ts incidental to ownership of the items held under the operating leases.
Lease payments are expensed on a straight line basis over the lease term as this represents the pattern of benefi ts derived from the leased properties.
(n) Receivables
Receivables are recognised and carried at original invoice amount less an allowance for uncollectible amounts (i.e. impairment). The collectability of receivables is reviewed on an ongoing basis and any receivables identifi ed as uncollectible are written off. The allowance for uncollectible amounts (doubtful debts) is raised when there is objective evidence that the Department will not be able to collect the debts. The carrying amount is equivalent to fair value as it is due for settlement within 30 days. See note 41 ‘Financial Instruments’ and note 20 ‘Receivables’.
(o) Accrued Salaries
The accrued salaries suspense account consists of amounts paid annually into a suspense account over a period of 10 fi nancial years to largely meet the additional cash outfl ow in each eleventh year when 27 pay days occur in that year instead of the normal 26. No interest is received on this account. See note 17 “Restricted cash and cash equivalents”.

Department of Agriculture and Food, Western Australia Annual Report 200772
Financial Statements
Accrued salaries represent the amount due to staff but unpaid at the end of the fi nancial year, as the end of the last pay period for that fi nancial year does not coincide with the end of the fi nancial year. Accrued salaries are settled within a few days of the fi nancial year end. The Department considers the carrying amount of accrued salaries to be equivalent to the net fair value. See note 27 “Other Current Liabilities”.
(p) Payables
Payables are recognised when the Department becomes obliged to make future payments as a result of a purchase of assets or services. The carrying amount is equivalent to fair value, as they are generally settled within 30 days. See note 41 ‘Financial Instruments’ and note 26 ‘Payables’.
(q) Joint Controlled Operations
Interests in joint venture operations have been reported in the fi nancial statements including the Department’s share of assets employed in the joint ventures, the share of liabilities incurred in relation to the joint ventures and the share of any expenses incurred in relation to the joint ventures in their respective classifi cation categories. Details of the Department’s interest in assets are set out in Note 40 “Jointly controlled operations”.
(r) Amounts Receivable for Services (Holding Account)
The Department receives appropriation funding on an accrual basis that recognises the full annual cash and non-cash cost of services. The appropriations are paid partly in cash and partly as an asset (Holding Account receivable) that is accessible on the emergence of the cash funding requirement to cover items such as leave entitlements and asset replacement.
See also note 15 ‘Income from State Government’ and note 21 ’Amounts receivable for services’.
(s) Cash and Cash Equivalents
For the purpose of the Cash Flow Statement, cash and cash equivalents include cash assets and restricted cash assets. These include cash on hand, short-term deposits with original maturities of 3 months or less that are readily convertible to cash on hand and are subject to insignifi cant risk of changes in value.
(t) Research and Development Costs
Research and development costs are charged against income in the Statement of Financial Performance as incurred, except to the extent that such costs, together with unamortised deferred costs in relation to a project, are expected, beyond reasonable doubt, to be recoverable.
(u) Resources received free of charge or for nominal value
Resources received free of charge or for nominal value which can be reliably measured are recognised as income and as assets or expenses as appropriate at fair value.
(v) Comparative Figures
Comparative fi gures are, where appropriate, reclassifi ed to be comparable with the fi gures presented in the current fi nancial year.
(w) Revaluation of Land and Buildings
Valuation of Non-Current Assets The Department has a policy of valuing land and buildings at fair value. The annual revaluations of the
Department’s land and buildings undertaken by the Land Information Authority (Valuation Services) are recognised in the fi nancial statements. See note 24 “Property, plant and equipment”.
(x) Goods and Services Tax
In accordance with the grouping provisions the right to receive GST and the obligation to pay GST rests with the Department of Agriculture and Food in regard to all GST transactions incurred by members of the group. As a result separate GST transactions are not recognised within the individual members’ fi nancial statements as they are all brought to account in the Department of Agriculture and Food’s fi nancial statements.

Department of Agriculture and Food, Western Australia Annual Report 2007 73
Financial Statements
4 Disclosure of changes in accounting policy and estimates Initial application of an Australian Accounting Standard The Department has applied the following Australian Accounting Standards and Australian Accounting
Interpretations effective for annual reporting periods beginning on or after 1 July 2006:
1. AASB 2005-9 ‘Amendments to Australian Accounting Standards [AASB 4, AASB 1023, AASB 139 & AASB 132]’ (Financial guarantee contracts).
2. UIG Interpretation 4 ‘Determining whether an Arrangement Contains a Lease’ as issued in June 2005.
3. UIG Interpretation 9 ‘Reassessment of Embedded Derivatives’.
The Department at the balance sheet date does not currently undertake these types of transactions and there is no fi nancial impact in applying the Standard.
The following Australian Accounting Standards and Interpretations are not applicable to the Department as they have no impact or do not apply to not for profi t entities:
AASB Standards and Interpretations
2005-1 ‘Amendments to Australian Accounting Standard’ (AASB 139 - Cash fl ow hedge accounting of forecast intragroup transactions) 2005-5 ‘Amendments to Australian Accounting Standards [AASB 1 & AASB 139)’ 2006-1 ‘Amendments to Australian Accounting Standards [AASB 121]’ 2006-3 ‘Amendments to Australian Accounting Standards [AASB 1045]’ 2006-4 ‘Amendments to Australian Accounting Standards [AASB 134]’ 2007-2 ‘Amendments to Australian Accounting Standards arising from AASB Interpretation 12 [AASB 1, AASB 117, AASB 118, AASB 120, AASB 121, AASB 127, AASB 131 & AASB 139]’ – paragraph 9 UIG 5 ‘Rights to Interests arising from Decommissioning, Restoration and Environmental Rehabilitation Funds’ UIG 6 ‘Liabilities arising from Participating in a Specifi c Market – Waste Electrical and Electronic Equipment’ UIG 7 ‘Applying the Restatement Approach under AASB 129 Financial Reporting in Hyperinfl ationary Economies’
Future impact of Australian Accounting Standards not yet operative
The Department cannot adopt Australian Accounting Standard or Australian Accounting Interpretation unless specifi cally permitted by TI 1101 ‘Application of Australian Accounting Standards and Other Pronouncements’. Consequently, the Department has not applied the following Australian Accounting Standards and Australian Accounting Interpretations that have been issued but are not yet effective.
The following standards are: (a) to be applied to annual reporting periods beginning on or after 1 January 2007: - AASB 7 ‘Financial Instruments: Disclosures’ (including consequential amendments in AASB
2005-10 ‘Amendments to Australian Accounting Standards [AASB 132, AASB 101, AASB 114, AASB 117, AASB 133, AASB 139, AASB 1, AASB 4, AASB 1023 & AASB 1038]’).
- AASB 2005-10 ‘Amendments to Australian Accounting Standards (AASB 132, AASB 101, AASB 114, AASB 117, AASB 133, AASB 139, AASB 1, AASB 4, AASB 1023, & AASB 1038)’.
- AASB 101 ‘Presentation of Financial Statements’.
(b) to be applied to annual reporting periods beginning on or after 1 July 2007: - AASB 2007-4 ‘Amendments to Australian Accounting Standards arising from ED 151 and
Other Amendments (AASB 1, 2, 3, 4, 5, 6, 7, 102, 107, 108, 110, 112, 114, 116, 117, 118, 119, 120, 121, 127, 128, 129, 130, 131, 132, 133, 134, 136, 137, 138, 139, 141, 1023 & 1038)’.
- AASB 2007-5 ‘Amendment to Australian Accounting Standard – Inventories Held for Distribution by Not-for-Profi t Entities (AASB 102)’.

Department of Agriculture and Food, Western Australia Annual Report 200774
Financial Statements
(c) to be applied to annual reporting periods beginning on or after 1 January 2008. - AASB Interpretation 4 ‘Determining whether an Arrangement Contains a Lease [revised]’.
- AASB Interpretation 12 ‘Service Concession Arrangements’. - AASB Interpretation 129 ‘Service Concession Arrangements: Disclosures [revised]’.
The following amendments are not applicable to the Department as they will have no impact:
AASB Amendment Affected Standards
AASB 8 ‘Operating Segments’ AASB 1049 ’Financial Reporting of General Government Sectors by Governments’ AASB 2007-1 ‘Amendments to Australian Accounting Standards arising from AASB Interpretation 11 [AASB 2]’ AASB 2007-2 ‘Amendments to Australian Accounting Standards arising from AASB Interpretation 12 [AASB 1, AASB 117, AASB 118, AASB 120, AASB 121, AASB 127, AASB 131 & AASB 139]’ – paragraphs 1 to 8 AASB 2007-3 ‘Amendments to Australian Accounting Standards arising from AASB 8 [ AASB 5, AASB 6, AASB 102, AASB 107, AASB 119, AASB 127, AASB 134, AASB 136, AASB 1023 & AASB 1038]’ Interpretation 10 ‘Interim Financial Reporting and Impairment’ Interpretation 11 ‘AASB 2 – Group and Treasury Share Transactions’
5 Memorandum of understanding service costs The Department of Agriculture and Food has a memorandum of understanding with the Agriculture
Protection Board, the Agricultural Produce Commission and the Rural Business Development Corporation. The objective of these arrangements is to establish the types and standards of services to be provided, the basis for determining the level and the costs of services and responsibilities of the parties to the memorandum.
6 Services of the Department Information about the Department’s services is set out in the Schedule Of Expenses and Revenues
by Service.
Information about the Department’s administered expenses, revenues, assets and liabilities is set out in note 44.
The four key services of the Department:
Service 1 - Food and Fibre Industry Development Generation, integration and application of knowledge which together with appropriate industry policy
increases the international competitiveness and market opportunities for the State’s agriculture, food and fi bre industries.
Service 2 - Agricultural Resource Management Generation, integration and application of knowledge which together with appropriate investment, policy
and regulation develops the capacity of rural communities and industries to profi t from environmentally responsible agriculture.
Service 3 - Biosecurity Generation, integration and application of knowledge, policy and regulation to ensure the agriculture and
related resources are protected and that safety and quality standards are upheld.
Service 4 - Services provided to Rural Business Development Corporation of Western Australia Provision of contractual services to the Rural Business Development Corporation to assist farmers to
enhance their skills, leading to improved sustainable long- term profi tability and better capacity to deal with risks inherent in farming.

Department of Agriculture and Food, Western Australia Annual Report 2007 75
Financial Statements
7 Employee benefi ts expenseWages & salaries (I) 94,044 87,446 Superannuation - defi ned contribution plans (Westate) 5,179 4,620 Superannuation - defi ned benefi t plans (Gold State) 6,657 5,404 Change in long service leave provision 375 282 Change in annual leave provision 487 377
Memorandum of understanding service costs - Agriculture Protection Board 1,512 1,428 - Rural Business Development Corporation 574 469 Other related expenses 8,011 6,896
116,839 106,922
(I) Employment on-costs such as workers’ compensation insurance are included at note 10 ‘Other Expenses’. The employment on costs liability is included at note 28 ‘Provisions’.
8 Depreciation and amortisation expenseDepreciationBarrier fence 17 - Plant & equipment 2,629 2,551 IT equipment 1,831 1,395 Furniture & fi ttings 75 73 Vehicles & transportation equipment 726 791 Buildings 3,171 2,903 Total depreciation 8,449 7,713
9 Supplies and servicesConsultants and contractors 13,331 10,433 Communications 1,959 2,277 Other 7,568 8,391 Lease or rent payments 4,868 4,477 Resources received free of charge (see note 15) 353 840 Memorandum of understanding service costs - Agriculture Protection Board 4,633 4,763 - Agricultural Produce Commission 3,791 2,788 - Rural Business Development Corporation 6,049 16,092
42,552 50,061
2007($’000)
2006($’000)

Department of Agriculture and Food, Western Australia Annual Report 200776
Financial Statements
10 Other expenses Maintenance & repairs 6,806 6,000 Employment on-costs (a) 506 203 Supplies Expenses (b) 9,147 5,312 Electricity, gas & fuel, water 1,981 1,957 GROH housing subsidies 1,569 1,530 Recoups to external funds 334 107 Distribution of shared royalties 1,716 1,009 Stock movement 1,521 240 Change to Provision for Doubtful Debts (72) (40)Bad Debts expense 2 16 Other 1,860 2,224
25,370 18,558
(a) Includes workers’ compensation insurance and other employment on-costs. The on-costs liability associated with the recognition of annual and long service leave liability is included at note 28 ‘Provisions’. Superannuation contributions accrued as part of the provision for leave are employee benefi ts and are not included in employment on-costs.(b) Refer to note 35.13 for details
11 Grants and subsidiesRecurrent
Research grant allocations 101,964 102,481
Compensations 933 89
Grants to farmers - other 680 3,293
Scholarships 99 103
Other 3,537 2,936
107,213 108,902
12 Capital User Charge 12,426 12,439
The charge was a levy applied by Government for the use of its capital. In 2006-07, the fi nal year in which the charge was levied, a single payment was made equal to the appropriation for 2006-07 less any adjustment relating to 2005-06.
13 Revenue(a) User charges and fees
Sale of goods & services 11,678 11,287
Memorandum of understanding service costs - Agriculture Protection Board 6,278 6,340 - Agricultural Produce Commission 3,791 2,788 - Rural Business Development Corporation 6,844 16,733 Total User charges and fees 28,591 37,148
2007($’000)
2006($’000)

Department of Agriculture and Food, Western Australia Annual Report 2007 77
Financial Statements
(b) Commonwealth grants and contributions Commonwealth Agriculture Activity Grants 2,510 1,446 National Action Plan for Salinity 46,359 30,709 National Landcare Program 3,466 3,502 Tuberculosis Freedom Assurance Program 99 153 Natural Heritage Trust Fund 26,026 21,726 Environment Australia - 44 Total Commonwealth grants and contributions 78,460 57,580
(c) Grants and subsidies from non-Government sourcesAgriculture Research Grants Account No. 1Rural Industry Research FundsMeat Livestock Australia 328 881 Dairy Research & Development Corporation 434 466 Grains Research & Development Corporation 11,656 8,307 Grape and Wine Research Corporation 96 86 Land & Water Resources Research & Development Corporation 578 635 Rural Industry Research & Development Corporation 349 335 Sugar Research & Development Corporation 126 66 Australian Wool Innovation Pty Ltd 1,210 1,056 Australian Centre for International Agricultural Research 607 445 Australian Pork Limited 89 86 Land Conservation District Fund 131 38 Centre for Legumes in Mediterranean Agriculture 116 169 National Landcare Program Third Party Grants 315 796 CRC Research Grants 4,634 2,738 Commercial Grants 8,544 5,180 NRM 3rd Party Funding Grants 475 1,534 NRM State Funding Grants 10,069 12,068 Enterprise Grains Australia - 250
39,757 35,136
Agriculture Research Grants Account No. 2Horticulture Industry 835 974 NRM 3rd Party Funding Grants 7,124 3,247 Commercial Grants 345 791
8,304 5,012
Governmental Operating & Special Purpose AccountsPlant Research & Development 1 25
1 25
Other grants & subsidies 1,611 1,458
Total grants and subsidies from non-Government Sources 49,673 41,631
(d) Interest revenueInterest received 2,845 1,296
2007($’000)
2006($’000)

Department of Agriculture and Food, Western Australia Annual Report 200778
Financial Statements
2007($’000)
2006($’000)
14 Net gain / (loss) on disposal of non-current assetsCost on disposal of Non Current Assets Buildings 10 21 Furniture & fi ttings - 1 Plant & equipment 75 47
85 69
Proceeds on the disposal of non current assets Buildings - 6 Vehicles & transportation equipment 107 38 IT equipment 2 2 Plant & equipment 32 26
141 72 Net Profi t/(Loss) on disposal of non-current assets 55 3
15 Income from State GovernmentAppropriation revenue received during the yearService appropriations (I) 162,008 157,677
162,008 157,677
See also note 3(h) Non current assets (or disposal groups) classifi ed as held for sale and note 23 Non current assets classifi ed as held for sale.
Resources received free of charge (II)
Determined on the basis of the following estimates
provided by agencies:Forest Products Commission 3 - Department for Planning and Infrastructure - mapping, land details 203 696 Department of Treasury & Finance 142 139 Department of Conservation and Land Management 5 5
353 840
The following liabilities have been assumed by the Treasurer - Superannuation (III) 2,913 1,735 Total liabilities assumed by the Treasurer 2,913 1,735
Total income from State Government 165,274 160,252
(I) Service appropriations are accrual amounts refl ecting the full cost of services delivered. The appropriation revenue comprises a cash component and a receivable (asset). The receivable (holding account) comprises the depreciation expense for the year and any agreed increase in leave liability during the year.
(II) Where assets or services have been received free of charge or for nominal consideration, the Department recognises revenues (except where the contributions of assets or services are in the nature of contributions by owners in which case the Department shall make a direct adjustment to equity) equivalent to the fair value of the assets and/or the fair value of those services that can be reliably determined and which would have been purchased if not donated, and those fair values shall be recognised as assets or expenses, as applicable.

Department of Agriculture and Food, Western Australia Annual Report 2007 79
Financial Statements
(III)The assumption of the superannuation liability by the Treasurer is a notional income to match the notional superannuation expense reported in respect of current employees who are members of the Pension Scheme and current employees who have a transfer benefi t entitlement under the Gold State Superannuation Scheme. (The notional superannuation expense is disclosed at note 7 ‘Employee Benefi ts Expense’).
16 Cash and cash equivalentsPetty Cash/Travel Advance 44 44
Cash at bank 7,292 13,397 Prior period error - (708)
7,292 12,689
7,336 12,733
17 Restricted cash and cash equivalentsCurrentRestricted cash (a)
Cattle Industry Compensation Fund 5,907 5,951 Departmental Receipts in Suspense 55 55 Land Conservation Districts Fund 42 122
6,004 6,128
Special purpose accounts (b)
Agriculture Research Grants Account No. 1 12,687 8,681 Agriculture Research Grants Account No. 2 5,121 4,810 Commonwealth Agriculture Activity Grants (Non-interest bearing) 2,707 3,213 Commonwealth Agriculture Activity Grants (Interest bearing) 47,438 31,522 Plant Research & Development 1,420 4,104
69,373 52,330
Total current 75,379 58,458
(a) Funds held in the following accounts are for the following purposes.Cattle Industry Compensation fund: To make compensation payments in accordance with the Cattle Industry Compensation Act.
Department Receipts in Suspense: To hold and distribute funds pending identifi cation for allocation.
Land Conservation Districts Fund: To promote soil conservation through research and implementation of soil and conservation measures and practices.
(b) Receipts and disbursement are disclosed in note 43 in accordance with section 16(1) (c) of the FMA
Non-currentAccrued salaries suspense account 605 199
Accrued salaries suspense account consists of amounts paid annually to a suspense account over a period of 10 fi nancial years to largely meet the additional cash outfl ow in each eleventh year when 27 pay days occur in that year instead of the normal 26. No interest is received on this account.
2007($’000)
2006($’000)

Department of Agriculture and Food, Western Australia Annual Report 200780
Financial Statements
2007($’000)
2006($’000)
Accrued salaries suspense account is represented by a cash balance and is therefore equivalent to the net fair value.
Total restricted cash and cash equivalents 75,984 58,657
18 Biological assets
CurrentLivestock 1,140 1,812 Field crops 737 462
1,877 2,274
19 InventoriesCurrent Raw materials and stores 1,776 2,017
1,776 2,017
20 ReceivablesCurrent Trade Receivables 10,193 9,116 Less: Allowance for doubtful debts (28) (100) Interest receivable 860 357 GST receivable 2,967 1,124 Other receivables 89 82 Total Receivables 14,081 10,579
See also note 3(n) “Receivables” and note 3(l) “Financial Instruments”.
21 Amounts receivable for servicesCurrent 7,300 6,115 Non-current 29,409 24,967 Total amounts receivable for services 36,709 31,082
This asset represents the non-cash component of service appropriations (see note 3 (q) “Amounts receivable for services (Holding Account)”). It is restricted in that it can only be used for asset replacement or payment of leave liability.
The reconciliation at the beginning and end of the current and previous year is set out below:
Opening balance of Holding Account 31,082 25,207 Non cash appropriation 6,972 7,346 Departmental drawdown (1,345) (1,471)Closing balance of Holding Account 36,709 31,082

Department of Agriculture and Food, Western Australia Annual Report 2007 81
Financial Statements
2007($’000)
2006($’000)
22 Other assetsCurrentPrepayments Registrations 1,085 279 Goods & Services 323 125 Lease Rental 99 1,219 Total Other current assets 1,507 1,623
Non-currentInvestmentsInvestment valued as at 30 June 2007
Listed shares 512 423 Unlisted shares 301 184
813 607
Listed shares have been revalued to refl ect their current market price as at 30 June 2007. Unlisted shares and unit certifi cates are stated at their par value. The Department has no investment powers. The shares held were received at no cost under a trading agreement.
Capital works in progressStock yards - 19 Broome Offi ce - 50 Eucla-Reverse Osmosis Plant 295 - Chemical Sheds 6 234 Newdegate 84 - Kununurra Offi ce 2,260 126 Vasse Redevelopment 1,252 147 Parkeston Quarantine Yards 793 191 Plant & Machinery under construction 428 72 Other 40 57
5,158 896
Total Other non-current assets 5,971 1,503
23 Non-current assets classifi ed as held for saleOpening BalanceLand - 851 Buildings - 165
- 1,016 Add: assets reclassifi ed as held for saleBuilding - 4
Less: assets soldBuilding - (3)
Less: assets withdrawn from being held for saleLand - (851) Buildings - (166)
Closing balanceLand - - Building - -
- -

Department of Agriculture and Food, Western Australia Annual Report 200782
Financial Statements
2007($’000)
2006($’000)
24 Property, plant and equipmentBarrier Fence At fair value (a) 6,200 - Total land 6,200 -
Land At fair value (a) 79,189 58,007 Total land 79,189 58,007
Buildings At fair value (a) 75,522 76,026
75,522 76,026
Plant & equipment At cost 31,207 29,937 Accumulated depreciation (21,521) (19,549)Total plant & equipment 9,686 10,388
Vehicles & transportation equipment At cost 11,082 10,293 Accumulated depreciation (7,806) (7,273)Total vehicles & transportation equipment 3,276 3,020
IT equipment At cost 14,502 13,717 Accumulated depreciation (9,914) (9,222)Total IT equipment 4,588 4,495
Furniture & fi ttings At cost 751 736 Accumulated depreciation (627) (558)Total furniture & fi ttings 124 178
Total assets At cost 57,542 54,683 Accumulated depreciation (39,868) (36,602)Total at cost 17,674 18,081 At Fair Value 160,911 134,033 Total at Fair Value 160,911 134,033
Total non-current assets 178,585 152,114
At cost and fair value 218,453 188,716 Accumulated depreciation (39,868) (36,602)Total non-current assets 178,585 152,114
(a) Freehold land, barrier fence and buildings were revalued as at 1 July 2006 by the Western Australian Land Information Authority (Valuation Services). The valuations were performed during the year ended 30 June 2007 and recognised at 30 June 2007.
To ensure the valuations provided by Valuation Services were compliant at 30 June 2007 with the fair value requirements under AASB 116, Valuation Services provided the Department of Treasury and Finance (DTF) with information that tracked the general movement in the market value of land and in building construction costs from the 1 July 2006 (the date of valuation) to 31 March 2007. DTF reviewed the information and determined that the valuations provided by Valuation Services (as at 1 July 2006) were compliant with fair value requirements for 30 June 2007 reporting without further adjustment.

Department of Agriculture and Food, Western Australia Annual Report 2007 83
Financial Statements
2007
Barrier Fence$’000
Land$’000
Buildings$’000
Plant and Equipment
$’000
Vehicles &transportation equipment
$’000
I.T. equipment
$’000
Furniture & fi ttings
$’000Total$’000
Carrying amount 1 July 2006 - 58,007 76,026 10,388 3,020 4,495 178 152,114
Additions (a) 139 - 415 2,000 950 1,927 21 5,452
Asset Transfer from APB Financial 4,183 - 3,317 21 40 5 - 7,566
Asset Transfer from APB – Expensed - - - (10) - (2) - (12)
Disposals (b) - - (22) (75) (8) - - (105)
Land Disposal net equity adjustment - (332) - - - - - (332)
Acquisition Land net equity adjustment - 100 - - - - - 100
Revaluation: increment/(decrement) 1,896 21,413 (1,040) - - - - 22,269
Depreciation (17) - (3,173) (2,628) (726) (1,830) (75) (8,449)
Write-off of assets - - - (9) - (8) (1) (18)
Carrying amount 30 June 2007 6,201 79,188 75,523 9,687 3,276 4,587 123 178,585
2006Land$’000
Buildings$’000
Plant and Equipment
$’000
Vehicles &transportation equipment
$’000
I.T. equipment
$’000
Furniture & fi ttings
$’000Total$’000
Carrying amount 1 July 2005 50,653 72,476 10,857 3,499 2,999 227 140,711
Additions (a) 2 620 2,159 312 2,907 24 6,024
Disposals (b) - (6) (46) - - - (52)
Withdrawn classifi ed as held for sale 851 166 - - - - 1,017
Revaluation: increment/(decrement) 6,501 5,673 - - - - 12,174
Depreciation - (2,902) (2,551) (791) (1,395) (73) (7,712)
Write-off of assets - (1) (31) - (16) - (48)
Carrying amount 30 June 2006 58,007 76,026 10,388 3,020 4,495 178 152,114
Reconciliations Reconciliations of the carrying amounts of property, plant, equipment and vehicles at the beginning and
end of the current and previous fi nancial year are set out below.

Department of Agriculture and Food, Western Australia Annual Report 200784
Financial Statements
(a) Additions include adjustments and restated assets (b) Disposal includes adjustments and retired assets
The Department for Planning and Infrastructure (DPI) is the only agency with the power to sell Crown land. The land is transferred to DPI for sale and the Department accounts for the transfer as a distribution to owner (DTO).
25 Impairment of assetsThere were no indications of impairment to property, plant and equipment, infrastructure and intangible assets at 30 June 2007.
The Department held no goodwill or intangible assets with an indefi nite useful life during the reporting period and at balance sheet date there were no intangible assets not yet available for use.
All surplus assets at 30 June 2007 have either been classifi ed as assets held for sale or written off.
26 PayablesCurrent Trade Payables 7,927 8,326 Other payables 1,117 6,223 Total current 9,044 14,549
See also note 3 (p) “Payables” and note 41 “Financial instruments”
27 Other current liabilitiesCurrentAccrued salariesThe accrued salaries provision is represented by:(a) The amount due to staff but unpaid at the end of the fi nancial year as the end of the last pay period for that fi nancial year does not coincide with the end of the fi nancial year.
Amounts owing for the 1 working day to 30 June 2007 (2006 - 30 June, 1 working day) 395 332
(b) An accrual to recognise the current year impact on the wage increase to be effective 2005-2006 under the Public Service General Award for their pay periods 23 March 2006 to 29 June 2006. - 1,300 Total accrued salaries 395 1,632
The carrying amount of accrued salaries approximates the net fair value.
2007($’000)
2006($’000)

Department of Agriculture and Food, Western Australia Annual Report 2007 85
Financial Statements
28 ProvisionsCurrent Employee Benefi t ProvisionsAnnual leave 9,853 7,528Long service leave 11,762 12,147
21,615 19,675
Other provisionsEmployment on-costs 4,287 3,813
25,902 23,488Non-current Employee Benefi t ProvisionsLong service leave 5,397 6,117Deferred salary scheme 225 290
5,622 6,407Other provisionsEmployment on-costs 520 598
6,142 7,005
Total Employee Benefi t Provisions 32,044 30,493
Annual leave liabilities have been classifi ed as current as there is no unconditional right to defer settlement for at least 12 months after balance sheet date. Assessments indicate that actual settlement of the liabilities will occur as follows:
Within 12 months of balance sheet date 5,157 4,126 More than 12 months after balance sheet date 4,696 3,402
9,853 7,528
Long service leave liabilities have been classifi ed as current as there is no unconditional right to defer settlement for at least 12 months after balance sheet date. Assessments indicate that actual settlement of the liabilities will occur as follows:
Within 12 months of balance sheet date 8,468 8,354More than 12 months after balance sheet date 8,691 9,910
17,159 18,264
The settlement of annual and long service leave liabilities gives rise to the payment of employment on-costs including workers’ compensation insurance. The provision is the present value of expected future payments.
29 EquityEquity represents the residual interest in the net assets of the Department. The Government holds the equity interest in the Department on behalf of the community. The asset revaluation reserve represents that portion of equity resulting from the revaluation of non-current assets.
Contributed equity
Balance at the start of the year 4,382 851
Contribution by ownersCapital contributions (a) 4,050 3,531 Transfer of assets from the Agriculture Protection Board (a) 8,204 -
12,254 3,531
2007($’000)
2006($’000)

Department of Agriculture and Food, Western Australia Annual Report 200786
Financial Statements
2007($’000)
2006($’000)
Distribution to ownersTransfer of assets to the department of Planning and Infrastructure (b) (332) - Balance at the end of the year 16,304 4,382
(a) Capital Contributions (appropriations) and non-discretionary (non-reciprocal) transfers of net assets from other State government agencies have been designated as contributions by owners in Treasurer’s Instruction TI 955 ‘Contributions by Owners Made to Wholly Owned Public Sector Entities’ and are credited directly to equity. During 2006/07 the Agriculture Protection Board transferred a majority of its assets to the Department in order to meet the requirements under the Biosecurity and Agriculture Management Bill. Refer to the reconciliation schedule in note 24 for the category of assets transferred.
(b) UIG Interpretation 1038 ‘Contributions by Owners Made to Wholly-Owned Public Sector Entities’ : where the transferee accounts for a transfer as a contribution by owner, the transferor must account for the transfer as a distribution to owners. Consequently, non-discretionary (non-reciprocal) transfers of net assets to other State government agencies are “Distribution to owners” and are debited directly to equity.
Reserves
Asset revaluation reserveThe asset revaluation reserve represents the portion of equity resulting from the revaluation of non-current assets.
Balance at the start of the year Investments 301 361 Non-current assets 145,936 133,771
146,237 134,132 Net revaluation increments/(decrements) Investments 206 (60) Non-current assets Land 21,413 6,501 Buildings (1,040) 5,663 Barrier fence 1,896 -
22,269 12,164 Total net revaluation increments/(decrements) 22,475 12,164
Balance at the end of the year Investments 507 301 Non-current assets 168,204 145,936
168,711 146,237
The asset revaluation reserve is used to record increments and decrements on the revaluation of non-current assets, as described in accounting policy note.
Accumulated surplus/(defi cit) (Retained Earnings)
Balance at the start of the year 76,307 69,500 Result for the period 22,072 6,807 Prior period error (a) - (708)Balance at end of the year 97,671 75,599
Total Equity balance at the end of the year 282,686 226,218

Department of Agriculture and Food, Western Australia Annual Report 2007 87
Financial Statements
(a) The Department had an unreconciled bank variance that was carried forward since 1997. The variance was a result of a salary related expense item that was not posted to the profi t and loss statement for that reporting period. This error had the effect of overstating the reported cash and cash equivalent and retained earnings for the preceding fi nancial years. The variance has been corrected by restating each of the fi nancial statement line items in the comparative year as described above.
30 Notes to the Cash Flow Statement
(a) Reconciliation of cash
For the purposes of the Cash Flow Statement, cash includes cash at bank, cash on hand, restricted cash and amounts in suspense. Cash at the end of the fi nancial year as shown in the Statement of Cash Flows is reconciled to the related items in the Balance Sheet as follows.Cash and cash equivalents (refer to note 16) 7,336 12,733 Restricted cash and cash equivalents: current (refer to note 17) 75,379 58,458 Restricted cash and cash equivalents: non-current (refer to note 17) 605 199
83,320 71,390
(b) Reconciliation of net cost of services to net cash fl owsprovided by/(used in) operating activitiesNet cost of services (143,203) (153,445)
Non-cash items:Net (loss)/profi t from sale of assets (55) (3)Depreciation and amortisation 8,449 7,713 Superannuation liabilities assumed by the Treasurer 2,913 1,735 Resources received free of charge 353 840 Provision for impairment of receivables (72) (40)
11,588 10,245
(Increase)/decrease in assetsInventories 241 (581)Biological Assets - Livestock 672 141 Biological Assets - Field Crops (275) 426 Agricultural Produce (33) (174)Receivables (a) (2,942) 17,271
Prepayments 116 29 Investments 206 (60)
Increase/(decrease) in liabilitiesAccrued salaries (1,237) 1,632 Provisions 1,551 921 Payables (a) (6,340) 7,932 Net GST receipts/(payments) (b) 27 (795)Change in GST in receivables/payables (c) 1,843 675 Net cash used in operating activities (137,786) (115,781)
(a) Note that the ATO receivable/payable in respect of GST and receivable/payable in respect of the sale/purchase of non-current assets are not included in these items as they are not reconciling items.(b) This is the net GST paid/received, i.e. cash transactions.(c)This reverses out the GST in receivables and payables.
2007($’000)
2006($’000)

Department of Agriculture and Food, Western Australia Annual Report 200788
Financial Statements
2007($’000)
2006($’000)
31 Resources provided free of charge
During the year the following resources were provided to other agencies free of charge for functions outside the normal operations of the Department of Agriculture and Food.
Agriculture Protection Board 20,597 11,047 Agricultural Produce Commission 7 7 Perth Zoological Gardens 27 19 Department of Conservation & Land Management 19 2 Other 17 15
20,667 11,090
32 Commitments
(a) Capital expenditure commitmentsCapital expenditure commitments, being contracted capital expenditure additional to the amounts reported in the fi nancial statements, are payable as follows:Within one year 1,303 723 Later than one year and not later than fi ve years 618 -
1,921 723
(b) Total lease commitmentsCommitments in relation to leases contracted for at the reporting date but not recognised as liabilities are payable:
Within one year 3,156 2,940 Later than one year and not later than 5 years 2,910 2,878 Later than 5 years 363 408
6,429 6,226
Representing:Non-cancellable operating lease commitments 6,429 6,226
The property leases are non-cancellable leases with fi ve year terms, with rents payable monthly in advance. Contingent rental provisions within the lease agreements require that the minimum lease payments shall be increased by the lower of CPI or 4% per annum. An option exists to renew the leases at the end of their fi ve year terms for an additional term of fi ve years.
(c) Guarantees and undertakings
There are no guarantees and undertakings at balance sheet date, not otherwise provided for in these fi nancial statements.

Department of Agriculture and Food, Western Australia Annual Report 2007 89
Financial Statements
33 Contingent liabilities and Contingent assetsIn addition to the liabilities included in the fi nancial statements, there are the following contingent liabilities:
Employment Contract claimA claim against the Department for entitlements arising from employment conditions has been lodged in Western Australian Industrial Relations Commission (WAIRC) by two employees representing a larger group. Subject to the ruling from the WAIRC which is expected to be published in the fi rst quarter of 2007/08, a contingent liability in the range $0.45 million to $0.60 million is acknowledged by the Department.
Contaminated sites Under the Contaminated Sites Act 2003, the Department is required to report known and suspected contaminated sites to the Department of Environment and Conservation. In accordance with the Act, Department of Environment and Conservation classifi es these sites on the basis of the risk to human health, the environment and environmental values. Where sites are classifi ed as contaminated – remediation required or possibly contaminated – investigation required, the Department may have a liability in respect of investigation or remediation expenses.
During the year the Department reported 35 suspected contaminated sites to Department of Environment and Conservation. These have yet to be classifi ed. The Department is unable to assess the likely outcome of the classifi cation process, and accordingly, it is not practicable to estimate the potential fi nancial effect or to identify the uncertainties relating to the amount or timing of any outfl ows. Whilst there is no possibility of reimbursement of any future expenses that may be incurred in the remediation of these sites, the Department may apply for funding from the Contaminated Sites Management Account to undertake further investigative work or to meet remediation costs that may be required.
34 Events occurring after reporting dateThere were no events that occurred after balance date which would materially affect the fi nancial statements or disclosures.
2006/07 Estimate
$’000
2006/07 Actual $’000
Variation $’000
35 Explanatory StatementsThe Summary of Consolidated Fund Appropriations and Revenue Estimates discloses appropriations and other statutes expenditure estimates, the actual expenditures made and revenue estimates and payments into the Consolidated Fund. Appropriations are now on an accrual basis.
The following explanations are provided in accordance with Treasurer’s Instruction 945.
Note Signifi cant Reason For Variance between 2006/07 Estimate and 2006/07 Actual
35.1 Net amount appropriated to deliver services (161,812) (162,008) 196
The amount appropriated was adjusted for the following reasons:
- Salaries and Allowances tribunal increases; and- State contribution to National Invasive Species
agreements (European House Borer and Red Imported Fire Ants).

Department of Agriculture and Food, Western Australia Annual Report 200790
Financial Statements
35 Explanatory Statements(continued)
2006/07 Estimate
$’000
2006/07 Actual $’000
Variation $’000
35.2 Food and Fibre Industry Development 88,353 87,787 (566)
Minor variations relating to project delays across a range of programs, generally as a result of poor seasonal conditions.
35.3 Agricultural Resource Management 146,929 136,769 (10,160)
The variation mainly relates to delays in payment of National Action Plan grants as directed by the Commonwealth, now deferred into 2007/08.
35.4 Biosecurity (Inclusive of Services Provided to Agriculture Protection Board) 60,071 81,449 21,378
The variation mainly relates to:- Additional funding to address European House Borer and
Starling control;- Additional funding to address Australian Plague Locust
outbreaks; and- increased funding from industry sources for Biosecurity
and research activities.
35.5 Services Provided to Rural Business Development Corporation 3,123 6,844 3,721
The variation relates to increased Exceptional Circumstances grant expenditure and payments related to the Dry Seasons Assistance Scheme.
35.6 Total revenues from ordinary activities (133,612) (169,463) (35,851)
Revenue retained by the Department exceeded budget estimates primarily due to a substantial increase to:
- National Action Plan for Salinity grants from the Commonwealth.
- NRM 3rd party grants and increased funding from industry sources for Biosecurity activities.
35.7 Capital Expenditure 11,315 9,714 (1,601)
The variation mainly relates to a delay in the Kimberley Regional Offi ce project and the revisitation of timetables for the New Headquarters and Biosecurity relocation project impacting on project planning expenditure.
35.8 Administered Transactions - 4,292 4,292
Payment of one loan was made in 2006/07 from the Western Australian Cooperatives Loan Scheme.
35.9 Administered Revenues 833 243 (590)
Interest revenues were higher than budgeted due to an additional loan being paid in 2006/07 from the Western Australian Cooperatives Loan Scheme.
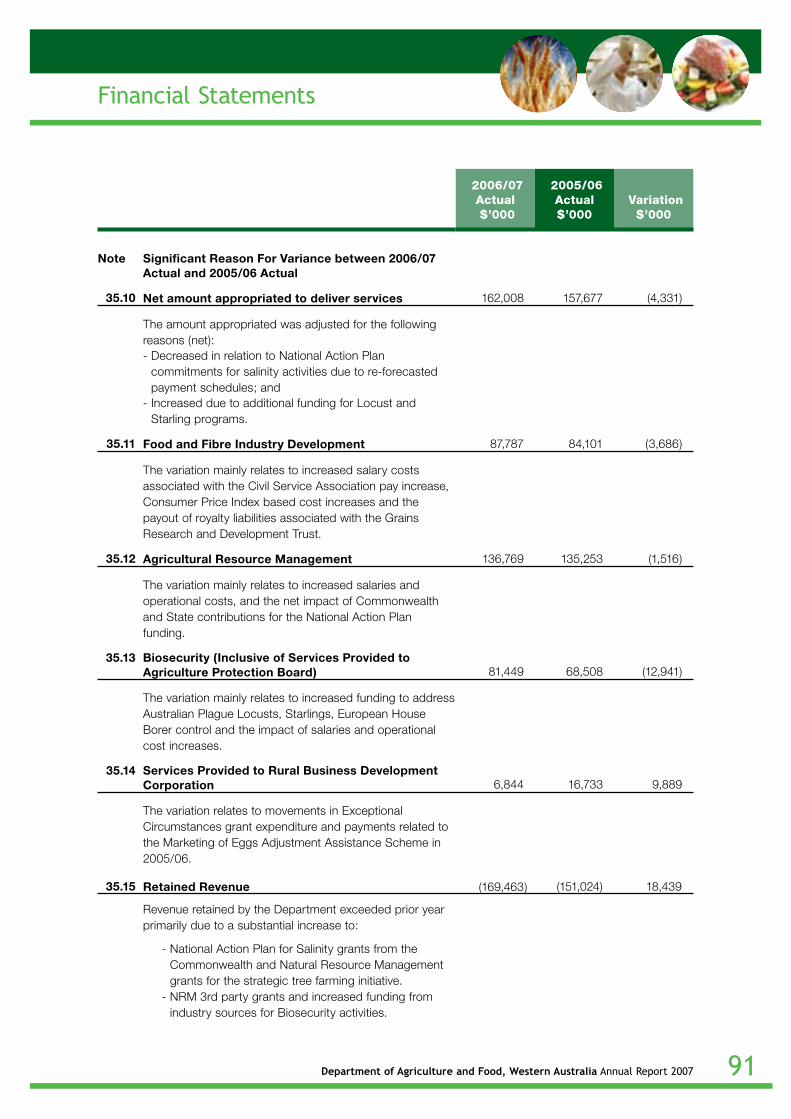
Department of Agriculture and Food, Western Australia Annual Report 2007 91
Financial Statements
Note Signifi cant Reason For Variance between 2006/07 Actual and 2005/06 Actual
35.10 Net amount appropriated to deliver services 162,008 157,677 (4,331)
The amount appropriated was adjusted for the following reasons (net):- Decreased in relation to National Action Plan
commitments for salinity activities due to re-forecasted payment schedules; and
- Increased due to additional funding for Locust and Starling programs.
35.11 Food and Fibre Industry Development 87,787 84,101 (3,686)
The variation mainly relates to increased salary costs associated with the Civil Service Association pay increase, Consumer Price Index based cost increases and the payout of royalty liabilities associated with the Grains Research and Development Trust.
35.12 Agricultural Resource Management 136,769 135,253 (1,516)
The variation mainly relates to increased salaries and operational costs, and the net impact of Commonwealth and State contributions for the National Action Plan funding.
35.13 Biosecurity (Inclusive of Services Provided to Agriculture Protection Board) 81,449 68,508 (12,941)
The variation mainly relates to increased funding to address Australian Plague Locusts, Starlings, European House Borer control and the impact of salaries and operational cost increases.
35.14 Services Provided to Rural Business Development Corporation 6,844 16,733 9,889
The variation relates to movements in Exceptional Circumstances grant expenditure and payments related to the Marketing of Eggs Adjustment Assistance Scheme in 2005/06.
35.15 Retained Revenue (169,463) (151,024) 18,439
Revenue retained by the Department exceeded prior year primarily due to a substantial increase to:
- National Action Plan for Salinity grants from the Commonwealth and Natural Resource Management grants for the strategic tree farming initiative.
- NRM 3rd party grants and increased funding from industry sources for Biosecurity activities.
2006/07 Actual $’000
2005/06 Actual $’000
Variation $’000

Department of Agriculture and Food, Western Australia Annual Report 200792
Financial Statements
2006/07 Actual $’000
2005/06 Actual $’000
Variation $’000
35.16 Administered Transactions 4,292 1,226 (3,066)
Variation relates to the difference in the two payments under the WA Cooperatives Loan Scheme in 2005/06 and 2006/07.
36 Remuneration of Senior Offi cersThe number of senior offi cers whose total of fees, salaries, superannuation, non monetary benefi ts and other benefi ts received or due and receivable for the fi nancial year, fall within the following bands is:
No. of offi cers$ 2007 2006
20,001 40,000 - 2
90,001 100,000 - 1
130,001 140,000 2 3
140,001 150,000 2 1
160,001 170,000 1 -
210,001 220,000 - 1
290,001 300,000 1 -
2007($’000)
2006($’000)
The total remuneration of senior offi cers is: 1,014 943
The superannuation included here represents the superannuation expense incurred by the Department in respect of senior offi cers.
Senior offi cers are presently members of the Gold State and West State Schemes.
There are no senior offi cers who are presently members of the Government Pension Scheme.
37 Remuneration of AuditorRemuneration to the Auditor General for the fi nancial year is as follows: 210 186
Auditing the accounts, fi nancial statements and performance indicatorsThis expense is included in note 10 “Other expenses”
38 Related bodiesThere are no related bodies with the Department of Agriculture and Food Western Australia.

Department of Agriculture and Food, Western Australia Annual Report 2007 93
Financial Statements
2007($’000)
2006($’000)
39 Affi liated bodiesThere are no affi liated bodies with the Department of Agriculture and Food Western Australia.
40 Jointly controlled operations(i) Major Cooperative Research Agreements – Audited 2006
Interest(%)
Termination Date
Joint Venture name and principal activities
Cooperative Research Centre for Australian Weed Management 13.00 30/06/08Cooperative Research Centre for Value Added Wheat 9.11 30/06/08Cooperative Research Centre for Tropical Savannas 6.67 30/06/08Cooperative Research Centre for Emerging Infectious Diseases 6.63 30/10/10Cooperative Research Centre for Australian Sheep Industry 18.00 30/07/07Cooperative Research Centre for Spatial Information 5.63 14/06/11Cooperative Research Centre for Plant Based Mgt of Dryland Salinity 14.90 30/06/08Cooperative Research Centre for Desert Knowledge 1.05 30/06/10Cooperative Research Centre for Cotton Catchment Communities 2.43 30/06/12
(ii) Other Joint VenturesThe Department has collaborative arrangements with other parties to perform research and share in the outputs (ie intellectual property) in proportion to each participant’s research input, initial intellectual property or cash contributions. These collaborative arrangements also share the characteristics of joint venture operations. The principal activities of these joint venture operations are scientifi c research and development, extension and technology transfer with the ultimate aim of sharing in the output (ie intellectual property). The numbers of this type of arrangement make it impractical to list separately. The Department’s contributions to these joint ventures are included in the Department’s operating statements.
(iii) AlliancesThe Department of Agriculture and Food Western Australia has joined with Curtin University of Technology, Murdoch University and the University of Western Australia to form a research alliance, known as Agricultural Research Western Australia (ARWA). The alliance fosters collaborative high priority research, facilitates the sharing of knowledge and resources, and the creation of the science capacity required to deliver enhanced benefi ts to the Western Australian agricultural sector. The cost of managing ARWA activities is funded by way of subscription from the above mentioned agencies.
41 Financial instruments(a) Financial Risk Management Objectives and PoliciesFinancial instruments held by the Department are cash and cash equivalents, fi nance leases, Treasurer’s advances and receivables and payables. The Department has limited exposure to fi nancial risks. The Department’s overall fi nancial risk management program focuses on managing the risks identifi ed below.
Credit riskThe Department trades only with recognised, creditworthy third parties. The Department has policies in place to ensure that sales of products and services are made to customers with an appropriate credit history. In addition, receivable balances are monitored on an ongoing basis with the result that the Department’s exposure to bad debts is minimal. There are no signifi cant concentrations of credit risk.

Department of Agriculture and Food, Western Australia Annual Report 200794
Financial Statements
Liquidity riskThe Department has appropriate procedures to manage cash fl ows including drawdowns of appropriations by monitoring forecast cash fl ows to ensure that suffi cient funds are available to meet its commitments.
Interest rate riskThe Department is not exposed to interest rate risk where cash and cash equivalents and restricted cash are non-interest bearing and has no borrowings other than the Treasurer’s advance (non-interest bearing) and fi nance leases (fi xed interest rate). Restricted cash that are interest bearing are managed by the Department of Treasury and Finance and the exposure to interest rate risk is limited through their diversifi ed funding portfolio.
(b) Financial instrument disclosuresInterest rate risk exposure:The following table summarises the Department’s fi nancial instruments which have an exposure to interest rate movements.
Fixed interest rate maturities
2007
Weighted average effective interest
rate %
Variable interest
rate $’000
1 year or less
$’000
1 to 5 years or
less $’000
Over 5 years $’000
Non interest bearing $’000
Total $’000
Financial AssetsCash and cash equivalents - - - - 7,336 7,336Restricted cash and cash equivalents 5.98% 59,930 - - - 16,054 75,984Investments - - - - 813 813Receivables - - - - 50,790 50,790
Total fi nancial assets 59,930 - - - 74,993 134,923
Financial LiabilitiesPayables - - - - 9,044 9,044
Total fi nancial liabilities - - - - 9,044 9,044
2006
Financial AssetsCash and cash equivalents - - - - 12,733 12,733Restricted cash and cash equivalents 5.55% 46,509 - - - 12,148 58,657Investments - - - - 607 607Receivables - - - - 41,661 41,661
Total fi nancial assets 46,509 - - - 67,149 113,658
Financial LiabilitiesPayables - - - - 14,549 14,549
Total fi nancial liabilities - - - - 14,549 14,549
41 Financial instruments (continued)

Department of Agriculture and Food, Western Australia Annual Report 2007 95
Financial Statements
(c) Fair Values
All fi nancial assets and liabilities recognised in the balance sheet, whether they are carried at cost or fair value, are recognised at amounts that represent a reasonable approximation of fair value unless otherwise stated in the applicable notes.
2007($’000)
2006($’000)
42 Supplementary InformationWrite-offs: Non Current AssetsDuring the fi nancial year $17,914 (2006: $46,491) was written off the Department’s asset register under the authority of:
- The Accountable Authority 18 42 - The Minister - 6
18 48 Write-offs: Irrecoverable amountsDuring the fi nancial year $1,722 (2006: $15,975) was written off in bad debts under the authority of:
- The Accountable Offi cer 2 16
Losses Through Theft, Defaults and Other CausesLosses of public moneys and, public and other property through theft or default
Amounts recovered-insurance 265 80
43 Special Purpose Accounts - Section 16 (1) (c) Financial Management Act 2006
Agriculture Research Grants Account No. 1 (Non-Interest bearing)The purpose of the fund is to receive and disperse funds from industry and other organisations in support of Agricultural research projects.
Balance at the start of the year 8,681 6,709 Receipts 49,483 40,222 Payments (45,477) (38,250) Balance at the end of the year 12,687 8,681
Agriculture Research Grants Account No. 2 (Interest bearing)The purpose of the fund is to receive and disperse funds from industry and other organisations in support of Agricultural research projects.
Balance at the start of the year 4,810 2,957 Receipts 9,445 5,452 Payments (9,134) (3,599) Balance at the end of the year 5,121 4,810

Department of Agriculture and Food, Western Australia Annual Report 200796
Financial Statements
2007($’000)
2006($’000)
Commonwealth Agriculture Activity Grants (Non-interest bearing)The purpose of the fund is to receive and disperse to conduct Commonwealth funded activities.Balance at the start of the year 3,213 1,965 Receipts 2,055 2,395 Payments (2,561) (1,147) Balance at the end of the year 2,707 3,213
Commonwealth Agriculture Activity Grants (Interest bearing)The purpose of the fund is to receive and disperse to conduct Commonwealth funded activities.
Balance at the start of the year 31,522 12,886 Receipts 77,600 77,815 Payments (61,684) (59,179) Balance at the end of the year 47,438 31,522
Plant Research & DevelopmentThe purpose of the fund is to receive and disperse funds to conduct plant research and development in Western Australia.
Balance at the start of the year 4,104 2,575 Receipts 3,923 3,773 Payments (6,607) (2,244) Balance at the end of the year 1,420 4,104
44 Administered Transactions(i) ADMINISTERED EXPENSES AND INCOME
EXPENSESInterest Payments 204 28 Total administered expenses 204 28
INCOMEUser charges and fees 5 5 Interest revenue 238 33 Total Administered income 243 38
(ii) ADMINISTERED ASSETS AND LIABILITIES
CURRENT ASSETSCash Assets 49 10Loan 3,991 1,226Total Administered Current Assets 4,040 1,236
Total Administered Assets 4,040 1,236
NON-CURRENT LIABILITIESBorrowings 3,991 1,226Total Administered Non Current Liabilities 3,991 1,226
Total Administered Liabilities 3,991 1,226
43 Special Purpose Accounts - Section 16 (1) (c) Financial Management Act 2006 (continued)

Department of Agriculture and Food, Western Australia Annual Report 2007 97
Ministerial Directives
2007($’000)
2006($’000)
(iii) CASH FLOWS FROM ADMINISTERED TRANSACTIONS
CASH INFLOWS FROM ADMINISTERED TRANSACTIONSCapital contributions (1) 4,292 1,226Revenues from services 243 38 Total administered cash infl ows 4,535 1,264
CASH OUTFLOWS FROM ADMINISTERED TRANSACTIONS
Loans advanced 2,765 1,226Loans repaid to WA Treasury Corporation 1,527Other payments 204 28 Total administered cash outfl ows 4,496 1,254
Net cash infl ows/(outfl ows) from administered transactions 39 10
(1) Administered items are represented by:
Appropriations received to facilitate the Western Australian Cooperatives Loan Scheme.
Administered transactions are not considered to form part of the Department’s operational services.
Ministerial DirectivesNo Ministerial directives were received during the fi nancial year.
Other Financial Disclosures
Capital Works
Capital projects in progress
• New Kimberley Regional Offi ce Redevelopment (Frank Wise Institute) scheduled to be completed in August 2007. Total project cost contained to budget allocation of $3.350m, with balance of $1.079m to be expended in 2007/08;
• New Vasse Dairy research facility completed, additional land purchase to be fi nalised in 2007/08. Total project cost contained to budget allocation of $1.015m, with balance of $71k to be expended in 2007/08;
• South Boulder quarantine inspection yards under construction scheduled for completion February 2008. Total project cost contained to budget allocation of $1.650m (includes 2007/08 budget increase), with balance of $643k to be expended in 2007/08;
• Key project consultants being appointed for the Headquarters/ Biosecurity and Agricultural Research Western Australia projects. The agency has completed the detailed project scoping and has set up a Steering Committee with representatives from both Treasury and the Department of Housing and Works. To date $582k has been expended and $4.558m is planned to be expended in 2007/08 in line with approved budget cash fl ows; and

Department of Agriculture and Food, Western Australia Annual Report 200798
Other Financial Disclosures
• The annual Capital Equipment Replacement Program completed, with equipment purchased to meet R&D, core and support business needs. Total project cost contained to budget allocation of $3.497m with balance of $677k to be expended in 2007/08.
Capital projects completed
• Jerramungup District Offi ce refurbishment completed and transferred to the Shire of Jerramungup, completed within the approved budget under the Regional Accommodation Phase 2 program; and
• New Karratha offi ce fi tout completed and in operation through a long term lease, completed within the approved budget under the Regional Accommodation Phase 2 program.
Employment and Industrial Relations
The Department’s budgeted Average Staffi ng Level for 2006/07 was 1,449 Full-Time Equivalent (FTE) employees. The average usage for the fi nancial year being 1,585 FTE. During this period FTEs reached a high of 1,638 in February 2007 and a low of 1,534 for August 2006.
The distribution of staff (headcount) across the work classifi cations within the Department between 2005/06 and 2006/07 is shown below:
Category 2005/06 2006/07
Professional 693 703
Technical 454 431
Inspectorial 132 137
Administrative and Clerical 354 336
Wages 54 53
TOTAL STAFF 1,687 1,660
Occupational Safety and Health (OSH)
The Department continued to retain its Worksafe Plan Silver Certifi cate status by maintaining injury rates less than the rate for the government administration sector.
During the year the following OSH initiatives were implemented:
• commenced Health and Wellness program;
• completion of OSH risk assessment process in development of technical work instructions;
• participated in Safe Work Australia Week (October 2006) for the fi rst time;
• medical Oxygen sets were purchased and are being distributed to regional offi ces and research stations;
• continued delivery of a driver development programme and a revised four wheel drive training programme; and
• the Department has continued its representation on the restructured Worksafe Agricultural Industry Safety Group. This group provides a consultative forum for OSH in the agricultural industry. This is additional to the support that Department provides to the Farmsafe Alliance WA, which is an industry based group seeking to improve farmer safety.
Workers’ Compensation
Departmental performance in workers’ compensation and injury management are measured by the following statistical information.

Department of Agriculture and Food, Western Australia Annual Report 2007 99
Governance Disclosures
2004/05 2005/06 2006/07
Premium/contribution rate(Total premium paid/wages declared)
0.49 0.54 0.59
Cost of claims incurred per $100 wage roll 0.51 0.44 0.52
Frequency rate(Lost-time injuries per million hours worked)
5.5 7.0 8.8
Rehabilitation success rate(Index of successful rehabilitation cases)
1.0 1.0 1.0
Governance Disclosures
Contracts with Senior Offi cers
At the date of reporting, other than normal contracts of employment of service, no Senior Offi cers, or fi rms of which Senior Offi cers are members, or entities in which Senior Offi cers have substantial interests had any interests in existing or proposed contracts with the Department and Senior Offi cers.
Other Legal Requirements
Compliance with Electoral Act 1907 section 175ZE (1)
Any public sector agency required to publish an annual report under the FAAA or any other law is required under section 175ZE (1) to include a statement in the annual report setting out details of all expenditure in relation to engaging advertising, media, polling and market research organisations.
In compliance with the above, the following details are submitted:
Advertising agencies $31,130 4L Design GroupA Class DisplaysAdcorpAlbany Camera HouseAll Flags Dot ImagingASB MarketingCountry wide SignsEyerite SignsFinelineImagesource Printing and Imaging SolutionsImatec(WA) Pty Ltd ATFT Imatec TrustLink LettersPerth Expo HirePoster PassionPre-Emptive StrikeProduction FunctionRay Ford SignsSquare Peg DesignStar PromotionalStella Promotional ProductsTotal Digital SolutionsWiseman Signs

Department of Agriculture and Food, Western Australia Annual Report 2007100
Other Legal Requirements
Market research organisations Nil Nil
Polling organisations Nil Nil
Direct advertising organisations Nil Nil
Media advertising organisations $2,000 Rural Press Agricultural Division
Total expenditure for 2006/07 $33,130
Disability Access and Inclusion Plan
The DAFWA Disability Access and Inclusion Plan 2007-2010 provides strategies for the inclusion of its customers and staff with disabilities through improved access to information, services and facilities. The Plan was developed through community and staff consultation and complements the DAFWA Equal Employment Opportunity (EEO) Management Plan 2007 – 2009.
The following are the achievements made in the area of disability services.
Outcome 1
People with disabilities have the same opportunities as other people to access the services of, and any events organised by, the Department.
The Department recognises through its policies and practices the importance of providing customers with disabilities, their carers and families every practicable opportunity to access the Department’s information resources, services and facilities.
In the development of services or arranging of events, planning activities include consideration of the needs of the customer, including those with disabilities who are provided with an opportunity to comment on access to services.
Venues that are selected to accommodate events support access and utilisation by those with physical disabilities. Where this is not an option, wherever possible, modifi cations or alternatives are arranged, to provide equal access for those with physical disabilities.
Information services are also developed to ensure the same opportunities and are described in item 3, below.
Outcome 2
People with disabilities have the same opportunities as other people to access the buildings and other facilities of the Department.
The needs of people with disabilities continue to be addressed as the Department’s buildings and facilities are upgraded and developed.
Planning for new buildings has included an assessment and provision of the needs for both staff and clients with disabilities.
Outcome 3
People with disabilities receive information from the Department in a format that will enable them to access the information as readily as other people are able to access it.
In the delivery of information services, increased information is accessible through the Department’s website. Government standards for the website are utilised to ensure availability to all clients including those with disabilities. The website is presently being reviewed and the access needs of people with disabilities are being addressed as part of the review.
External reading material continues to contain advice that the material is available in alternate formats upon request; and relevant staff are made aware of how to utilise the National Relay Service.

Department of Agriculture and Food, Western Australia Annual Report 2007 101
Other Legal Requirements
Outcome 4
People with disabilities receive the same level and quality of service from the staff of the Department as other people.
The Department provides training in equal opportunity which includes a focus on the needs of people with disabilities. Resources continue to be made available to support staff in delivering appropriate levels and quality of service to people with disabilities.
Outcome 5
People with disabilities have the same opportunities as other people to make complaints to the Department.
The Department has a clear customer complaints mechanism and staff grievance process which provides opportunities for people with disabilities to make complaints or grievances.
Outcome 6
People with disabilities have the same opportunities as other people to participate in any public consultation by a public authority.
Public consultation activities include recognition in the planning and implementation of the special needs for people with disabilities and accommodate these accordingly through both access to information and input mechanisms.
The Department commissioned a Job Audit report to assist in the identifi cation of opportunities and potential barriers for employment of staff with disabilities and where to focus activities for the greatest outcome. The main functions of positions across metropolitan locations in varying working environments were analysed to determine the suitability for people with different types of disabilities. A similar job audit at country locations will be progressed in the near future.
Equal Employment Opportunity Outcomes
The Department is committed to EEO outcomes and regularly monitors the representation and distribution of staff diversity groups.
The Department is tracking very well against representation targets for the diversity groups of women, people from culturally diverse backgrounds, Indigenous Australians and people with disabilities. The target for youth has not been met for a number of reasons including a low seasonal temporary workforce as at 30 June due to seasonal conditions and a reduction in external funding.
30 June 2007
EquityIndex
Represent-ation
2007Objective
Above orbelow
objective
Women Management Tiers 2 and 3 46* 21.1% 18% +3.1%
People from Culturally Diverse Backgrounds 120 7.7% 5% +2.7%
Indigenous Australians 17 2.0% 2.2% -0.2%
People with Disabilities 86 2.3% 2% +0.3%
Youth n/a 7.3% 9% -1.7%
* Equity index is for all women

Department of Agriculture and Food, Western Australia Annual Report 2007102
Other Legal Requirements
Initiatives for 2006/07 to enhance the agency’s Equal Employment Opportunity (EEO) performance have included:
DAFWA EEO Management Plan 2007-2009
The DAFWA EEO Management Plan 2007-2009 provides strategies for the attraction, retention and development of women, Indigenous Australians, people from culturally diverse backgrounds, people with disabilities and youth.
The outcomes of the Plan are:
Outcome 1
Work and Culture Accountability
The Department values equity and diversity and the work environment is free from sexual and racial harassment.
Outcome 2
Work Practices Support Equity and diversity
Workplaces are free from employment practices that are biased or discriminate unlawfully against employees or potential employees.
Outcome 3
An Equitable and Diverse Workforce
Employment programs and practices recognise and include strategies for EEO groups to achieve workforce diversity.
Continued focus on the employment of Indigenous staff including:
Enhanced focus on services to Indigenous Australian clients;
Continuation of cadetship, traineeships and school based trainees in regional areas; and
Barrier identifi cation and elimination and development of strategies to enhance Indigenous recruitment in regional areas is under development.
Continued focus on women including:
The secondment of two senior women to the Department as part of the Women in Senior Management Secondment program;
Regular monitoring by Executive of the employment statistics of the Department’s female staff;
Positive approach to the development of women through the three levels of the management development program;
Increasing the proportion of women being recruited into professional positions;
Ongoing promotion and enhancement of the family friendly employment policies and practices;
Greater awareness of equity issues through EEO training and promotion of EEO policy;
Identifi cation and promotion of external networking opportunities for senior women; and
All new job description forms include statements relating to the application and accountability of managers in relation to equal opportunity principles.

Department of Agriculture and Food, Western Australia Annual Report 2007 103
Other Legal Requirements
Continued focus on youth including:
Primary Industry Science Program;
Undergraduate Honours and Studentship Programs;
Graduate Development Program;
Indigenous youth programs previously referred to;
The employment of apprentices;
Identifi cation and promotion of external networking opportunities for professional youth; and
A strong focus on youth in universities through presentations to students and career days.
Compliance with Public Sector Standards (Section 31(1) of the Public Sector Management Act 1994)
1. In the administration of the Department of Agriculture and Food, I have complied with the Public Sector Standards in Human Resource Management, the Western Australian Public Sector Code of Ethics and our Code of Conduct.
2. I have put in place procedures designed to ensure such compliance and conducted appropriate internal assessments to satisfy myself that the statement made above is correct.
Compliance issues that arose during the fi nancial year 2006/07 regarding public sector standards included:
3 breach claims lodged (1 Recruitment, Selection and Appointment, 1 Transfer and 1 Grievance)
The Recruitment, Selection and Appointment claim was dismissed as it was withdrawn by the applicant on receipt of feedback. The Transfer and Grievance claims have been forwarded to the OPSSC. The claims have not been resolved as at 30 June 2007 and remain outstanding.
Compliance issues concerning the Department’s Code of Conduct and the WA Code of Ethics that arose during the fi nancial year 2006/07 included:
(a) Three matters dealt with in accordance with the Department’s Grievance Policy.
Allegation of intimidating behaviour and mishandling of initial grievance. Allegation substantiated in part (and referred to Discipline process).
Allegation of breach of the Department’s electronic information transmission policy and breach of departmental vehicle policy i.e. unsafe use. Allegations substantiated and action taken.
Allegation of intimidating and/or bullying behaviour. Allegation substantiated in part. (and referred to Discipline process).
(b) Four matters dealt with in accordance with the Breach of Discipline process pursuant to the Public Sector Management Act 1994.
Two matters pursuant to the Departments grievance policy were escalated to the Discipline process in accordance with the Public Service Management Act (1994). Both matters were substantiated and action taken.
Allegation of inappropriate behaviour to external service provider/consultant. Allegation was substantiated and action taken.
Allegation of undertaking external activity and inappropriate use of departmental resources. Allegations substantiated in part, with on-going investigation.

Department of Agriculture and Food, Western Australia Annual Report 2007104
Other Legal Requirements
(c) Signifi cant action taken to monitor and ensure compliance included:
Information about the Standards and Codes is included in the Department’s policies and procedures, on the intranet, newsletters, workshops and information sessions and in induction packages.
Contact Offi cers and Grievance Offi cer network updated and trained (March 2007).
To assist in the identifi cation of systemic discrimination or harassment, a confi dential feedback mechanism for Contact Offi cers and Grievance Offi cers was developed and implemented (March 2007).
Action plans under development addressing the results of the Climate Survey 2006 in relation to equal employment opportunity, human resource management, ethics and the Public Interest Disclosure Act.
Code of Conduct under review with particular attention to the areas of bullying and personal conduct.
The newly developed DAFWA EEO Management Plan 2007/09 includes strategies for the:
- consideration of the development of equity groups in recruitment and development opportunities, including acting;
- inclusion of EEO grievance processes within the EEO learning and development program and intranet, and
- development of training for line managers in equity and diversity management, including grievances and audit checklist.
Ian Longson
DIRECTOR GENERAL
31 August 2007
Record keeping Plan
As prescribed by the State Records Act 2000, State Records Commission Standards, Standard 2, Principle 6:
The effi ciency and effectiveness of the Department’s record keeping system was formally evaluated in 2003 and will be conducted again by 2008. To assess the risks and extent of corporate information not managed in the corporate record keeping system, an information and storage audit was also conducted during the year. Key performance indicators and associated self assessments are used to evaluate the effectiveness of the program;
An online recordkeeping awareness training and induction course was commenced in 2004 with a requirement for all staff to complete it. Training online will be continued and supported to enable all staff to be made aware of their record keeping responsibilities.
The effi ciency and effectiveness of the training program undergoes ongoing monitoring and review. Workshops for individuals and groups are also conducted throughout the year for a number of sites state-wide; and
A Corporate Induction program for new staff is conducted frequently to cater for and addresses employees’ roles and responsibilities in regard to their compliance with the Recordkeeping Plan.

Department of Agriculture and Food, Western Australia Annual Report 2007 105
Government Policy Requirements
Government Policy Requirements
Corruption Prevention
The Department used a number of strategies during the year to promote awareness of corruption prevention.
Bi-annual articles in the Department’s fortnightly newsletter, AgBrief, emphasised the Code of Conduct’s mandatory requirement for employees to report any matter of corruption in the workplace. The need for staff to behave ethically at all times was highlighted. Employees were requested to be extremely mindful when accepting gifts or benefi ts in the workplace. Explanations were provided on the Perception of Confl icts of Interest and the Principals of Natural Justice. Regular features included the Public Interest Disclosure Act 2003.
The Department participated in an awareness campaign for Global Consumer Fraud Prevention by creating a link on its website to the Australian Competition and Consumer Commission’s SCAMwatch site. The campaign urged consumers to be vigilant against internet, email and phone scams and against becoming victims of identity theft.
In July 2006, a member of the Department’s management team attended the 2006 Public Sector Fraud and Corruption Conference in Canberra. The staff member subsequently prepared a report on the conference and issued copies of the report to the Department Executive and members of the Audit Committee.
The following risk management strategies to prevent corruption and misconduct in the organisation were maintained throughout the year:
1. The Audit Committee included a standing item on Corruption and Misconduct Prevention on the agenda for its quarterly meetings. The Audit Committee has a role to review and advise on the Department’s fraud, corruption and misconduct prevention strategies;
2. Staff throughout the State were encouraged to attend regular Corruption and Crime Commission presentations on Corruption Prevention Strategies;
3. All new employees recruited to the organisation were properly screened to reduce the risk of engaging dishonest people. Referee reports are a mandatory requirement as part of the selection process; and
4. Greater emphasis was placed on adherence to the Code of Conduct in the induction program for new employees. The Code includes references to ethical behaviour and corruption prevention.
Substantive Equality
The Department continues to implement the Substantive Equality Policy Framework, has met the requirements of Level 1 implementation, is nearing completion of Level 2 and has commenced planning for the Level 3 requirements. The Substantive Equality Taskforce continues to oversee the implementation of the substantive equality framework, including the fi nalisation of the pilot horticultural needs and impact assessment with the Carnarvon District Offi ce and vegetable industry stakeholders from the District. Implementation for 2007/2008 is currently under development.
Current achievements in substantive equality have included the development of alternative contact information on Departmental publications and editorial style guide, and accessibility and translating assistance for the Department’s internet site.
Sustainability
The Sustainability Program addresses the requirements of the Sustainability Code of Practice for Government Agencies 2004 and aims to embed sustainability into day-to-day operations of the Department. In addition to establishing a Sustainability Steering Committee, the Department has also continued to progress action within its Sustainability Action Plan 2005-2007, which is currently being reviewed. Some of the key achievements under the action plan include:

Department of Agriculture and Food, Western Australia Annual Report 2007106
Government Policy Requirements
Planning, reporting and decision-making are conducted in accordance with sustainability principles
Improved sustainable management continues to be a high level outcome for the Department and is included in our corporate strategy and reported on in the Department’s annual report.
Work has been completed on identifying which planning and decision-making processes will be informed by sustainability assessments.
Senior managers and project staff attend workshops as required to increase awareness of sustainability principles.
The Department continues to actively engage stakeholders and the public in transparent policy development and decision-making processes. This includes:
- engaging with the rural sector in setting industry R&D directions and building the services required by industry;
- ensuring both farmers and the agri-business sector is provided with the latest technical information through a wide range of activities including: Agribusiness Crop Updates, Sheep Updates, Regional Newsletters, Internet information, and R&D programs such as Vasse Milk Farmlets that have been recognised as leading the nation in participative research where farmers and industry are directly involved;
- maintaining a strong and extensive network of offi ces across the State to support industry development. Effort is concentrated on providing information and support in tackling industry wide issues;
- tailored consultations where major policy issues are being addressed (eg legislative change assessments); and
- conducting an independent client survey on a biannual basis to assess the views and needs of our customers.
Agency operations support sustainability
Procurement
The Department follows State Supply Commission policies in terms of sustainable procurement.
Sustainable Capital Works
Planned capital works associated with the proposed Headquarters, Biosecurity and Agricultural Research Western Australia projects are being planned to meet Department of Housing and Work’s (DHW) sustainability policy with the offi ce components aiming to achieve a 4.5 star AGBR rating and other Energy Sustainable Design (ESD) features;
Smart meters were installed at 13 offi ces;
A feasibility study was implemented to ascertain the practicality of introducing “real time” monitoring to offi ces with smart meters, to allow real time site energy consumption data updates for staff;
A prototype heat pump drying oven for plant and seed material was constructed and is under evaluation;
Energy audit reviews of 14 offi ces were completed;
A feasibility study was completed to harness excess renewable energy at the Eucla Checkpoint to operate a new bore, desalination plant and chilled drinking water supply unit; and
A feasibility study was completed to increase the solar and wind energy generation capacity of the Eucla Town Site, to reduce the town’s reliance on diesel power and to meet increased site power demands associated with a new desalination plant and storage tank farm.

Department of Agriculture and Food, Western Australia Annual Report 2007 107
Government Policy Requirements
Water
A number of solar powered pumps installed on research stations to reduce reliance on diesel pumps and windmills. A State wide replacement program is planned for 2007/08 to replace all windmills with solar pumps; and
Two new small scale desalination plants are in the design phase to condition bore water supplies at Eucla.
Waste
A compilation of asbestos audits across the State was completed. These audits are in the process of verifi cation;
Contaminated Site Reporting was completed and submitted to the Department of Environment and Conservation for all suspected contamination sites;
The Department continued to replace analogue copiers with digital copiers and a further reduction in the number of desktop printers, facsimile machines and analogue copiers was achieved. New equipment is default set to double sided printing and include document scanning to allow electronic transfer of documents; and
There was continued education of staff on the benefi ts of recycling paper.
Public sector employees are empowered and encouraged to support sustainability
Through the setting of diversity employment targets, the Department aims to create a diversity of staff that supports the broader objectives of government and the department. Signifi cant progress is being made, targets established and reported on through the equity index and annual report for outyears to 2009. Supporting activities to increase diversity have been established in the Equal Employment opportunity (EEO) Management Plan 2007-2009; and
All new staff are expected to participate in EEO and Indigenous Australian Cultural Awareness (IACA) training and commencement/induction processes to ensure staff members obtain an understanding and awareness of equal opportunity and relevant cross cultural issues.

Department of Agriculture and Food, Western Australia Annual Report 2007108
A P P E N D I X 1
Corporate Governance
Audit Committee
The Audit Committee is established under the authority of the Director General as an advisory committee to the Director General and the Executive. The Committee’s objective is to assist the Director General and the Executive in their promotion of good governance throughout the organisation.
During the year, the Audit Committee was the subject of an external review by an accredited member of the Institute of Internal Auditors. The review found the Committee to be generally effective in its role and proactive in the consideration of risks facing the Department. The reviewer made a number of recommendations that have since been adopted by the Department.
The recommendations included a re-structuring of the Committee membership to achieve a different skill-set mix. Also, the creation of a new Charter to provide a clearer focus on governance processes that affect core business and supporting services of the Department.
Responsibilities of the Committee include:
reviewing draft copies of the annual fi nancial statements and key performance indicators to provide advice to the Director General;
monitoring and evaluating processes promoting sound internal controls and good business management practices;
providing advice on the appropriate and timely action to be taken by management to address issues requiring attention as identifi ed through internal auditing, external auditing, quality assurance management and risk management processes;
monitoring and evaluating compliance with legislation and ethical standards including the Department’s Code of Conduct; and
monitoring and evaluating the activities of the Department’s Audit and Review Branch.
Members:
an independent Chair with audit, governance, risk management or fi nancial management skills and experience;
one independent member with audit, governance, risk management or fi nancial management skills and experience;
one independent member with internal audit responsibilities in another government department or agency; and
the Director General of the Department of Agriculture and Food.
Attendees:
a senior offi cer (ex-offi cio) from the Offi ce of the Auditor General;
the Director, Policy & Planning; and
the Manager, Audit & Review.
The Chair shall invite to Audit Committee meetings, key staff and members of the Department’s management team where items on the agenda are relevant to invitees’ responsibilities.
The Executive Offi cer of the Audit Committee is the Manager, Audit & Review, and the Department’s external auditor is the Auditor General.

Department of Agriculture and Food, Western Australia Annual Report 2007 109
A P P E N D I X 1A P P E N D I X 1
Internal Audit
The Audit & Review Branch continued to focus its activities on identifying business improvement opportunities by examining the Department’s systems and processes. Specifi c activities included compliance reviews (for example, Plant Research and Development Trust Fund), operational reviews (for example, AGWEST International), data mining and consulting. The Branch also engaged in certifying a large number of fi nancial statements for Departmental projects undertaken for the State’s Natural Resource Management catchment councils.
During the year, the Branch underwent an external quality assurance review as required by the Institute of Internal Auditors Standards for the Professional Practice of Internal Auditing. The reviewer found the internal audit function to be in ‘general conformance’ with the Standards and identifi ed a number of minor improvements.
The Department’s Executive and the Audit Committee continued to provide strong support for the internal audit function. Branch staff attended seminars, workshops and conferences on internal audit, risk management and corruption-prevention. One of the Senior Auditors obtained a new internal audit qualifi cation. The knowledge and skills attained as a result of this professional development assisted the audit staff in carrying out their roles more effectively.
As in previous years, the Manager of the Branch visited a similar agency in another State. The sharing of information and comparison of internal audit practices again proved benefi cial in identifying new ways to assess the Department in terms of its performance and conformance.
Corporate Governance

Department of Agriculture and Food, Western Australia Annual Report 2007110
A P P E N D I X 2Statement from the Commissioner of Soil and Land Conservation
A report on the Commissioner’s operations during the year was submitted to the accountable offi cer in accordance with Section 25 F of the Soil and Land Conservation Act 1945.
Delegations
The delegation of powers under Part II of the Act by the Commissioner to two Department of Environment and Conservation Regional Managers to negotiate and administer covenants under Part IVA remains in effect.
Land Clearing Assessments
During 2006/07, 138 mainly agricultural clearing area and purpose permit applications were assessed by the Commissioner with advice provided to the A/Director General of the Department of Environment and Conservation for determination of those applications. Advice is pending on 19 applications.
Most clearing applications for mining purposes are now being determined by the Department of Industry and Resources under delegation from the Department of Environment and Conservation. During 2006/07, 40 clearing permit applications were assessed by the Commissioner with advice provided to the Department of Industry and Resources. Advice is pending on 11 applications.
Compliance
All complaints registered are investigated and where breaches of the regulations are confi rmed the Commissioner will either issue warning letters where the breach is minor, Soil Conservation Notices where land degradation is likely to occur and/or prosecute where a prima facie case exists and it is in the public interest to do so.
The Commissioner investigated 16 clearing, 3 drainage and 8 land degradation complaints and will take appropriate action under the Soil and Land Conservation Act 1945 or refer matters to the A/Director General of the Department of Environment and Conservation for possible action under the Environmental Protection Act 1986.
Woodchip Permits
No woodchip permits were issued under the authority delegated to the Commissioner by the Minister for the Environment.
Agreements to Reserve and Conservation Covenants
Under Part IVA of the Act, the Commissioner registered ten Agreements to Reserve (ATRs), including two variations of existing covenants on Certifi cates of Title to protect 6,648 hectares of native vegetation. No Conservation Covenants were registered during the fi nancial year.
Soil Conservation Notices
During the year, seven notices discharging Soil Conservation Notices were issued under Part V of the Soil and Land Conservation Act. Of these, four notices directing land owners to block drains discharging saline water onto lower land were re-issued in an amended form following determination of appeals by the State Administrative Tribunal (SAT).

Department of Agriculture and Food, Western Australia Annual Report 2007 111
Table 19: Area of vegetation protected under the Soil and Land Conservation Act 1945 in 2004/05, 2005/06 and 2006/07 (hectares)
Component 2004/05 2005/06 2006/07
Soil Conservation Notices issued 478 615 0
Agreements to Reserve lodged 450 456 6,648
Conservation Covenants lodged 282 181 0
Total area protected 1,210 1,252 6,648
Instruments under the Soil and Land Conservation Act 1945 now protect about 200,000 ha of vegetation throughout the State.
Soil Conservation Notice Appeals
In 2006/07, one appeal application was lodged with the State Administrative Tribunal for a review of the Commissioner’s refusal to discharge a Soil Conservation Notice (illegal land clearing). During the year, four appeals were determined in the Commissioner’s favour (drainage), four cases (land clearing) were withdrawn by the applicants and three remain pending.
Land Drainage
Drainage of groundwater to manage salinity is regulated under the Soil and Land Conservation Regulations. During the year 58 landholders submitted Notices of Intention to Drain (NOIDs) in accordance with regulation 5. Following assessment 46 land owners were issued letters of no objection, 1 received an objection, two were referred to the Environmental Protection Authority, and seven were withdrawn by the proponents.
Most drainage activity during the year occurred in the northern agricultural region where State and Commonwealth Government funds (NAP/NHT2) are being invested in a pilot regional arterial drainage scheme. Regulations under the Soil and Land Conservation Act 1945 are inadequate for the orderly development and operation of such large scaled schemes. The Commissioner is a member of the Technical Advisory Group that supports the newly created Wheatbelt Drainage Council that advises the Minster for Water Resources on drainage matters.
Compliance with the regulations remains a contentious issue. Three complaints alleging breaches of the regulations were registered during the year and one remains pending.
Land Conservation District Committees (LCDC)
At 30 June 2007, 125 Land Conservation Districts remained proclaimed under the Soil and Land Conservation Act. Of these, 48 have no committee currently appointed and are effectively in recess. The number of members now totals 1,018 (25% reduction since 2004/05) following the re-appointment of 14 District Committees and 29 individual members. The reduction in numbers of appointed members refl ects the increasing number of committees in recess in response to the declining relevance of LCDCs in the delivery of NRM outcomes.
During the year, 14 LCDCs were abolished and for a further 9 district committees abolition is pending. The Commissioner assisted the Corruption and Crime Commission (CCC) to investigate a complaint against a LCDC employee. The matter remains pending.
Statement from the Commissioner of Soil and Land Conservation
A P P E N D I X 2

Department of Agriculture and Food, Western Australia Annual Report 2007112
A P P E N D I X 2Statement from the Commissioner of Soil and Land Conservation
Condition of the Resource Base
The Western Australian Rangeland Monitoring System (WARMS) provides an indication of change in pastoral rangelands at broadscale. It does this through a set of representative, point-based sites on which attributes of soil surface condition and perennial vegetation are recorded. WARMS site installation began in 1993 and ended in 1999 and it has 1,622 sites, comprising 989 shrubland and 633 grassland sites. Grassland sites are typically reassessed on a three-year cycle and shrubland sites every fi ve years, although this can vary due to logistical considerations.
The fi fth assessment of the Kimberley grassland sites is about 40% complete. One full cycle (i.e. two assessments) has been completed for shrubland sites, with about 35% of sites now assessed three times.
A total of 440 WARMS sites were reassessed in 2006/07 (Table 20). This was comprised of 130 Kimberley grassland sites, 271 shrub sites and 39 grass sites south of the Kimberley.
Table 20: The number of shrubland and grassland WARMS sites sampled in 2006/07 (south of Kimberley) and the 2006 fi eld season (Kimberley).
DistrictShrubland
Grassland (south of
Kimberley)
Grassland (Kimberley)
Total
Carnarvon 115 2 - 117
Kalgoorlie 90 - - 90
Meekatharra 56 - - 56
Southern region 261 2 - 263
Derby - - 86 86
Karratha 10 37 - 47
Kununurra - - 44 44
Northern region 10 37 130 177
State 271 39 130 440
Shrubland Sites
A total of 309 sites have now been assessed three times. For these sites; the density of shrubs increased on 33% of sites (Fig 8). Overall, there was an average decrease in density of 3%. The density declined substantially (i.e. to less than 50% of density) on 6.5% of sites.

Department of Agriculture and Food, Western Australia Annual Report 2007 113
Figure 8: The number of plants at Date 2 and Date 3 on each WARMS shrubland site for the 309 sites which have been assessed three times.Grassland Sites
For the Derby-West Kimberley, Halls Creek-East Kimberley and North Kimberley Land Conservation Districts (LCD), the average frequency of perennial grasses increased over the fi rst three assessments and then fl attened out by the fourth assessment (Fig 9). Based on 2006 results, it appears that perennial grass frequency has not decreased. In the Broome LCD, fl ood inundation in 2000 caused deaths of perennial grasses but the 2006 data suggest that there has been good recovery in many areas.
Figure 9: The average frequency of Kimberley grassland sites assessed over all cycles. For Time 5 (T5 06,07,08) only sites assessed in 2006 are shown.
Kimberley grassland sites - sampled in T1, T2, T3, T4
Perennial grass frequency south of the Kimberley generally decreased from the 2nd and 3rd assessment to the fourth (Fig 10). The 2006 data suggest that there has been at least partial recovery but this will not be confi rmed until after the 2007 and 2008 fi eld sampling seasons are completed.
No of plants at date 2
0 50 100 150 200 250 300 350
No o
f pla
nts
at d
ate
3
0
50
100
150
200
250
300
350
40
50
60
70
80
90
100
T1 (94,95,96) T2 (97,98,99) T3 (00,01,02) T4 (03,04,05) T5 (06,07,08)
DATE
Broome LCDDerby-West Kimberley LCD
Halls Ck-East Kimberley LCDNorth Kimberley LCD
FREQ
UENC
Y
Statement from the Commissioner of Soil and Land Conservation
A P P E N D I X 2

Department of Agriculture and Food, Western Australia Annual Report 2007114
A P P E N D I X 2Statement from the Commissioner of Soil and Land Conservation
Figure10: The average frequency of “south of Kimberley” grassland sites assessed over all cycles. For Time 5 (T5 06,07,08) only sites assessed in 2006 are shown.
South of Kimberley grassland sites - sampled in each of T1, T2, T3, T4
0
20
40
60
80
100
T1 (94,95,96) T2 (97,98,99) T3 (00,01,02) T4 (03,04,05) T5 (06,07,08)
DATE
Ashburton LCD
Lyndon LCDDe Grey LCD
Roebourne LCD
FREQ
UENC
Y

Department of Agriculture and Food, Western Australia Annual Report 2007 115
Legislation Administered by the Department of Agriculture and Food for the Minister for Agriculture and Food at 30 June 2007
Aerial Spraying Control Act 1966*Agricultural and Veterinary Chemicals (Taxing) Act 1995Agricultural and Veterinary Chemicals (Western Australia) Act 1995Agricultural Practices (Disputes) Act 1995Agricultural Produce (Chemical Residues) Act 1983*Agricultural Produce Commission Act 1988Agricultural Products Act 1929*Agriculture and Related Resources Protection Act 1976*Agriculture Act 1988*Agriculture Protection Board Act 1950*Argentine Ant Act 1968*Artifi cial Breeding of Stock Act 1965*Beekeepers Act 1963*Biological Control Act 1986Bulk Handling Act 1967Cattle Industry Compensation Act 1965*Chicken Meat Industry Act 1977Dairy Industry and Herd Improvement Legislation Repeal Act 2000 Exotic Diseases of Animals Act 1993Fertilizers Act 1977*Gene Technology Act 2006 (to be proclaimed)Genetically Modifi ed Crops Free Areas Act 2003Grain Marketing Act 2002Industrial Hemp Act 2004Marketing of Potatoes Act 1946Ord River Dam Catchment Area (Straying Cattle) Act 1967Perth Market Act 1926Plant Diseases Act 1914*Plant Pests and Diseases (Eradication Funds) Act 1974*Royal Agricultural Society Act 1926Rural Business Development Corporation Act 2000Seeds Act 1981*Soil and Land Conservation Act 1945Stock (Identifi cation and Movement) Act 1970*Stock Diseases (Regulations) Act 1968*Veterinary Chemical Control and Animal Feeding Stuffs Act 1976*Veterinary Surgeons Act 1960Western Australian Meat Industry Authority Act 1976
Legislative Changes
The Policy and Business Services Legislation Unit coordinates the department’s legislation program in consultation with Executive Directors and Program Managers. Legislative changes during 2006/07 include:
Legislation
A P P E N D I X 3

Department of Agriculture and Food, Western Australia Annual Report 2007116
A P P E N D I X 3
Legislation
Legislation before Parliament or to be introduced to Parliament
The Biosecurity and Agriculture Management Bill 2006; the Biosecurity and Agriculture Management (Repeal and consequential Provisions) Bill 2006; and the Biosecurity and Agriculture Management Rates and Charges Bill 2006. This package of Bills will repeal the Acts marked * in the forgoing list and amalgamate into one Act and regulations made under it provisions for:
- the control of animal and plant pests and diseases; - the control of use of agricultural and veterinary chemicals; - the establishment of standards of quality and safety for agricultural products; and - the establishment of agricultural industry funding schemes.
Amendments to the Seeds Act 1981 to provide more fl exibility in the provisions for declaration of prohibited Seeds.
Legislation approved for drafting
Amendments to the Gene Technology Act 2006 to complement amendments made to the Commonwealth Gene Technology Act 2000 and ensure the maintenance of a nationally consistent scheme for the regulation of dealings with genetically modifi ed organisms.
Other Legislation that impacts on the Department of Agriculture and Food’s Activities
Animal Welfare Act 2002Auditor General Act 2006Carbon Rights Act 2003Conservation and Land Management Act 1984Corruption and Crime Commission Act 2003Disability Services Act 1993Electoral Act 1907Electronic Transactions Act 2003Emergency Management Act 2005Environmental Protection Act 1986Equal Opportunity Act 1984Explosives and Dangerous Goods Act 1961Financial Management Act 2006Firearms Act 1973Forest Products Act 2000Freedom of Information Act 1992Government Employees’ Housing Act 1964Government Employees Superannuation Act 1987Health Act 1911Industrial Relations Act 1979Land Administration Act 1997Library Board of Western Australia Act 1951Minimum Conditions of Employment Act 1993Occupational Safety and Health Act 1984Occupiers Liability Act 1985Parliamentary Commissioner Act 1971Poisons Act 1964Public and Bank Holidays Act 1972Public Interest Disclosure Act 2003Public Sector Management Act 1994

Department of Agriculture and Food, Western Australia Annual Report 2007 117
Salaries and Allowances Act 1975State Administrative Tribunal Act 2004State Records Act 2000State Superannuation Act 2000State Supply Commission Act 1991Transfer of land Act 1893 Waterways Conservation Act 1976Wildlife Conservation Act 1950Workers’ Compensation and Injury Management Act 1981
Statement of Compliance with Relevant Written Laws
I have attempted to comply with all written laws and have exercised controls which provided reasonable assurance that the receipt and expenditure of moneys and the acquisition and disposal of public property and incurring liabilities have been in accordance with legislative provisions.
Ian Longson
DIRECTOR GENERAL
Legislation
A P P E N D I X 3

Department of Agriculture and Food, Western Australia Annual Report 2007118
A P P E N D I X 4
Department Offi ces
Department of Agriculture and Food offi ces – Metropolitan
South PerthForrestfi eldMurdoch UniversityWAQIS, Canning ValeDomestic and International Airport
Department of Agriculture and Food Offi ces – Regional
Albany KatanningBroome KununurraBunbury Lake GraceCarnarvon ManjimupDerby MeekatharraEsperance MerredinEucla MooraGeraldton NarroginJerramungup NorthamKalgoorlie Three SpringsKarratha Waroona
Community Agriculture Centres (CACs)
Boyup Brook PingellyBuntine Plantagenet (Mt Barker)Corrigin RavensthorpeDowerin WaginGillamii Agriculture Centre (Cranbrook) WickepinGoomalling WilliamsKojonup
Research Stations
Badgingarra ManjimupBeverley MedinaEsperance Downs MerredinGascoyne Mount BarkerGeraldton NewdegateKatanning VasseKununurra Wongan Hills
District Agriculture Protection Offi ces
Boddington Margaret RiverDenmark MukinbudinDonnybrook Port HedlandDowerin Southern CrossGoomalling WilliamsHalls Creek Yalgoo Hyden
Border Checkpoints
Eucla Kununurra
Quarantine Stockyards
Halls Creek KununurraParkston

#72542 www.acorndesign.com.au
Department of Agriculture and Food, Western Australia3 Baron-Hay Court, South Perth, Western Australia 6151
Postal Address: Locked Bag 4 Bentley Delivery Centre WA 6983
Tel: +618 9368 3333 Fax: +618 9368 1205
www.agric.wa.gov.au