department of economics - diva portaluu.diva-portal.org/smash/get/diva2:761044/fulltext01.pdf ·...
TRANSCRIPT

Department of EconomicsWorking Paper 2014:7
The impact of microfinance on factors empowering women: Differences in regional and delivery mechanisms in India’s SHG programme
Ranjula Bali Swain and Fan Yang Wallentin

Department of Economics Working paper 2014:7Uppsala University November 2014P.O. Box 513 ISSN 1653-6975 SE-751 20 UppsalaSwedenFax: +46 18 471 14 78
The impact of microfinance on factors empowering women: Differences in regional and delivery mechanisms in India’s SHG programme
Ranjula Bali Swain and Fan Yang Wallentin
Papers in the Working Paper Series are published on internet in PDF formats. Download from http://www.nek.uu.se or from S-WoPEC http://swopec.hhs.se/uunewp/

The impact of microfinance on factors empowering women: Differences in
regional and delivery mechanisms in India’s SHG programme
Ranjula Bali Swain∗ and Fan Yang Wallentin♦
31 October 2014
We examine how the impact on women empowerment varies with respect to the location
and type of group linkage of the respondent. Using household survey data from five states in
India, we correct for selection bias to estimate a structural equation model. Our results reveal
that in the southern states of India empowerment of women takes place through economic
factors. For the other states, we find a significant correlation between women empowerment
and autonomy in women’s decision-making and network, communication and political
participation respectively. We do not however find any differential causal impact of different
delivery methods (linkage models).
Keywords: microfinance, women empowerment, structural equation model, self-
help groups.
JEL classifications: G21, J16, C31.
∗ Corresponding Author: Department of Economics, Uppsala University, Box 513, 75120, Uppsala, Sweden. Email: [email protected] ♦ Department of Statistics, Uppsala University, Uppsala, Box 513, 75120, Uppsala, Sweden.
1

1. Introduction
The Self Help Group Bank Linkage programme (SBLP) has been the core strategy for
women empowerment in the Ninth Plan (1997-2002)i and Tenth Plan (2002-2007) for the
Government of India. Initiated in early 1990s as a pilot program by the National Bank for
Agriculture and Rural Development (NABARD), it has expanded to cover over 97 million
households, by March 2010. The SBLP is a microfinance programme that links the Self Help
Group (SHG) of 10 to 20 members (predominantly women) to a bank for savings and/or
credit. The SHGs are supported in their formation, nurtured and linked to banks through the
Self Help Promoting Institutions (SHPIs) like non-governmental organisations (NGOs),
banks or government organisations etc. About 75 per cent of the groups were formed by
NGOs and financed directly by banks (NABARD, 2006). Typically, given their orientation
towards development goals, NGOs tend to provide longer support and additional training
and services to their mostly women clients. The development of the SBLP has also been
regionally imbalanced with the southern states of Andhra Pradesh, Tamil Nadu and
Karnataka accounting for 54 per cent of the SHGs and 75 per cent of the bank credit (Sinha
et al., 2009). Amongst other factors, support by government programs, like the Development
of Women and Children in Rural Areas (DWCRA) in Andhra Pradesh and large NGOs with
focus on women contributed substantially (Write, 2000). The potential impact of the linkage
model and this lopsided growth on women empowerment of SBLP members has not been
researched.
Our main objective is to investigate if the regionally imbalanced SBLP development and the
type of delivery mechanisms (linkage models) have resulted in significant differences in the
process of empowering women through SBLP. In particular we examine if it is the economic
or non-economic factors that are leading to empowerment in the south and other states. We
estimate Structural Equation Model (SEM) by analysing data from the Self Help Group
Impact Assessment Survey (SIAS) that the author collected from five states in India for the
year 2003.
We define women empowerment the process in which women improve their wellbeing
by challenging the existing norms and culture of the society in which they live. Bali Swain
(2007) and Bali Swain and Wallentin (2009) argue that greater efficiency in women’s
household chores or their performance within the existing social norms (as caregivers and
2

household managers), do not lead to empowerment. Similarly, community development
initiatives that are undertaken by the SHGs, lead to household’s welfare but are not directly
empowering women. In fact, they may help maintain the existing gender roles within a given
society. Women empowerment takes place when women improve the quality of their lives
by resisting the gender-based traditions and norms that reinforce gender inequality. ii
Furthermore, women empowerment is multi-locational, exists in multiple domains and is a
multi-dimensional processiii – for instance, economic decision-making does not necessarily
imply that the woman can decide contraception use or contribute to non-financial decisions
(Malhotra and Mather, 1997; Johnson, 2005; Kabeer, 1999). This makes alternative
development initiatives, such as political quotas, awareness generation and property rights,
important interventions for empowering women. (Armendáriz and Morduch, 2005; Kabeer,
2005; Deshmukh-Ranadive, 2003).
Our results show that the economic factors have a significant impact in empowering women
in the southern states of India. For other states, autonomy in women’s decision-making and
network, communication and political participation shows significant correlation with
women empowerment. There is no significant impact on women empowerment by the type
of linkage model in the delivery of microfinance.
The paper contributes to the research literature on several levels. First,it provides insights
difference in the empowerment of women members by investigating the impact by the type
of linkage and the historical regional development. This is largely uncharted territory as
there is no scientific research literature on this. Second, using we use rigorous approach
through SEM to estimate impact on a unobservable latent variable like women
empowerment. Third, our unique survey data enables us to implement this sophisticated
analysis and provides us with detailed information on respondents from 10 geographically
spread and representative districts in India. Even though the data is not recent, the
dominance of linkage model 2 and the southern states continue till present and make the
results and inferences as relevant. Fourth, given SBLP’s critical role in promoting women’s
empowerment, our results provide the Indian financial inclusion policy with clear evidence
on areas that require strategic focus.
In the following section we discuss the SBLP programme and its role in women’s
empowerment. Section 3, explains the model specification and estimation. The data and the
3
observed indicators are discussed in Section 4. The results are presented in Section 5. The
final section concludes.
2. The Self Help Group Bank Linkage Programme and women’s empowerment
The All India Debt Investment Survey (1983) concluded that the rural financial system in
India had failed to reach its objective to provide credit to the unbanked rural clients.
Discussions between the Reserve Bank of India and NABARD in 1991-1992 resulted in a
pilot project that ultimately developed into SBLP, which has become one of the largest and
fastest growing microfinance programmes in the world (Bali Swain, 2012a; Garikipati,
2008). By 31 March 2010, SBLP had savings-linked seven million SHGs and credit-linked
more than 4.9 million SHGs. At its core SBLP is a village banking model where the group
members save and lend amongst themselves for the initial six months. After the group
demonstrates stability and financial discipline, the group is credit linked to a bank through a
SHPI and receives a loan of up to four times the amount it has saved. As savings increase
through the group’s life, the group accesses a greater amount of loan. The programme is
characterised by small loan size, regular meetings, frequent repayment instalments, regular
savings and might also include training facilitated by the SHPIs. Typical training
programmes may include training related to SHG, primary healthcare, basic literacy, family
planning, marketing, and occupational skills (Bali Swain and Varghese, 2010).
A substantial body of literature concludes that SBLP has a significant economic impact on
its clients (Banerjee et al., 2013; Bali Swain and Varghese, 2009; EDA, 2006; Puhazhendi,
2000; Puhazhendi & Badatya, 2002; Puhazhendi & Satyassi, 2000). SBLP access leads to a
reduction in the household’s vulnerability (Bali Swain and Floro, 2012; Guérin et al., 2009),
especially for villages with better infrastructure and for SHGs that are formed by NGOs and
credit linked by banks (Bali Swain, 2012b). Bali Swain and Varghese (2013) also find for
training in SBLP.
Bali Swain and Wallentin (2009, 2012) find that SBLP participation leads to women
empowerment, predominantly through economic factors. Autonomy of the member in
decision-making and social attitudes are other significant factors. These results are strongly
supported by the wider household bargaining literature that attributes women’s
empowerment to the economic factors through changes in household choices, and bargaining
4
power, by increasing overall resources, affecting the returns on human capital and
influencing the attributes and norms (Armendáriz and Morduch, 2005; Browning and
Chiappori, 1998; Ashraf, Karlan, and Yin, 2006). The increase in the relative value of female
time and her monetary income, raises the woman’s bargaining power to allocate resources
within the household and leads to greater investment in education, housing and nutrition for
children (Browning and Chiappori, 1998; Duflo, 2003). Microfinance also empowers women
through loans that enable greater autonomy and decision-making by women (Anderson and
Eswaran, 2005; Goetz and Gupta, 1996); and creating awareness and political and social
inclusion (Armendáriz and Morduch, 2010; Dijkstra, 2002; Beteta, 2006; Bardhan and
Klasen, 1999).
Improved networking, better communication and greater mobility also empower women
(Bali Swain and Wallentin, 2009). Social pressure from SHPIs and other group members can
induce changes in attitudes within the household, and may lead to greater empowerment.
Browning and Chiappori (1998) suggest that social pressure may also alter the woman’s
power within household decision-making. SHPIs and SHG interaction encourages the
women members to participate in the community, thereby making them more active in the
society and the local politics (Bali Swain, 2007; Tesoriero, 2005). Increased female
representation in local governments, voting, and involvement in politics, as well as in
informal organisations to solve community problems, are factors that lead to further
empowerment of women (Bardhan and Klasen, 1999; Dijkstra, 2002; Beteta, 2006).
An important feature of the SBLP is the frequent group meetings. These group meetings
provide female member an opportunity to break out of her daily routine and discuss her
common problems (Bali Swain and Wallentin, 2009; Townsend, 1999). This interaction with
the women of her SHGs and members of the other SHGs leads to an increase in the exposure
and confidence to articulate and pursue her interests (Purushottaman, 1998; Summer-Effler,
2002).
In contrast, there are a few studies that find little evidence for women’s empowerment.
Investigating 291 married couples from two villages in Mabubnagar district (Andhra
Pradesh) in 2001-2003, Garikipati (2008) finds that lending to women helps households to
diversify livelihoods and reduce their vulnerability to shocks, but fails to empower women.
Banerjee et al. (2013) also find no impact of microfinance institutions (MFIs) on women’s
5

decision-making, using data from slums in the capital city of Hyderabad in Andhra Pradesh,
in 2005-2007.
3. Estimation Method
Estimating women empowerment is a challenge task as it is an unobservable latent variable.
This is further complicated by latent factors (like economic, social etc.) that have a causal
effect on women empowerment but cannot be observed. Moreover, lack of disaggregated
data and limited information on household dynamics leads to further difficulties (Moghadam
and Senftova, 2005). To scientifically quantify women empowerment some studies have
used the index approach (Hashemi, Schuler, and Riley, 1996; Goetz and Gupta, 1996) and
the factor analysis methodology (Pitt, Khandker, and Cartwright, 2006). The index/indicator
approach assigns numerical values (or arbitrary weights) to the ordinal measures that are
generally qualitative responses and thus categorical in nature. Assigning these values or
weights is inappropriate (Bali Swain and Wallentin, 2009; 2012) and may also lead to loss of
information and misleading conclusions. Instead, we employ Structural Equation Modelling
to estimate the impact of latent factors where ordinal variables are treated appropriately,
without assignment of arbitrary values or weights.
3.1 Structural equation model
Structural Equation Modelling (SEM) is a statistical methodology which is intensively used
by researchers across disciplines in the social and behavioural sciences to study the causal
relationships of a set of latent constructs (Scholtens et. al., 2013; Biblarz and Raftery, 1993).
SEM enables us to estimate the impact of latent factors (measured by observed indicators) on
a latent variable like women’s empowerment. Our three-fold objective is to first measure the
latent factors that have an impact on women empowerment. Second, while using the ordinal
indicators to measure these latent factors we do not artificially assign values/weights to the
ordinal categories. Third, we want to know which of these latent factors have a significant
impact on empowering women. The estimated model is presented by the path diagram in
Figure 1. The path diagram in Figure 1 consists of measurement models and a structural
model. The measurement models use the observed indicators (in rectangles) to measures the
latent women empowerment variables and other related latent variables (in the ellipses). The
6
latent economic and non-economic factors of women’s empowerment are measured by the
observed indicators (in rectangles) on the left-hand side of Figure 1.
< Figure 1 about here >
The structural model is indicated by the middle part of Figure 1 and represents the causal
relation of the latent economic and non-economic factors with the latent women’s
empowerment variable. The path diagram in Figure 1 corresponds to the following
simultaneous equations system (see Jöreskog and Sörbom 1999).
η = Γξ + ζ
x
y
xy= Λ ξ + δ
= Λ η+ ε
The structural equation model is represented by equation (1), which indicates that the latent
women empowerment (η) depends on the vector of latent component (ξ), where Γ is the
vector of latent regression coefficients and ζ is the error term. The measurement models are
represented by equation (2) and (3). Equation (2) is the measurement model for the latent
components (economic and non-economic) of women empowerment (ξ), where x is the
vector of measures for the latent component of women empowerment, Λx is the vector of
factor loadings and δ is the vector of measurement errors associated with the respective
indicators. Equation (3) is the measurement model of the latent women’s empowerment (η),
which is measured by the indicator vector y and Λy is the vector of factor loadings. ε is the
vector of measurement errors associated with y.
3.2 Treatment of ordinal variables
Several of the indicators used to measure women’s empowerment are ordinal in nature.
Ordinal variables represent responses to a set of ordered categories. It is inappropriate to
specify numerical values to categorical questions. For instance, if the respondent is asked
about how confident she is, she might respond by choosing one of the following categories:
(2)
(3)
(1)
7

very confident; somewhat confident; not confident; and not at all confident. Specifying a
numerical value to these choices, as has been done in earlier studies is not appropriate because
of the following reasons. First, we do not know the magnitude of difference between any of
these two categories. Second, even if two different respondents choose the same category, we
cannot say that they have the same level of self-confidence. It is the underlying latent self-
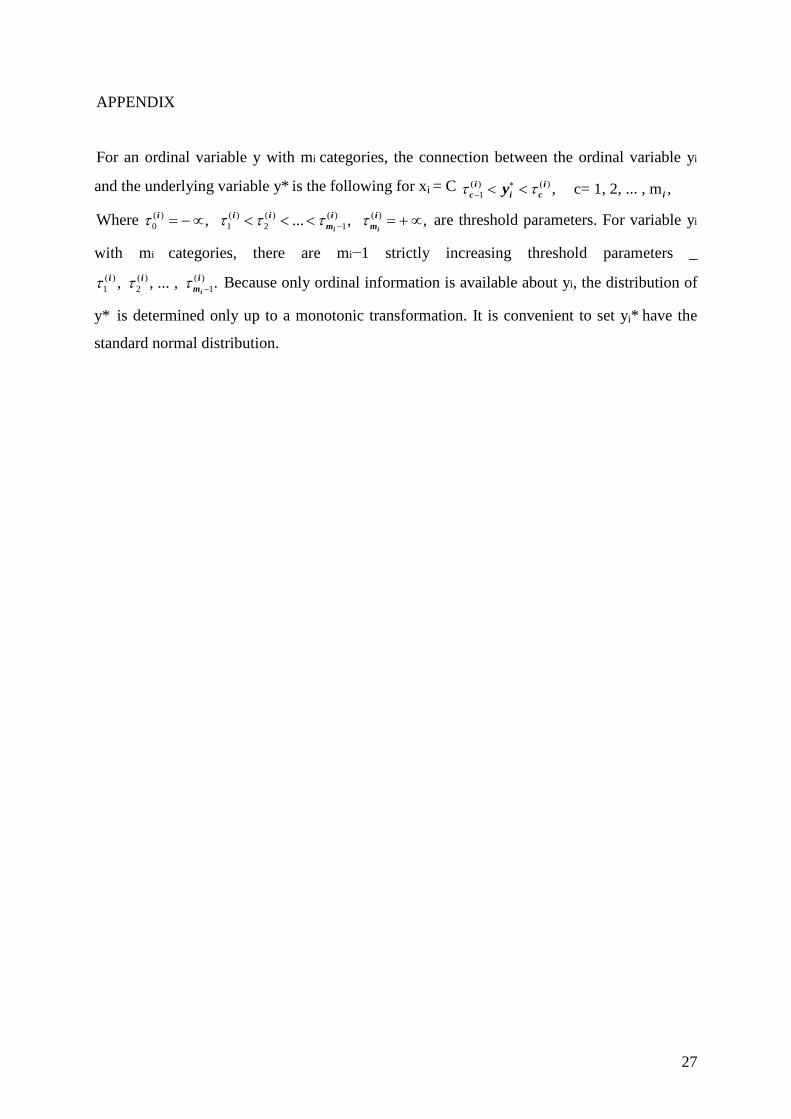
confidence that we are interested in. Following Jöreskog (2002) we assume that the
unobserved univariate continuous distribution generates an observed ordinal distribution as a
latent response distribution. This means that for each ordinal variable y, we assume that there
is an underlying continuous variable y* that represents the attitude of the ordinal responses to
y and is assumed to have a range from-∞ to ∞. It is this underlying variable y* that is used in
our model, and not the observed ordinal variable y. Details about this are included in the
Appendix.
3.3 Estimation method
The ordinality of the observed variables imply that the assumption of multi-normal
distribution which maximum likelihood estimation method requires is violated. Therefore,
the standard errors and chi-square estimates will be biased. In order to correct for this we
adopt Robust Maximum Likelihood (RML) method (see Jöreskog et al. 2001) using an
asymptotic covariance matrix to estimate the correct standard errors and chi-squares under
the non-normality (caused by ordinality).The model is estimated using the following
function:
where z is the vector of the observed responses (containing both y and x). Σ is the
population matrix of polychoric correlation and S is the corresponding sample polychoric
correlation matrix.
4. Data
The estimation of women empowerment requires information on a wide range of questions
with high demand on the data quality and sample size. Data constraints have been a major
challenge for several scientific studies on women’s empowerment. For the analysis in this
)()()log()(||||log)( 11 µµθ −Σ′−−−−Σ+Σ= −− zzkSStrF
8

paper we use the Self Help Group Impact Assessment Survey (SIAS), collected by one of the
authors, which is a part of a larger study that investigates the SBLP. The household survey
uses a quasi-experimental design, with a pre-coded questionnaire to collect data for two
representative districts each, from five states in India, in 2003.iv These are Andhra Pradesh
and Tamil Nadu in the south; and Uttar Pradesh, Orissa (recently renamed Odisha) and
Maharashtra in the north, east and west respectively. We use a sample of 689 SHG
households. Of these 32 observations have missing values and are dropped. We thus end
with a sample 659 SBLP participants respondents.
4.1 Regional variations in SBLP
Since its initiation the regional imbalance in SBLP has shown a special preference for
the southern states (Sinha et al., 2009; Reddy and Malik, 2011; Kumar and Golait, 2009).
The state of Andhra Pradesh alone accounts for 40 per cent of all SHGs (Bansal, 2003).
Estimating two separate indices to estimate the extent of outreach of SBLP, Srinivasan
(2010) confirms this southern bias. The microfinance penetration index (MPI), which
computes the ratio of microfinance clients with the share of the population, shows that three
of the top five states are in the south: Andhra Pradesh (3.64), Tamil Nadu (2.77) and
Karnataka (1.57). Another measure, the intensity of microfinance among poor index (MPPI)
is the ratio of the share of the state in microfinance clients to the share of the state in
population of poor. Again of the top five states, four were from the south: Andhra Pradesh
(6.35), Tamil Nadu (2.77), Kerala (2.49) and Karnataka (1.74).
This outstanding performance of the SBLP in the south (especially Andhra Pradesh)
was attributed to multiple factors by Write (2000). State supported government programs,
like the Development of Women and Children in Rural Areas (DWCRA) in Andhra Pradesh,
credit linked a significant number (about 40 per cent) of the SHGs.v A large number of
SHGs (about 3000 groups) were promoted under the South Asian Poverty Alleviation
Program, sponsored under the United Nations Development Program. The community based
development finance showed a strong evolution in the south, with the SHGs being promoted
by NGOs and district rural development agencies. The able support of the government
officials, NABARD district development managers and the lead bank managers also played
an important role. Presence of the forefront microfinance NGOs like Mysore Resettlement
and Development Agency (MYRADA), Society for Helping Awakening Rural Poor through
9

Education (SHARE) and Bharatiya Samruddhi Investments Consulting Services Limited
(BASIX), contributed substantially to the success of the SBLP in the southern states. In
Tamil Nadu, the Tamil Nadu Corporation for the Development of Women (TNCDW) were
the driving force in the formation of SHGs, their capacity building and linkage to banks (Bali
Swain, 2012a).
Mahajan and Gupta (2003) note that the central, eastern and north-eastern states in India
have been left behind in the SBLP, resulting in a low demand for credit, especially amongst
the subsistence poor. Lack of good NGOs and the heavy reliance on delivering subsidised
programmes (for instance SYSG) to individuals rather than SHGs have corrupted the SBLP
in these states. Reddy and Malik (2011) further argue that banks in the northern states lacked
motivation, effort and the ability to identify NGOs.vi This was partially aggravated by the
lack of large sized NGOs that had the experience of working with SHGs vii and the
unsuitability of the SBLP approach to the region. Institutional factors like lack of awareness
and gender inequality have also been critical factors (NCAER, 2008).
Maharashtra and the Orissa state government engaged more actively with the SBLP, as
compared to Uttar Pradesh in the north. The Orissa state government formed a separate
directorate ‘Mission Shakti’ in 2001 under the Women and Child Development (W&CD)
Department. Almost all the government programmes were linked to the SBLP, for instance
Swarnjayanti Gram Swarozgar Yojana (SGSY), Integrated Tribal Development Programme
and Orissa State Financial Development Corporation Programmes etc. Orissa saw a quick
formation of SHG federations and substantial progress in the tribal dominated districts of
Orissa.
Based on the marked difference in level of development of the SBLP in the south and other
regions of India, we divide our sample of SHG participants into the better performing
southern states (Andhra Pradesh and Tamil Nadu) and other states (Maharastra, Orissa and
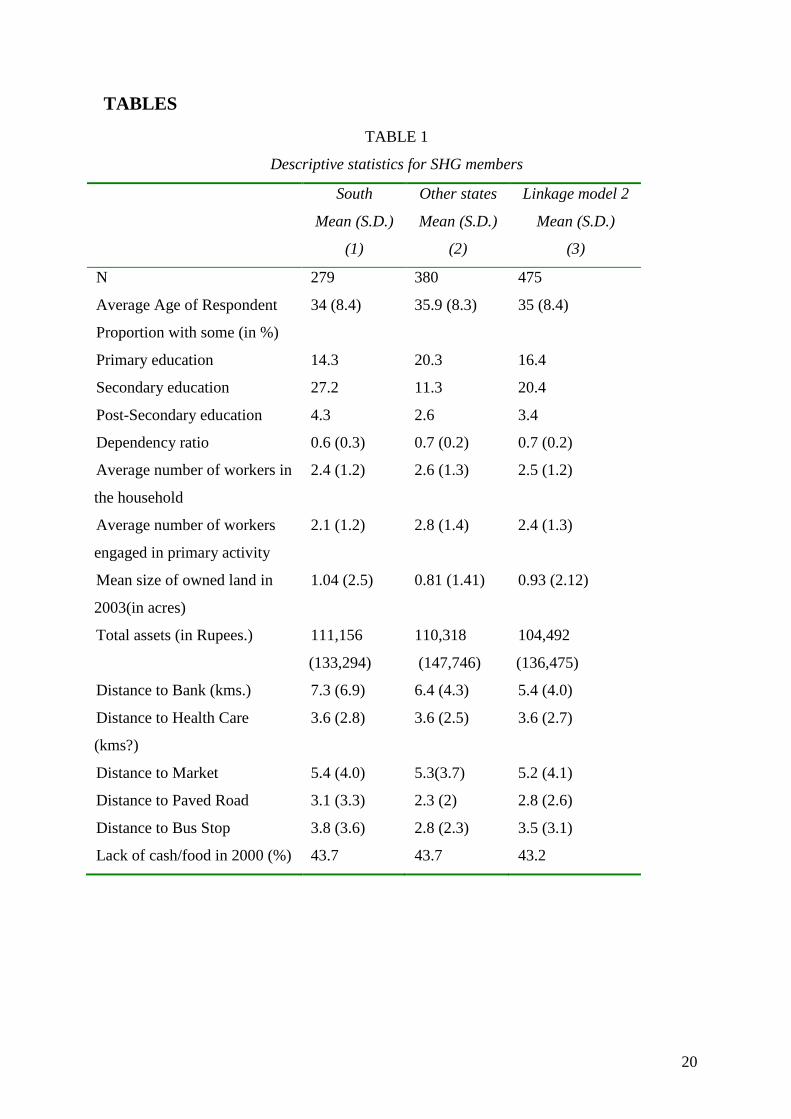
Uttar Pradesh) of India. Table 1 shows the characteristics of the SHG members in the south
and other states. In general, SHG members in the south are younger and have higher
education as compared to the SHG members in the other states. The households of the SHG
members in the southern states on average own more land and have slightly higher assets. In
terms of their location the SHG members are on average closer to the banks as compared to
10
the SHG members in other states. However, in other states SHG members have better
infrastructural access in terms of average distance to a paved road or bus-stop.
< Table 1 about here >
4.2 Linkage model
The SHGs are credit linked to the banks through three different models during the time of
the survey.viii In the first linkage model, the banks help in the formation and financing of the
SHGs. The groups linked by the second model are formed and nurtured by the NGOs but
directly financed by the banks. In linkage model 3, NGOs form the SHGs but banks finance
the SHGs through the NGOs. Of these three linkages types, model 2 is the most popular,
accounting for roughly three-fourths of all SHG linkages (NABARD 2006).ix About 20 per
cent of SHGs are formed and linked by banks (model 1) and only 5 per cent are linked by
banks through NGOs (model 3).
Ghate et al. (2007) suggests that the groups promoted by the field level government officials
have low capacity to support the SHGs. In addition, these officials are further burdened with
targets number of SHGs to be created. Many NGOs usually have strong empowerment and
development objectives and thus engage more actively with the SHGs. In our data 72 per
cent of the SHG respondents were credit linked by linkage model 2 while 12 (15) per cent
were linked by model 1(3). See Table 1, (column 3) for the characteristics of the respondent
linked by dominant linkage model 2.
4.3 Women empowerment variables
To estimate latent women’s empowerment, we need to rely on observed indicators that
capture the increment in empowerment. Bali Swain (2007) and Bali Swain and Wallentin
(2009) explain that women are empowered when their well-being increases through
participation in non-traditional domains.x In South Asia, decisions such as buying and selling
of land and property, family planning and use of contraception, decision to educate a girl
child and marriage of an off-spring, remain outside the domain of women’s decision-making
(Kabeer, 1999; Bali Swain and Wallentin, 2009). Based on these considerations our selected
observed indicators reflect this definition of women’s empowerment.
11

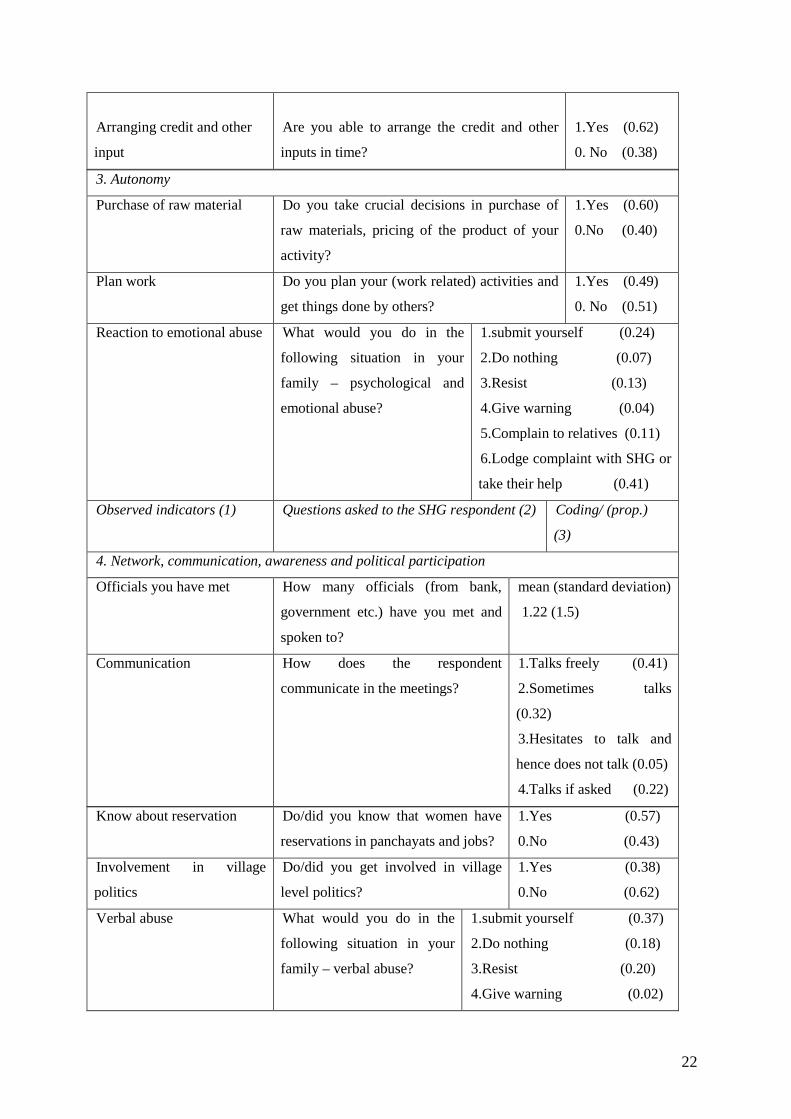
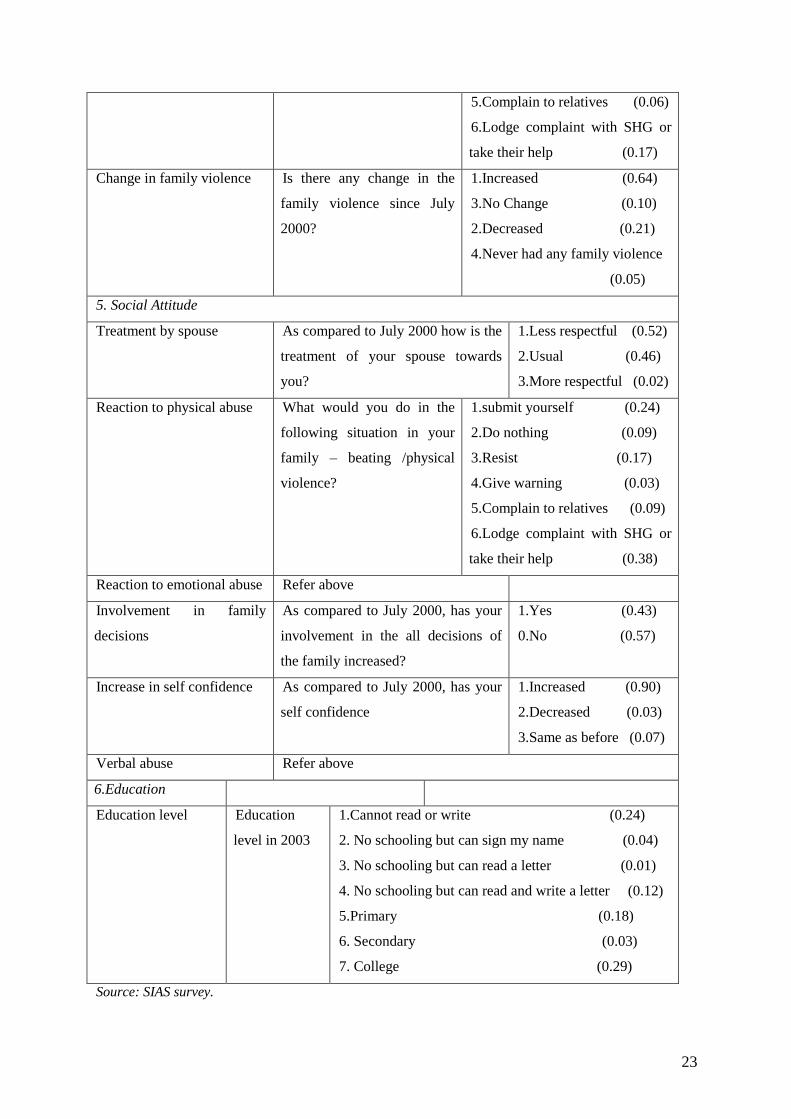
The discussion in Section 2 suggests the observed indicators for the latent economic and
non-economic causal factors for women’s empowerment, that are presented with definition
and response proportions in Table 2. For instance, the latent economic factor is measured by
the following observed indicators for the respondent: her participation in economic activity;
investment by respondent in home improvement; confidence to meet financial crisis; and
arranging capital and other inputs.
< Table 2 about here >
5. Results and discussion
Our first objective is to investigate if SBLP programme has differential impact on women’s
empowerment of its SHG members depending on whether they belong to the more actively
engaged states in the south or not. Second, we also examine if the type of linkage impacts
the women’s empowerment process differently. The underlying assumption is that NGO
driven linkage model 2 might be more effective in empowering women as compared to the
other linkage types due to their active engagement in the social-development space. Before
proceeding to estimate the causal relationships among the latent variables in structural
equation model specified in the middle part of Figure 1, we need to test whether the
measurement model is valid. In other words, we need to test that the indicators are
measuring what they supposed to measure. If the measurement is not valid the whole model
become invalid and there no meaning to test the latent relationships. The results evidenced
that all except one) of the factor loadings of Λx and Λy, are statistically significant. The
measurement model fits the data relatively well indicating both the measurements and model
are valid.
Table 3 presents the parameter estimates and some of the fit indices for the SHG members in
the south, other states and linkage model 2. These coefficients are standardised and may thus
be interpreted on both significance and magnitude.
< Table 3 about here >
The model fit is assessed by examining the Satorra-Bentler scaled chi-square goodness of fit
index, the Root Mean Square Error of Approximation (RMSEA) and the Normed Fit Index
12

(NFI). The RMSEA considers the error of approximation in the population and finds how
well the model, with unknown but optimally chosen parameter values, fits the population
covariance matrix. The NFI is a measure that rescales chi-square to compare a restricted
model with a full model using an arbitrary baseline null model. The model fit indicators
reveal that the model has a good approximate fit, which implies that our estimates are
reliable.
While comparing the states in south with the other states, our results show that the southern
states have a clear advantage in empowering women. In the south, the economic factor has
the most significant impact on empowering SHG members. This resonates well with the
economic theory and earlier results (Bali Swain and Wallentin, 2012). Women participating
in SBLP get access to loans that are used for generating livelihoods and accumulating assets.
This leads to greater bargaining power within the household and a greater say and decision-
making within the household, thereby leading to greater women’s empowerment.
Greater autonomy in terms of independent planning, management and decision-making at
work and intolerance towards emotional and psychological abuse at home, is expected to
contribute incrementally towards empowerment. However, this does not seem to be the case
for the SHG members in the south. From the negative coefficient for autonomy we infer that
even though women in the south have greater autonomy in work related decisions, they do
not have control or ownership of their assets or/and loans. This is supported by evidence
from Garikipati (2008). Using data from rural Andhra Pradesh in India, she argues that
diversion of women’s loan into enhancing household assets and incomes may not lead to
women’s empowerment as women do not have co-ownership of property and assets.
Garikipati (2012) further argues that microcredit leads to enhancing male ownership of the
household’s productive assets, thus helping husbands to move away from wage work
(associated with low wages and status) to self- employment. She finds little impact on
women’s time use. Thus, loan access and autonomy in making work related decisions have
to be supported by women’s control over loan-created assets to have an impact on
empowering women. Some researchers find that loans taken by women are often controlled
by their husbands, resulting in their dependence for loan repayment and domestic discord
(Goetz and Gupta, 2006; Rahman, 1999).
13

Social attitudes, network, communication and political participation and education do not
contribute significantly to women’s empowerment. Statistical non-significance of these
factors in this study should not be interpreted as non-significance of these factors in
empowering women. Women’s empowerment is a long term process and it is possible that
these crucial factors will have a positive impact in the long run scenario.
In addition to the estimated parameters of the SEM we also look at the underlying
covariance coefficients of the economic and non-economic factors with women
empowerment (Table 4). Although for the structural model, none of the parameter estimates
are significant in the case of other states, the covariance matrix reveals significant
correlations between the factors and women’s empowerment. Based on the covariance
structure of these latent variables we notice that the relation between autonomy; network,
communication and political participation and social attitudes is significant in the case of
other states. Although this significance does not imply causality it does provide evidence for
positive correlation for autonomy and network, communication and political participation,
with women empowerment in other states. Social attitude is significantly negatively
correlated with empowerment of women in the other states, suggesting a negative bias
against women due to various cultural, traditional and behavioural factors.
< Table 4 about here >
The SEM was estimated for different linkage types and the results for the linkage model 2
are presented in Table 3 (column 3). There is no evidence for any significant empowerment
causing factor for linkage model 2. Part of the problem here is the small sample size. This
suspicion is confirmed when we experiment by assuming a larger sample size of over 1000,
for linkage model 2. With an increase in sample size both economic and autonomy factors
become significant in causal relation to women empowerment. Note that the results for the
control groups for the two state sub-samples and linkage models could also not be estimated
due to the very small sub-sample size for the control group.xi
6. Concluding Remarks
An increasing concern for greater outreach of SBLP has been the entry of the government
agencies and the contracted staff that may lack the possibility to invest time and resources
14
required to nurture the SHGs, are driven by government targets and/or focused on reaching
numbers rather than creating quality SHGs. An added challenge has been the SBLP
expansion to the slower growing states in the central and eastern parts of India. The reliance
on the relatively weak government promoted groups and the lack of NGOs at the grassroots
has led to a decline in the SHG quality, in these states. Thus, with SBLP as one of the core
women empowerment strategy in India, it becomes imperative to investigate the differential
in the process of women empowerment with respect to the regional location and the delivery
mechanisms.
In this paper we investigate the variation in the factors that lead to women empowerment
for the SBLP members in the south and other states. We also examine the empowerment of
SBLP members that are formed by NGOs and financed by banks. The analyses are based on
the SIAS data that contains in-depth information on observed indicators for women
empowerment from ten districts in five states in India. To extricate the selection bias, we
employ PSM. We then estimate the Structural Equation Model (SEM) for different
geographical regions (southern and other states) and linkages. The SEM model estimates the
impact of the SBLP to find whether it is the economic or the non-economic factors that lead
to the process of women empowerment. Results show that for the southern states, it is the
economic factor that is the strongest cause for empowerment. We also find that for the states
in the south, greater autonomy in decision-making leads to a decline in women
empowerment.
While there is evidence for significant direct impact of economic factors in women
empowerment, it is also clear that autonomy in decision-making may not always lead to
empowerment without women’s ownership of loan created property and assets. The
underlying covariance matrix reveals that the social attitudes and political participation also
play a crucial role. The impact of SBLP critically depends on the quality of SHGs and it is
important to identify how the SHGs are promoted. Creating and maintaining SHGs is a time-
consuming process that requires nurturing and as such is more suitable to the social-
development perspectives of NGOs. Banks on the other hand are more interested in ensuring
safety of their loans.
If women’s empowerment has to be pursued as a serious objective, the expansion of SBLP
to the other states has to remain focused on the effective economic empowerment of women
15
through livelihood creation. Greater emphasis also needs to be placed on training, education
and creating awareness about empowerment related issues with increased investment in
social intermediation. Otherwise, SBLP will result in positive outcomes but the process of
women’s empowerment will remain incomplete.
16

References
Anderson, S., and Eswaran, M. (2005) What determines female autonomy? Evidence from Bangladesh. Working paper, 101, Bureau for Research and Economic Analysis of Development. Armendáriz, B. and Morduch, J. (2010) The economics of microfinance. Cambridge, MA: MIT Press. Ashraf, N., Karlan, D. and Yin, W. (2006) Female empowerment: Impact of a commitment savings product in Philippines. Center discussion paper no. 949, Economic Growth Center, Yale University, New Haven. Bali Swain, R. (2007) Impacting women through microfinance. Dialogue, Appui au Developpement Autonome 37, pp. 61–82. Bali Swain, R. (2012a) The Microfinance Impact, Taylor and Francis Books: Routledge, London and New York, 2012. Bali Swain, R. (2012b) Differential impact of microfinance delivery mechanism on vulnerability, Applied Economics Letters, 19(8), pp. 721-724. Bali Swain, R. and Floro, M. (2012b) Reducing Vulnerability through Microfinance: Evidence from Indian Self Help Group Program, Journal of Development Studies, Vol. 48 (5), pp. 605-618. Bali Swain, R., and Varghese, A. (2009) Does Self Help Group Participation Lead to Asset Creation? World Development, 37(10), pp. 1674-1682. Bali Swain, R., and Varghese, A. (2010) Microfinance ‘Plus’: The impact of business training on Indian Self Help Groups. Working paper 2010:24, Department of Economics, Uppsala University. Bali Swain, R., and Varghese, A. (2013) Delivery Mechanisms and Impact of Microfinance Training in Indian Self Help Groups, Journal of International Development, 25(1), pp. 11-21. Bali Swain, R., and Wallentin, F.Y. (2009) Does microfinance empower women? Evidence from self-help groups in India. International Review of Applied Economics, 23(5), pp. 541–56. Bali Swain, R., and Wallentin, F.Y. (2012) Economic or Non-Economic Factors – What Empowers Women? International Review of Applied Economics, Vol. 26 (4), pp. 425-444. Banerjee, A., Duflo, E., Glennerster, R. and Kinnan, C. (2013) The Miracle of Microfinance? Evidence from a Randomized Evaluation, NBER Working Paper No. 18590. Bansal, H. (2003) SHG-bank linkage program in India: An overview. Journal of Microfinance, 5(1), pp. 21-49. Bardhan, K., and Klasen, S. (1999) UNDP’s gender-related indices: A critical review, World Development, 27, pp. 985–1010. Beteta, H.C. (2006) What is missing in measures of women’s empowerment? Journal of Human Development, 7(2), pp. 221–41. Biblarz, T.J., and Raftery, A.E. (1993) The Effects of Family Disruption on Social Mobility, American Sociological Review, Vol. 58, No. 1, pp. 97-109. Browning, M., and Chiappori, P.A. (1998) Efficient intra-household allocations, a general characterization and empirical tests, Econometrica, 66, pp. 1241–78. Chidambaram, P. (2004) Budget 2004–2005: Speech of P. Chidambaram, Union Minister of Finance, 8 July 2004, http://indiabudget.nic.in/ub2004-05/bs/speecha.htm (accessed 27 September 2013). Deshmukh-Ranadive, J. (2003) Placing gender equity in the family centre stage: Use of ‘Kala Jatha’ theatre, Economic and Political Weekly, 26 April 2003, pp. 1674-1679. Dijkstra, G. (2002) Revisiting UNDP’s GDI and GEM Towards an alternative, Social Indicators Research, 57(3), pp. 301–338.
17
Duflo, E. (2003) Grandmothers and granddaughters: Old age pension and intra-household allocation in South Africa, World Bank Economic Review, 17(1), pp. 1–25. EDA Rural Systems. (2006) Self Help Groups in India: A Study of Lights and Shades. Gurgaon, India: EDA Rural Systems. Garikipati, S. (2008) The Impact of Lending to Women on Household Vulnerability and Women’s Empowerment: Evidence from India, World Development, 36(12), pp. 2620-2642. Garikipati, S. (2012) Microcredit and Women’s Empowerment: Through the Lens of Time-Use Data from Rural India, Development and Change, 43(3), pp. 719-750. Ghate, P., S. Gunaranjan, V. Mahajan, P. Regy, F. Sinha, S. Sinha. (2007) Microfinance in India: A State of the Sector Report, Microfinance India, New Delhi. Goetz, A.M., and Gupta, R.S. (1996) Who takes the credit? Gender, power, and control over loan use in rural credit programs in Bangladesh, World Development, 24(1), pp.45-63. Guérin, I., Kumar, R.M., S. Venkatasubramanian and Sangare, M. (2009) Microfinance and the Dynamics of Financial Vulnerability: Lessons from rural South India. Rural Microfinance and Employment Project, Working Paper 2009-05, Université de Provence. Hashemi, S., Schuler, S., and Riley, A. (1996) Rural credit programs and women’s empowerment in Bangladesh, World Development, 24(4), pp. 635–53. Johnson, S. (2005) Gender relations, empowerment and microcredit: Moving on from a lost decade, The European Journal of Development Research, 17(2), pp. 224–48. Jöreskog, K.G. (2002) Structural equation modelling with ordinal variables using LISREL 8. Chicago: Scientific Software International. Jöreskog, K.G., and Sörbom, D. (1999) LISREL 8: Structural equation modeling with the SIMPLIS Command Language. Chicago, IL: Scientific Software International. Jöreskog, K.G., Sörbom, D., Toit, S. Du, and Toit, M. Do. (2001) LISREL 8: new statistical features (3rd printing with revisions). Lincolnwood, IL: Scientific Software International. Kabeer, N. (1999) Resources, agency, achievements reflections on the measurement of women’s empowerment, Development and Change, 30(3), pp. 435-464. Kabeer, N. (2005) Is microfinance a ‘magic bullet’ for women’s empowerment? Analysis of findings from South Asia, Economic and Political Weekly, 29 October 2005, pp. 4709-4718. Kumar, P. and Golait, R. (2009) Bank Penetration and SHG-Bank Linkage Programme: A Critique, Reserve Bank of India Occasional Papers, 29(3), pp. 119-138. Mahajan, V. and Gupta, B.R. (2003) Microfinance in India: Banyan Tree and Bonsai, Review Paper for World Bank, No. 64966. Malhotra, A., and Mather, M. (1997) Do schooling and work empower women in developing countries? Gender and domestic decisions in Sri Lanka. Sociological Forum, 12(4), pp. 599–630. Malhotra, A. and Schuler, S.R. (2005) Womens empowerment as a variable in international development in D. Narayan (Ed.) Measuring Empowerment: Cross-Disciplinary Perspectives (Washington, DC: The World Bank), pp. 219-246. Mayoux, L. (1999) Questioning virtuous spirals. Micro-finance and women’s empowerment in Africa, Journal of International Development, 11(7), pp. 957–84. Meyer, R. L., and Nagarajan, G. (2000) Rural financial markets in Asia: Paradigms, policies and performance, Oxford: Oxford University Press. Moghadam, V., and Senftova, L. (2005) Measuring women’s empowerment: participation and rights in civil, political, social, economic, and cultural domains, International Social Science Journal, 57(2), pp. 389–412. NABARD. (2006) Progress of SHG-Bank Linkage in India: 2005-06, Working Paper, NABARD. Nair, A. (2005) Sustainability of Microfinance Self Help Groups in India: Would Federating Help? World Bank Policy Research Working Paper No. 3516, World Bank, D.C.
18

NCAER. (2008). Impact and Sustainability of SHG Bank Linkage Programme, National Council of Applied Economic Research, New Delhi. Pitt, M., Khandker, S.R., and Cartwright, J. (2006) Empowering women with microfinance: Evidence from Bangladesh, Economic Development and Cultural Change, 54(4), pp. 791–831. Planning Commission. (2002) Tenth five-year plan 2002–2007. New Delhi: Government of India. Puhazhendi, V. (2000) Evaluation study of self help groups in Tamil Nadu. Mumbai: NABARD. Puhazhendi, V., and Badatya, K. C. (2002) SHG-bank linkage program for rural poor: An impact assessment, paper presented at the seminar on SHG-bank linkage program. New Delhi: NABARD. Puhazhendi, V., and Satyassi, K. J. S. (2000) Microcredit for rural people: An impact study. Mumbai: NABARD. Purushottaman, S. (1998) The empowerment of women in India: Grassroots women’s networks and the state. New Delhi: Sage Publications. Rahman, A. (1999) Micro-credit initiatives for equitable and sustainable development Who pays? World Development, 27(1), pp. 67–82. Reddy, A.A. and Malik, D. (2011) A Review of SHG-Bank Linkage Programme in India, Indian Journal of Industrial Economics and Development, 7(2), pp. 1-10. Scholtens, S., Rydell, A., and Wallentin, F.Y. (2013) ADHD symptoms, academic achievement, self-perception of academic competence and future orientation: A longitudinal study, Scandinavian Journal of Psychology, 54, pp. 205-212. Sinha, F., Tankha, A. et al. (2009) Microfinance self help groups in India: living up to their promise? Practical Action Publishing. Srinivasan, N. (2010) Microfinance in India: State of Sector Report, SAGE Publications India Pvt. Lmtd. Summer-Effler, E. (2002) The micro potential for social change: Emotion, consciousness, and social movement formation, Sociological Theory, 20(1), pp. 41–60. Tesoriero, F. (2005) Strengthening communities through women’s self help groups in South India, Community Development Journal, 41(3), pp. 321–33. Townsend, J. (1999) Power from within getting out of that house. In Women and power fighting patriarchies and poverty, eds. J. Townsend, E. Zapata, J. Rowlands, P. Alberti, and M. Mercado. London: Zed Books. Write, G. (2000) Microfinance Systems: Designing Quality Financial Services for the Poor. London: Zed Books and Dhaka: University Press Limited.
19
TABLES
TABLE 1
Descriptive statistics for SHG members
South
Mean (S.D.)
(1)
Other states
Mean (S.D.)
(2)
Linkage model 2
Mean (S.D.)
(3)
N 279 380 475
Average Age of Respondent 34 (8.4) 35.9 (8.3) 35 (8.4)
Proportion with some (in %)
Primary education 14.3 20.3 16.4
Secondary education 27.2 11.3 20.4
Post-Secondary education 4.3 2.6 3.4
Dependency ratio 0.6 (0.3) 0.7 (0.2) 0.7 (0.2)
Average number of workers in
the household
2.4 (1.2) 2.6 (1.3) 2.5 (1.2)
Average number of workers
engaged in primary activity
2.1 (1.2) 2.8 (1.4) 2.4 (1.3)
Mean size of owned land in
2003(in acres)
1.04 (2.5) 0.81 (1.41) 0.93 (2.12)
Total assets (in Rupees.) 111,156
(133,294)
110,318
(147,746)
104,492
(136,475)
Distance to Bank (kms.) 7.3 (6.9) 6.4 (4.3) 5.4 (4.0)
Distance to Health Care
(kms?)
3.6 (2.8) 3.6 (2.5) 3.6 (2.7)
Distance to Market 5.4 (4.0) 5.3(3.7) 5.2 (4.1)
Distance to Paved Road 3.1 (3.3) 2.3 (2) 2.8 (2.6)
Distance to Bus Stop 3.8 (3.6) 2.8 (2.3) 3.5 (3.1)
Lack of cash/food in 2000 (%) 43.7 43.7 43.2
20

TABLE 2
Description of observed indicators to measure latent variables for SHG members
(1)
Observed indicators
(2)
Questions asked to the SHG respondent
(3)
Coding
(Proportion)
1.Women Empowerment
Family Planning Decision As compared to July 2000, has your
involvement in the decision making of on
family planning increased?
1.Yes (0.24)
0. No (0.76)
Buying & selling of property As compared to July 2000, has your
involvement in the decision making on buying
and selling of property increased?
1. Yes (0.18)
0. No (0.82)
Sending daughter to school As compared to July 2000, has your
involvement in the decision making on sending
your daughter to school increased?
1.Yes (0.30)
0. No (0.70)
Children’s marriage decision As compared to July 2000, has your
involvement in the decision making of your
children’s marriage increased?
1.Yes (0.14)
0.No (0.86)
Use of birth control Have you used birth control? 1.Yes (0.31)
0. No (0.69)
2. Economic
Primary activity Primary activity of the
respondent in 2003
1.Don’t work (0.13)
2.Farm activity (0.33)
3.Self-employment in non-farm
activity (0.08)
4.Agri. wage labourer (0.26)
5.Non-farm employment(0.06)
6.Others (0.09)
7. No response (0.04)
Investment to improve home Has the respondent made any repairs,
improvements or additions in their home that
cost more than Rs 5000?
1.Yes (0.17)
2.No (0.32)
3.Don’t know
(0.51)
Confidence to meet financial
crisis
Are you more confident of meeting financial
crisis in the family after joining the group?
1.Yes (0.88)
0.No (0.12)
21
Arranging credit and other
input
Are you able to arrange the credit and other
inputs in time?
1.Yes (0.62)
0. No (0.38)
Know about reservation Do/did you know that women have
reservations in panchayats and jobs?
1.Yes (0.57)
0.No (0.43)
Involvement in village
politics
Do/did you get involved in village
level politics?
1.Yes (0.38)
0.No (0.62)
Verbal abuse What would you do in the
following situation in your
family – verbal abuse?
1.submit yourself (0.37)
2.Do nothing (0.18)
3.Resist (0.20)
4.Give warning (0.02)
3. Autonomy
Purchase of raw material Do you take crucial decisions in purchase of
raw materials, pricing of the product of your
activity?
1.Yes (0.60)
0.No (0.40)
Plan work Do you plan your (work related) activities and
get things done by others?
1.Yes (0.49)
0. No (0.51)
Reaction to emotional abuse
What would you do in the
following situation in your
family – psychological and
emotional abuse?
1.submit yourself (0.24)
2.Do nothing (0.07)
3.Resist (0.13)
4.Give warning (0.04)
5.Complain to relatives (0.11)
6.Lodge complaint with SHG or
take their help (0.41)
Observed indicators (1) Questions asked to the SHG respondent (2) Coding/ (prop.)
(3)
4. Network, communication, awareness and political participation
Officials you have met How many officials (from bank,
government etc.) have you met and
spoken to?
mean (standard deviation)
1.22 (1.5)
Communication How does the respondent
communicate in the meetings?
1.Talks freely (0.41)
2.Sometimes talks
(0.32)
3.Hesitates to talk and
hence does not talk (0.05)
4.Talks if asked (0.22)
22
5.Complain to relatives (0.06)
6.Lodge complaint with SHG or
take their help (0.17)
Change in family violence Is there any change in the
family violence since July
2000?
1.Increased (0.64)
3.No Change (0.10)
2.Decreased (0.21)
4.Never had any family violence
(0.05)
5. Social Attitude
Treatment by spouse As compared to July 2000 how is the
treatment of your spouse towards
you?
1.Less respectful (0.52)
2.Usual (0.46)
3.More respectful (0.02)
Reaction to physical abuse What would you do in the
following situation in your
family – beating /physical
violence?
1.submit yourself (0.24)
2.Do nothing (0.09)
3.Resist (0.17)
4.Give warning (0.03)
5.Complain to relatives (0.09)
6.Lodge complaint with SHG or
take their help (0.38)
Reaction to emotional abuse Refer above
Involvement in family
decisions
As compared to July 2000, has your
involvement in the all decisions of
the family increased?
1.Yes (0.43)
0.No (0.57)
Increase in self confidence As compared to July 2000, has your
self confidence
1.Increased (0.90)
2.Decreased (0.03)
3.Same as before (0.07)
Verbal abuse Refer above
6.Education
Education level Education
level in 2003
1.Cannot read or write (0.24)
2. No schooling but can sign my name (0.04)
3. No schooling but can read a letter (0.01)
4. No schooling but can read and write a letter (0.12)
5.Primary (0.18)
6. Secondary (0.03)
7. College (0.29)
Source: SIAS survey.
23

TABLE 3
Estimated parameters of the women empowerment structural model for the SHG members
Latent Factors of women empowerment
South (1)
Other states (2)
Linkage model 2 (3)
Coefficients (standard errors)
Coefficients (standard errors)
Coefficients (standard errors)
Economic
0.70(0.32)***
0.74 (0.85)
0.50 (0.38)
Autonomy
-0.22(0.13)*
0.047 (0.05)
-0.095 (0.075)
Network, Communication and Political participation
-0.14 (0.13)
0.031(0.085)
-0.017(0.048)
Social Attitudes
-0.83 (0.51)
-1.16 (0.75)
-2 (2.34)
Education
0.044(0.04)
0.032 (0.027)
0.021(0.026)
Model Fit
Satorra-Bentler scaled Chi-Square
579.57
590.64
499.64
RMSEA
0.081
0.069
0.058
NFI
0.73
0.70
0.75
Sample size 279 380 475 Notes: ***, ** and * implies significant at the 1%, 5% and 10% level respectively
24

TABLE 4
Covariance matrix of independent variables and women empowerment
for the SHG members
Latent Factors of women empowerment
South Other states Linkage model 2
Coefficients (standard errors)
Coefficients (standard errors)
Coefficients (standard errors)
Economic
0.04(0.02)**
0 (0)
0 (0.01)
Autonomy
-0.06(0.02)***
0.04 (0.02)*
-0.01 (0.02)
Network, Communication and Political participation
-0.10 (0.04)***
0.04 (0.02)*
-0.01(0.02)
Social Attitudes
0 (0.01)
-0.01 (0.01)*
0 (0)
Education
-0.05 (0.04)
-0.01 (0.03)
-0.02 (0.03)
Notes: ***, ** and * implies significant at the 1%, 5% and 10% level respectively .
25
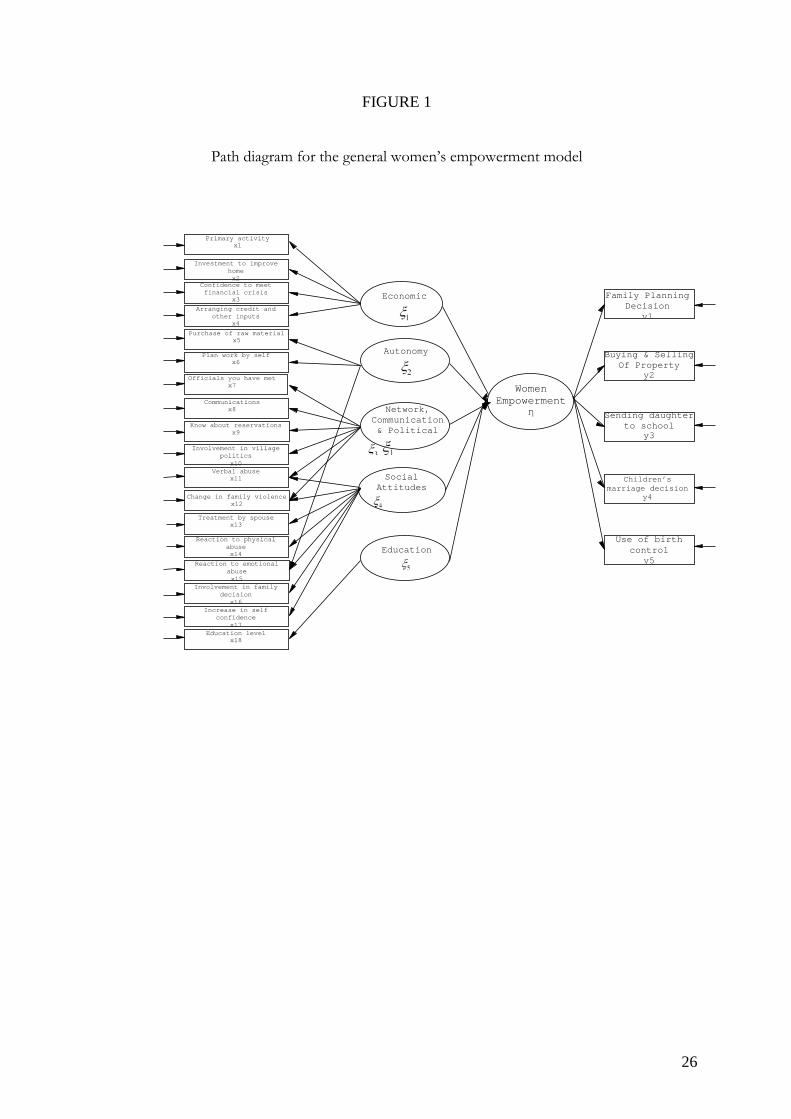
FIGURE 1
Path diagram for the general women’s empowerment model
Primary activity x1
Investment to improve home x2
Purchase of raw material x5
Confidence to meet financial crisis
x3 Arranging credit and
other inputs x4
Plan work by self x6
Officials you have met x7
Communications x8
Know about reservations x9
Involvement in village politics
x10 Verbal abuse
x11
Change in family violence x12
Treatment by spouse x13
Reaction to physical abuse x14
Reaction to emotional abuse x15
Involvement in family decision
x16 Increase in self
confidence x17
Education level x18
Economic
Autonomy
Network, Communication & Political
Social Attitudes
Education
Women Empowerment
η
Family Planning Decision
y1
Buying & Selling Of Property
y2
Sending daughter to school
y3
Children’s marriage decision
y4
Use of birth control
y5
26
APPENDIX
For an ordinal variable y with mi categories, the connection between the ordinal variable yi
and the underlying variable y* is the following for xi = C ( ) ( )1 , c= 1, 2, ... , m ,i i
c i c iyτ τ∗− < <
Where ( ) ( ) ( ) ( ) ( )0 1 2 1, ... , ,
i i
i i i i im mτ τ τ τ τ−= − ∝ < < < = + ∝ are threshold parameters. For variable yi
with mi categories, there are mi−1 strictly increasing threshold parameters _ ( ) ( ) ( )1 2 1, , ... , .
i
i i imτ τ τ − Because only ordinal information is available about yi, the distribution of
y* is determined only up to a monotonic transformation. It is convenient to set yi* have the
standard normal distribution.
27

i Source: Planning Commission (2002). Chidambaram (2004), India’s then Finance Minister recognised the SBLP as one of the most popular strategy for empowering women.
ii For example, if a woman offers greater resistance to any form of abuse from her husband or family, we consider her more empowered as she is trying to improve her well-being by asserting herself.
iii See Kabeer (2001) and Johnson (2005) for a discussion on microfinance and women empowerment in terms of viewing empowerment as outcomes for women associated with access to loans, or as processes of loan use. iv The following districts were selected why? for the survey: Medak and Warrangal from Andhra Pradesh; Koraput and Rayagada from Orissa; Gadchiroli and Chandrapur from Maharastra; Dharmapuri and Villupuram in Tamil Nadu; and Allahabad and Rae Bareli in Uttar Pradesh. For further details on the survey design, sampling and data, refer to Bali Swain (2012a). v The Andhra Pradesh government actively promoted SHGs. Members of the SHGs selected a person (Gram Deepika) who was appointed by the state government to maintain SHG records, coordinate with banks/government agencies and facilitate the SHGs. On average a Gram Deepika was responsible for 20 SHGs with part of their salary paid by the SHGs. The government rewarded them with priority status in state government schemes that involved a subsidy component. By 2003, with the formation of SHG federations and Mutually Aided Cooperative Societies (MACS), the scale of lending and saving had increased. The SHGs were usually engaged in activities like dairy, animal husbandry, vegetable cultivation and processing and marketing of spices. vi Some officials blamed this on the lack of an active interest by the state government (Bali Swain, 2012a). Much of SBLP activity in Uttar Pradesh was linked to the SGSY poverty alleviation programme that had a subsidy component and was facilitated by the government officials. During the time of the survey Maharashtra was ranked seventh in terms of its SBLP, by predominantly targeting rural women who had no previous link to the banks. vii In addition to the NGOs, SGSY relies on banks and government-owned District Development Agencies that are primary implementing agencies. Nair (2005) notes that such agencies lack the required administrative capacity to implement SBLP and make the situation much worse by increasing the pressure on the village and block level administrators to achieve targets on creation of SHGs. viii Alternative delivery mechanisms have been introduced since 2003. In January 2006, the Reserve Bank of India specified the inclusion of the Business Facilitator Model (BFM) and Business Correspondent Model (BCM) for providing intermediary services like identifying borrowers, promoting savings, processing and submission of loan and monitoring of repayment. The BFM also provide additional services like disbursal of small loans, recovery of principal, collection of interest, sale of micro insurance and mutual fund products. The BFM include NGOs, cooperatives, post offices, insurance agents and community-based organisations. The BCM include NGOs and Microfinance Institutions (MFIs) that are registered under the Trusts Act, not-for-profit companies (Section 25 companies in India) and post offices. A fee may be charged to the bank for these services (Allen et al., 2007). ix By 2007 the share of SHGs linked by NGOs dropped to less than one-third with nearly half of them being promoted by the government (Allen et al., 2007). x This has been discussed earlier in the paper, but for a literature survey and discussion on this refer to Bali Swain (2007) and Bali Swain and Wallentin (2009; 2012). xi Bali Swain and Wallentin (2009) used the SIAS data, to find that women are empowered by SBLP as compared to the control group. Our control group is just two observations short of this control group, but dividing it into further sub-sample (regionally or linkage model types) reduces the sample further making SEM estimations difficult.
28
WORKING PAPERS* Editor: Nils Gottfries 2012:18 Gunnar Du Rietz, Magnus Henrekson and Daniel Waldenström, The Swedish
Inheritance and Gift Taxation, 1885–2004. 47pp. 2012:19 Helge Bennmarker, Erik Grönqvist and Björn Öckert, Effects of contracting
out employment services: Evidence from a randomized experiment. 55 pp. 2012:20 Pedro Carneiro and Rita Ginja, Partial Insurance and Investments in
Children. 32pp. 2013:1 Jan Pettersson and Johan Wikström, Peeing out of poverty? Human fertilizer
and the productivity of farming households. 43 pp. 2013:2 Olof Åslund and Mattias Engdahl, The value of earning for learning:
Performance bonuses in immigrant language training. 52 pp. 2013:3 Michihito Ando, Estimating the effects of nuclear power facilities on local
income levels: A quasi-experimental approach. 44 pp. 2013:4 Matz Dahlberg, Karin Edmak and Heléne Lundqvist, Ethnic Diversity and
Preferences for Redistribution: Reply. 23 pp. 2013:5 Ali Sina Önder and Marko Terviö, Is Economics a House Divided? Analysis
of Citation Networks. 20 pp. 2013:6 Per Engström and Eskil Forsell, Demand effects of consumers' stated and
revealed preferences. 27 pp. 2013:7 Che-Yuan Liang, Optimal Inequality behind the Veil of Ignorance. 26 pp. 2013:8 Pia Fromlet, Monetary Policy Under Discretion Or Commitment? -An
Empirical Study. 57 pp. 2013:9 Olof Åslund and Mattias Engdahl, Open borders, transport links and local
labor markets. 41 pp. 2013:10 Mohammad Sepahvand, Roujman Shahbazian and Ranjula Bali Swain, Time
Investment by Parents in Cognitive and Non-cognitive Childcare Activities. 31 pp.
2013:11 Miia Bask and Mikael Bask, Social Influence and the Matthew Mechanism:
The Case of an Artificial Cultural Market. 13 pp 2013:12 Alex Solis, Credit access and college enrollment. 54 pp 2013:13 Alex Solis, Does Higher Education Cause Political Participation?: Evidence
From a Regression Discontinuity Design. 48 pp.
* A list of papers in this series from earlier years will be sent on request by the department.

2013:14 Jonas Kolsrud, Precaution and Risk Aversion: Decomposing the Effect of
Unemployment Benefits on Saving. 37 pp. 2013:15 Helena Svaleryd, Self-employment and the local business cycle. 28 pp. 2013:16 Tobias Lindhe and Jan Södersten, Distortive Effects of Dividend Taxation.
22 pp. 2013:17 Jonas Poulsen, After Apartheid: The Effects of ANC Power. 42 pp. 2013:18 Magnus Gustavsson, Permanent versus Transitory Wage Differentials and
the Inequality-Hours Hypothesis. 11 pp. 2013:19 Lovisa Persson, Consumption smoothing in a balanced budget regim. 35 pp. 2013:20 Linuz Aggeborn, Voter Turnout and the Size of Government. 50 pp. 2013:21 Niklas Bengtsson, Stefan Peterson and Fredrik Sävje, Revisiting the
Educational Effects of Fetal Iodine Deficiency. 48 pp 2013:22 Michihito Ando, How Much Should We Trust Regression-Kink-Design
Estimates? 69 pp. 2013:23 Bertil Holmlund, What do labor market institutions do? 25 pp. 2014:1 Oscar Erixson and Henry Ohlsson, Estate division: Equal sharing as choice,
social norm, and legal requirement. 45 pp. 2014:2 Eva Mörk, Anna Sjögren and Helena Svaleryd, Parental unemployment and
child health. 35 pp. 2014:3 Pedro Carneiro, Emanuela Galasso and Rita Ginja, Tackling Social
Exclusion: Evidence from Chile. 87 pp. 2014:4 Mikael Elinder och Lovisa Persson, Property taxation, bounded rationality
and housing prices. 38 pp. 2014:5 Daniel Waldenström, Swedish stock and bond returns, 1856–2012. 51 pp. 2014:6 Mikael Carlsson, Selection Effects in Producer-Price Setting. 34 pp. 2014:7 Ranjula Bali Swain and Fan Yang Wallentin, The impact of microfinance on
factors empowering women: Differences in regional and delivery mechanisms in India’s SHG programme. 28 pp.
See also working papers published by the Office of Labour Market Policy Evaluation http://www.ifau.se/ ISSN 1653-6975