department of natural resourcesdnr.wi.gov/files/pdf/pubs/ss/ss0537.pdfdepartment of natural...
TRANSCRIPT

DEPARTMENT OF NATURAL RESOURCES
E Dec. 1985
ABSTRACT
A FOllOW-UP ASSESSMENT OF REMOVING WOODY STREAMBANK VEGETATION AlONG TWO WISCONSIN TROUT STREAMS
By Robert L Hunt
IN 1981, research was resumed for 3 years on 2 Class I trout streams in central Wisconsin to continue evaluation of a trout habitat improvement technique that lacked adequate field testing. The technique involved removal of most of the woody vegetation along each stream bank paralleling designated treatment zones (TZ). It was hypothesized that reduction of such shade canopy would allow development of more stable grass-dominated stream bank5 and stimulate growth of more aquatic vegetation. These changes, in turn, would eventually produce a narrower, deeper stream channel with greater trout carrying capacity, a capacity reflected by the presence of higher standing stocks of trout.
Results and management implications from a previous 7-8 year investigation (1970-77) of this technique on these streams were confounded by uncontrollable natural declines in annual stream flow during most of the post-treatment assessment. The evaluation was therefore resumed in 1981 after discharge regimes had returned to more normal conditions.
Within the TZ established on the Little Plover River, success was achieved in producing physically improved habitat for trout in comparison to both pretreatment conditions in this zone and in comparison to concomitant conditions in an adjacent unaltered reference zone (RZ). However, abundance and biomass of brook trout (Salvelinus fontinalis) in the TZ did not improve in comparison to corresponding values for the standing stock in the RZ. Standing stocks in both zon~s recovered during 1981-83 from the severe declines documented during the 1974-77 drought period, but the paralleling recoveries in both zo~es appeared to be responses to improved stream flow regimes only.
Physical quality of trout habitat in the TZ on Lunch Creek also improved as a result of the reduction in stream bank shade canopy. Abundance of legal-sized trout <over 6 inches) and quality-sized trout Cover 10 inches) also increased significantly in this TZ during 1981-83 in comparison to abundance of such brown trout <Salmo trutta) present during the pretreatment phase in this zone and in comparison to concurrent abundance in the adjacent RZ. In this stream, the standing stock of trout in the TZ appeared to benefit, as hypothesized, from both naturally enhanced stream flow during 1981-83 and from the induced improvements in trout habitat quality.
Department of Natural Resources "' Madison, Wisconsin

No causes were identified to definitely explain the failure of brook trout stocks in the TZ on the Little Plover River to improve in abundance and biomass despite physically improved habitat. Unfavorable summer water temperatures or increased angler harvest were not likely causes. It is suspected, but unfounded, that age 0 recruitment from the main spawning area upstream from the TZ may have declined since the mid-l970s from what it normally was prior to that time.
In the TZ on Lunch Creek, recruitment of age 0 brown trout remained largely dependent on normal downstream movement from the main spawning area, but recruitment also increased during the post-treatment period as a result of increased natural reproduction in the TZ.
INTRODUCTION •
METHODS
CONTENTS
FINDINGS AND DISCUSSION.
SUMfYIARY
Little Plover River • Lunch Creek • • • •
MANAGEt4ENT IMPLICATIONS.
APPENDIX •
LITERATURE CITED •
Meet the Author
Page
3
4
7 7
11
17
18
19
22
Robert L. Hunt is a Trout Research Biologist with the Department of Natural Resources and Leader of the Cold Water Research Group in the Bureau of Research. His mailing address is Route 1, Box 589, Waupaca, WI 54981.
2

INTRODUCTION
During 1970-77, a research project was carried out on portions of 3 Class I* trout streams in Wisconsin to evaluate the hypothesis that deliberate removal of most of the woody vegetation shading the stream channels would gradually produce changes in the physical characteristics of those channels that would enhance trout carrying capacity. It was also hypothesized that growth rates of trout would improve in response to an anticipated increase in the aquatic invertebrate food supply for trout and that angler use and harvest would increase in response to easier fishing conditions and the presence of more and faster-growing trout <Hunt 1979). That pioneering assessment of stream bank brush removal in Wisconsin was carried out by collecting physical and biological data from a Reference Zone <RZ) and Treatment Zone <TZ> on each of the 3 streams for 3-4 years before and 3-4 years after intensive removal of woody vegetation in the TZs only <Hunt 1979). Woody vegetation, primarily speckled alder <Alnus rugosa>, w~s cut at ground level along 30-foot-wide strips on both banks. Cut vegetation was piled along the strip edges distal from the stream. Regrowth of cut vegetation was retarded by spraying cut stum~s with a herbicide. ·
On one of the study streams, Spring Creek, located in Chippewa County, quality of the trout habitat in the TZ did improve after debrushing, and significant improvements were also documented in the abundance and growth rates of brook· trout <Salvelinus fontinalis) in this zone in comparison to concomitant changes in the standing stock of brook trout in the RZ.
In the other two study streams, Little Plover River in Portage County and Lunch Creek in Waushara County, growth rates of brook-trout in the former and brown trout <Salmo trutta> in the latter improved in the TZs, but abundance and biomass of trout did not. Most of the measured physical characteristics of the TZs also failed to change in ways that would tend to enhance trout carrying capacity. Triggered by an increase in solar radiation following reduction of shade canopy, aquatic macrophytes flourished in the TZs of ·the Little Plover River and Spring Creek, but for reasons unknown, there was little change in the abundance of rooted aquatic plants in Lunch Creek.
With the exception of the first post-treatment summer, water tempeiature regimes through the TZs. were not altered much by the removal of shade canopy. There was a 5 F increase in water temperature the first summer from the upper to the lower end of the 0.45-mile TZ on the Little Plover River but during subsequent years, inflations of 1-2 F in maximum summer temperatures were more typical for this stream and for all summer temperature regimes for the other two streams during post-treatment periods.
The environmental variable that changed most dramatically during post-treatment periods of assessment was stream discharge, a variable that changed independently of the debrushing perturbation being assess~d. The 1974-77 period, constituting nearly all of the post-treatment phase, was characterized by a steadily decreasing pattern of mean annual discharges, especially well documented for the Little Plover River where continuous
*Class I streams are considered to have enough natural reproduction to sustain populations of wild trout at or near carrying capacity. Streams or portions designated Class I are not stocked with domestic trout <Wis. Dep. Nat. Resour. 1980).
3

records of discharge were maintained, and typical of a statewide pattern of persistent drought during this 4-year period.
These unanticipated and uncontrollable declines in stream flow regimes may have directly or indirectly limited improvements hypothesized in trout habitat quality and standing stocks. Therefore, a major conclusion of the study was that additional evaluations of this experimental management technique should be conducted and ideally during periods of more stable discharge. The 3 original streams selected to test this technique were logical candidates for additional .investigation.,
After 3 years of recovery from the 1974-77 drought and return to more normal discharge patterns <Fig. 1:), post-treatment evaluation ·was resumed in 1981 on the Little, Plover River and Lunch Creek. Long-term fo1lowup on Spring Creek was cancelled because several beaver dams had been constructed in the study zones during 1978~80 . .These dams and associated activity by beavers substantialJy altered the character of both study zones. ·
The remai11der of this. report deals with physical and biological data gathered·· during 1981-83 at the Little Plover River and Lunch Creek, and relationships of these data to comparable findings obtained during the previous study period on e,ac:h stream. Methodologies employed during 198l-83 closely paralleled those u-sed in the 1-970-:-77 investigation <Hunt 1979), and boundaries of·the RZs and rzs were ~ot altered.
Because of the confounding impacts of natural variations in an·nual stream flow on other aspects of the study, the 1981-83 phase is viewed as a separate post-treatment period, not a simpl~ continuation of the initial post-treatment ph as~ termi nate.d _in 1977.
Two prJma·ry objectives are addressed for each stream:
(1) Continued evaluation of the technique of removing woody stream bank vegetation along heavily shaded trout streams as a method to improve trout stream habitat and trout populations.
(2) Continued analysis of relationships between stream flow and biomass of trout present. based on additJons of data· sets from 1981-83 to augment those collected during 1970-77 from the study zones of the Little Plover Ri~er. ·
METHODS
Determinations of midchannel length, mean width, mean depth, surface area, and channel volume of the study zones on the Little Plover River and Lunch Creek were carried out in the_ summe~ and fall of 1983. Methods employed were
'similar to those reported previously <Hunt 1979). Additional characteristics of the study zones on Lunch Creek were measured in September 1983 that-wefe not quantified earlier --substrate composition, abundance of· rooted aquatic vegetation, and the amount of permanent underbank hiding/resting cover for trout.
Substrate types were classified as sand, silt, gravel, peat, or cobble. Proportions of each·in the study zones on Lunch Creek were determined by
4

Ul 16 LL. (.)
LLI (.!) 0:: <{ 14 I (.) (f)
0 ...J <{ :::::> 12 z z <{
z <{ w :2: 10
1961 62 63 64 65 66 67 68 69 70 71 72 73 74 75 76 77 78 79 80 81 82 83
FIGURE 1. Mean annual discharge of the Little Plover River at the USGS gaging, station near the Hoover Avenue bridge ·during the 23-year 1961-83 period.
frequency of occurrence. Water depths were recorded at 1-ft intervals across the wetted stream channel at 100-ft intervals along a midchannel transect. At each point where a water depth was measured, the kind of substrate encountered was also recorded. All of these point identifications provided the composite sample of substrate types per zone. If, for example, sand substrate constituted 50% of these point samples, it was assumed that sand also constituted 50% of the total substrate area in that zone.
Ab~ndance of aquatic macrophytes in the study zones of Lunch Creek was determined by the same procedures used on the Little Plover River in 1970 and 1983. Field sketches were made of each bed of aquatic plants and generic composition was noted. Field maps were later planimetered to determine areas (ftz).
Underbank hiding cover for trout was quantified by conducting continuous measurements along the length of each stream bank to detect portions that provided at least 6 inches of overhang having at least 6 inches of water
5

beneath it. A simple home-made wooden rod and attached crosspiece was used that provided simultaneous measurements of overhang and water depth. Linear distances of such bank edge were measured to the nearest 0. l ft with a cloth tape.
Discharge of the Little Plover River was monitored at a point about 2.4 miles downstream from the closest boundary of a study zone, at a site where a continuous recorder is housed in a gaging station maintained by the U.S. Geological Survey <USGS) since July 1959. Summary data citing mean monthly and annual discharges at this ~ite were obtained from reports on water resources data for Wisconsin published annually by the USGS from 1961 through 1983. Estimated monthly and annual mean discharges at the lower boundary of the TZ were derived by applying a 69% correction factor to the appropriate published means at the USGS site .. The correction factor represented the average difference in discharge at these two poi~ts during several years when USGS gaging stations were operated at both sites. <The station at the TZ boundary was discontinued in September 1975.)
On Lunch Creek, discharge was measured with a Gurley pygmy current meter at the boundaries of the study_zones in September 1983. Discharge was measured ~t 1-ft ihtervals across channel transects and summed to obtain total "instantaneous" flow in cfs.
W~ter te~peratures (F) during 1981-83 were measured at the boundaries of the Tls. on.both streams with Taylor maximum-minimum\thermometers during May-September periods. Maximum and minimum temperatures were recorded at weekly or biweekly intervals.
Trout populations in the study zones during 1981-83 were sampled with direct current electrofishing gear using field procedures routinely employed by the Cold Water Research Group to conduct mark-recapture estimates. Processing of field data, including statistical analysis, was also repetitive <Hunt 1979, Avery an~ Hunt 1983).
. - . ~
Electrofishing gear consisted of a small stream shocker boat equipped with a 220~vol·t DC g~nerator, three positive electrodes, and a negative electrode of sheet metal which also protected the bottom of the boat from abrasion. Electrofishing always proceeded upstream through the study zones. Trout collected on the "marking run" were anestheti.zed, measured to the nearest 0.1 inch; and weighed. Trout less than SrO inches were weighed several at a ti~e to reduce field sampling error. Those over 5.0 inches were weighed individually to the nearest gram. Age I or older trout collected on the mar;king run were examined for known-age year class marks (permanent fin clips) and given a temporary capture mark (bottom lobe of caudal fin). Age 0 trout collected on.the marking run were given a permanent year class mark which also served as the temporary capture mark. After all trout iri a collection had been examined and marked, they were transported downstream to the beginning of the collection point and released.
During· the "recapture run" <usually a day or two later) through each study zon?, trout were measured by ihch group and tallied as recaptures or first-time captures. Tallies were also distributed according to permanent marks designating ages. Age 0 trout captured for the first time were permanently marked to designate their year class.
6

Population estimates were made by inch group using the Bailey modification of the Petersen mark and recapture formula. The electrofishing gear was size-selective. Efficiency increased until fish size was approximately 10 inches. Changes in gear efficiency were compensated for by estimating numbers of trout within the relatively small intervals of inch groups.
Biomass per inch group was derived from the product of average weight per inch group and estimated abundance. Whenever possible, average weights were based on samples of at least 50 indlvidual weights per inch group.
No creel census data were collected during 1981-83, and no additional data were obtained to characterize water chemistry.
FINDINGS AND DISCUSSION
Little Plover River. When the initial post-treatment evaluation ended in 1977, mean annual discharge of the little Plover River had declined to a record-tying value of 6.8 cfs, a value 44% below the 23-year annual mean discharge of 10.3 cfs (1961-83). That year also represented the third successive year of below-normal discharge <Fig. 1). During the subsequent 3-year period, mean annual discharges returned to more normal values, varying by -17%, +5%, and -5%, respectively, from the 23-year mean. Annual discharge remained below normal in 1981 and 1982, by -12% and -9%, respectively, followed by a year of above-average discharge 14% greater than the long-term average the last year of the study. The entire 6-year· period following descent to the record low discharge in 1977 could, therefore, be characterized as a period when stream flow was generally below normal but fairly stable from year to year and much better than that prevailing in 1977.
When post-treatment inventories of brook trout in the study zones of the Little Plover River were resumed in 1981, after a 3-year hiatus, considerably improved standing stocks were found in comparisoR to those present in 1977. During the next 2 years, standing stocks in both study zones continued to show evidence of recovery from the 1974-77 drought, re.covery espec i a 11 y prominent in the quality of the stocks inventoried in September.
Legal-sized trout in the TZ numbered only 67/mile in September 1977. Subsequent dens~ties in September of 1981-83 reflected increases of 196%, 193%, and 1,015% in comparison to the record low density in 1977 <Fig. 2). Relative abundance of brook trout of all sizes and total biomass in the TZ followed similar September to September trends <Append. Table 1). The RZ held 188 brook trout/mile of legal size in September 1977, a record low for this study zone too. When population inventories were resumed during 1981-83, abundance of legal-sized trout in September had increased to levels 77%, 94%, and 307% greater than that observed in 1977. During all 4 of these years, however, the RZ always sustained more legal-sized trout/mile than did the TZ in September.
This tendency for the RZ, not the TZ, to support more trout of primary interest to anglers prevailed through most of the post-treatment period of record, not just the last 3 years. The RZ, not the TZ, also tended to hold more trout of all sizes and greater biomass in both April and September throughout the post-treatment phas~ except 1973, the first post-treatment year. All 12 of the! statistics characterizing the magnitude of differences
7

14
f5 12 al ::;;: w h: w (f) 10 ~ (f)
w I u ~ lD 8 II
w _j
::;;:
~ 6 ::::l 0 0:: 1-::.:: 0
~ 4 al LL 0
"' -8 2 '
/
- ...... ..._ I /
'-d .
/ /
/ /
/ I
/
DEBRUSHING (APRIL 1973)
' ' ', ',
' ' ', 'q
' \ \
' \ \ \
\ \
\ \
11-------e> TREATMENT
o----o REFERENCE
\ \
~ ' \
' \ ' ' ' ' ' \
' 0
0~--~--~--~~+-· --~--~--~--~ 1970 71 72 73 74 75 76 77 81 82
FIGURE 2. Number of brook trout/mile over 6 inches long in September in the Reference and Treatment Zones of the Little Plover River before (1970-72) and after (1973-83) removal of woody stream bank vegetation in the Treatment Zone. No observations were made during the 3-year 1978-80 period.
between quantified parameters of the standing stocks in the two study zones proved to be negative and 7 of the 12 were significant at the 10% level <Append. Table 1). Such negative values refute the hypothesis that standing stocks of trout would improve in quality and quantity in the TZ after removal of woody stream bank vegetation.
83
Although this long-term experiment failed to validate benefits from the specific habitat management technique applied in the TZ of the Little Plover River, documentation of improved standing stocks coincident with recovery of more normal stream flow regimes constitutes a fortuitous outcome having substantial utilitarian value. Three more sets of discharge and biomass data from 1981-83 strengthened the cause-effect ecological relationships reported previously for this Class I stream CHunt 1979, Figs. 24-26). Biomass of brook trout present in the fall was positively correlated with both annual discharge and summer period discharge CTable 1).
The same kinds of strong positive correlations were also documented for the unaltered RZ of the Little Plover River (Table 1). As White et al. Cl976) emphasized, maintenance of natural baseflow of midwestern trout streams, or
8

better yet, enhancement where possible, is one of the best management procedures from which many ecological benefits emanate to bolster trout carrying capacity. These benefits include increased living space, especially pool space and pool depth, improved water temperature regimes, increased stream edge and underbank hiding/resting/security cover, and increased scouring of stream substrate with the potential to expose more gravel substrate usable for both spawning sites and greater production of fish-food organisms.
Failure of brook trout in the TZ to show a greater response during 1981-83 than that occurring simultaneously in the RZ is particularly puzzling in view of differences documented in channel morphometry of these study zones <Table 2). The TZ appeared to provide much better trout habitat in August 1983 than it did in June 1970 and better trout habitat in 1983 than that present in the RZ on the same date. Average depth, for example, was 60% greater in the TZ in 1983 than it had been in 1970 and the stream's mean depth of 0.91 ft in 1983 was 40% better than that of the RZ. The TZ in 1983 also had 18% greater volume of water, nearly 500% greater abundance of aquatic plants, and a summer water temperature very similar to that of the RZ <Table 3). Yet one month later when standing stocks of brook trout were censused, the RZ located upstream from the TZ held 36% more trout/mile and 18% greater biomass <Append. Table 1).
It seems reasonable to conclude, therefore, that deliberate removal of woody vegetation from the banks of the TZ triggered subsequent beneficial changes in the physical quality of this zone but some factor or combination of factors prevented full occupancy of the enhanced habitat. What these limiting factors are and whether their suppressive actions occur insid-e and/or outside the TZ · remain questions unlikely to be resolved by more refined analysis of present data or addition of more data of a similar nature.
TABLE 1. Correlations between discharge of the Little Plover River and the biomass of brook trout present in the study zones.
Zone, Correlation Factors, and Period
Treatment Zone Mean annual di s·charge vs. 1 b/mi 1 e in Sep
1970-77 1970-83
Mean Jun-Aug discharge vs. lb/mile in Sep
1970-77 1970-83
Reference Zone
Mean annual discharge vs. lb/mile in Sep
1970-77 1970-83
Mean Jun-Aug discharge vs. 1 b/mi 1 e in Sep
1970-77 1970-83
9
R Value £Value
0.944 0.0004 0.945 0.0001
0.9~1 0.0011 0.916 0.0001
0.835 0.839
0.844 0.815
0.0100 0.0012
0.0084 0.0023

·f·
TABLE 2. Characteristics of the Treatment and Reference' Zones on the Little Plover River and Lunch Cre~k before ~nd after removal of. woody vegetation in the Treatment Zones.
Midchannel Surface Mean Mean <:;hannel Aquatic Botio!ILJcliJHL_iZ_n Lhe_totaJ zone bottom) Study Study Study Length Area Depth Width Volume Macrophytes Stream Date Phase Zone (mile} (acre} ( ft} (ft- ( ft3} ( ft 2}""" Sand Silt Gravel Peat Cobble
L. Plover R. Jun 1970 Pretreatment Treatment 0.45 0.77 0.57 14.2 18,983 0" 68.6 25. 1 5.1 1.2 0.0 Reference 0.46 o. 77 0.55 . 13.7 18,446' 295" 73.2 22.5 3.1 0.4 0.8 - Aug 1983 Post-treatment Treatment 0.45 0.70 0.91 12.8 27,730 11,336 52.7 45.7 0.7 0.9 0.0 c::::t
Reference 0.46 0.83 0.65 14.8 23,434 1,948 59.9 36.6 2 .. 1 0.5 0.9
Lunch Cr. Sep 1971 Pretreatment Treatment 0.54 0.88 0.98 13.5 37,560 Reference 0.78 1.02 1.23 10.7 54,644
Sep 1983 Post-treatment Treatment 0.54 0.84 1.00 12.5 35,625 4,007 71.2 14.2 10.3 3.7 0.6 Reference 0.80 1.13 1.04 11.0 48,698 3,057 70.7 27.6 0.2 1.5 0.0
" Based on field surveys in 1972. "" Generic composition on file at Cold Water Research Group headquarters.
----~-~~-

TABLE 3. Maximum, minimum, and mean water temperatures (~F) at the boundaries of the Treatment Zone on the Little Plover River for the 5-month May-September periods of 1974-77 and 1981-83.
Maxim!,!m Minimum Me en Y~2r UJH!er LQw~r UpJ:!~r Lower !JpJ:!er Lgw~r
1974 74 77 40 40 54 56 1975 75 77 42 43 57 58 1976 76 78 38 39 58 60 1977 85 86 40 41 62 62
1981 72 73 40 40 59 60 1982 76 77 42 41 59 60 1983 73 74 40 42 58 59
Lack of natural reproduction within .or near the TZ or reduced recruitment of age 0 trout may be the most likely causes for failure of standing stocks in the TZ to respond to the improved habitat now present in this zone. ·some reproduction is known to occur annually in the upper portion of the RZ (J. Heaton and R. Hunt, unpubl. file data), but in this zone too recruitment is believed to be primarily from the stream's main spawning area located upstream from both study zones.
Differential angling mortality is another potential factor that could have depressed standing stocks in the TZ more than in the RZ which is more difficult to fish effectively because of its brush-lined stream banks. Quantitative measures of harvest were not made during 1981-83 but greatly increased harvest seemed unlikely based on subjective assessments of angler use.
Water temperature changes can also be ruled out as a factor preventing enhancement of the trout population in the TZ as compared to the RZ. Water temperature regimes during 1981-83, at least during the summer periods, were generally more comfortable for brook trout than those occurring dUring the summers of 1974-77 immediately following shade canopy removal <Table 3).
Lunch Creek. During the 1981-83 post-treatment period, stream discharge was measured only in September 1983. At all 3 observational points, baseflow discharge was much better than it had been in October 1977, approximately 22% greater at the upper boundary of the TZ, 25% greater at the TZ/RZ boundary, and 18% greater at the lower boundary, of the RZ <Table 4).
Presumably discharge for this stream during 1978-83 tended to follow the same year-to-year pattern as that known for the Little Plover River located 30 miles north in a similar aquifer--a pattern of fairly stable, below normal discharge except for 1983, but considerably better stream flow throughout the period than that occurring in 1977.
Ten years after removal of woody vegetation from its stream banks, the TZ appeared to provide better habitat for trout than it did prior to removal. Mean depth had increased, stream banks had encroached to narrow channel width by an average of 8%, some clumps of aquatic vegetation had taken hold, and the
11

amount of exposed gravel substrate probably increased from near zero to 3,768 ft 2 <Table 2)*. All of these chang~s should have enhanced trout carrying capacity. The magnitude of change in channel shape was not as dramatic as that observed in the TZ of the Little Plover River but the positive changes observed in the TZ of Lunch Creek take on added management implications when viewed in relation to some deterioration of habitat quality detected in the RZ from 1970 to 1983. This zone became slightly wider and shallower due to natural causes during this period.
Each spring and fall of study, four characteristics of the standing stocks of brown trout were quantified in both study zones--numberlmile, pounds/mile, number over 6 inches/mile <legal-sized), and number over 10 inches/mile (quality-sized). All 24 quantifications of these characteristics made during 1981-83 were greater than the matching values determined in 1977 <Append. Table 2). "More water-more trout" appeared to be a basic ecological principle at work in both study zones of Lunch Creek as it was in the Little Plover River.
' '
Nothing unusual was observed among the sets of temperature data accumulated at the boundaries of the TZ durtng May-September periods of 1981-83. Maximum summer temperatures at the low~r boundary were the same or a degree lower than at the upper boundary <Table 5). The tendency for stream temperatures to decJ~nJ from,the upper to the lower boundary of the 0.54-mile TZ also prevailed during previous years of monitoring, although prior to debrushing greater cooling was observed. A 5 F decline in the summer maximum was recorded in 1972 and a 3. F decline marked the 1973 summer. Paired mean summer temperatures were identical for the two recording sites during 1981-83 with means of 56 F at both boundaries characterizing the 1981 and 1983 summers and means of 55 F characterizing the summer of 1982.
In general brown trout in Lunch Creek experienced more favorable water temperature all years of the study than did brook trout in the Little Plover River.
Three-year trends in relative abundance and relative biomass were generally similar .in both study zones, except for abundance of trout over 10 inches in April. In the RZ the trend for this characteristic was downward, from 67/mile in 1981 to 44/mile in 1982 to 36/mile in 1983. In the TZ the 3-year trend was upward, from 69/mile to 83/mile to 89/mile (Append. Table 2). For this compQnent of the standing stock, something other than the common influence of stream discharge must have differentially altered year-to-year responses of the standing stocks in the two study zones. I propose that improved habitat quality in the TZ, due to the treatment applied in 1973, was the factor responsible for the difference in these two trends and for other improvements in the standing stocks in the TZ that exceeded corresponding changes in the standi.ng stocks present in the RZ.
Trends in relative abundance and biomass of trout of all s,zes did not differ .s i gn1 fi cantly between study zones from the pretreatment to post-treatment
*Aquatic vegetat1on and substrate types were not quantified during the pretreatment or initia] post"""treatment phases. However, based on my subjective ~ecollections made each spring and fall while conducting electrofishing inventories, rooted aquatic vegetation and gravel substrate were judged to be virtually absent in the TZ during the pretreatment phase.
12

TABLE 4. Instantaneous discharge at the boundaries of the Treatment and ~eference Zones of Lunch Creek.*
Discharge (cfs)"* Treatment Zone Treatment Zone Reference Zone
Date UQger Boundg,rll Ref. Zone BoundarJI Lower BQundarll
Oct 1976 8.0 8.4 8.2 Mar 1977 14.4 14.6 14.7 Aug 1977 8.5 9.0 8.7 Oct 1977 9.2 10.7 10.5 Sep 1983 11.2 13.4 12.4
* Measurements made at 1-ft cross-channel intervals with a Gurley pygmy current meter and summed.
•• Includes £Orrections in data published in Hunt (1979), Table 4, irr which data for columns 2 and 3 were accidentally reversed for observation~ mad~ in 1976-77.
TABLE- 5. Maximum, m1n1mum, and mean water temperatures (F) at the boundaries of the Treatment Zone on Lunch Creek for the 5-month May-September periods of 1972-73, 1974-77, ~nd l9Sl-83.
Maximum Minimum Studll Phase UQr,1er Lgwer Uf,1Qer Lower
Pretreatment 1972 74 69 45 44 1973 71 68 44 42
Post-treatment 1974 70 70 44 42 1975 72 70 45 42 1976 73 71 40 40 1977 73 72 46 41
1981 69 68 40 42 1982 68 68 49 - 49 1983 68 68 42 44
Mean UQQer Lower
60 57 59 56
59 56 60 56 59 57 61 58
56 56 55 55 56 56
phases of investigation. However, increases in relative abundance of legal-sized trout and relative abundance of quality~sized trout support the probability that trout habitat in the TZ was enhanced by removal of woody stream bank vegetation. These are the two basic goals of most management programs aimed at improving trout fisheries by improving trout habitat--production of more legal-sized trout and/or more quality-sized trout.
During the pretreatment phase, the TZ held an average of 179 more legal-sized trout/mile in April than did the RZ. This average difference increased to 307 for the 1981-83 post-treatment period. All 3 estimates of such trout in the TZ the last 3 years exceeded the 7 estimates made during 1971-77 by at least 9% and the maximum ~bu~dance observed in April 1983 was 59% greater than the pretreatment average and 103% greater than relative abundance of such trout in the RZ at the same time (Fig. 3).
13

Relative abundance of legal-sized trout present in the TZ in September, near the close of the fishing season, also peaked in 1983, and the 1981-83 period included the 3 highest September estimates made <Fig. 4). During the pretreatment period there was an average density of 26 more legal trout/mile in the RZ than in the TZ. This trend reversed dramatically during the last post-treatment period when the TZ held an average of 323 more legal trout/mile than did the RZ. These two average remainders differed significantly at the 1% probability level. Peak abundance of legal trout in September 1983 was 1 ,702/mile, a value 100% greater than the pretreatment average for this zone and 32% greater than the comparable abundance in the RZ in 1983.
Maximum abundance of trout over 10 inches observed in the TZ in April occurred in 1974, the first year of the post-treatment period (Ffg. 5). Peak abundance in the RZ also occurred then. In the next four years, abundance crashed in both zones, reaching observed lows in April 1977 of only 9/mile in the TZ and 6/mile in the RZ, declines of 90% in the TZ and 94% in the RZ from the peaks in 1974. When this parameter of the standing stocks was next assessed in April 1981, abundance had greatly improved in both study zones to densities of 69/mile in the TZ and 67/mile in the RZ. In the following two years, abundance continued to increase in the TZ but decreased in the RZ <as indicated previously). By April 1983, the TZ held 150% more quality-sized brown trout than the RZ contained on a common per-mile basis, and abundance in the TZ was nearly back to the record high level observed in April 1974.
Trends in relative abundance of brown trout over 10 inches in the study zones in September also reversed from the pretreatment period to the second
1000
:::! 0:
~ 800 ~ (/)
w :r: u z 600 <.0 A
w _j
~ j:::: 400 :::> 0 0: f--z ~ 200 0: en
/ /
/ /
0
1971
/ /
/
/
s::r/ /
72
--TREATMENT
o-----o REFERENCE
73 74 75 76 77 81 82
FIGURE 3. Number of brown trout/mi 1 e over 6 inches long in April in the Treatment and Reference Zones of Lunch Creek before (1971-73) and after (1974-83) removal of woody stream bank vegetation in the Treatment Zone. No observations were made during the 3-year 1978-80 period.
14
83

0:: I..Ll co ~ I..Ll 1-a.. I..Ll (f)
~ (f) I..Ll :::c u ~ <.!) A
LLJ _J
~ ...... 1-:::::> 0 0:: 1-z 3: 0 0::: co
post-treatment period <Fig. 6). The RZ held 56%, 276%, and 58% more trout/mile over 10 inches than were present in the TZ during the successive Septembers of 1971-73. During- the Septembers of 1981-83, however, the TZ held 46%, 28%, and 43% more trout_of this size than did the RZ. Average numerical differences between zones for these two periods were 79 more trout/mile in RZ than -in the TZ, followed by a switch to 23 more trout/mi 1 e in the TZ than in the RZ. <These 2 average remainders differed at the 2% probability level.)
The entire length of both study zones on Lunch Creek was patrolled in mid-November each year of the study <1971-77 and 1981-83). No spawning sites used by brown trout were ever observed in the RZ. In the TZ, 2 redds were found in 1981, 9 in 1982, and 21 in 1983. The 1983 c6unt probably represented more than 21 individual redds due to overlapping of spawning sites at 3 locations where concentrations of redds were noted.
2000
1750
>
1500
1250
1000
750
500
250
1971 72
.....:.....;.TREATMENT
o---~ REFERENCE
.... ..... .... ..... .........
'0... ' '
DEBRUSHING (NOV- DE:C,-1973) ..
73 74
' ' ' ' ' ' t),._
75
p I
I I
I I
I I
I I
I I
o... .... I
I ........ I ....... '-d
---
76 77 81 82 83
FIGURE 4. Number of brown trout/mile over 6 inches long in September in the Treatment and Reference Zones of Lunch Creek before (1971~73> and after (1974-83) removal ofwoody stream ba.nk vegetation in the Treatment Zone. No observations were made du!tng the 3~year 1978-80 period.
15
I
,_

120
_J 100 0::: 0... <! z (f) 80 w :r: (..)
~ 0
" 60 w I
I I
_J I I
~ I
' I 1-:::J 0 40 0:::
I I
I
d 1-z 5: 0 0::: OJ
20
1971
I I
I I
I I
72
DEBRUSHING (NOV-DEC 1973)
73 74
---TREATMENT
o----oR£FERENCE
75 76 77
0.. ' ' ' \
\
' ' ' 'o..,
81 82
FIGURE 5. Number of brown trout/mile 10 inches or larger in April in the Treatment and Reference Zones of Lunch Creek before (1971-73) and after (1974-83) removal of woody stream bank vegetation in the Treatment Zone. No observations were made during the 3-year 1978-80 period.
0::: w OJ ~. w 5: w (f)
~ (f) w :r: (..)
z 0
" w _J
~
;::: :::J 0 0::: 1-z 5: 0 0::: OJ
200
150
100
50
,--9 ~~~ I
/0---------D"~/ \ ---TREATMENT / I
/ \ o----o REFERENCE / I
' I ./1 \
/ I / I
d \
1971 72
DEB RUSHING (NOV- DEC 1973)
73 74
I I I I I I I I I I I I o... __ _
75
----o... --,
76 77 81 82
FIGURE 6. Number of brown trout/mile 10 inches or larger in September in the Treatment and Reference Zones of Lunch Creek before (1971-73) and after (1974-83) removal of woody stream bank vegetation in the Treatment Zone. No observations were made during the 3-year 1978-80 period.
16
....................... 'o
83
83

SUMMARY
The decision to resume assessment in 1981 of some of the consequences of removing woody stream bank vegetation proved to be a fruitful one. The 1981-8~ followup period provided- fishery research and management impli'cations that the original evaluation process during 1970-77 did no_t yield. The followup per1od also strengthened some of the -conclusions from the initial project period:
1. The strong ecological relationship between tro-ut c.arrying capacity of a given stream· and its flow regime wa·s aff-irmed.- Pos_itive correlations between flow volume and biomass derived from 197'0'--77 data were strengthened by additions of 1981-83 data from both the TZ and unaltered RZ. of the Litt1e Pl6ver River.
2. Removal of woody stream bank vegetation triggeredbeneficial changes in th~ physical characterist~cs of the TZs of both streams that should have enhanced trout carrying capacity. Both zones became·narrower and deeper. Aquatic vegetation flourished in the TZ of the Little Plover River and probably to a lesser degree in the TZ of Lunch Creek.
3. Exposed gravel substrate increased in the TZ of Lunch Creek and some spawning of brown trout was documented on these gravel substrate patches. No spawning was observed in this study zone during the pretreatment phase.
4. Despite improved stream flow and physically better .trout habitat in the TZ of the Little Plover River during the 1981-83 post-treatment phase, abundance and biomass of brook trout did not increase proportionately more than abundance and biomass in the unaltered RZ. Additional research will be necessary to determine the biotic and/or abiotic factors that regulate standing stocks in the stream as a whole and specifically in the TZ. A primary topic of additional re_search would be that of documenting the sources, magnitude, and timing of age-specific recruitment of trout to the TZ.
5. Standing stocks of brown trout in the TZ of Lunch Creek responded positively during 1981-83 to both improved stream flow and physically improved habitat produced by removal of woody stream bank vegetation. Increases in abundance of trout over 6 inches <legal size> and over 10 inches <quality size) were proportionately greater than those that occurred in the unaltered RZ.
· 6. Post-treatment impacts of increasing summer water temperatures via increased solar radiation were inconsequential after the first summer through the 800-yard TZ of the Little Plover River and of no management
. concern during any of the post-treatment period for the 950-yard TZ on Lunch Creek.
17

MANAGEMENT IMPLICATIONS
Based on results from this followup evaluation focused on the Little Plover River and Lunch Creek, plus published results from the evaluation at Spring Creek CHunt 1979), I conclude that deliberate removal of woody stream bank vegetation can be a useful technique to enhance trout carrying capacity of small heavily shaded trout streams in Wisconsin. <As pointed out previously, however, suitable summer water temperatures are a necessary prerequisite.) The-technique produced physically improved trout habitat in the TZs of all 3 streams and significant improvements in the standing stock of brown trout in Lunch Creek and brook trout in Spring Cree~. Failure of brook trout to respond positively in the TZ of the Little Plover River remains unexplained and a tantalizing challenge to resolve. That failure ihould not detract from continuing practical applications of stream bank debrushing or proceeding with additional testing of variations on this techniqu~. Such applications should continue to be viewed as experimental, and adequate provision made for design . and evaluation of these applications.
18
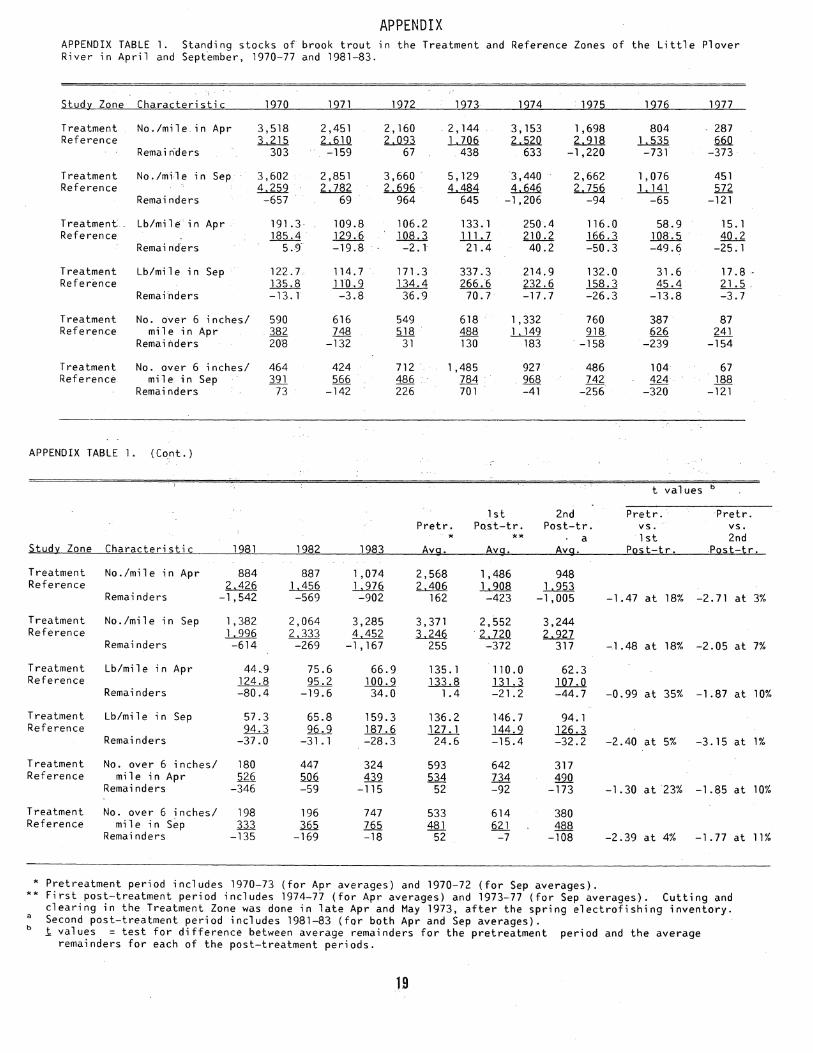
APPENDIX APPENDIX TABLE l. Standing stocks of brook trout in the Treatment and Reference Zones of the Little Plover River in April and September, 1970-77 and 1981-83.
Stud;t Zone Characteristic 1970 1971 1272 1973 1974 . 1975 1976 1977
Treatment No./mile.in Apr 3,518 2,451 2' 160 2,144 3,153 1,698 804 287 Reference 3.215 2.610 2.093 1 '706 ~ 2.918 1, 535 QQQ
Remai n·ders 303 -159 67 438 633 -1 ,220 -731 -373
Treatment No./mile in Sep 3,602 2,851 3,660 . 5,129 3,440 2,662 l '076 451 Reference 4.259 2,782 2.696 4,484 4,646 2.756 l...l1l ill
Remainders -657 69 964 645 -1 '206 -94 -65 -121
Treatment . Lb/milein Apr 191 . 3 109.8 106.2 133.1 250.4 116.0 58.9 15. 1 Reference 185.4 129.6 108.3 lll._l 210.2 166.3 108.5 40.2
Remainders 5.9: -19.£ -2.1 21.4 40.2 -50.3 -49.6 -25.1
Treatment Lb/mile in Sep 122.7 114.7 171.3 337.3 214.9 132.0 31.6 17.8 .. Reference 135.8 110.9 134.4 266.6 232.6 158.3 45.4 ~
Remainders -13.1 -3.8 36.9 70.7 -17.7 -26.3 -13.8 -3.7
Treatment No. over 6 inches/ 590 616 549 618 1 '332 760 387 87 Reference mile in Apr 382 748 ill 488 l..l12. 918. 626 241
Remainders 208 -132 31 130 183 -158 -239 -154
Treatment No. over 6 inches/ 464 424 712 1 ,485 927 486 104 67 Reference mile in Sep ill 566 486 784 2Q.a 742 424 188
Remainders 73 -142 226 701 -41 -256 -320 -121
APPENDIX TABLE l. (Cont.)
t values b
1st 2nd Pretr. · Pretr. Pretr. Po.st-tr. Post-tr. vs. vs.
* ** a 1st 2nd Stud;t Zone Characteristic 1981 1982 1983 Avg. Avg. Avg. Post-tr. Post-l;r.
Treatment No./mile in Apr 884 887 1 ,074 2,568 1 ,486 948 Reference 2,426 1,456 1, 976 2,406 1. 908 1, 953
Remainders -1,542 -569 -902 162 -423 -1,005 -1.47 at 18% -2.71 at 3%
Treatment No./mile in Sep 1 '382 2,064 3,285 3,371 2,552 3,244 Reference 1, 996 2.333 4.452 3,246 . 2. 720 2,927
Remainders -614 -269 -1 , 167 255 -372 317 -.1 .48 at 18% -2.05 at 7%
Treatment Lb/mi 1 e in Apr 44 .. 9 75.6 66.9 135. 1 110.0 62.3 Reference 124.8 95.2 100.9 133.8 131.3 107.0
Remainders -80.4 -19.6 34.0 1.4 -21.2 -44.7 -0,99 at 35% -1.87at
Treatment Lb/mile in Sep 57.3 65.8 159.3 136.2 146.7 94.1 Reference 94.3 96.9 187.6 127.1 144.9 126.3
Remainders -37.0 -31. 1 -28.3 24.6 -15.4 -32.2 -2.40 at 5% -3.15 at
Treatment No. over 6 inches/ 180 447 324 593 642 317 Reference mile in Apr ~ 506 439 534 734 49.0.
Remainders -346 -59 -115 52 -92 -173 -1.30 at 23% -1.85at
Treatment No. over 6 inches/ 198 196 747 533 614 380 Reference mi 1 e in Sep 333 365 765 481 ill 488
Remainders -135 -169 -18 52 -7 -108 -2.39 at 4% -1.77 at
*Pretreatment period includes 1970-73 (for Apr averages) and 1970-72 (for Sep averages). ** First post-treatment period includes 1974-77 (for Apr averages) and 1973-77 (for Sep averages). Cutting and
clearing in the Treatment Zone was done in late Apr and May 1973, after the spring electrofishing inventory. a Second post-treatment period includes 1981-83 (for both Apr and Sep averages). b 1 values = test for difference between average remainders for the pretreatment period and the average
remainders for each of the post-treatment periods.
19
10%
1%
10%
11%

APPENDIX TABLE 2. Standing stocks of brown trout in the Treatment and Reference Zones of Lunch Creek in Apri 1 and September, 1971-77 and 1981-83.
Stud:i Zone Characteristic 1971 1972 1973 1974 1975 1976 1977
Treatment No./mi1e in Apr 2,591 3,268 2,044 2,500 1. 106 1 ,209 932 Refe renee ill 2£2 L...l.Q3. 947 690 504 446
Remainders 2,072 2,339 941 1 '553 416 705 486
Treatment No./mi1e in Sep 2,229 2.159 1,918 1. 724 1 ,868 2,000 1 '071 Reference 1.083 .L..Q.l2 LJ...QA ~ 728 668 2.Q_5_
Remainders 1.146 1.144 814 759 1. 140 1,332 466
Treatment Lb/mi 1 e in Apr 283.5 297.6 256.2 223.5 88.5 127.4 75.9 Reference 74.2 146.9 159.2 136.2 ~ 64.2 40.8
Remainders 209.3 150.7 97.0 87.3 7.7 63.2 35.1
Treatment Lb/mi 1 e in Sep 285.0 241 .8 309.1 192. 1 169.7 193.5 154.1 Reference 210.3 ~ 231.9 223.1 ~ l..lL.Q ~
Remainders 74.7 71.0 77.2 -31.0 44.7 75.9 44.2
Treatment No. over 6 inches/ 602 572 580 483 263 248 157 Reference mi 1 e in Apr 228 458 532 462 ru 204 ill
Remainders 374 114 48 21 -24 44 26
Treatment No. over 6 inches/ 841 735 972 643 519 561 472 Reference mi 1 e in Sep 837 800 987 837 600 536 536
Remainders 4 -65 -15 -194 -81 25 -64
Treatment No. over 10 inches/ 87 80 52 93 33 28 9 Reference mile in Apr 40 ill 74 ill 11 39 §
Remainders 47 -23 -22 -12 -8 -11 -3
Treatment No. over 10 inches/ 82 46 107 57 46 52 37 Reference mi 1 e in Sep 128 ill lli ill §1 56 46
Remainders -46 -127 -62 -128 -18 -4 -9
20

APPENDIX TABLE 2. (Cont.)
t values b
1st 2nd Pretr. Pretr. Pretr. Post-tr. Post-tr. vs. vs.·
* ** a 1st 2nd St!.!dll Zone Characteristic 1281 12B2 1983 Avg. Avg. Avg. PQst-tr. Po~t-tr.
Treatment No./mile in Apr 1,594 1,462 2,885 2,634 1,437 1 '980 Reference 954 ill 1.873 850 647 ~
Remafnders . · 640 551 1 ,012 1 '784 790 734 -2.41 at 5% -2.38 at 5%
Treatment No./mil e in Sep 1,643 2,630 3,048 2,102 1,666 2,440 Reference 965 2.l.Q 1,742 lJl.Ql 742 L11lQ
Remainders 678 1, 720 1,306 1,035 924 1,234 -0.37 at 72% 0.62 at 55%
Treatment Lb/mile in Apr 202.5 167.6 280.7 279.1 128.8 216.9 Reference 130.4 94.2 151.8 126.8 ~ m...s
Remainders 72.1 73.4 128.9 152.3 48.3 91.4 -3.29 at 1% -1 .80 at 12%
Treatment Lb/mile in Sep 275.5 241. 1 320.9 278.6 177.4 279.2 Reference ~ .1..hld 238.0 204.3 ill....2 . .1.21&
Remainders 82.9 89.7 82.9 74.3 33.5 85.2 -1.79 at 12% 0.45 at 67%
Treatment No. over 6 inches/ 670 659 928 585 288 752 Reference mile in Apr 529 . 142 §a 406 ill .4§
Remainders 141 310 470 179 17 307 -1.65 at 14% 1.22 at 26%
Treatment No. over 6 ·inches/ 1, 122 1,030 1, 702 849 549 1,285 Reference mile in Sep ill l1a 1.286 ill 628 ~
Remainders 271 282 416 -26 -79 323 -0.92 at 38% 5.65 at 1%
Treatment No. over 10 inches/ 69 83 89 73 41 .. 80 Reference mile in Apr 21 44 J.2 72 ~ ~
Remainders 2 39 53 1 '-7 31 -0.39 at 71% 1.44 at 19%
Treatment No. over 10 inches/ 181 87 159 78 48 .142 Ref~rence mile in Sep 124 .28 ill ill a.B. .l.l2
Remainders 57 19 48 -79 -40 23 1.09 at 31% 3.17 at 2%
* Pretreatment period includes 1971-73. ** First post-treatment period includes 1974-77.
a Second post-treatment period includes 1981-83. b 1 values = test for difference between average remainders for pretreatment period and the average
remainders for each of the post-treatment periods.
21
LITERATURE CITED
Avery, E. L. and R. L. Hunt 1983. Population dynamics of wild trout and associated sport fisheries in
two northern Wisconsin streams. Wis. Dep. Nat. Resour. Tech. Bull. No. 141. 31 pp.
Hunt, R. L. 1979. Removal of woody streambank vegetation to improve trout habitat.
Wis. Dep. Nat. Resour. Tech. Bull. No. 115. 36 pp .
. U.S. Geological Survey 1961. Surface water records of Wisconsin. U.S. De~. Interior Geol.
Survey-Water Resotor. Div. 143 pp.
1962. Surface water records of Wisconsin. U.S. Dep. Interior Geo1. Survey-Water Resour. Div. 139 pp.
1963. Surface water records of Wisconsin. U.S. Dep. Interior Geo1. Survey-Water Resour. Div. 154 pp.
1964. Surface water records of Wisconsin. U.S. Dep. Interior Geol. Survey-Water Resour. Div. 197 pp.
1965. Water resources data for Wisconsin. U.S. Dep. Interior Geol. Survey-Water Resour. Div. 216 pp.
1966. Water resources data for Wisconsin. U.S. Dep. Interior Geol. Survey-Water Resour. Div. 221 pp.
1967. Water resources data for Wisconsin. U.S. Dep. Interior Geol. Survey-Water Resour. Div. 221 pp.
1968. Water resources data for Wisconsin. U.S. Dep. Interior Geol. Survey-Water Resour. Div. 218 pp.
1969. Water resources data for Wisconsin. U.S. Dep. Interior Geol. Survey-Water Resour. Div. 253 pp.
1970. Water resources data for Wisconsin. U.S. Dep. Interior Geol. Survey-Water Resour. Div. 259 pp.
1971. Water resources data for Wisconsin. U.S. Dep. Interior Geol. Survey-Water Resour. Div. 225 pp.
1972. Water resources data for Wisconsin. U.S. Dep. Interior Geol. Survey-Water Resour. Div. 262 pp.
1973. Water resources data for Wisconsin. U.S. Dep. Interior Geol. Survey-Water Resour. Div. 262 pp.
1974. Water resources data for Wisconsin. U.S. Dep. Interior Geol. Survey-Water Kesour. Div. 347 pp.
1975. Water resources data for Wisconsin water year 1975. U.S. Geol. Survey Water-Data Rep. WI-75-1. 569 pp.
22

1976. Water resources data for Wisconsin water year 1976; U.S: ~eoT. Survey Water~Data Rep. WI-76-1. 596 pp.
1977. Water resources data for Wisconsin water year 1977. U.S. Geo1. Survey Water-Data Rep. WI-77-1. 626 pp.
1978. Water resources data for Wisconsin water year 1978. U.S. Geol. Survey Water-Data Rep. WI-78-1. 488 pp.
1979. Water resources data for Wisconsin water year 1979. U.S. Geol. Survey Water-Data Rep. WI-79-1: 514 pp.
1980. Water reso.urces data for Wisconsin water year 1980. U.S. Geol. Survey Water-Data Rep. WI-80-1. 505 pp.
1981. Water resources data for Wisconsin water year 1981. U.S. Geol. Survey Water-Data Rep. WI-81-1. 413 pp.
1982. Water resources data for Wisconsin water year 1982. U.S. Geol. Survey Water-Data Rep. WI-82-1. 426 pp.
1983. Water resources data for Wisconsin water year 1983. U.S. Geol. Survey Water-Data Rep. WI-83-1. 352 pp.
WhiteR. J., E. A. Hansen, and G. R. Alexander 1976. Relationship of trout abundance to stream flow in midwestern
streams. Proc. Symp. and Spec. Conf. on. Instream Flow Needs .. Vol. II. Western Div. Am. Fish. Soc. pp. 597-615.
ACKNOWLEDGMENTS
Ed Avery and Kent Niermeyer, fellow members of the Cold Water Research Group, ably assisted as field crew members in much of the data collection process, preliminary processing of these data, and discussions of their implications as analysis proceeded. Elward Engle again volunteered his reliable services to monitor water temperature recorders installed in Lunch Creek. Dr. John Heaton, University of Wisconsin-Stevens Point, provided encouraging professional counsel and quantitative observations on spawning activities of brook trout in the Little Plover River. James George, USGS, provided stream discharge data from the recording station on the Little Plover River.
Mi~e Staggs, Technical Services Section, contributed expertise in statistical arralysis;and interpretations. Lyle Christenson, Fishery Research Section C~jef, pfovided supervisory guidance throughout the study and essential cdttcal reviews of manuscript drafts. Appreciation fo~ technical review and suggested revisions are also extended to Eugene Lange, Chief of the Technical Se~vt~es Section and_Kent Klepinger, Director of the Bureau of Research.
'"
Thls.research was financially supported in part by the Federal Aid ~n Fish Re·storation Act. under Di ngell-Johnson Project F-83-R. This report repr-~sents a final report for Study 405 (formerly Study 119).
23

Production Credits
Sus1 Nehls, editor Donna Mears, copy editor Dick Burton, drafting and paste-up Susan Hoffman and Susan Spahn, word processors
en (!.) () .... ::::J 0 en Q)
oc iii .... :::1
iii z -0
c:: en c:: 0 () en §