analysis of streambank erosion variables
TRANSCRIPT
ANALYSIS OF STREAMBANK EROSION VARIABLES
W.T. Dickinson and A.M. Scott
1Professor and2Research Assistant, School of Engineering, University of Gue/ph, Guelph, Ontario, Canada NIG 2W1
Received 8 August 1978
Dickinson, W.T. and A.M. Scott. 1979. Analysis of streambank erosion variables. Can. Agric. Eng. 21: 19-25.
A data base consisting of streambank erosion rates and associated physical, chemical, hydraulic, and land managementconditions has been assembled for bank erosion sites in agricultural areas in Southern Ontario. The existence and nature ofinterrelationships among the data sets have been studied by means of various correlation and regression models. A newly definedvariable, the hydraulic stability index, has been developed and considered in relation to the other variables. The rate ofstreambank recession has been found to be functionally related to soil erodibility, agricultural activity adjacent to the bank, andthe hydraulic stability index associated with the erosion site. Implications of this relationship are seen to be important not only tofurther studies of streambank erosion processes but also to the development of strategies for remedial measures.
INTRODUCTION
Recent studies conducted in conjunctionwith the International Joint CommissionReference on Pollution from Land Use
Activities (Knap and Mildner 1977; Knap1978) have revealed that erosion fromstreambanks and drainage ditchescontributes in the order of 600 000 tonnes
of suspended sediment annually to the GreatLakes. This volume constitutes about 12.5%of the total suspended load derived fromriver inputs to the lakes.
Although the amount of streambankerosion in the Great Lakes Basin may beconsidered from a lake perspective to berelatively small, the localized effects of thistype of erosion are not necessarilyinsignificant. For example, an investigationof 16 small agricultural watersheds in
Southern Ontario has revealed that 45% ofthe total bank area of streambanks and
drainageways exhibits some type(s) oferosion (the figure has been computed to beup to 70% in some basins); and 15% of thebank area is completely exposed (up to 50%in selected watersheds) (Dickinson andWinch 1977). Further, Knap (1978) suggeststhat in the Canadian portion of the GreatLakes Basin as much as 30% or more of theannual suspended sediment load leavingvarious agricultural watersheds can be con-tributed by the banks of uplandwatercourses.
There is a need, therefore, to focus someattention on streambank erosion, not onlyfor the identification and understanding ofbank erosion processes but also for thedevelopment of erosion control strategies.The aim of the present study has been to
examine streambank erosion rates inrelation to measurable bank and hydraulicconditions at eroding sites.
DEVELOPMENT OF A DATA BASE
(a) Physical, Chemical, and Erosion RateData
Data collected and assembled for variousof the International Joint Commissionstudies have begun to fill the void ofquantitative information regarding stream-bank erosion rates and conditions. Knap(1978) selected 25 streambank erosion sitesfor detailed study. These sites were locatedin 9 of 16 watersheds initially surveyed forstreambank erosion characteristics, andwere considered to be representative of bankerosion types and conditions in upland agricultural areas of Southern Ontario. The
TABLE I. PHYSICAL DATA SET
Site %t Percentt %T %t Bulk Void T Bank
no. sand very finesand
silt clay density(g/cm3)
ratio slope(m/m)
1 90.32 2.00 6.45 3.23 1.53 0.74 0.05 2.0
2 90.80 13.40 5.60 3.60 1.58 0.67 0.08 2.0
3 0.34 0.00 92.22 7.44 1.62 0.63 0.73 1.5
4 0.44 0.00 92.33 7.23 1.76 0.51 0.75 0.9
5 7.78 5.40 56.24 35.98 1.78 0.49 0.43 2.0
6 57.60 11.40 31.18 11.22 1.50 0.77 0.24 1.8
7 DNAJ DNA DNA DNA DNA DNA DNA DNA
8 24.76 7.90 49.74 25.50 1.99 0.33 0.47 1.0
9 69.21 11.20 20.09 10.70 1.46 0.81 0.19 2.0
10 22.29 6.20 54.90 23.01 1.56 0.70 0.34 3.0
11 21.61 3.70 41.41 36.98 1.61 0.64 0.32 1.6
12 0.34 0.10 90.25 9.41 1.71 0.55 0.73 2.1
13 3.78 0.00 84.19 12.03 1.73 0.53 0.66 0.9
14 DNA DNA DNA DNA DNA DNA DNA DNA
15 1.48 0.00 46.41 52.11 1.41 0.88 0.26 3.2
16 15.54 4.40 42.46 42.04 1.53 0.74 0.32 1.1
17 17.81 7.20 32.63 49.56 1.72 0.54 0.23 1.3
18 17.20 4.70 43.41 39.39 1.69 0.57 0.32 1.4
19 21.98 5.80 41.30 36.72 1.59 0.67 0.32 1.9
20 20.02 4.80 42.01 37.97 1.58 0.69 0.33 1.3
21 11.70 4.50 50.93 37.37 1.47 0.79 0.39 1.4
22 2.97 0.00 62.53 34.50 1.50 0.77 0.40 0.4
23 13.11 12.20 64.54 22.35 1.63 0.63 0.51 1.3
24 4.46 2.60 56.84 38.70 1.71 0.55 0.39 0.6
25 9.09 5.40 65.18 25.73 1.74 0.52 0.53 1.7
t Particle size ranges are: for sand 100jUm to 2 mm; for very fine sand 50 //m to 100/im; for silt 2 jLtm to 50 /im; and for clay less than 2 /im.% DNA = data not available.
CANADIAN AGRICULTURAL ENGINEERING, VOL. 21 NO. 1, JUNE 1979 19
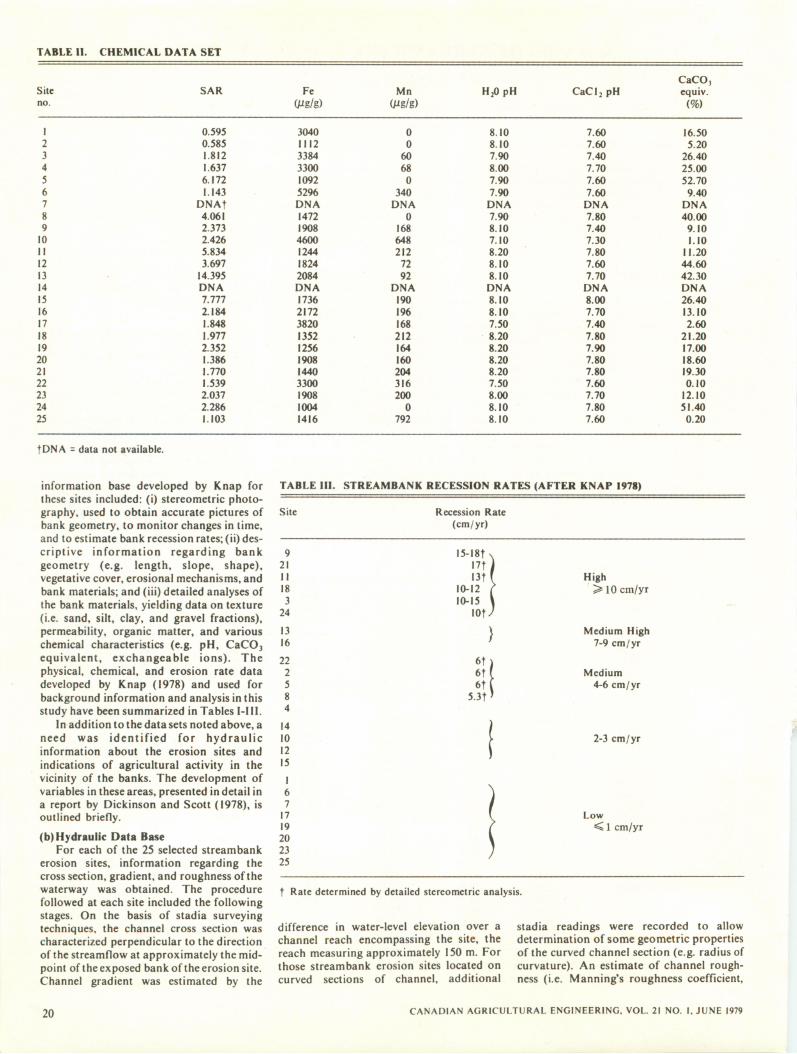
TABLE II. CHEMICAL DATA SET
Site
no.
1
2
3
4
5
6
7
8
9
10
11
12
13
14
15
16
17
18
19
20
21
22
23
24
25
fDNA = data not available.
CaCOjSAR Fe Mn H20pH CaCl2pH equiv.
(Mg/g) (Pg/g) (%)
0.595 3040 0 8.10 7.60 16.500.585 1112 0 8.10 7.60 5.20
1.812 3384 60 7.90 7.40 26.40
1.637 3300 68 8.00 7.70 25.00
6.172 1092 0 7.90 7.60 52.70
1.143 5296 340 7.90 7.60 9.40
DNAf DNA DNA DNA DNA DNA
4.061 1472 0 7.90 7.80 40.00
2.373 1908 168 8.10 7.40 9.10
2.426 4600 648 7.10 7.30 1.10
5.834 1244 212 8.20 7.80 11.20
3.697 1824 72 8.10 7.60 44.60
14.395 2084 92 8.10 7.70 42.30
DNA DNA DNA DNA DNA DNA
7.777 1736 190 8.10 8.00 26.40
2.184 2172 196 8.10 7.70 13.10
1.848 3820 168 7.50 7.40 2.60
1.977 1352 212 8.20 7.80 21.20
2.352 1256 164 8.20 7.90 17.00
1.386 1908 160 8.20 7.80 18.60
1.770 1440 204 8.20 7.80 19.30
1.539 3300 316 7.50 7.60 0.10
2.037 1908 200 8.00 7.70 12.10
2.286 1004 0 8.10 7.80 51.40
1.103 1416 792 8.10 7.60 0.20
information base developed by Knap forthese sites included: (i) stereometric photography, used to obtain accurate pictures ofbank geometry, to monitor changes in time,and to estimate bank recession rates; (ii) descriptive information regarding bankgeometry (e.g. length, slope, shape),vegetative cover, erosional mechanisms, andbank materials; and (iii) detailed analyses ofthe bank materials, yielding data on texture(i.e. sand, silt, clay, and gravel fractions),permeability, organic matter, and variouschemical characteristics (e.g. pH, CaC03equivalent, exchangeable ions). Thephysical, chemical, and erosion rate datadeveloped by Knap (1978) and used forbackground information and analysis in thisstudy have been summarized in Tables I—III.
In addition to the data sets noted above, aneed was identified for hydraulicinformation about the erosion sites and
indications of agricultural activity in thevicinity of the banks. The development ofvariables in these areas, presented in detail ina report by Dickinson and Scott (1978), isoutlined briefly.
(b)Hydraulic Data BaseFor each of the 25 selected streambank
erosion sites, information regarding thecross section, gradient, and roughness of thewaterway was obtained. The procedurefollowed at each site included the followingstages. On the basis of stadia surveyingtechniques, the channel cross section wascharacterized perpendicular to the directionof the streamflow at approximately the midpoint of the exposed bank of the erosion site.Channel gradient was estimated by the
TABLE III. STREAMBANK RECESSION RATES (AFTER KNAP 1978)
Site
9
21
II
18
3
24
13
16
22
2
5
8
4
14
10
12
15
1
6
7
17
19
20
23
25
Recession Rate
(cm/yr)
15-I8T
17tI3f
10-12
10-15
I0f-
6tj6? I6t|
5-3t •
High> 10 cm/yr
Medium High7-9 cm/yr
Medium
4-6 cm/yr
2-3 cm/yr
Low
< 1 cm/yr
t Rate determined by detailed stereometric analysis.
difference in water-level elevation over achannel reach encompassing the site, thereach measuring approximately 150 m. Forthose streambank erosion sites located on
curved sections of channel, additional
stadia readings were recorded to allowdetermination of some geometric propertiesof the curved channel section (e.g. radius ofcurvature). An estimate of channel roughness (i.e. Manning's roughness coefficient,
20 CANADIAN AGRICULTURAL ENGINEERING, VOL. 21 NO. I, JUNE 1979
3.5
3.0
2.5
2.0
,0•
**
1.0
0.5
OM
.O.E
.D
AT
A
•C
OM
PU
TE
RD
AT
A
10
IS2
02
53
03
5
DIS
CH
AR
GE
(CU
BIC
ME
TE
RS
PE
RS
EC
ON
D)
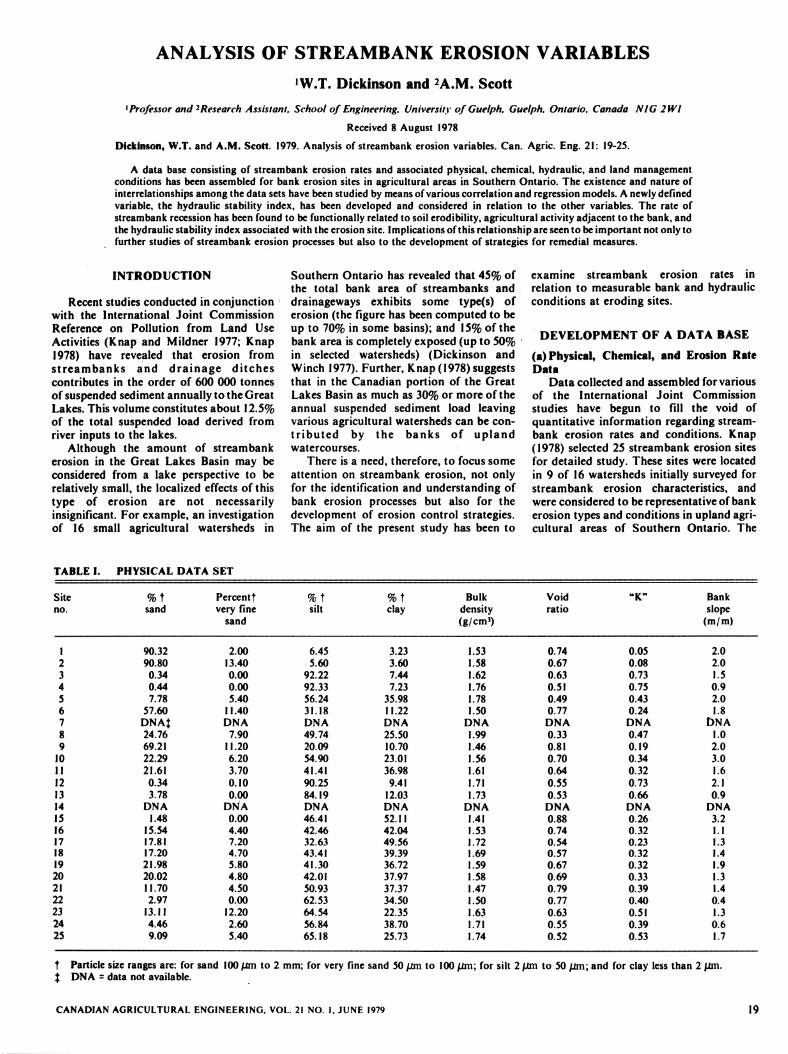
Figure
1.R
ating
curvefor
sites6
and7.
40
90
38
0
s»5
0K<UI
40
en
aS302
010
DD
D
n-*
D•*
D•"
O-
CH
AN
NE
LB
OT
TO
M
•-
CH
AN
NE
LS
IDE
S
as
1.0I.S
2.0
2.5
30
MA
XIM
UM
CH
AN
NE
LD
EP
TH
(M
ET
ER
S)
3.5
Figure2.
Maxim
umshear
stressesvs.depth
forstream
bankerosion
site6.
n)w
asm
ade
with
the
aido
fp
ho
tog
raph
stak
enat
the
stud
ysites
atv
ariou
stim
esth
rou
gh
ou
tth
eyear.
Th
estad
iain
form
ation
ob
tain
ed
inth
efie
ldw
as
use
dfo
rth
e
plo
tting
of
acro
ss-section
alview
of
the
channelat
eachsite
andfor
the
prep
aration
of
aplan
viewo
feach
chan
nel
reach.T
hedevelopm
entof
astage-discharge
ratingcurve
foreach
erosionsite
was
facilitatedby
the
useo
fan
availab
leco
mp
ute
rp
rog
ram
,th
eb
asiso
fw
hic
hw
asa
sub-programof
alarger
floodrouting
routine(W
hiteleyand
Ghate
1978).Inputsto
the
pro
cedu
rein
clud
edch
ann
elcro
ss-section
data
points,channel
gradient,an
dchanneltoughness
coefficient.T
he
pro
gram
div
ided
the
ele
vatio
nd
iffere
nce
betw
een
no
flow
an
db
ank
-full
flow
co
nd
ition
sin
to2
0w
aterlevel
elevationsat
equalincrem
ents.F
or
eachof
the20
water
levelelevations,th
eco
mp
uter
ou
tpu
tco
ntain
edin
form
ation
on
cross-sectionalend
area,hydraulic
radius,channel
topw
idth,m
aximum
depthof
flow,
andm
eanflow
velocity.A
validationof
thedeveloped
stage-discharge
data
was
possibleat
an
um
ber
of
thestream
banksites
which
were
sufficientlyclose
toO
ntario
Ministry
ofth
eE
nv
iron
mentgauging
stationsto
allowa
comparison
ofthe
computer-developed
relationshipsan
dratin
gcu
rves
determ
ined
from
streamdischarge
measurem
ents.T
he
comparative
curves(e.g.
Fig.1)
suggestedsufficiently
closeagreem
entto
permit
reasonableconfidence
inthe
hydraulicparam
etersdeterm
inedw
iththe
computer
program.
Th
eco
mp
uter
pro
gram
usedfo
rth
edevelopm
entof
thestage-discharge
dataw
asm
odifiedto
allowco
mp
utatio
nof
max
imu
mtra
ctiv
efo
rcesat
the
ero
sion
sites.T
he
ap
pro
ach
was
based
on
the
tractive
force
theoryoutlined
byC
how(1959),
and
CA
NA
DIA
NA
GR
ICU
LT
UR
AL
EN
GIN
EE
RIN
G,
VO
L.
21N
O.
I,JU
NE
1979
inclu
ded
co
nsid
era
tion
sfo
rch
an
nel
curv
ature
presen
tedby
No
rman
n(1975).
(Th
etractiv
efo
rceis
that
force
which
the
water
exerts
onth
ep
eriph
eryo
fth
echannel
du
eto
the
mo
tion
of
the
wate
r.T
he
critic
al
tractive
force,
r,is
that
tractive
forceco
nd
ition
atw
hichb
ank
and
/or
bedm
aterialsbegin
toero
de.)
Th
em
odifiedp
rog
ramrequired
the
additionalinputs
ofch
ann
elside-slope
and
,w
hereapplicable,
the
intern
alan
gle
of
curv
ature
and
radiusof
cu
rvatu
reo
fth
ecen
ter-lin
eo
fth
ech
an
nel.
Information
containedin
theoutput
ofthe
modified
pro
gram
includedthe
maxim
umb
otto
man
dsid
etra
ctiv
efo
rces
for
the
variousw
aterlevel
elevations.A
nexam
pleof
thegraphical
outputis
shown
inFig.
2.T
he
selectiono
fan
app
roach
forthe
determ
inatio
no
fcritical
tractiveforces
(i.e.tc)
was
basedprim
arilyon
thecohesive
natu
reo
fth
eso
ilm
ate
rials
at
the
selected
streambank
erosionsites.
An
approachoutlined
byC
how(1959),
anddeveloped
from
U.S
.S.R
.d
ata
,w
asu
sedto
establish
aran
ge
with
inw
hich
the
criticaltractiveforce
for
ban
kso
ilm
aterialsat
eachsite
was
believedto
lie.T
hesoils
atthe
deepesth
oriz
on
at
eachstre
am
ban
ksite
were
considered,and
therange
ofcriticaltractive
forcew
aslocated
onthe
graphicalrelation
ship
determ
ined
for
shear
stressvs.
water
depth(as
illustratedin
Fig.2).
Fo
reach
site,the
depthcorresponding
toth
em
id-p
oin
to
fth
ecritical
tractiveforce
rangew
asidentified
andexpressed
asa
decimal
ofthe
bank-fulldepth.T
hisdecim
alvalue
was
definedas
thehydraulicstability
ind
exo
fth
estre
am
ban
kero
sion
site.A
ratio
nale
for
the
dete
rmin
atio
nan
dn
amin
go
fth
isin
dex
follows.
Ifth
ecritical
tractiveforce
couldbe
expectedto
occurat
relativelylow
water
depths(i.e.an
hydraulicstability
indexof
0.2or
less),thefrequency
offlow
eventsw
hichcould
beexpected
toproduce
tractiveforce
valuesequal
toor
greater
than
the
criticaltractiv
efo
rcew
ou
ldbe
relativelylarge.
Th
atis,such
asite
would
berelatively
un
stable
i.e.n
ot
resistantto
erosivehydraulic
forces.O
nthe
otherhand,
ifthecriticaltractive
forcecould
beexpectedto
occurat
relativelydeep
water
depths(i.e.
anhydraulic
stabilityindex
of0.8
org
reater),th
efrequency
of
flowevents
which
wo
uld
beex
pected
top
rod
uce
tractiveforce
valueseq
ual
too
rg
reaterth
anth
ecritical
tractiveforce
would
berelatively
small.T
hatis,
this
lattersite
wo
uld
bem
ore
stable
and
resistant
toero
sive
action
on
the
ban
ks
du
eto
thehydraulic
forcespresent.
Alistin
go
fth
eh
yd
raulic
data
collected,assem
bled
,an
d/o
rd
evelo
ped
for
analysisp
urp
oses
hasb
eenp
resented
inT
able
IV.
Itincludes
thechannel
gradient,the
channelro
ug
hn
ess(n),
the
ang
leco
ntain
edby
the
channelcu
rvatu
re,the
averageflow
velocityand
flowfor
thedepth
expectedto
developcritical
tractive
forces,
the
criticaltractiv
eforce,
andthe
hydraulicstability
index.
(c)A
griculturalIntensity
An
oth
erfacto
rth
ou
gh
tto
havea
21

TABLE IV. HYDRAULIC DATA SET
Site
no.
Slope(m/m)
Anglecontained
by curve(rad)
Averagevelocity(m/s)
Flow
(m'/s)
Critical
shear
(Pa)
Hydraulicstability
index
1 0.00187 0.060 3.14 0.50 2.13 7.40 0.74
2 0.00189 0.045 1.06 0.61 1.57 8.25 0.41
3 0.00527 0.055 2.44 0.45 0.45 8.85 0.12
4 0.00527 0.055 1.24 0.53 1.16 11.00 0.19
5 0.00430 0.036 1.04 0.75 0.85 11.85 0.25
6 0.00507 0.030 3.14 0.76 0.78 6.95 0.17
7 DNAt DNA DNA DNA DNA DNA DNA
8 0.00551 0.050 1.31 0.77 1.63 17.45 0.42
9 0.00551 0.036 3.14 0.58 0.38 6.55 0.17
10 0.00870 0.032 3.14 0.59 0.25 7.90 0.29
11 0.00039 0.030 3.14 0.85 11.75 8.85 1.00
12 0.00213 0.040 3.14 1.02 6.81 11.50 0.55
13 0.00110 0.060 1.16 0.67 33.28 11.00 0.95
14 DNA DNA DNA DNA DNA DNA DNA
15 0.0059 0.040 1.50 0.48 3.22 5.90 1.00
16 0.00120 0.032 3.14 0.98 6.50 7.40 0.44
17 0.00120 0.032 3.14 1.46 20.13 11.00 0.54
18 0.00120 0.032 3.14 1.37 20.72 10.05 0.51
19 0.00207 0.030 3.14 0.98 1.96 8.25 0.66
20 0.00326 0.036 3.14 0.69 0.73 7.90 0.52
21 0.00223 0.034 3.14 0.82 1.98 6.95 0.36
22 0.00469 0.038 1.14 0.51 0.47 6.95 0.19
23 0.00034 0.038 3.14 0.66 10.06 8.85 1.00
24 0.00280 0.038 1.04 0.79 1.98 11.50 0.41
25 0.00585 0.032 0.99 0.87 0.46 11.00 0.21
fDNA s data not available
TABLE V.
Site no.
21 /
SI
2
23
10
25 J
9
22
7
6
15
13
12
24
3
4
20
RANKING OF STREAMBANK SITES ACCORDING TO AGRICULTURAL
INTENSITY ADJACENT TO THE BANK
Agricultural activity
Most intensive agriculture— level
Row crops and tomatoes— level
Row crops— sloping— narrow buffer
Small grains and some row crops— level
Pasture with animals
— sloping
Pasture with animals
— level
"Pasture" and hay — no animals
Woodlots
Linear After Wall (1977)
12.5 45
13.0 44
11.5 43
11.0 42
10.5 41
10.0 40
9.5 39
9.0 38
8.5 20
8.0 18
7.5 16
7.0 15
6.5 14
6.0 13
5.5 12
5.0 10
4.5 9
4.0 8
3.5 6
3.0 4
2.5 2
2.0 2
1.5 1
1.0 1
.5 1
significant effect on streambank erosionrates was the type and intensity of agricultural activity in the vicinity of the banks. Inorder to develop an index representative of
such activity, two approaches were tried.The first approach involved a subjective
ranking of the erosion sites according to thesuspected soil erosion potential in the near-
bank area. The sites were then assignedincremental numerical values from 0.5 to
12.5, the increments being linear and 0.5representing the lowest erosion potential.The values assigned to the sites have beenpresented in Table V.
The second approach involved theestimation of soil erosion potential for theagricultural activity adjacent to each erosionsite using the estimates of mean annual soilloss for different cropping practices in SouthOntario determined by Wall (1977). A set ofrelative potential values was determined bysetting the lowest value at 1.0 (corresponding to Wall's lowest value of 0.2) andcalculating the other values by dividing thepotential soil erosion losses in Wall's tableby 0.2. This approach yielded a set ofnumerical indices for the erosion sites
ranging from 1 to 45. These values have beenincluded in Table V.
CORRELATION AND REGRESSION
MODELS
(a) Correlation ModelsAs a first step towards identifying
possible relationships among the hydraulic,physical, chemical, and erosional variablesat the streambank erosion sites, a simplecorrelation matrix including all the variablesenumerated was developed. This matrixrevealed the best correlations to exist
between critical tractive force, bulk density,and void ratio. This result was not surprisingsince void ratio is related to bulk density andcritical tractive force was derived from void
ratio. It was interesting to note that criticaltractive force and bulk density exhibited a
22 CANADIAN AGRICULTURAL ENGINEERING, VOL. 21 NO. I, JUNE 1979
as 0.4 0.5 0.6
CHANNEL GRADIENT (PERCENT)
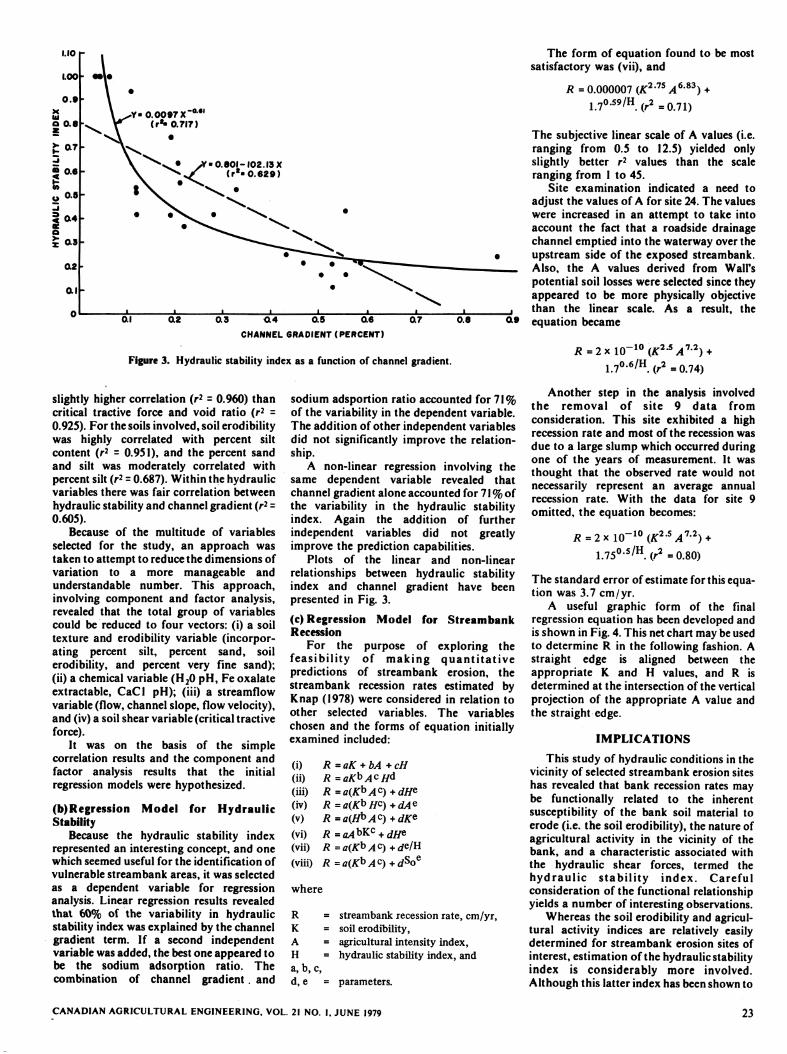
Figure 3. Hydraulic stability index as a function of channel gradient.
slightly higher correlation (r2 = 0.960) thancritical tractive force and void ratio (r2 =0.925). For the soils involved, soil erodibilitywas highly correlated with percent siltcontent (r2 = 0.951), and the percent sandand silt was moderately correlated withpercent silt (r2 = 0.687). Within the hydraulicvariables there was fair correlation between
hydraulic stability and channel gradient (r2 =0.605).
Because of the multitude of variables
selected for the study, an approach wastaken to attempt to reduce the dimensions ofvariation to a more manageable andunderstandable number. This approach,involving component and factor analysis,revealed that the total group of variablescould be reduced to four vectors: (i) a soiltexture and erodibility variable (incorporating percent silt, percent sand, soilerodibility, and percent very fine sand);(ii) a chemical variable (H20 pH, Fe oxalateextractable, CaCl pH); (iii) a streamflowvariable (flow, channel slope, flow velocity),and (iv) a soil shear variable (critical tractiveforce).
It was on the basis of the simplecorrelation results and the component andfactor analysis results that the initialregression models were hypothesized.
(b)Regression Model for HydraulicStability
Because the hydraulic stability indexrepresented an interesting concept, and onewhich seemed useful for the identification of
vulnerable streambank areas, it was selectedas a dependent variable for regressionanalysis. Linear regression results revealedthat 60% of the variability in hydraulicstability index was explained by the channelgradient term. If a second independentvariable was added, the best one appeared tobe the sodium adsorption ratio. Thecombination of channel gradient. and
sodium adsportion ratio accounted for 71%of the variability in the dependent variable.The addition of other independent variablesdid not significantly improve the relationship.
A non-linear regression involving thesame dependent variable revealed thatchannel gradient alone accounted for 71% ofthe variability in the hydraulic stabilityindex. Again the addition of furtherindependent variables did not greatlyimprove the prediction capabilities.
Plots of the linear and non-linearrelationships between hydraulic stabilityindex and channel gradient have beenpresented in Fig. 3.
(c) Regression Model for StreambankRecession
For the purpose of exploring thefeasibility of making quantitativepredictions of streambank erosion, thestreambank recession rates estimated byKnap (1978) were considered in relation toother selected variables. The variableschosen and the forms of equation initiallyexamined included:
(i) R=aK + bA+cH(ii) R=aK*AtH*(iii) R =a(K*>AC)+dHe(iv) R=a(K*>HC)+dAe(v) R=a(H*AC)+dKe(vi) R=aA*K-c +dH*(vii) R =fl(ATh>lc)+Cre/H
(viii) R =a(K*Ac)+dsoQ
where
R = streambank recession rate, cm/yr,K = soil erodibility,A = agricultural intensity index,H = hydraulic stability index, anda, b, c,d, e = parameters.
CANADIAN AGRICULTURAL ENGINEERING. VOL. 21 NO. I, JUNE 1979
The form of equation found to be mostsatisfactory was (vii), and
R =0.000007 (K2'7S A6*3) +170.S9/H(r2=()71)
The subjective linear scale of A values (i.e.ranging from 0.5 to 12.5) yielded onlyslightly better r2 values than the scaleranging from 1 to 45.
Site examination indicated a need to
adjust the values of A for site 24. The valueswere increased in an attempt to take intoaccount the fact that a roadside drainagechannel emptied into the waterway over theupstream side of the exposed streambank.Also, the A values derived from Wall'spotential soil losses were selected since theyappeared to be more physically objectivethan the linear scale. As a result, theequation became
/?=2xlO"10(tf2-5y47-2) +17o.6/H (r2=0?4)
Another step in the analysis involvedthe removal of site 9 data from
consideration. This site exhibited a highrecession rate and most of the recession was
due to a large slump which occurred duringone of the years of measurement. It wasthought that the observed rate would notnecessarily represent an average annualrecession rate. With the data for site 9
omitted, the equation becomes:
/?=2xlO~10(A'2-5y47-2) +1.7505/H. (r2 =0.80)
The standard error of estimate for this equation was 3.7 cm/yr.
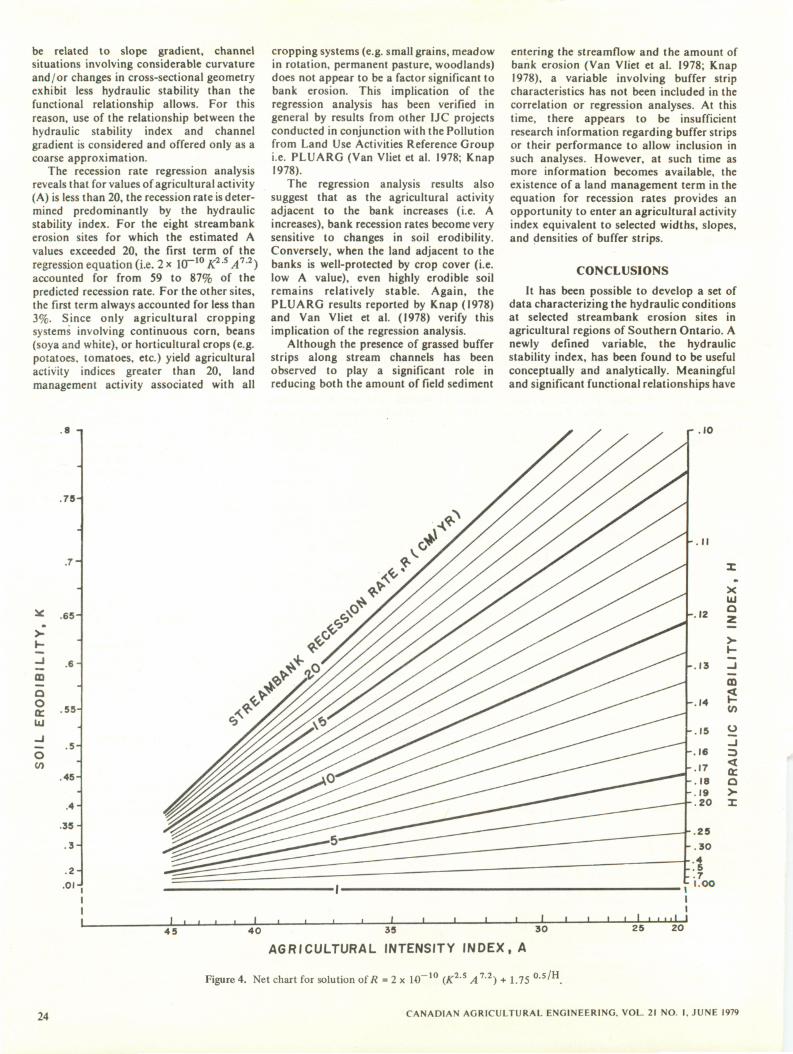
A useful graphic form of the finalregression equation has been developed andis shown in Fig. 4. This net chart may be usedto determine R in the following fashion. Astraight edge is aligned between theappropriate K and H values, and R isdetermined at the intersection of the verticalprojection of the appropriate A value andthe straight edge.
IMPLICATIONS
This study of hydraulic conditions in thevicinity of selected streambank erosion siteshas revealed that bank recession rates maybe functionally related to the inherentsusceptibility of the bank soil material toerode (i.e. the soil erodibility), the nature ofagricultural activity in the vicinity of thebank, and a characteristic associated withthe hydraulic shear forces, termed thehydraulic stability index. Carefulconsideration of the functional relationshipyields a number of interesting observations.
Whereas the soil erodibility and agricultural activity indices are relatively easilydetermined for streambank erosion sites ofinterest, estimation of the hydraulic stabilityindex is considerably more involved.Although this latter index has been shown to
23
be related to slope gradient, channelsituations involving considerable curvatureand /or changes in cross-sectional geometryexhibit less hydraulic stability than thefunctional relationship allows. For thisreason, use of the relationship between thehydraulic stability index and channelgradient is considered and offered only as acoarse approximation.
The recession rate regression analysisreveals that for values of agricultural activity(A) is less than 20, the recession rate is determined predominantly by the hydraulicstability index. For the eight streambankerosion sites for which the estimated A
values exceeded 20, the first term of theregression equation (i.e. 2 x 10⁻¹⁰ K2-5 A11)accounted for from 59 to 87% of thepredicted recession rate. For the other sites,the first term always accounted for less than3%. Since only agricultural croppingsystems involving continuous corn, beans(soya and white), or horticultural crops (e.g.potatoes, tomatoes, etc.) yield agriculturalactivity indices greater than 20, landmanagement activity associated with all
8 -|
45
cropping systems (e.g. small grains, meadowin rotation, permanent pasture, woodlands)does not appear to be a factor significant tobank erosion. This implication of theregression analysis has been verified ingeneral by results from other IJC projectsconducted in conjunction with the Pollutionfrom Land Use Activities Reference Groupi.e. PLUARG (Van Vliet et al. 1978; Knap1978).
The regression analysis results alsosuggest that as the agricultural activityadjacent to the bank increases (i.e. Aincreases), bank recession rates become verysensitive to changes in soil erodibility.Conversely, when the land adjacent to thebanks is well-protected by crop cover (i.e.low A value), even highly erodible soilremains relatively stable. Again, thePLUARG results reported by Knap (1978)and Van Vliet et al. (1978) verify thisimplication of the regression analysis.
Although the presence of grassed bufferstrips along stream channels has beenobserved to play a significant role inreducing both the amount of field sediment
entering the streamflow and the amount ofbank erosion (Van Vliet et al. 1978; Knap1978), a variable involving buffer stripcharacteristics has not been included in the
correlation or regression analyses. At thistime, there appears to be insufficientresearch information regarding buffer stripsor their performance to allow inclusion insuch analyses. However, at such time asmore information becomes available, theexistence of a land management term in theequation for recession rates provides anopportunity to enter an agricultural activityindex equivalent to selected widths, slopes,and densities of buffer strips.
CONCLUSIONS
It has been possible to develop a set ofdata characterizing the hydraulic conditionsat selected streambank erosion sites in
agricultural regions of Southern Ontario. Anewly defined variable, the hydraulicstability index, has been found to be usefulconceptually and analytically. Meaningfuland significant functional relationships have
r 10
40 35 30
AGRICULTURAL INTENSITY INDEX, A
25 20
24
Figure 4. Net chart for solution ofR=2x 10 10 (K2S A1'2) +1.75 0S/H.
CANADIAN AGRICULTURAL ENGINEERING. VOL. 21 NO. I. JUNE 1979
been found to exist among the hydraulic,physical, and erosional variables. Inparticular, streambank recession rates canbe functionally related to soil erodibility,agricultural activity in the vicinity of thebank, and the hydraulic stability indexassociated with the flow conditions.
At this time and until further testing ofthe functional relationships is possible, theprediction equation for streambankrecession rates should not be used forwidespread determination of bank erosionvolumes entering the stream and GreatLakes system. (It is suggested that theapproach oulined by Knap (1978) is moresuitable for such a purpose.) Rather, theregression relationship can serve as a usefulaid for the delineation of the relative
significance of erosion factors along selectedstreambanks. It thus provides a basic toolfor the definition of many bank problemsand the development and testing of remedialmeasure strategies.
ACKNOWLEDGMENTS
The authors wish to express theirappreciation to several individuals for theirassistance at various stages of this study: Dr.G.J. Wall, Ontario Soil Survey, AgricultureCanada, for considerable advice andguidance; K.M. Knap, Ontario Ministry ofNatural Resources, for advice and technical
assistance; and G. Moon, School ofEngineering, University of Guelph, forvaluable suggestions and technicalassistance. The study discussed in this reportwas performed as a part of the efforts of thePollution from Land Use Activities
Reference Group (PLUARG), anorganization established by the International Joint Commission under the Canada-U.S.
Great Lakes Water Quality Agreement of1972. Funding was provided through theOntario Ministry of Agriculture and Foodand the Ontario Ministry of NaturalResources. Findings and conclusions arethose of the authors and do not necessarilyreflect the views of the Reference Group orits recommendations to the Commission.
CHOW, VEN TE. 1959. Open channelhydraulics. McGraw-Hill Book Co. Inc.,New York, N.Y.
DICKINSON, W.T. and A.M. SCOTT. 1978.Streambank erosion in relation to bank and
hydraulic conditions. A report to the Conservation Authorities Branch, Ontario Ministryof Natural Resources, Queen's Park, Toronto.(In press as an IJC-PLUARG TechnicalReport, Great Lakes Regional Office,Windsor, Ont.)
DICKINSON, W.T. and J.E. WINCH. 1977.3 R*s for bank erosion control. Paper presented to a Joint Meeting of the OntarioChapter of the S.C.S.A. and the OntarioInstitute of Agrologists on Erosion and the
CANADIAN AGRICULTURAL ENGINEERING, VOL. 21 NO. I. JUNE 1979
Rural Landscape, Embro, Ontario. (In pressas a publication of the Ontario Chapter of theS.C.S.A.)
KNAP, K.M. 1978. Streambank erosion in theCanadian Great Lakes Basin. Final report,PLUARG Task C Phase II, Ontario Ministryof Natural Resources, Toronto. (In press as anIJC-PLUARG Technical Report, GreatLakes Regional Office, Windsor, Ont.)
KNAP, K.M. and W.F. MILDNER. 1977.Streambank erosion in the Great Lakes Basin.
A joint summary technical report to the IJCReference on Pollution from Land Use
Activities, the U.S. Soil Conservation Service,and the Ontario Ministry of NaturalResources. (In press as an IJC-PLUARGTechnical Report, Great Lakes RegionalOffice, Windsor, Ont.)
NORMANN, J.M. 1975. Design of stablechannels with flexible linings. Hyd. Eng. Cr.#15, Hydraulics Branch, Bridge Division,Office of Engineering, Fed. Hwy. Admin.,Washington, D.C.
VAN VLIET, L.J.P., G.J. WALL and W.T.DICKINSON. 1978. Erosional losses from
agricultural land and sediment delivery ratiosin small agricultural watersheds. IJC-PLUARG Technical Report, Great LakesRegional Office, Windsor, Ont.
WALL, G.J. 1977. Water erosion: nature andextent in Ontario. Proceedings of OMAF In-Service Training Seminar, University ofGuelph, Guelph, Ont.
WHITELEY, H.R. and S.R. GHATE. 1978.Hydrological model project. IJC-PLUARGTechnical Report, Great Lakes RegionalOffice, Windsor, Ont.
25