department of pesticide regulation of pesticide regulation ... worker health and safety branch ......
TRANSCRIPT
Department of Pesticide Regulation
Paul E. Helliker Director M E M O R A N D U M
Gray Davis Governor
Winston H. Hickox Secretary, California
Environmental Protection Agency
1001 I Street • P.O. Box 4015 • Sacramento, California 95812-4015 • www.cdpr.ca.gov A Department of the California Environmental Protection Agency
TO: Joseph Frank, Senior Toxicologist HSM-02012 Worker Health and Safety Branch
FROM: Sally Powell, Senior Environmental Research Scientist [original signed by S. Powell] Worker Health and Safety Branch (916) 445-4248
DATE: April 9, 2002 SUBJECT: REVISED EXPOSURES TO METHYL BROMIDE BASED ON THE FINAL
REPORT ON THE 2001 MONITORING IN OXNARD/CAMARILLO AND SANTA MARIA BY THE ALLIANCE OF THE METHYL BROMIDE INDUSTRY
Exposures to methyl bromide in Oxnard/Camarillo and Santa Maria, based on the draft report by the Alliance of the Methyl Bromide Industry (AMBI, 2002a), were reported previously (Powell, 2002). In the final AMBI report (AMBI, 2002b), minor corrections to three data points from Oxnard/ Camarillo have been made. There were no changes to the Santa Maria data. This memo gives revised exposures based on the corrected data. All exposure calculations were as described in Powell (2002). Exposures are expressed as concentrations of methyl bromide in air for 24-hour, 1-week and 8-week averaging periods (Table 1). Daily concentrations and intermediate calculations are shown in Tables 2 and 3. Table 1. Methyl bromide concentrations (ppbv) in Oxnard/Camarillo and Santa Maria, 2001, based on monitoring by the Alliance of the Methyl Bromide Industry. Daily 1-week 8-week Site a
n
days
Maximum
24-hr
95% tolerance
limit
Maximum weekly b
mean
95% tolerance
limit
Mean of weekly means
Oxnard/Camarillo (15 Aug – 10 Oct, 2001) -------------------------------------- ppbv --------------------------------------- PVW 31 c 3.17 2.56 d 2.01 2.59 0.56 UWC 19 4.35 8.77 2.08 3.48 0.82 SHA 29 2.94 e 2.43 f 2.30 g 2.55 h 0.50 i ABD 21 0.44 j 0.44 0.44 j 0.58 0.18
Santa Maria (23 Aug – 9 Oct, 2001) -------------------------------------- ppbv --------------------------------------- BLO 31 4.55 4.85 1.89 2.25 0.73 AGCCRS 28 1.16 1.28 0.85 1.00 0.28 EDW 30 11.15 10.57 6.49 7.10 1.32 PNT 24 2.69 4.62 1.75 2.26 0.93

Joseph Frank April 9, 2002 Page 2 a Monitoring sites described in AMBI (2002b). b Each weekly mean is the arithmetic mean of the 24-hr samples (n ranged 1 - 5) in a calendar week. c Changed from 30 days in draft version. d Changed from 2.68 ppbv in draft version. e Changed from 3.38 ppbv in draft version. f Changed from 2.41 ppbv in draft version. g Changed from 2.47 ppbv in draft version. h Changed from 2.73 ppbv in draft version. i Changed from 0.51 ppbv in draft version. j Measured in a week with only one 24-hr sample. References
AMBI. 2002a. Draft preliminary report: Methyl bromide ambient air monitoring in Oxnard/Camarillo and Santa Maria, August-October, 2001. Draft dated Feb. 15. Sacramento, CA: Alliance of the Methyl Bromide Industry.
AMBI. 2002b. Final report: Methyl bromide ambient air monitoring in Oxnard/Camarillo and
Santa Maria, August-October, 2001. Report dated April 4. Sacramento, CA: Alliance of the Methyl Bromide Industry.
Powell, S. 2002. Exposures to methyl bromide based on the report on the 2001 monitoring in
Oxnard/Camarillo and Santa Maria by the Alliance of the Methyl Bromide Industry. HSM-02007. Sacramento, CA: Worker Health and Safety Branch, Department of Pesticide Regulation, California Environmental Protection Agency.
cc: Tom Thongsinthusak Lori Lim Randy Segawa
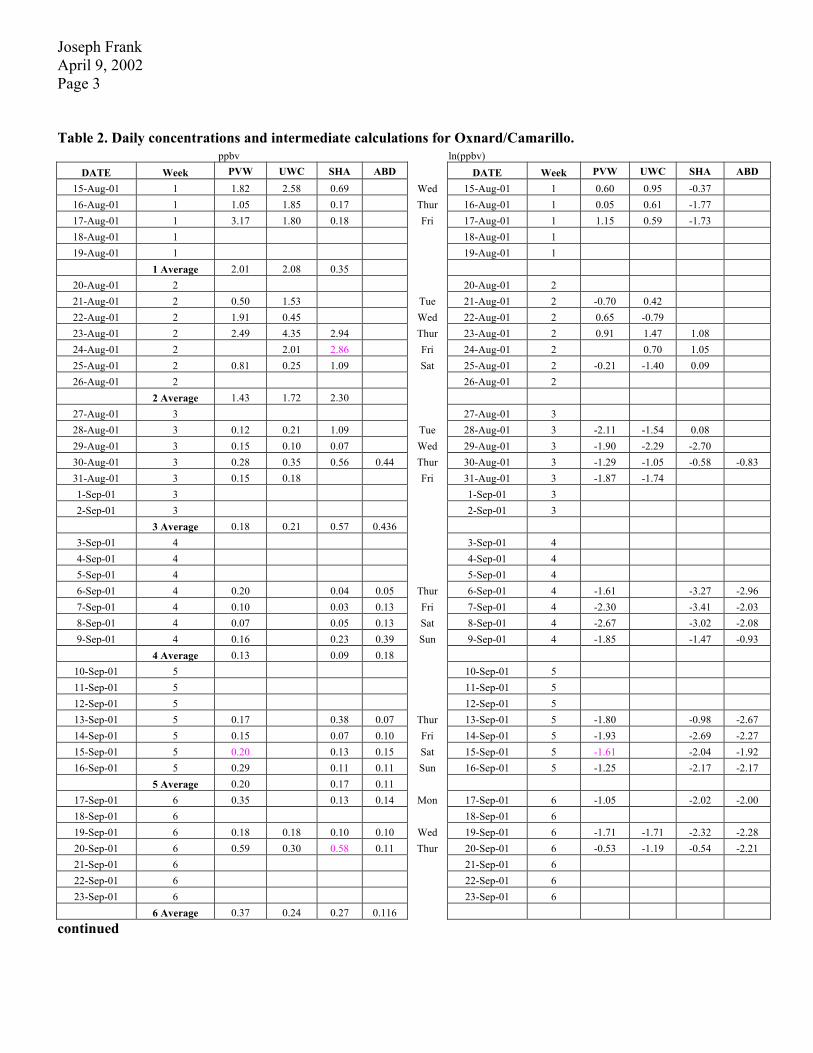
Joseph Frank April 9, 2002 Page 3 Table 2. Daily concentrations and intermediate calculations for Oxnard/Camarillo. ppbv ln(ppbv)
DATE Week PVW UWC SHA ABD DATE Week PVW UWC SHA ABD 15-Aug-01 1 1.82 2.58 0.69 Wed 15-Aug-01 1 0.60 0.95 -0.37 16-Aug-01 1 1.05 1.85 0.17 Thur 16-Aug-01 1 0.05 0.61 -1.77 17-Aug-01 1 3.17 1.80 0.18 Fri 17-Aug-01 1 1.15 0.59 -1.73 18-Aug-01 1 18-Aug-01 1 19-Aug-01 1 19-Aug-01 1
1 Average 2.01 2.08 0.35 20-Aug-01 2 20-Aug-01 2 21-Aug-01 2 0.50 1.53 Tue 21-Aug-01 2 -0.70 0.42 22-Aug-01 2 1.91 0.45 Wed 22-Aug-01 2 0.65 -0.79 23-Aug-01 2 2.49 4.35 2.94 Thur 23-Aug-01 2 0.91 1.47 1.08 24-Aug-01 2 2.01 2.86 Fri 24-Aug-01 2 0.70 1.05 25-Aug-01 2 0.81 0.25 1.09 Sat 25-Aug-01 2 -0.21 -1.40 0.09 26-Aug-01 2 26-Aug-01 2
2 Average 1.43 1.72 2.30 27-Aug-01 3 27-Aug-01 3 28-Aug-01 3 0.12 0.21 1.09 Tue 28-Aug-01 3 -2.11 -1.54 0.08 29-Aug-01 3 0.15 0.10 0.07 Wed 29-Aug-01 3 -1.90 -2.29 -2.70 30-Aug-01 3 0.28 0.35 0.56 0.44 Thur 30-Aug-01 3 -1.29 -1.05 -0.58 -0.83 31-Aug-01 3 0.15 0.18 Fri 31-Aug-01 3 -1.87 -1.74 1-Sep-01 3 1-Sep-01 3 2-Sep-01 3 2-Sep-01 3
3 Average 0.18 0.21 0.57 0.436 3-Sep-01 4 3-Sep-01 4 4-Sep-01 4 4-Sep-01 4 5-Sep-01 4 5-Sep-01 4 6-Sep-01 4 0.20 0.04 0.05 Thur 6-Sep-01 4 -1.61 -3.27 -2.96 7-Sep-01 4 0.10 0.03 0.13 Fri 7-Sep-01 4 -2.30 -3.41 -2.03 8-Sep-01 4 0.07 0.05 0.13 Sat 8-Sep-01 4 -2.67 -3.02 -2.08 9-Sep-01 4 0.16 0.23 0.39 Sun 9-Sep-01 4 -1.85 -1.47 -0.93
4 Average 0.13 0.09 0.18 10-Sep-01 5 10-Sep-01 5 11-Sep-01 5 11-Sep-01 5 12-Sep-01 5 12-Sep-01 5 13-Sep-01 5 0.17 0.38 0.07 Thur 13-Sep-01 5 -1.80 -0.98 -2.67 14-Sep-01 5 0.15 0.07 0.10 Fri 14-Sep-01 5 -1.93 -2.69 -2.27 15-Sep-01 5 0.20 0.13 0.15 Sat 15-Sep-01 5 -1.61 -2.04 -1.92 16-Sep-01 5 0.29 0.11 0.11 Sun 16-Sep-01 5 -1.25 -2.17 -2.17
5 Average 0.20 0.17 0.11 17-Sep-01 6 0.35 0.13 0.14 Mon 17-Sep-01 6 -1.05 -2.02 -2.00 18-Sep-01 6 18-Sep-01 6 19-Sep-01 6 0.18 0.18 0.10 0.10 Wed 19-Sep-01 6 -1.71 -1.71 -2.32 -2.28 20-Sep-01 6 0.59 0.30 0.58 0.11 Thur 20-Sep-01 6 -0.53 -1.19 -0.54 -2.21 21-Sep-01 6 21-Sep-01 6 22-Sep-01 6 22-Sep-01 6 23-Sep-01 6 23-Sep-01 6
6 Average 0.37 0.24 0.27 0.116 continued

Joseph Frank April 9, 2002 Page 4 Table 2. Continued. ppbv ln(ppbv)
DATE Week PVW UWC SHA ABD DATE Week PVW UWC SHA ABD
24-Sep-01 7 24-Sep-01 7 25-Sep-01 7 25-Sep-01 7 26-Sep-01 7 0.17 0.60 0.45 0.25 Wed 26-Sep-01 7 -1.79 -0.52 -0.81 -1.37 27-Sep-01 7 0.08 0.09 0.12 Thur 27-Sep-01 7 -2.48 -2.38 -2.10 28-Sep-01 7 0.08 0.10 0.15 Fri 28-Sep-01 7 -2.48 -2.32 -1.88 29-Sep-01 7 0.11 0.19 0.19 Sat 29-Sep-01 7 -2.20 -1.67 -1.64 30-Sep-01 7 0.15 0.07 0.06 Sun 30-Sep-01 7 -1.93 -2.65 -2.87
7 Average 0.12 0.60 0.18 0.16 1-Oct-01 8 1-Oct-01 8 2-Oct-01 8 2-Oct-01 8 3-Oct-01 8 3-Oct-01 8 4-Oct-01 8 4-Oct-01 8 5-Oct-01 8 5-Oct-01 8 6-Oct-01 8 6-Oct-01 8
8 Average 7-Oct-01 9 0.06 0.07 0.10 0.04 Sun 7-Oct-01 9 -2.80 -2.73 -2.34 -3.17 8-Oct-01 9 0.05 0.05 0.05 0.06 Mon 8-Oct-01 9 -3.04 -2.91 -3.02 -2.75 9-Oct-01 9 0.09 0.07 0.07 0.10 Tue 9-Oct-01 9 -2.44 -2.73 -2.73 -2.27
10-Oct-01 9 0.10 0.07 0.11 0.11 Wed 10-Oct-01 9 -2.29 -2.70 -2.24 -2.20 9 Average 0.07 0.06 0.08 0.08
Mean of week means 0.564 0.817 0.500 0.179 Overall mean of days -1.43 -0.98 -1.69 -2.12SD of week means 0.736 0.862 0.743 0.131 Overall SD of days 1.14 1.41 1.23 0.60Max of week means 2.014 2.077 2.297 0.436 n days 31 19 29 21n weeks 8 6 8 6 95th %ile of week means 1.96 2.55 1.91 0.44 90% tol limit on 95th %ile 2.59 3.48 2.55 0.58 Max of days 3.17 4.35 2.94 0.44 95th %ile of days 1.65 4.37 1.51 0.34 90% tol limit on 95th 2.56 8.77 2.43 0.44

Joseph Frank April 9, 2002 Page 5 Table 3. Daily concentrations and intermediate calculations for Santa Maria. ppbv ln(ppbv)
DATE Week BLO AGC EDW PNT DATE Week BLO AGC EDW PNT 23-Aug-01 2 0.04 0.03 0.02 Thur 23-Aug-01 2 -3.12 -3.47 -4.07 24-Aug-01 2 0.03 0.13 1.02 Fri 24-Aug-01 2 -3.44 -2.01 0.02 25-Aug-01 2 0.68 0.11 0.69 Sat 25-Aug-01 2 -0.39 -2.23 -0.38 26-Aug-01 2 3.46 0.13 1.33 0.34 Sun 26-Aug-01 2 1.24 -2.02 0.29 -1.08
2 Average 1.05 0.10 0.76 0.34 27-Aug-01 3 2.09 0.14 0.98 0.68 Mon 27-Aug-01 3 0.74 -2.00 -0.02 -0.38 28-Aug-01 3 0.19 0.06 0.44 0.10 Tue 28-Aug-01 3 -1.67 -2.88 -0.81 -2.28 29-Aug-01 3 0.34 0.02 0.32 1.29 Wed 29-Aug-01 3 -1.08 -3.73 -1.14 0.25 30-Aug-01 3 0.30 0.06 0.58 1.68 Thur 30-Aug-01 3 -1.19 -2.78 -0.54 0.52 31-Aug-01 3 31-Aug-01 3 1-Sep-01 3 1-Sep-01 3 2-Sep-01 3 2-Sep-01 3
3 Average 0.73 0.07 0.58 0.94 3-Sep-01 4 3-Sep-01 4 4-Sep-01 4 0.07 0.05 0.30 0.22 Tue 4-Sep-01 4 -2.70 -3.10 -1.22 -1.51 5-Sep-01 4 0.17 0.05 0.09 0.43 Wed 5-Sep-01 4 -1.80 -3.08 -2.42 -0.85 6-Sep-01 4 0.21 0.13 0.59 0.51 Thur 6-Sep-01 4 -1.55 -2.01 -0.52 -0.67 7-Sep-01 4 0.11 0.20 Fri 7-Sep-01 4 -2.19 -1.59 8-Sep-01 4 8-Sep-01 4 9-Sep-01 4 9-Sep-01 4
4 Average 0.14 0.07517 0.30 0.39 10-Sep-01 5 10-Sep-01 5 11-Sep-01 5 1.47 0.15 1.30 1.81 Tue 11-Sep-01 5 0.38 -1.90 0.26 0.59 12-Sep-01 5 0.21 0.68 0.78 Wed 12-Sep-01 5 -1.57 -0.39 -0.25 13-Sep-01 5 0.40 0.21 0.64 0.59 Thur 13-Sep-01 5 -0.91 -1.57 -0.44 -0.54 14-Sep-01 5 0.51 0.20 1.01 1.07 Fri 14-Sep-01 5 -0.67 -1.63 0.01 0.07 15-Sep-01 5 15-Sep-01 5 16-Sep-01 5 0.78 16-Sep-01 5 -0.25
5 Average 0.79 0.19 0.91 1.06 17-Sep-01 6 0.31 0.14 0.54 0.57 Mon 17-Sep-01 6 -1.18 -1.94 -0.62 -0.57 18-Sep-01 6 0.33 0.37 0.83 Tue 18-Sep-01 6 -1.12 -1.01 -0.19 19-Sep-01 6 0.42 0.30 0.49 Wed 19-Sep-01 6 -0.87 -1.22 -0.72 20-Sep-01 6 20-Sep-01 6 21-Sep-01 6 21-Sep-01 6 22-Sep-01 6 22-Sep-01 6 23-Sep-01 6 23-Sep-01 6
6 Average 0.35 0.27 0.62 0.57 continued

Joseph Frank April 9, 2002 Page 6 Table 3. Continued. ppbv ln(ppbv)
DATE Week BLO AGC EDW PNT DATE Week BLO AGC EDW PNT
24-Sep-01 7 2.22 0.20 4.09 1.24 Mon 24-Sep-01 7 0.80 -1.62 1.41 0.22 25-Sep-01 7 1.12 7.08 Tue 25-Sep-01 7 0.11 1.96 26-Sep-01 7 0.34 0.42 11.15 0.55 Wed 26-Sep-01 7 -1.09 -0.87 2.41 -0.60 27-Sep-01 7 1.20 0.72 4.05 0.83 Thur 27-Sep-01 7 0.18 -0.33 1.40 -0.19 28-Sep-01 7 28-Sep-01 7 29-Sep-01 7 29-Sep-01 7 30-Sep-01 7 4.55 6.08 2.69 Sun 30-Sep-01 7 1.52 1.81 0.99
7 Average 1.89 0.45 6.49 1.33 1-Oct-01 8 0.24 0.90 0.38 1.98 Mon 1-Oct-01 8 -1.44 -0.11 -0.98 0.68 2-Oct-01 8 0.52 1.16 0.68 1.85 Tue 2-Oct-01 8 -0.65 0.15 -0.39 0.62 3-Oct-01 8 0.24 0.48 0.22 1.43 Wed 3-Oct-01 8 -1.45 -0.74 -1.52 0.36 4-Oct-01 8 4-Oct-01 8 5-Oct-01 8 5-Oct-01 8
8 Average 0.33 0.85 0.42 1.75 6-Oct-01 9 0.58 0.08 0.36 0.82 Sat 6-Oct-01 9 -0.54 -2.58 -1.03 -0.20 7-Oct-01 9 0.52 0.21 0.93 Sun 7-Oct-01 9 -0.66 -1.56 -0.07 8-Oct-01 9 0.21 0.17 0.26 0.21 Mon 8-Oct-01 9 -1.57 -1.79 -1.34 -1.57 9-Oct-01 9 1.04 0.39 0.82 2.26 Tue 9-Oct-01 9 0.04 -0.95 -0.20 0.82
9 Average 0.59 0.21 0.48 1.06
Mean of week means 0.73 0.28 1.32 0.93 Overall mean of days -0.86 -1.80 -0.37 -0.24 SD of week means 0.55 0.26 2.10 0.48 Overall SD of days 1.17 0.98 1.31 0.82 Max of week means 1.89 0.85 6.49 1.75 n days 31 28 30 24 n weeks 8 8 8 8 95th %ile of week means 1.77 0.77 5.29 1.85 90% tol limit on 95th %ile 2.25 1.00 7.10 2.26 95th %ile of days 3.10 0.87 6.42 3.24 Max of days 4.55 1.16 11.15 2.69 90% tol limit on 95th 4.85 1.28 10.57 4.62