descriptors author manuscript nih public access exhibit ...€¦ · in combination with...
TRANSCRIPT

Alpha shapes applied to molecular shape characterizationexhibit novel properties compared to established shapedescriptors
J. Anthony Wilson1, Andreas Bender2, Taner Kaya1, and Paul A. Clemons*,1
1Chemical Biology Program, Broad Institute of Harvard and MIT, 7 Cambridge Center,Cambridge, MA, 02142, United States of America2Leiden/Amsterdam Center for Drug Research, Pharma-IT Platform & Division of MedicinalChemistry, Boelelaan 1083A, 1081 HV Amsterdam
AbstractDespite considerable efforts, description of molecular shape is still largely an unresolved problem.Given the importance of molecular shape in the description of spatial interactions in crystals orligand-target complexes, this is not a satisfying state. In the current work, we propose a novelapplication of alpha shapes to the description of the shapes of small molecules. Alpha shapes areparameterized generalizations of the convex hull. For a specific value of α, the alpha shape is thegeometric dual of the space-filling model of a molecule, with the parameter α allowing descriptionof shape in varying degrees of detail. To date, alpha shapes have been used to findmacromolecular cavities and to estimate molecular surface areas and volumes. We developed anovel methodology for computing molecular shape characteristics from the alpha shape. In thiswork, we show that alpha-shape descriptors reveal aspects of molecular shape that arecomplementary to other shape descriptors, and that accord well with chemists’ intuition aboutshape. While our implementation of alpha-shape descriptors is not computationally trivial, wesuggest that the additional shape characteristics they provide can be used to improve andcomplement shape-analysis methods in domains such as crystallography and ligand-targetinteractions. In this communication, we present a unique methodology for computing molecularshape characteristics from the alpha shape. We first describe details of the alpha-shape calculation,an outline of validation experiments performed, and a discussion of the advantages and challengeswe found while implementing this approach. The results show that, relative to known shapecalculations, this method provides a high degree of shape resolution with even small changes inatomic coordinates.
Keywordsalpha shapes; cheminformatics; molecular descriptors; molecular shape; small-moleculeconformation
*Corresponding author: [email protected] Information AvailableSupplementary Tables referenced in the text, as well as structure-definition format (SDF) files containing 3D conformations for allcompounds used in this study are provided. Supplementary Table Legends and details of SDF file contents are provided as asupporting Word Document. This information is available free of charge via the Internet at http://pubs.acs.org/.
NIH Public AccessAuthor ManuscriptJ Chem Inf Model. Author manuscript; available in PMC 2011 August 19.
Published in final edited form as:J Chem Inf Model. 2009 October ; 49(10): 2231–2241. doi:10.1021/ci900190z.
NIH
-PA Author Manuscript
NIH
-PA Author Manuscript
NIH
-PA Author Manuscript

IntroductionIn cheminformatics research, it is of significant importance to characterize, analyze, andpredict properties that describe the shape of molecules.1 This is particularly true in cases ofmolecular interactions, such as in the solid state of homogeneous materials where molecularinteractions determine properties such as melting points.2,3 More important for this study areheterogeneous environments where the shape of two distinct molecular entities, usually asmall-molecule ligand and the cavity of a protein target, are relevant for molecularrecognition.4 While shape is a crucial component of such intermolecular interactions (theother important aspect being the type of property the molecule exhibits at each point inspace, such as its electrostatic properties5–7), methods to describe molecular shape conciselyare still not ideal. The main problems derive from the fact that shape descriptions must betranslationally and rotationally invariant, and that molecular shape is rather difficult todescribe due to inherent conformational flexibility.5
During the last twenty years, a variety of molecular shape descriptions have been devised.An early shape description was implemented in the CoMFA (comparative molecular fieldanalysis) algorithm,8 which describes molecules by steric and electrostatic fields, butrequires time-consuming alignment of molecules. While the evaluation of electrostatic andshape similarity at pre-defined grid points takes considerable time to evaluate (particularlyin combination with quantum-mechanical electron distributions), the introduction ofGaussian functions for the calculation of both shape and electrostatic similarity eases thiscomputational burden and speeds up CoMFA analysis considerably.9,10 However, alignmentof molecules still proves to be a cumbersome step. As a result, so-called “alignment-free”molecular descriptions were developed, in which the density function of a molecularproperty at a fixed distance (but not a fixed coordinate) from a different point of themolecule is calculated. Early methods included autocorrelations of surface properties,11
descriptors based on mapping atom properties to molecular surfaces (“MaP” descriptors)12,and development of radial distribution functions for all combinations of surface properties.12
More recently, “recycling” of alignments13 was proposed to speed up shape comparisonswhile giving better than 80% “hit” list overlap with a ROCS (Rapid Overlay of ChemicalStructures) alignment procedure (OpenEye Scientific Software; Santa Fe, NM).
Analogous to 2D fragment-based fingerprints, a variety of 3D shape fingerprints weredeveloped based on different assumptions. By using a “reference shape library” of severalthousand molecules,14 a molecule can be represented by its similarity (measured as overlapabove a threshold using Gaussian functions) to the reference panel—the result is a bit-stringdescribing the new shape. A method termed “ultra-fast shape recognition” (USR)15
exploited the fact that not all pairwise atomic center distances need be used to describeshape. USR calculates all atomic distances from just four predefined molecular locations:the molecular centroid, the closest atom to the centroid, the farthest atom from the centroid(termed “fct”), and the farthest atom from fct. These locations represent the center of themolecule and its extremes. Each set of distances is then characterized as a histogram andfirst through third moments calculated. Thus, each molecule is described by 3 moments from4 distance histograms, enabling descriptor calculation for thousands of molecules per secondand shape comparisons for millions of molecule pairs in seconds on a single CPU. This 3DUSR descriptor was used in combination with conventional MACCS keys, which are abinary presence/absence description of 2D molecular fragments.16 The resulting MACCS/USR hybrid descriptors outperformed pure USR descriptors in a series of retrospectivevirtual screening experiments.16 This result underlines the importance of using differentdescriptor spaces—both 2D and 3D—that capture different aspects of molecular structure.
Wilson et al. Page 2
J Chem Inf Model. Author manuscript; available in PMC 2011 August 19.
NIH
-PA Author Manuscript
NIH
-PA Author Manuscript
NIH
-PA Author Manuscript

Given that existing descriptions of molecular shape are not ideal (both in the sense ofpredictive power of a shape-derived property and their practical ease of handling), wepropose a novel application and characterization of alpha shapes17 to the description ofsmall molecules. Alpha shapes, which are parameterized (α) generalizations of the convexhull, were originally conceived of in two dimensions17,18 and later expanded to threedimensions.19 As α approaches infinity the alpha shape is identical to the convex hull. As αdecreases the shape shrinks by developing concavities and voids. As α approaches zero thealpha shape is the original point set S, and for other values intermediate shapes are formed.Each point set S will have a finite set of α describing all the alpha shapes in the alphacomplex of S. An intuitive notion is to think of α as the radius of a sphere centered on eachmember of S (for example see, Edelsbrunner et. al.20). An interesting observation occurswhen α corresponds to the spheres of a space filling model. In this case (formally applicableonly to hydrocarbons) the alpha shape is said to be the geometric dual of the space-fillingmodel. That is, if α corresponds to the radii of a set of spheres in the space-filling model, theinformation contained in the alpha shape can be used to exactly describe the union ofspheres—it is a geometric dual. This relationship can be exploited in chemistry byconsidering relationships between the alpha-shape, ball-and-stick, space-filling model, andchemical graph representations (Figure 1).
The notion of alpha shapes is a formalization of the intuitive notion of “shape” for spatialpoint sets. An alpha shape is a concrete geometric model which is mathematically welldefined and unique for a given point set. This stands in contrast to other methods, such asisosurfaces and accessible surface area, which are approximations and dependent upon setsof poorly defined variables. Thus far, alpha shapes have been used in many diversedisciplines. Visualization of the relationships among data points in 2D and 3D is often a firststage of statistical inference. To this end, alpha shapes have been employed to visualize theirregular shape boundaries of clusters in 3D.21 Other researchers22 used alpha shapes tovisualize and characterize some simple properties of Brownian motion paths and concludedthat alpha shapes are an effective tool to measure the mass of a diffusing particle. In perhapsone of the most common applications of alpha shapes, a number of researchers in computergraphics developed methods to improve surface reconstruction from finitely sampledpoints.23–26 In the field of solid mechanics, alpha shapes have been used to improve surfaceinterpolation by avoiding linear displacement fields along convex boundaries.27 Alphashapes also provide more accurate linear interpolation over non-convex boundaries.28 Morerecently, in the area of image segmentation, alpha shapes have been used to reconstructboundaries from noisy, or otherwise non-optimal image segmentations.29 With respect toexperiments at the atomic level (as in this study), Zomorodian and coworkers30 used alphashapes to improve protein structure prediction with statistical potentials. These methods arecomputationally expensive due to the large number of atomic interactions, and alpha shapeswere used to filter the list of interacting atoms in a protein. The researchers concluded thatfiltering the dataset down to just 12.8% of the original resulted in scoring functions thatwere competitive with those derived from the full dataset. Alpha shapes have also been usedto study protein structures,31 pockets,32,33 surface area and volume,34 and packing.35
Relying on previous studies that characterized irregular pockets, voids, and depressions,32
Liang and coworkers35 examined the notion of packing in proteins. They found that proteinsresemble randomly packed spheres rather than a jig-saw puzzle. With cavities and voids inthe protein core contributing to densities that are not homogeneous. Further, by looking atproteins of various sizes, they concluded that small proteins are denser than larger ones.
In this communication, we present our reference compound data and descriptor sets. Wethen explain the preprocessing methods that are necessary for using alpha shapes to calculatemolecular shape using a joint density between alpha-shape facet normals and facet distances,a method we term alpha-shape joint density (AJD). This exposition is followed by a
Wilson et al. Page 3
J Chem Inf Model. Author manuscript; available in PMC 2011 August 19.
NIH
-PA Author Manuscript
NIH
-PA Author Manuscript
NIH
-PA Author Manuscript

description of how we calculate distance between molecular AJD using the Earth-Mover’sDistance (EMD),36,37 both among all pairwise shape representations and to two a priorishapes. When taken alone, our results show that the AJD method is keenly sensitive tomolecular shape, but we believe that a complete representation of small molecules can onlyresult as a combination of descriptors.
MethodsReference compound collections
To investigate the behavior of alpha shapes for molecular shape description, we used threesets of compounds. One set comprises multiple conformers of each of the 16 structuralisomers of octane (OCT; see Supplementary Table S1), with increasing alkyl-branching anddecreasing number of rotatable bonds. For each isomer, we used the Molecular OperatingEnvironment (MOE 2007.09; Chemical Computing Group; Montreal, QC, CA) to build aconformational pool by systematically varying each rotatable bond by 60° torsionalincrements (Supplementary Table S2). Resulting conformers were energy minimized using athree-step free-energy minimization procedure.38 To reduce the total number of conformersper isomer while keeping maximum conformational coverage, we first filtered using thetorsional space, binning each rotatable bond into 40° torsions per angle and selectingconformations representative of each unique combination of torsion angles for eachmolecule. To eliminate identical conformers related by symmetry, we superposed alltorsional bin representatives and eliminated duplicates using pairwise RMSD among theatomic coordinates. For the figures presented in this study, we focused on four octanes,including one enantiomeric pair, sharing a terminal tert-butyl function (2,2-dimethylhexane(5), 2,2,4-trimethylpentane (13), (R)-2,2,3-trimethylpentane (12), and (S)-2,2,3-trimethylpentane (12*)), and representing a total of 37 unique conformations. This smallcollection allows us to explore relatively small topological and conformational changes in aclosely related set of compounds. The second set is a collection of 388 known biologicallyactive (BIO) compounds with a large number of potential shapes to compare.39 In addition,we used a diverse set of 22,831 compounds from ChemBank from several synthetic andnatural sources for algorithm development. These compounds represent several sources andsynthetic methods including natural products, commercial vendor libraries, and productsresulting from diversity-oriented organic syntheses.40 We performed filtering on the twolatter compound collections by removing compounds with metals, compounds with fewerthan 6 heavy atoms, and those for which no stable conformation could be generated. Thesefiltering steps resulted in the final numbers of compounds indicated in the Figures andFigure Legends.
Reference descriptor setsFor comparative descriptor sets, we used published methods and commercially availablesoftware. First, we implemented a normalized principal moments-of-inertia (PMIs) ratiomethod.41 To do this, we calculated the ratios of the smallest and medium eigenvalues of thediagonalized mass tensor to the largest (i.e., X = Ismall/Ilarge, Y = Imedium/Ilarge). The Ycoordinate of these ratios was then scaled by to produce an equilateral PMI space,allowing meaningful Euclidean distances between compounds to be computed in theresulting PMI space. Second, we implemented a recently published descriptor termedUltrafast Shape Recognition (USR).15 Third, we calculated the functional class fingerprints(FCFP6s; Pipeline Pilot/Accelrys 7.0.1; San Diego, CA; USA), which are amenable toTanimoto similarity analysis.42,43 Finally, we calculated the descriptors from MOE(Molecular Operating Environment 2007.09; Chemical Computing Group, Montreal,Quebec, Canada) listed in Supplementary Table 3. These latter descriptors were individuallycorrelated using Kendall’s Tao44,45 with the EMD of each compound to a set of reference
Wilson et al. Page 4
J Chem Inf Model. Author manuscript; available in PMC 2011 August 19.
NIH
-PA Author Manuscript
NIH
-PA Author Manuscript
NIH
-PA Author Manuscript

shape priors (vide infra). Calculation of PMI, USR, and Tanimoto distances, hierarchicalclustering, and statistical analysis were performed in MATLAB R2008s (version 7.6.0.324;The MathWorks; Natick, MA; USA).
Alpha-shape facet and surface normal calculationStarting from a structure-data format (SDF) file representing the 22,831 diverse ChemBankcompounds (vide supra), we extracted the 3D molecular coordinates, and calculated thealpha-shape indices. These indices are triplets which indicate each facet of the surface of thealpha-shape. We used code provided in the Computational Geometry Algorithms Library(CGAL 3.3.1)46 to calculate each alpha shape. This library provides the option to selectfrom all possible values of α the one α that is optimal for a given S. This optimal value is thesmallest α within all α’s that constrain all points in S to the interior or the surface of thealpha shape, leaving no disjoint members of S. With the resultant facets comprising thesurface, we calculated normal vectors for each facet across the entire shape. However, oneproblem with this approach is that the indices for facet construction are returned witharbitrary handedness. To resolve this problem we used ray-tracing and the parity ofintersections to determine which side of each facet is facing “outward.” This methodresolved the handedness of 99.3% of the facet normals. The remaining 0.7% of facets haveambiguous parity information (e.g., 1/1, 2/2, etc.). To assign correct handedness for theseremaining ambiguous facets, we examined the parity of their intersecting facets. With parityand location information—in front or behind—a vote on the handedness of the ambiguousfacet was cast. When all intersecting facets were examined, the final tally of votes was usedto set the handedness. With this method we unambiguously resolved 85% of the 0.7%, thus0.105% of total facets remained unresolved. This is an exceedingly small number given thatthese remaining facets are spread over a large number of compounds. Thus, the occurrenceof more than one unresolved facet within one compound is small. A final class of facets thatwe addressed was planar facets, i.e., parts or whole compounds that have no 3D volume.These facets were detected in two ways: facets whose ray-tracing parity revealed nointersections and facets with only two of three sides connected. We address these facets byincluding a surface normal on both sides. In the analysis stage we include only the onenormal that satisfies a minimization of change in angle between the two normals.
Joint densities of distance and surface normal orientationOnce the surface normals were resolved for handedness, we used them—in conjunction withdistance information—to calculate the shape of each compound. With every facet as astarting point, we calculated the Euclidean distance to all other facets using the facet inter-centroid distances. Ranking these distances, we then calculated the angle between facetnormals, expressing change in orientation in terms of change in distance (Figure 2). Theresult is a bivariate dataset with sorted distances and each change in orientation (ΔΘ).Similar analyses in 2D have been conducted on image contours.47 To characterize therelationship between distance and orientation change, we generated the joint probabilityfunction with 24 fixed bins for orientation and 24 variable bins for distance. Allowing thebin centers to vary with distance gives the method a large degree of size independence,which is an intended consequence of this choice. Each location in this 24x24 matrixrepresents the probability of two events occurring simultaneously. For example, eachlocation in the joint density represents a unique probability of the combined change inorientation at a given distance.
Similarity between small-molecule joint densities using EMDTo determine the similarity/dissimilarity among the joint-probability functions we used amethod termed Earth-Mover’s Distance (EMD).36,37 With this method, the transportationsimplex between two distributions is solved for a given “ground distance.” The amount of
Wilson et al. Page 5
J Chem Inf Model. Author manuscript; available in PMC 2011 August 19.
NIH
-PA Author Manuscript
NIH
-PA Author Manuscript
NIH
-PA Author Manuscript

work required to move one distribution to match the other is the EMD. Traditionally, EMDhas been computationally too expensive to use in all but very size-limited datasets.However, Ling and Okada48 recently developed a tree-based algorithm that uses L1 (i.e.,city-block or Manhattan) ground distance which they termed EMD-L1. In ourimplementation (MATLAB mex) of the original algorithm37 a single EMD comparison inour configuration takes 1.41 seconds. Our current implementation of the source C++ code,48
as a loadable library in MATLAB for Windows, has reduced this to 0.005 seconds percomparison. This is a decrease of 282-fold in compute time, and allows us to make verylarge numbers of comparisons. With the calculated distances we then performed hierarchicalclustering to determine which groups of shapes can be resolved by this method.
Similarity of small-molecules to reference shape priorsWith this method we were also able to employ a second level of shape analysis. Wefollowed the lead of previous researchers41 in developing a small number of shapes that areused as reference points. To this end, we developed spherical and flat shape prior models todetermine the extent to which compounds are flat or spherical. For the spherical prior, wecalculated the joint probability of the arcsine and square root functions. The flat prior issimpler since the only variation will occur across distance. Using least-squares methods, weparametrically fit a gamma density function to only the distance data of all compounds. Thatis, we used one set of parameters for all compounds to characterize size change. The resultwas placed in the first column of a matrix the same size as the molecular joint densities withthe remainder being zeros. For each class of priors we calculated the distance from flat andspherical for every compound in our dataset using EMD. This gives us a measure to indicatehow spherical or flat a given compound is relative to the others.
ResultsAlpha-shapes discriminate topology, conformation, and stereochemistry amongconstitutional isomers
Using a reference set of octane conformations (OCT; see Methods), we compared pairwisedistances computed using EMD between alpha-shape joint density distributions (AJD-EMDs; Figure 3) to pairwise distances computed using PMI41 and USR15 shape descriptions(Figures 4 and 5, respectively). The motivation for using a small dataset was ease ofcharacterization and interpretation (See Methods). With only 4 different compounds and 37total conformations (see Supplementary Table S2), this set allows us to understand theprimary mechanisms of similarity exposed by our method. Specifically, we are interested incomparing similarities between conformers, stereoisomers, and geometric isomers betweenthe selected methods.
We find two primary results that are worth discussing here. First, we find that with AJD-EMD we can discriminate chemical “shapes” with high precision. That is, the shapes tend tobe well-distinguished from one another with even slight changes in atomic coordinates andwith little regard for topology (Figure 3). In contrast, PMI analysis shows that the resolvingpower of this method is coarse. Clusters of “shape” tend to be directly aligned withmolecular topology (Figure 4), with the exception of three conformers of 12 or 12* that tendto cluster with conformers of 13. A pattern intermediate to AJD and PMI emerges with ourimplementation of the USR algorithm (Figure 5), with the additional observation that theconformers of 5 are split into two distinct groups, as (to a lesser extent) are those of 13.Second, we find that with this test collection, AJD-EMD analysis easily reveals pairs ofconformations that are conformational enantiomers (pairs along the diagonal in Figure 3). Incontrast, other pairs of molecules sharing topology and even absolute stereochemistry arewell-resolved. Inspection of the dendrogram in Figure 3 shows how pairs of conformational
Wilson et al. Page 6
J Chem Inf Model. Author manuscript; available in PMC 2011 August 19.
NIH
-PA Author Manuscript
NIH
-PA Author Manuscript
NIH
-PA Author Manuscript

enantiomers are easily distinguished from all other pairs of conformers, both within andbetween distinct compounds. Notably, one pair of enantiomeric conformers did notnecessarily have similar values, due to the alpha-shapes having slightly different facetconfigurations; nevertheless, this pair remained closest to each other in EMD, just with ahigher value than the other pairs, which were all at or near zero. USR was also able todiscriminate enantiomeric conformers (pairs along the diagonal in Figure 5). However, thedistances between such pairs is not significant by this method and could result ininaccuracies if searching for conformational enantiomers. With PMI analysis, distancesamong conformers of the same molecule tend to be similar and difficult to distinguish,typically resulting in small distances among conformers of a given molecule. These resultsare confirmed with our larger dataset of bioactive compounds as well.
Alpha-shapes resolve diverse compounds into rational shape groupsUsing a reference set of bioactive compounds (BIO; see Methods), we compared pairwisedistances computed using AJD-EMDs (Figure 6a) to pairwise distances computed usingPMI and USR shape descriptions15,41 (Figure 7a and 8a, respectively) and pairwiseTanimoto distances computed on FCFP6 descriptors (Figure 9a; see Methods). The firstapparent observation with our method is that there are two distinct classes: perfectly flatcompounds and everything else. To examine this relationship more closely, we clusteredthese distances into the first five groups determined by hierarchical clustering with either adistance criterion (Figures 6a, 7a, and 9a, outlined boxes) or with a cophenetic (consistency)criterion49 (Figure 8a). For each cluster, we constructed a composite “member”. For AJDthis was done by summing the AJDs of all members and re-normalizing the densitydistributions. We chose representative compounds from each cluster with the minimumEMD to this composite AJD (Figure 6b). Examining these representative compounds revealsthat the trend from “globular” to flat is gradual. For comparison to these AJD-EMD results,we selected representative members of each of five clusters among PMI similarities (Figure7b) by choosing the compound closest to the cluster centroid for each cluster in the PMImap. Unlike the AJD-EMD, the PMI clusters do not display significant shape classes.However, there was a slight trend for the members of the fourth cluster (Figure 7a, whitebox and Supplementary Table S4) to be larger than the others across many calculateddescriptors (e.g., heavy atom counts, bond counts, and molecular volume). In addition, boththe fourth and fifth clusters (Figure 7a, white and magenta boxes, respectively) had asignificantly higher globularity than the other three clusters. We also compared members ofclusters derived from Tanimoto distances between FCFPs (Figure 9b), by choosingcompounds with the minimum average distance to all other compounds in the cluster. In theTanimoto distance-based clustering we failed to find any intuitive classes of shape, with thepossible exception of the first cluster (Figure 9a, red box), which contains a large number ofsmall compounds. Given that FCFP6 fingerprints are based on connectivity only this mightnot seem surprising. However, some kind of shape complementarity needs to be present forligand-target binding. Thus, paying attention to three-dimensional properties such as AJDdescriptors may prove beneficial. Our method of clustering these three datasets did notproduce reasonable clusters for the pairwise distances calculated using USR, so we used aslightly different clustering method for USR with a cophenetic (consistency) criterion,49 andthen chose representative members of each of the resulting six clusters (Figure 8a) bysumming and renormalizing the moments of all members of a cluster. The compounds withthe smallest distance to this composite USR compound were selected as representatives(Figure 8b). Like the PMI clusters, these USR clusters do not show a strong indication ofdistinct shape-classes, with the exception that there is a size bias with two of the largestcompounds in the collection being very different from all other compounds. This cluster oftwo members has 48.6% more atoms than the average of all other clusters. Two of theremaining clusters contain a large proportion of small compounds with 23.2% and 36.1% of
Wilson et al. Page 7
J Chem Inf Model. Author manuscript; available in PMC 2011 August 19.
NIH
-PA Author Manuscript
NIH
-PA Author Manuscript
NIH
-PA Author Manuscript

the number of atoms as the large-compound cluster. In addition, there is a trend among theclusters to show significant differences in size-related descriptors such as molecular weight,molecular surface area, polar surface area, solvent accessible volume, etc., indicative of asize bias in the USR method (see Supplementary Table 4).
Alpha-shapes provide complementary information to existing 2D and 3D shapedescriptors
To further understand how our method compares to other shape descriptors, we performedcomparative analyses between PMI, USR, Tanimoto FCFPs, and our method. To do this, wecompared the complete set of pairwise distances from our octane (OCT) test dataset betweenthe PMI, USR, and AJD methods (Figure 10). In the case of perfect informationcorrespondence, all data points would fall along the diagonal. Even for such a small andchemically homogeneous dataset there is significant departure from the diagonal. Toquantify this variation, we calculated the distance of each point perpendicular to the linearregression and computed descriptive statistics on these distances (Table 1). AJD and USR(Figure 10a) are the most similar of the three comparisons when considering just the slopeand intercept. However, this similarity becomes much less apparent when looking at thestatistics of the distances (Table 1). We performed the same analysis on our larger set ofbioactive (BIO) test compounds (Table 2). Any sign of a high degree of correspondencedisappears as the slopes flatten and spread increases. That is not to say that there is nocorrespondence as there are members along the diagonal. We were also concerned with howthe methods may differ so we examined compounds that lie at the extrema (the 4 corners) ofthese comparisons. These corners represent areas where the methods are in good agreement(compounds are deemed to be similar or dissimilar with both methods) or disagreement(compounds are similar with one method and dissimilar with another and vice versa), andwe identified compounds by their normalized distances from these extrema for a comparisonof AJD and USR (Table 3). In order, the rows of the table represent the compounds that bothmethods determined to be similar (small distance), both methods deemed to be dissimilar(large distance), and where the methods differed (one large distance and the other a smalldistance). The first case, where both methods determined compound were similar, is not asurprising finding given that earlier results (vide supra) showed that these methods aresensitive to compounds that are stereoisomers. In the case where both methods agreed thatboth compounds were different is a marked size change (and for AJD one compound isplanar and other a long chain of rotatable carbons—pentadecane). Finally, in the caseswhere the methods differed markedly is the instance of a large AJD and a small USRdistance. There does not appear to be much difference between the molecules, but oneconformation is perfectly flat while the other is not. Thus, they have no overlapping binlocations in the joint density. Conversely, in the case with a small AJD and a large USRdistance shows the size dependence of the USR method. USR determines that these are verydifferent shapes because one is much longer than the other despite having similar overallshapes.
Alpha-shapes provide information similar to a small number of existing descriptorsThe correlations of our derived AJD flat and spherical prior comparisons with 183descriptors from MOE reveals further relationships between the AJD description andexisting descriptors (Figure 11). The values are sorted in ascending order of the totalabsolute values of spherical and flat correlation. The descriptors with high correlations showthat spherical shape correlates well with ‘globularity’, ‘standard dimension 3’, and ‘BCUT3’ descriptors.50 These descriptors are meant to compare the extent to which compoundscontain volume that extends into the third dimension. Comparing the same descriptors to theflat prior shows a strong negative correlation since these flat compounds have little or novolume in the third dimension. Lower in the sorted correlation list, the flat prior shows a
Wilson et al. Page 8
J Chem Inf Model. Author manuscript; available in PMC 2011 August 19.
NIH
-PA Author Manuscript
NIH
-PA Author Manuscript
NIH
-PA Author Manuscript

positive correlation with the zero dimensional BCUT descriptor and the spherical priorshows a negative correlation with this descriptor. That is, some of the descriptors show ahigh degree of intuitive similarity with the AJD-prior method. However, taking all these flatand spherical correlations into account, there is a −0.84 normalized covariance between thetwo, showing that our two priors do share quite a bit of information. This is evident becausea positive correlation in one prior often leads to a negative correlation in the other. However,across all descriptors the spherical prior shows an average correlation of 0.086 and the flatprior an average of −0.023. Thus, there are a small number of descriptors that are capturingthe similarities between existing methods and alpha shapes.
DiscussionWe developed a novel alignment-free method of describing and comparing molecular shapethat is rotation- and size pseudo-invariant. Making use of computational geometry andsurface characterization techniques, we have shown that our method is keenly sensitive tomolecular shape variations, including the ability to resolve constitutional isomers andmolecular coordinates differing only in stereochemistry and conformation. Specifically, weshowed that our method discriminates enantiomeric poses from other conformations of thesame compound, using a reference set of different poses among constitutional isomers. For adiverse reference set of bioactive compounds, a high-level analysis using this methoddifferentiates flat compounds from everything else. As our resolution of similarity increases,we see a gradual change in shape from globular to flat when pairwise EMDs are clusteredinto five groups. We also showed that our method of determining distance from twopreconceived reference shapes offers an alternative, to a good degree orthogonal, measurecompared with most existing shape descriptors—globularity being one of the existingdescriptors exhibiting a high degree of similarity. Finally, we compared our shape descriptorto existing algorithms with the hypothesis of a large degree of overlap between them. Whilethis is sometimes the case, we also find considerable disagreement for many pairs ofmolecules.
To date, we have relied on two sources of open source code for calculating alpha shapes.One is C source that was written by Ken Clarkson thirteen years ago (recently found here:http://www.netlib.org/voronoi/hull.html). The second is the Computational GeometryAlgorithms Library (CGAL 3.3.1), written in C++.46,51 However, as our developmentprogressed, we moved to exclusive usage of the CGAL implementation, meaning that welack control of this aspect of our algorithm. In general, this has not been a problem, but wedid fail to have identical alpha-shapes with one pair of conformational enantiomers with ouroctane dataset. We are currently examining this issue. With our current configuration,following considerable optimization, our runtime is about 1.7 seconds per compound. This isthe total time from the start of reading the SDF file to the end of EMD calculations versusour flat and spherical shape priors. Clearly, we would like to reduce this time further. Wehave observed that a large portion of the time is spent with file I/O in calculating alpha-shapes.
We have shown that the AJD descriptor does share information with existing descriptors.For example, both AJD and USR descriptors well discriminate conformational enantiomersfrom other conformations. However, due to the nature of the USR descriptor, it contains asize bias that the AJD descriptor avoids. The AJD method, being nearly size-independent, ismore sensitive to changes in global shape than, say, the number of atoms. We showed thisby pairing compounds of dissimilar results between the methods. In Table 3, a small AJDand a large USR shows compounds that are in “curved” conformations (i.e., “banana-like”),but markedly differ in size. Thus, the combination of varying descriptors—both 2D and 3D—that capture different aspects of molecular structure could result in a more complete
Wilson et al. Page 9
J Chem Inf Model. Author manuscript; available in PMC 2011 August 19.
NIH
-PA Author Manuscript
NIH
-PA Author Manuscript
NIH
-PA Author Manuscript

molecular description (as illustrated recently52,53). Combining similar and dissimilardescriptors could happen in a number of ways depending on which molecular characteristicsare deemed important for a particular physical or biological property. For example, the AJDdescriptor is pseudo-size independent but there may be instances where size is important—along with shape. Thus, combining AJD with other descriptors that determine size (e.g.,molecular weight, volume, and heavy-atom count) would produce a hybrid description thatis sensitive to both properties. An additional area we have been examining is how thenumber of rotatable bonds can affect shape. Combining AJD with other descriptors that aresensitive to the number of rotatable bonds might thus result in a joint descriptor that capturesthe mutual information between shape and rotatable bonds. Another approach, which mightbe well-suited for examining certain libraries, would be to perform alpha-shape analysis onmolecular skeletons or scaffolds only. This would reduce the dependence of the result onflexibility due to rotation among side chains. In addition, combining dissimilar informationis statistically favorable since mutual information would be minimized. These combinationscould be done on an ad hoc basis, but future work will involve examining methods tocombine descriptors to produce a complete hybrid description of compounds. We also aimto examine how modern variants of alpha-shape calculation may benefit our algorithm, suchas employing weighted or conformational alpha shapes which may enhance the shapesensitivity of our method. Also, alpha shapes have been used to characterize many propertiesof proteins, including the categories of depressions, pockets, and voids. To date, there hasbeen no attempt to describe the shape of these potential binding sites. We plan to adapt ourmethod to characterize the shape of protein binding sites and thus complement smallmolecule ligand shape analyses.
ConclusionsWe have developed a method to describe the shape of small molecules. This method isextremely sensitive to changes in atomic coordinates. It was our aim to produce a shapedescriptor that would capture global information about shape. Given that current theorypredicts that compounds of a similar shape will produce similar biological activity webelieve that being able to search biological activity space with high precision is of utmostimportance. Unlike previously developed methods our method categorizes shapes into alogical continuum. We also found that our method does not correlate well with current 3Ddescriptors indicating that we are capturing shape information previously neglected.
Supplementary MaterialRefer to Web version on PubMed Central for supplementary material.
AcknowledgmentsThe authors would like to thank members of the Computational Chemical Biology Research Group at the BroadInstitute for insightful discussions and the anonymous reviewers for their comments. This work was supported bythe Broad Institute Center of Excellence in Chemical Methodology and Library Development (P50-GM069721)and the Broad Institute Exploratory Center for Cheminformatics Research (P20-HG003895). AB thanks the DutchTop Institute Pharma for support, project number: D1–105.
References1. Kortagere S, Krasowski MD, Ekins S. The importance of discerning shape in molecular
pharmacology. Trends Pharmacol Sci. 2009; 30(3):138–47. [PubMed: 19187977]2. Bergstrom CA, Norinder U, Luthman K, Artursson P. Molecular descriptors influencing melting
point and their role in classification of solid drugs. J Chem Inf Comput Sci. 2003; 43(4):1177–85.[PubMed: 12870909]
Wilson et al. Page 10
J Chem Inf Model. Author manuscript; available in PMC 2011 August 19.
NIH
-PA Author Manuscript
NIH
-PA Author Manuscript
NIH
-PA Author Manuscript

3. Karthikeyan M, Glen RC, Bender A. General melting point prediction based on a diverse compounddata set and artificial neural networks. J Chem Inf Model. 2005; 45(3):581–90. [PubMed:15921448]
4. Gohlke H, Klebe G. Approaches to the description and prediction of the binding affinity of small-molecule ligands to macromolecular receptors. Angew Chem-Int Edit Engl. 2002; 41(15):2644–76.
5. Bender A, Mussa HY, Gill GS, Glen RC. Molecular surface point environments for virtualscreening and the elucidation of binding patterns (MOLPRINT 3D). J Med Chem. 2004; 47(26):6569–83. [PubMed: 15588092]
6. Clark T. QSAR and QSPR based solely on surface properties? J Mol Graph Model. 2004; 22(6):519–25. [PubMed: 15182811]
7. Cheeseright T, Mackey M, Rose S, Vinter A. Molecular field extrema as descriptors of biologicalactivity: definition and validation. J Chem Inf Model. 2006; 46(2):665–76. [PubMed: 16562997]
8. Cramer RD, Patterson DE, Bunce JD. Comparative Molecular-Field Analysis (COMFA).1. Effect ofShape on Binding of Steroids to Carrier Proteins. J Am Chem Soc. 1988; 110(18):5959–5967.
9. Good AC, Hodgkin EE, Richards WG. Utilization of Gaussian Functions for the Rapid Evaluationof Molecular Similarity. J Chem Inf Comput Sci. 1992; 32(3):188–191.
10. Good AC, Richards WG. Rapid Evaluation of Shape Similarity Using Gaussian Functions. J ChemInf Comput Sci. 1993; 33(1):112–116.
11. Wagener M, Sadowski J, Gasteiger J. Autocorrelation of Molecular-Surface Properties forModeling Corticosteroid-Binding Globulin and Cytosolic Ah Receptor Activity by NeuralNetworks. J Am Chem Soc. 1995; 117(29):7769–7775.
12. Stiefl N, Baumann K. Mapping property distributions of molecular surfaces: algorithm andevaluation of a novel 3D quantitative structure-activity relationship technique. J Med Chem. 2003;46(8):1390–407. [PubMed: 12672239]
13. Fontaine F, Bolton E, Borodina Y, Bryant SH. Fast 3D shape screening of large chemicaldatabases through alignment-recycling. Chemistry Central Journal. 2007; 1:12. [PubMed:17880744]
14. Haigh JA, Pickup BT, Grant JA, Nicholls A. Small molecule shape-fingerprints. J Chem InfModel. 2005; 45(3):673–84. [PubMed: 15921457]
15. Ballester PJ, Richards WG. Ultrafast shape recognition to search compound databases for similarmolecular shapes. J Comput Chem. 2007; 28(10):1711–23. [PubMed: 17342716]
16. Cannon EO, Nigsch F, Mitchell JB. A Novel Hybrid Ultrafast Shape Descriptor Method for use inVirtual Screening. Chemistry Central Journal. 2008; 2(1):3. [PubMed: 18282294]
17. Edelsbrunner H, Kirkpatrick DG, Seidel R. On the shape of a set of points in the plane. IEEETransactions on Information Theory. 1983; IT-29(4):551–559.
18. Edelsbrunner H. The union of balls and its dual shape. Annual Computational Geometry. 1993;9:218–231.
19. Edelsbrunner H, Mucke EP. Three-dimensional alpha shapes. ACM Trans Graphics. 1994; (13):43–72.
20. Edelsbrunner, H.; Facello, M.; Fu, P.; Liang, J. Measuring Proteins and Voids in Proteins.Proceedings of the 28th Annual Hawaii International Conference on Systems Sciences; 1995. p.256-264.
21. Lucieer, A.; Kraak, MJ. Alpha - shapes for visualizing irregular shaped class clusters in 3D featurespace for classification of remotely sensed imagery. In: Erbacher, RF.; Chen, PC.; Roberts, JC.;Gröhn, MT.; Börner, K., editors. IS&T SPIE international sympoium on Electronic Imaging. SanJose, California: 2004. p. 201-211.
22. Moran, PJ.; Wagner, M. Introducing alpha shapes for the analysis of path integral Monte Carloresults. Proceedings of the conference on Visualization; Washington, D.C: IEEE ComputerSociety Press; 1994. p. 52-59.
23. Cazals F, Giesen J, Pauly M, Zomorodian A. The conformal alpha shape filtration. Visual Comput.2006; 22(8):531–540.
24. Guo B, Menon J, Willette B. Surface Reconstruction Using Alpha Shapes. Computer GraphicsForum. 1997; 16:177–190.
Wilson et al. Page 11
J Chem Inf Model. Author manuscript; available in PMC 2011 August 19.
NIH
-PA Author Manuscript
NIH
-PA Author Manuscript
NIH
-PA Author Manuscript

25. Park SH, Lee SS, Kim JH. A surface reconstruction algorithm using weighted alpha shapes. LectNotes Artif Int. 2005; 3613:1141–1150.
26. Teichmann, M.; Capps, M. Surface reconstruction with anisotropic density-scaled alpha shapes.IEEE Visualization Proceedings of the conference on Visualization; IEEE Computer SocietyPress: Research Triangle Park; North Carolina, United States. 1998. p. 67-72.
27. Cueto E, Calvo B, Doblare M. Modelling three-dimensional piece-wise homogeneous domainsusing the alpha-shape-based natural element method. Int J Numer Meth Eng. 2002; 54(6):871–897.
28. Cueto E, Doblaré MLG. Imposing essential boundary conditions in the natural element method bymeans of density-scaled alpha-shapes. Int J Numer Meth Eng. 2000; 49(4):519–546.
29. Meine H, Köthe U, Stelldinger P. A topological sampling theorem for Robust boundaryreconstruction and image segmentation. Discrete Appl Math. 2009; 157(3):524–541.
30. Zomorodian A, Guibas L, Koehl P. Geometric filtering of pairwise atomic interactions applied tothe design of efficient statistical potentials. Comput Aided Geom Design. 2006; 23(6):531–544.
31. De-Alarcon PA, Pascual-Montano A, Gupta A, Carazo JM. Modeling shape and topology of low-resolution density maps of biological macromolecules. Biophys J. 2002; 83(2):619–32. [PubMed:12124252]
32. Edelsbrunner H, Facello M, Liang J. On the definition and the construction of pockets inmacromolecules. Discrete Appl Math. 1998; 88(1–3):83–102.
33. Liang J, Edelsbrunner H, Fu P, Sudhakar PV, Subramaniam S. Analytical shape computation ofmacromolecules: II. Inaccessible cavities in proteins. Proteins: Struct Funct Bioinform. 1998;33(1):18–29.
34. Liang J, Edelsbrunner H, Fu P, Sudhakar PV, Subramaniam S. Analytical shape computation ofmacromolecules: I. Molecular area and volume through alpha shape. Proteins: Struct FunctBioinform. 1998; 33(1):1–17.
35. Liang J, Dill KA. Are proteins well-packed? Biophys J. 2001; 81(2):751–766. [PubMed:11463623]
36. Rubner, Y.; Guibas, LJ.; Tomasi, C. The Earth Mover's Distance, Multi-Dimensional Scaling, andColor-Based Image Retrieval. ARPA Image Understanding Workshop; New Orleans, LA. 1997. p.661-668.
37. Rubner Y, Guibas LJ, Tomasi C. The earth mover's distance as a metric for image retrieval. Int JComput Vision. 2000; 40(2):99–121.
38. Gill, PE.; Murray, W.; Wright, MH. Practical optimization. Academic Press; London; New York:1981. p. xvip. 401
39. Bioactive Compounds. ChemBank.http://chembank.broad.harvard.edu/chemistry/search/execute.htm?id=5358370. Query for the testset of known bioactives. This set was filtered by removing compounds with metals and those withfewer than 6 heavy atoms. Further reduction was done to remove compounds that failed togenerate a stable conformation using MOE54
40. Development Compounds. ChemBank.http://chembank.broad.harvard.edu/chemistry/search/execute.htm?id=5358369. Query for thedevelopment set of small molecules. This set was intially filtered by removing compounds withmetals and those with fewer than 6 heavy atoms. Further reduction was done to removecompounds that failed to generate a stable conformation using MOE54
41. Sauer WH, Schwarz MK. Molecular shape diversity of combinatorial libraries: a prerequisite forbroad bioactivity. J Chem Inf Comput Sci. 2003; 43(3):987–1003. [PubMed: 12767158]
42. Bender A, Glen RC. Molecular similarity: a key technique in molecular informatics. Org BiomolChem. 2004; 2(22):3204–3218. [PubMed: 15534697]
43. Bender A, Young DW, Jenkins JL, Serrano M, Mikhailov D, Clemons PA, Davies JW.Chemogenomic data analysis: Prediction of small-molecule targets and the advent of biologicalfingerprints. Comb Chem High T Scr. 2007; 10(8):719–731.
44. Kendall M. A New Measure of Rank Correlation. Biometrika. 1938; 30:81–89.45. Kendall, M. Rank Correlation Methods. Charles Griffin And Co; London: 1948. p. 272
Wilson et al. Page 12
J Chem Inf Model. Author manuscript; available in PMC 2011 August 19.
NIH
-PA Author Manuscript
NIH
-PA Author Manuscript
NIH
-PA Author Manuscript

46. Fabri A, Giezeman G-J, Kettner L, Schirra S, Schönherr S. On the design of CGAL acomputational geometry algorithms library. Software--Practice and Experience. 2000; 30(11):1167–1202.
47. Geisler WS, Perry JS, Super BJ, Gallogly DP. Edge co-occurrence in natural images predictscontour grouping performance. Vision Res. 2001; 41(6):711–724. [PubMed: 11248261]
48. Ling H, Okada K. An Efficient Earth Mover's Distance Algorithm for Robust HistogramComparison. Trans on Pattern Anal and Machine Intel. 2007; 29(5):840–853.
49. Sokal RR, Rohlf FJ. The comparison of dendrograms by objective methods. Taxon. 1962; 11:33–40.
50. Pearlman RS, Smith KM. Novel Software Tools for Chemical Diversity. Perspect Drug Discov.1998; 9:339–353.
51. Fabri, A.; Giezeman, G-J.; Kettner, L.; Schirra, S.; Schönherr, S. The CGAL Kernel: A Basis forGeometric Computation. In: Lin, MC.; Manocha, DN., editors. Applied Computational GeometryTowards Geometric Engineering. Vol. 1148/1996. Springer; 1996. p. 191-202.
52. Bender A, Jenkins JL, Scheiber J, Sukuru SC, Glick M, Davies JW. How similar are similaritysearching methods? A principal component analysis of molecular descriptor space. J Chem InfModel. 2009; 49(1):108–19. [PubMed: 19123924]
53. Medina-Franco JL, Martinez-Mayorga K, Bender A, Marin RM, Giulianotti MA, Pinilla C,Houghten RA. Characterization of Activity Landscapes Using 2D and 3D Similarity Methods:Consensus Activity Cliffs. J Chem Inf Model. 2009; 49(2):477–491. [PubMed: 19434846]
54. Molecular Operating Environment, 2007.09. Chemical Computing Group; Montreal, Quebec,Canada: 2008.
Wilson et al. Page 13
J Chem Inf Model. Author manuscript; available in PMC 2011 August 19.
NIH
-PA Author Manuscript
NIH
-PA Author Manuscript
NIH
-PA Author Manuscript

Figure 1. Visual representations of structureFour different representations of the same structure illustrating the relationship of alphashapes to other methods of small-molecule structure depiction (hydrogen-suppressed): A)alpha shape, B) ball-and-stick model, C) space-filling model, D) hydrogen-suppressedmolecular graph.
Wilson et al. Page 14
J Chem Inf Model. Author manuscript; available in PMC 2011 August 19.
NIH
-PA Author Manuscript
NIH
-PA Author Manuscript
NIH
-PA Author Manuscript

Figure 2. Calculating relationships between distance and facet orientation changeA simple small-molecule alpha shape with surface normals. Distance (broken blue trace) andangle change (broken red trace) for each pair of surface normals is calculated. Jointprobability distributions are calculated based on all distance and angle change pairs.
Wilson et al. Page 15
J Chem Inf Model. Author manuscript; available in PMC 2011 August 19.
NIH
-PA Author Manuscript
NIH
-PA Author Manuscript
NIH
-PA Author Manuscript

Figure 3. Earth-mover’s distance (EMD) between alpha-shape joint density (AJD) distributionsHierarchal clustering of ADJ-EMD distances between octanes and octane conformations,including conformers of 5 (red branches), 12 or 12* (green branches), and 13 (bluebranches).
Wilson et al. Page 16
J Chem Inf Model. Author manuscript; available in PMC 2011 August 19.
NIH
-PA Author Manuscript
NIH
-PA Author Manuscript
NIH
-PA Author Manuscript

Figure 4. Distance relationships based on principal moment-of-intertia (PMI) ratios41 Hierarchal clustering of normalized PMI distances between octanes and octaneconformations, including conformers of 5 (red branches), 12 or 12* (green branches), and 13(blue branches).
Wilson et al. Page 17
J Chem Inf Model. Author manuscript; available in PMC 2011 August 19.
NIH
-PA Author Manuscript
NIH
-PA Author Manuscript
NIH
-PA Author Manuscript

Figure 5. Distance relationships based on ultra-fast shape recognition (USR) descriptors15 Hierarchal clustering of USR distances between octanes and octane conformations,including conformers of 5 (red branches), 12 or 12* (green branches), and 13 (bluebranches).
Wilson et al. Page 18
J Chem Inf Model. Author manuscript; available in PMC 2011 August 19.
NIH
-PA Author Manuscript
NIH
-PA Author Manuscript
NIH
-PA Author Manuscript

Figure 6. EMD-AJD pairwise distances for “bioactive” compounds(A) Hierarchical clustering of AJD-EMDs among 388 bioactive compounds resolvescompounds into groups with different shapes (colored boxes). (B) Representative structuresfrom each cluster (colors correspond to the boxes in A).
Wilson et al. Page 19
J Chem Inf Model. Author manuscript; available in PMC 2011 August 19.
NIH
-PA Author Manuscript
NIH
-PA Author Manuscript
NIH
-PA Author Manuscript

Figure 7. PMI pairwise distances for “bioactive” compounds(A) Hierarchical clustering of PMI-based distances among 388 bioactive compoundsresolved into five clusters (colored boxes). (B) Representative structures from each cluster(colors correspond to the boxes in A).
Wilson et al. Page 20
J Chem Inf Model. Author manuscript; available in PMC 2011 August 19.
NIH
-PA Author Manuscript
NIH
-PA Author Manuscript
NIH
-PA Author Manuscript

Figure 8. USR pairwise distances for “bioactive” compounds(A) Hierarchical clustering of USR-based distances among 388 bioactive compoundsresolved into six clusters (colored boxes); six clusters were chosen for comparison due to thesmall size of one of the clusters. (B) Representative structures from each cluster (colorscorrespond to the boxes in A).
Wilson et al. Page 21
J Chem Inf Model. Author manuscript; available in PMC 2011 August 19.
NIH
-PA Author Manuscript
NIH
-PA Author Manuscript
NIH
-PA Author Manuscript
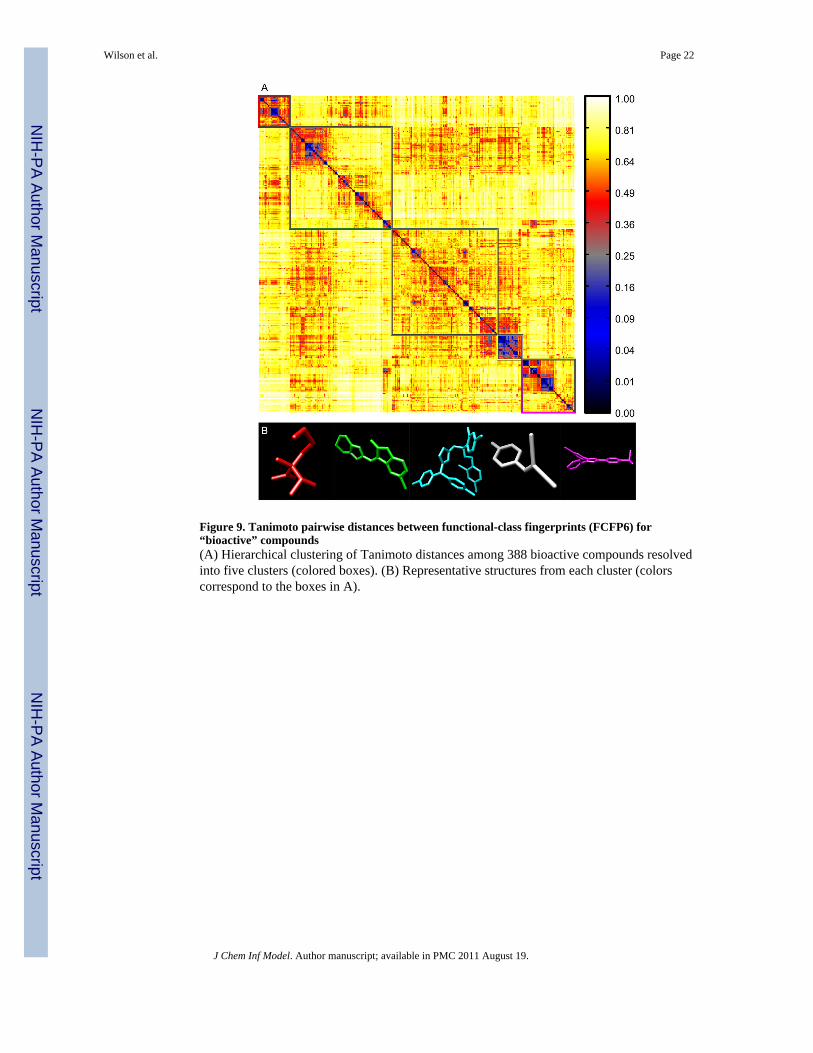
Figure 9. Tanimoto pairwise distances between functional-class fingerprints (FCFP6) for“bioactive” compounds(A) Hierarchical clustering of Tanimoto distances among 388 bioactive compounds resolvedinto five clusters (colored boxes). (B) Representative structures from each cluster (colorscorrespond to the boxes in A).
Wilson et al. Page 22
J Chem Inf Model. Author manuscript; available in PMC 2011 August 19.
NIH
-PA Author Manuscript
NIH
-PA Author Manuscript
NIH
-PA Author Manuscript

Figure 10. Comparison of three methods of calculating molecular shapeEach data point is a pairwise distance calculated by one method, plotted against the distancebetween the same pair of compounds calculated by an alternative method. Data werenormalized within each method and a linear regression plotted (black trace). (A) AJD vs.USR, (B) AJD vs. PMI, (C) PMI vs. USR.
Wilson et al. Page 23
J Chem Inf Model. Author manuscript; available in PMC 2011 August 19.
NIH
-PA Author Manuscript
NIH
-PA Author Manuscript
NIH
-PA Author Manuscript

Figure 11. Correlations between calculated molecular descriptors from MOE54 and alpha-shapepriorsDescriptors are sorted by total absolute value of spherical and flat correlation for eachdescriptor. Spherical (red circles) and flat (blue squares) prior similarities are correlated witheach descriptor.
Wilson et al. Page 24
J Chem Inf Model. Author manuscript; available in PMC 2011 August 19.
NIH
-PA Author Manuscript
NIH
-PA Author Manuscript
NIH
-PA Author Manuscript

NIH
-PA Author Manuscript
NIH
-PA Author Manuscript
NIH
-PA Author Manuscript
Wilson et al. Page 25
Table 1Statistics of method comparison for octane conformation dataset
Distances of data points to the linear regression (see Figure 10) were calculated. Statistics and slopes/intercepts of these distances are shown. Kurtosis shown is not relative to a Gaussian distribution.
Distance Statistic AJD v USR AJD v PMI PMI v USR
Intercept −0.0927 −0.2578 0.3026
Slope 1.0451 0.9819 0.7299
Mean Distance 0.0961 0.0979 0.1222
Median Distance 0.0888 0.0843 0.1152
STD Distance 0.0656 0.0738 0.0785
Kurtosis Distance 2.6858 4.0209 3.2227
J Chem Inf Model. Author manuscript; available in PMC 2011 August 19.

NIH
-PA Author Manuscript
NIH
-PA Author Manuscript
NIH
-PA Author Manuscript
Wilson et al. Page 26
Tabl
e 2
Stat
istic
s of m
etho
d co
mpa
riso
n fo
r bi
oact
ive
com
poun
d da
tase
t
Dis
tanc
es o
f dat
a po
ints
to a
line
ar re
gres
sion
wer
e ca
lcul
ated
. Sta
tistic
s and
slop
es/in
terc
epts
of t
hese
dis
tanc
es a
re sh
own.
Kur
tosi
s sho
wn
is n
ot re
lativ
eto
a G
auss
ian
dist
ribut
ion.
Dis
tanc
e St
atiq
1stic
AJD
v U
SRA
JD v
PM
IPM
I v U
SRA
JD v
Tan
iPM
I v T
ani
USR
v T
ani
Inte
rcep
t0.
6012
0.26
170.
5585
0.90
390.
9056
0.88
60
Slop
e0.
0706
0.14
630.
2013
0.03
490.
0226
0.04
26
Mea
n D
ista
nce
0.16
480.
1491
0.15
990.
0375
0.03
770.
0374
Med
ian
Dis
tanc
e0.
1490
0.13
590.
1464
0.02
900.
0289
0.02
87
STD
Dis
tanc
e0.
1094
0.10
400.
1050
0.04
590.
0460
0.04
56
Kur
tosi
s Dis
tanc
e2.
2025
4.33
712.
2251
64.2
661
64.0
175
63.5
884
J Chem Inf Model. Author manuscript; available in PMC 2011 August 19.

NIH
-PA Author Manuscript
NIH
-PA Author Manuscript
NIH
-PA Author Manuscript
Wilson et al. Page 27
Tabl
e 3
Com
pari
son
of A
JD-E
MD
and
USR
-bas
ed d
ista
nces
for
extr
eme
com
poun
d pa
irs
Four
ext
rem
e ca
ses a
re d
epic
ted:
bot
h m
etho
ds in
agr
eem
ent w
ith sm
all a
nd la
rge
dist
ance
s, an
d bo
th m
etho
ds in
dis
agre
emen
t with
one
larg
e an
d on
esm
all d
ista
nce.
Mol
ecul
ar g
raph
s of c
ompa
red
com
poun
ds, a
nd th
eir r
espe
ctiv
e A
JD a
nd U
SR d
ista
nces
are
show
n.
AJD
v U
SRC
ompo
und
1C
ompo
und
2A
JDU
SR
Smal
l AJD
v S
mal
l USR
0.00
090.
0006
Larg
e AJ
D v
Lar
ge U
SR1.
000
0.94
86
Larg
e AJ
D v
Sm
all U
SRs
0.84
300.
1746
Smal
l AJD
v L
arge
USR
0.04
080.
9909
J Chem Inf Model. Author manuscript; available in PMC 2011 August 19.